
Bank of America Corporation and Subsidiaries | |
Table of Contents | Page |
Consumer & Business Banking | |
Consumer Real Estate Services | |
Global Wealth & Investment Management | |
Global Banking | |
Global Markets | |
All Other | |
Bank of America Corporation and Subsidiaries | |||||||||||||||||||
Consolidated Financial Highlights | |||||||||||||||||||
(Dollars in millions, except per share information; shares in thousands) | |||||||||||||||||||
First Quarter 2014 | Fourth Quarter 2013 | Third Quarter 2013 | Second Quarter 2013 | First Quarter 2013 | |||||||||||||||
Income statement | |||||||||||||||||||
Net interest income | $ | 10,085 | $ | 10,786 | $ | 10,266 | $ | 10,549 | $ | 10,664 | |||||||||
Noninterest income | 12,481 | 10,702 | 11,264 | 12,178 | 12,533 | ||||||||||||||
Total revenue, net of interest expense | 22,566 | 21,488 | 21,530 | 22,727 | 23,197 | ||||||||||||||
Provision for credit losses | 1,009 | 336 | 296 | 1,211 | 1,713 | ||||||||||||||
Noninterest expense | 22,238 | 17,307 | 16,389 | 16,018 | 19,500 | ||||||||||||||
Income tax expense (benefit) | (405 | ) | 406 | 2,348 | 1,486 | 501 | |||||||||||||
Net income (loss) | (276 | ) | 3,439 | 2,497 | 4,012 | 1,483 | |||||||||||||
Preferred stock dividends | 238 | 256 | 279 | 441 | 373 | ||||||||||||||
Net income (loss) applicable to common shareholders | (514 | ) | 3,183 | 2,218 | 3,571 | 1,110 | |||||||||||||
Diluted earnings (loss) per common share (1) | (0.05 | ) | 0.29 | 0.20 | 0.32 | 0.10 | |||||||||||||
Average diluted common shares issued and outstanding (1) | 10,560,518 | 11,404,438 | 11,482,226 | 11,524,510 | 11,154,778 | ||||||||||||||
Dividends paid per common share | $ | 0.01 | $ | 0.01 | $ | 0.01 | $ | 0.01 | $ | 0.01 | |||||||||
Performance ratios | |||||||||||||||||||
Return on average assets | n/m | 0.64 | % | 0.47 | % | 0.74 | % | 0.27 | % | ||||||||||
Return on average common shareholders' equity | n/m | 5.74 | 4.06 | 6.55 | 2.06 | ||||||||||||||
Return on average tangible common shareholders' equity (2) | n/m | 8.61 | 6.15 | 9.88 | 3.12 | ||||||||||||||
Return on average tangible shareholders' equity (2) | n/m | 8.53 | 6.32 | 9.98 | 3.69 | ||||||||||||||
At period end | |||||||||||||||||||
Book value per share of common stock | $ | 20.75 | $ | 20.71 | $ | 20.50 | $ | 20.18 | $ | 20.19 | |||||||||
Tangible book value per share of common stock (2) | 13.81 | 13.79 | 13.62 | 13.32 | 13.36 | ||||||||||||||
Market price per share of common stock: | |||||||||||||||||||
Closing price | $ | 17.20 | $ | 15.57 | $ | 13.80 | $ | 12.86 | $ | 12.18 | |||||||||
High closing price for the period | 17.92 | 15.88 | 14.95 | 13.83 | 12.78 | ||||||||||||||
Low closing price for the period | 16.10 | 13.69 | 12.83 | 11.44 | 11.03 | ||||||||||||||
Market capitalization | 181,117 | 164,914 | 147,429 | 138,156 | 131,817 | ||||||||||||||
Number of banking centers - U.S. | 5,095 | 5,151 | 5,243 | 5,328 | 5,389 | ||||||||||||||
Number of branded ATMs - U.S. | 16,214 | 16,259 | 16,201 | 16,354 | 16,311 | ||||||||||||||
Full-time equivalent employees | 238,560 | 242,117 | 247,943 | 257,158 | 262,812 | ||||||||||||||
(1) | The diluted earnings (loss) per common share excludes the effect of any equity instruments that are antidilutive to earnings per share. The number of antidilutive equity instruments was higher in the first quarter of 2014 due to the net loss. |
(2) | Tangible equity ratios and tangible book value per share of common stock are non-GAAP financial measures. We believe the use of these non-GAAP financial measures provides additional clarity in assessing the results of the Corporation. Other companies may define or calculate non-GAAP financial measures differently. (See Exhibit A: Non-GAAP Reconciliations - Reconciliations to GAAP Financial Measures on pages 42-45.) |
This information is preliminary and based on company data available at the time of the presentation. | 2 |
Bank of America Corporation and Subsidiaries | |||||||||||||||||||
Supplemental Financial Data | |||||||||||||||||||
(Dollars in millions) | |||||||||||||||||||
Fully taxable-equivalent (FTE) basis data (1) | |||||||||||||||||||
First Quarter 2014 | Fourth Quarter 2013 | Third Quarter 2013 | Second Quarter 2013 | First Quarter 2013 | |||||||||||||||
Net interest income | $ | 10,286 | $ | 10,999 | $ | 10,479 | $ | 10,771 | $ | 10,875 | |||||||||
Total revenue, net of interest expense | 22,767 | 21,701 | 21,743 | 22,949 | 23,408 | ||||||||||||||
Net interest yield (2) | 2.29 | % | 2.44 | % | 2.33 | % | 2.35 | % | 2.36 | % | |||||||||
Efficiency ratio | 97.68 | 79.75 | 75.38 | 69.80 | 83.31 | ||||||||||||||
(1) | FTE basis is a non-GAAP financial measure. FTE basis is a performance measure used by management in operating the business that management believes provides investors with a more accurate picture of the interest margin for comparative purposes. (See Exhibit A: Non-GAAP Reconciliations - Reconciliations to GAAP Financial Measures on pages 42-45.) |
(2) | Beginning in the first quarter of 2014, interest-bearing deposits placed with the Federal Reserve and certain non-U.S. central banks are included in earning assets. Prior period yields have been reclassified to conform to current period presentation. |
This information is preliminary and based on company data available at the time of the presentation. | 3 |
Bank of America Corporation and Subsidiaries | |||||||||||||||||||
Consolidated Statement of Income | |||||||||||||||||||
(Dollars in millions, except per share information; shares in thousands) | |||||||||||||||||||
First Quarter 2014 | Fourth Quarter 2013 | Third Quarter 2013 | Second Quarter 2013 | First Quarter 2013 | |||||||||||||||
Interest income | |||||||||||||||||||
Loans and leases | $ | 8,760 | $ | 9,086 | $ | 9,146 | $ | 9,060 | $ | 9,178 | |||||||||
Debt securities | 1,997 | 2,447 | 2,205 | 2,548 | 2,549 | ||||||||||||||
Federal funds sold and securities borrowed or purchased under agreements to resell | 265 | 304 | 291 | 319 | 315 | ||||||||||||||
Trading account assets | 1,177 | 1,139 | 1,049 | 1,181 | 1,337 | ||||||||||||||
Other interest income | 736 | 736 | 691 | 717 | 722 | ||||||||||||||
Total interest income | 12,935 | 13,712 | 13,382 | 13,825 | 14,101 | ||||||||||||||
Interest expense | |||||||||||||||||||
Deposits | 291 | 314 | 334 | 366 | 382 | ||||||||||||||
Short-term borrowings | 609 | 682 | 683 | 809 | 749 | ||||||||||||||
Trading account liabilities | 435 | 364 | 375 | 427 | 472 | ||||||||||||||
Long-term debt | 1,515 | 1,566 | 1,724 | 1,674 | 1,834 | ||||||||||||||
Total interest expense | 2,850 | 2,926 | 3,116 | 3,276 | 3,437 | ||||||||||||||
Net interest income | 10,085 | 10,786 | 10,266 | 10,549 | 10,664 | ||||||||||||||
Noninterest income | |||||||||||||||||||
Card income | 1,393 | 1,503 | 1,444 | 1,469 | 1,410 | ||||||||||||||
Service charges | 1,826 | 1,870 | 1,884 | 1,837 | 1,799 | ||||||||||||||
Investment and brokerage services | 3,269 | 3,117 | 2,995 | 3,143 | 3,027 | ||||||||||||||
Investment banking income | 1,542 | 1,738 | 1,297 | 1,556 | 1,535 | ||||||||||||||
Equity investment income | 784 | 474 | 1,184 | 680 | 563 | ||||||||||||||
Trading account profits | 2,467 | 863 | 1,266 | 1,938 | 2,989 | ||||||||||||||
Mortgage banking income | 412 | 848 | 585 | 1,178 | 1,263 | ||||||||||||||
Gains on sales of debt securities | 377 | 390 | 356 | 457 | 68 | ||||||||||||||
Other income (loss) | 412 | (101 | ) | 260 | (76 | ) | (112 | ) | |||||||||||
Other-than-temporary impairment losses on available-for-sale debt securities: | |||||||||||||||||||
Total other-than-temporary impairment losses | (1 | ) | — | (8 | ) | (5 | ) | (14 | ) | ||||||||||
Less: Portion of other-than-temporary impairment losses recognized in other comprehensive income | — | — | 1 | 1 | 5 | ||||||||||||||
Net impairment losses recognized in earnings on available-for-sale debt securities | (1 | ) | — | (7 | ) | (4 | ) | (9 | ) | ||||||||||
Total noninterest income | 12,481 | 10,702 | 11,264 | 12,178 | 12,533 | ||||||||||||||
Total revenue, net of interest expense | 22,566 | 21,488 | 21,530 | 22,727 | 23,197 | ||||||||||||||
Provision for credit losses | 1,009 | 336 | 296 | 1,211 | 1,713 | ||||||||||||||
Noninterest expense | |||||||||||||||||||
Personnel | 9,749 | 7,987 | 8,310 | 8,531 | 9,891 | ||||||||||||||
Occupancy | 1,115 | 1,116 | 1,096 | 1,109 | 1,154 | ||||||||||||||
Equipment | 546 | 526 | 538 | 532 | 550 | ||||||||||||||
Marketing | 442 | 457 | 511 | 437 | 429 | ||||||||||||||
Professional fees | 558 | 839 | 702 | 694 | 649 | ||||||||||||||
Amortization of intangibles | 239 | 266 | 270 | 274 | 276 | ||||||||||||||
Data processing | 833 | 800 | 779 | 779 | 812 | ||||||||||||||
Telecommunications | 370 | 376 | 397 | 411 | 409 | ||||||||||||||
Other general operating | 8,386 | 4,940 | 3,786 | 3,251 | 5,330 | ||||||||||||||
Total noninterest expense | 22,238 | 17,307 | 16,389 | 16,018 | 19,500 | ||||||||||||||
Income (loss) before income taxes | (681 | ) | 3,845 | 4,845 | 5,498 | 1,984 | |||||||||||||
Income tax expense (benefit) | (405 | ) | 406 | 2,348 | 1,486 | 501 | |||||||||||||
Net income (loss) | $ | (276 | ) | $ | 3,439 | $ | 2,497 | $ | 4,012 | $ | 1,483 | ||||||||
Preferred stock dividends | 238 | 256 | 279 | 441 | 373 | ||||||||||||||
Net income (loss) applicable to common shareholders | $ | (514 | ) | $ | 3,183 | $ | 2,218 | $ | 3,571 | $ | 1,110 | ||||||||
Per common share information | |||||||||||||||||||
Earnings (loss) | $ | (0.05 | ) | $ | 0.30 | $ | 0.21 | $ | 0.33 | $ | 0.10 | ||||||||
Diluted earnings (loss) (1) | (0.05 | ) | 0.29 | 0.20 | 0.32 | 0.10 | |||||||||||||
Dividends paid | 0.01 | 0.01 | 0.01 | 0.01 | 0.01 | ||||||||||||||
Average common shares issued and outstanding | 10,560,518 | 10,633,030 | 10,718,918 | 10,775,867 | 10,798,975 | ||||||||||||||
Average diluted common shares issued and outstanding (1) | 10,560,518 | 11,404,438 | 11,482,226 | 11,524,510 | 11,154,778 | ||||||||||||||
(1) | The diluted earnings (loss) per common share excludes the effect of any equity instruments that are antidilutive to earnings per share. The number of antidilutive equity instruments was higher in the first quarter of 2014 due to the net loss. |
This information is preliminary and based on company data available at the time of the presentation. | 4 |
Bank of America Corporation and Subsidiaries | |||||||||||||||||||
Consolidated Statement of Comprehensive Income | |||||||||||||||||||
(Dollars in millions) | |||||||||||||||||||
First Quarter 2014 | Fourth Quarter 2013 | Third Quarter 2013 | Second Quarter 2013 | First Quarter 2013 | |||||||||||||||
Net income (loss) | $ | (276 | ) | $ | 3,439 | $ | 2,497 | $ | 4,012 | $ | 1,483 | ||||||||
Other comprehensive income (loss), net-of-tax: | |||||||||||||||||||
Net change in available-for-sale debt and marketable equity securities | 1,289 | (2,396 | ) | (631 | ) | (4,233 | ) | (906 | ) | ||||||||||
Net change in derivatives | 208 | 227 | 180 | 13 | 172 | ||||||||||||||
Employee benefit plan adjustments | 49 | 536 | 1,380 | 48 | 85 | ||||||||||||||
Net change in foreign currency translation adjustments | (126 | ) | (1 | ) | (43 | ) | (49 | ) | (42 | ) | |||||||||
Other comprehensive income (loss) | 1,420 | (1,634 | ) | 886 | (4,221 | ) | (691 | ) | |||||||||||
Comprehensive income (loss) | $ | 1,144 | $ | 1,805 | $ | 3,383 | $ | (209 | ) | $ | 792 | ||||||||
This information is preliminary and based on company data available at the time of the presentation. | 5 |
Bank of America Corporation and Subsidiaries | |||||||||||
Consolidated Balance Sheet | |||||||||||
(Dollars in millions) | |||||||||||
March 31 2014 | December 31 2013 | March 31 2013 | |||||||||
Assets | |||||||||||
Cash and due from banks | $ | 31,099 | $ | 36,852 | $ | 33,461 | |||||
Interest-bearing deposits with the Federal Reserve and non-U.S. central banks | 120,546 | 94,470 | 67,519 | ||||||||
Cash and cash equivalents | 151,645 | 131,322 | 100,980 | ||||||||
Time deposits placed and other short-term investments | 12,793 | 11,540 | 12,740 | ||||||||
Federal funds sold and securities borrowed or purchased under agreements to resell | 215,299 | 190,328 | 220,623 | ||||||||
Trading account assets | 195,949 | 200,993 | 223,028 | ||||||||
Derivative assets | 45,302 | 47,495 | 52,247 | ||||||||
Debt securities: | |||||||||||
Carried at fair value | 285,576 | 268,795 | 305,132 | ||||||||
Held-to-maturity, at cost | 55,120 | 55,150 | 49,577 | ||||||||
Total debt securities | 340,696 | 323,945 | 354,709 | ||||||||
Loans and leases | 916,217 | 928,233 | 911,592 | ||||||||
Allowance for loan and lease losses | (16,618 | ) | (17,428 | ) | (22,441 | ) | |||||
Loans and leases, net of allowance | 899,599 | 910,805 | 889,151 | ||||||||
Premises and equipment, net | 10,351 | 10,475 | 11,085 | ||||||||
Mortgage servicing rights (includes $4,765, $5,042 and $5,776 measured at fair value) | 4,765 | 5,052 | 5,896 | ||||||||
Goodwill | 69,842 | 69,844 | 69,930 | ||||||||
Intangible assets | 5,337 | 5,574 | 6,379 | ||||||||
Loans held-for-sale | 12,317 | 11,362 | 19,278 | ||||||||
Customer and other receivables | 64,135 | 59,448 | 70,981 | ||||||||
Other assets | 121,821 | 124,090 | 137,792 | ||||||||
Total assets | $ | 2,149,851 | $ | 2,102,273 | $ | 2,174,819 | |||||
Assets of consolidated variable interest entities included in total assets above (isolated to settle the liabilities of the variable interest entities) | |||||||||||
Trading account assets | $ | 8,052 | $ | 8,412 | $ | 9,113 | |||||
Derivative assets | 23 | 185 | 187 | ||||||||
Loans and leases | 104,556 | 109,118 | 116,236 | ||||||||
Allowance for loan and lease losses | (2,614 | ) | (2,674 | ) | (3,310 | ) | |||||
Loans and leases, net of allowance | 101,942 | 106,444 | 112,926 | ||||||||
Loans held-for-sale | 1,294 | 1,384 | 3,229 | ||||||||
All other assets | 3,970 | 4,577 | 4,728 | ||||||||
Total assets of consolidated variable interest entities | $ | 115,281 | $ | 121,002 | $ | 130,183 | |||||
This information is preliminary and based on company data available at the time of the presentation. | 6 |
Bank of America Corporation and Subsidiaries | |||||||||||
Consolidated Balance Sheet (continued) | |||||||||||
(Dollars in millions) | |||||||||||
March 31 2014 | December 31 2013 | March 31 2013 | |||||||||
Liabilities | |||||||||||
Deposits in U.S. offices: | |||||||||||
Noninterest-bearing | $ | 375,196 | $ | 373,084 | $ | 357,635 | |||||
Interest-bearing | 676,328 | 667,714 | 661,930 | ||||||||
Deposits in non-U.S. offices: | |||||||||||
Noninterest-bearing | 9,050 | 8,241 | 7,165 | ||||||||
Interest-bearing | 73,076 | 70,232 | 68,453 | ||||||||
Total deposits | 1,133,650 | 1,119,271 | 1,095,183 | ||||||||
Federal funds purchased and securities loaned or sold under agreements to repurchase | 203,108 | 198,106 | 248,149 | ||||||||
Trading account liabilities | 89,076 | 83,469 | 90,547 | ||||||||
Derivative liabilities | 36,911 | 37,407 | 47,825 | ||||||||
Short-term borrowings | 51,409 | 45,999 | 42,148 | ||||||||
Accrued expenses and other liabilities (includes $509, $484 and $486 of reserve for unfunded lending commitments) | 149,024 | 135,662 | 134,033 | ||||||||
Long-term debt | 254,785 | 249,674 | 279,641 | ||||||||
Total liabilities | 1,917,963 | 1,869,588 | 1,937,526 | ||||||||
Shareholders' equity | |||||||||||
Preferred stock, $0.01 par value; authorized – 100,000,000 shares; issued and outstanding – 3,407,790, 3,407,790 and 3,685,410 shares | 13,352 | 13,352 | 18,780 | ||||||||
Common stock and additional paid-in capital, $0.01 par value; authorized – 12,800,000,000 shares; issued and outstanding – 10,530,045,485, 10,591,808,296 and 10,822,379,936 shares | 153,696 | 155,293 | 158,157 | ||||||||
Retained earnings | 71,877 | 72,497 | 63,844 | ||||||||
Accumulated other comprehensive income (loss) | (7,037 | ) | (8,457 | ) | (3,488 | ) | |||||
Total shareholders' equity | 231,888 | 232,685 | 237,293 | ||||||||
Total liabilities and shareholders' equity | $ | 2,149,851 | $ | 2,102,273 | $ | 2,174,819 | |||||
Liabilities of consolidated variable interest entities included in total liabilities above | |||||||||||
Short-term borrowings | $ | 1,176 | $ | 1,150 | $ | 2,539 | |||||
Long-term debt | 18,338 | 19,448 | 31,461 | ||||||||
All other liabilities | 179 | 253 | 345 | ||||||||
Total liabilities of consolidated variable interest entities | $ | 19,693 | $ | 20,851 | $ | 34,345 | |||||
This information is preliminary and based on company data available at the time of the presentation. | 7 |
Bank of America Corporation and Subsidiaries | ||||||||||||||||||||
Capital Management | ||||||||||||||||||||
(Dollars in millions) | ||||||||||||||||||||
Basel 3 Transition | Basel 1 | |||||||||||||||||||
March 31 2014 | December 31 2013 | September 30 2013 | June 30 2013 | March 31 2013 | ||||||||||||||||
Risk-based capital metrics (1, 2): | ||||||||||||||||||||
Common equity tier 1 capital (3) | $ | 151,642 | n/a | n/a | n/a | n/a | ||||||||||||||
Tier 1 common capital | n/a | $ | 145,235 | $ | 142,825 | $ | 139,519 | $ | 136,119 | |||||||||||
Tier 1 capital | 155,674 | 161,456 | 159,008 | 156,689 | 158,677 | |||||||||||||||
Total capital | 192,867 | 200,281 | 198,001 | 196,752 | 201,211 | |||||||||||||||
Risk-weighted assets (3) | 1,282,492 | 1,297,534 | 1,289,444 | 1,288,159 | 1,298,187 | |||||||||||||||
Common equity tier 1 capital ratio | 11.8 | % | n/a | n/a | n/a | n/a | ||||||||||||||
Tier 1 common capital ratio (4) | n/a | 11.2 | % | 11.1 | % | 10.8 | % | 10.5 | % | |||||||||||
Tier 1 capital ratio | 12.1 | 12.4 | 12.3 | 12.2 | 12.2 | |||||||||||||||
Total capital ratio | 15.0 | 15.4 | 15.4 | 15.3 | 15.5 | |||||||||||||||
Tier 1 leverage ratio | 7.6 | 7.9 | 7.8 | 7.5 | 7.5 | |||||||||||||||
Tangible equity ratio (5) | 7.65 | 7.86 | 7.73 | 7.67 | 7.78 | |||||||||||||||
Tangible common equity ratio (5) | 7.00 | 7.20 | 7.08 | 6.98 | 6.88 | |||||||||||||||
(1) | Regulatory capital ratios are preliminary until filed with the Federal Reserve on Form Y-9C. |
(2) | On January 1, 2014, the Basel 3 rules became effective, subject to transition provisions primarily related to regulatory deductions and adjustments impacting common equity tier 1 capital and Tier 1 capital. We reported under Basel 1 (which included the Market Risk Final Rules) at December 31, 2013, September 30, 2013, June 30, 2013 and March 31, 2013. |
(3) | On a pro-forma basis, under the transition provisions for the Basel 3 Standardized approach (Basel 3 Standardized transition), fourth quarter 2013 common equity tier 1 capital and risk-weighted assets would have been $153,502 million and $1,315,994 million. |
(4) | Tier 1 common capital ratio equals Tier 1 capital excluding preferred stock, trust preferred securities, hybrid securities and minority interest divided by risk-weighted assets. |
(5) | Tangible equity ratio equals period-end tangible shareholders' equity divided by period-end tangible assets. Tangible common equity ratio equals period-end tangible common shareholders' equity divided by period-end tangible assets. Tangible shareholders' equity and tangible assets are non-GAAP financial measures. We believe the use of these non-GAAP financial measures provides additional clarity in assessing the results of the Corporation. Other companies may define or calculate non-GAAP financial measures differently. (See Exhibit A: Non-GAAP Reconciliations - Reconciliation to GAAP Financial Measures on pages 42-45.) |
This information is preliminary and based on company data available at the time of the presentation. | 8 |
Bank of America Corporation and Subsidiaries | |||||||||||||||||||
Regulatory Capital Reconciliations (1, 2) | |||||||||||||||||||
(Dollars in millions) | |||||||||||||||||||
December 31 2013 | September 30 2013 | June 30 2013 | March 31 2013 | ||||||||||||||||
Regulatory capital – Basel 1 to Basel 3 (fully phased-in) | |||||||||||||||||||
Basel 1 Tier 1 capital | $ | 161,456 | $ | 159,008 | $ | 156,689 | $ | 158,677 | |||||||||||
Deduction of qualifying preferred stock and trust preferred securities | (16,221 | ) | (16,183 | ) | (17,170 | ) | (22,558 | ) | |||||||||||
Basel 1 Tier 1 common capital | 145,235 | 142,825 | 139,519 | 136,119 | |||||||||||||||
Deduction of defined benefit pension assets | (829 | ) | (935 | ) | (787 | ) | (776 | ) | |||||||||||
Deferred tax assets and threshold deductions (deferred tax asset temporary differences, MSRs and significant investments) | (4,803 | ) | (4,758 | ) | (6,761 | ) | (4,501 | ) | |||||||||||
Net unrealized losses in accumulated OCI on AFS debt and certain marketable equity securities, and employee benefit plans | (5,668 | ) | (3,808 | ) | (4,557 | ) | (372 | ) | |||||||||||
Other deductions, net | (1,620 | ) | (1,511 | ) | (1,568 | ) | (1,660 | ) | |||||||||||
Basel 3 common equity tier 1 capital (fully phased-in) | $ | 132,315 | $ | 131,813 | $ | 125,846 | $ | 128,810 | |||||||||||
March 31 2014 | |||||||||||||||||||
Regulatory capital – Basel 3 transition to fully phased-in | |||||||||||||||||||
Common equity tier 1 capital (transition) | $ | 151,642 | |||||||||||||||||
Adjustments and deductions recognized in Tier 1 capital during transition | (9,284 | ) | |||||||||||||||||
Other adjustments and deductions phased in during transition | (8,197 | ) | |||||||||||||||||
Common equity tier 1 capital (fully phased-in) | $ | 134,161 | |||||||||||||||||
March 31 2014 | December 31 2013 | September 30 2013 | June 30 2013 | March 31 2013 | |||||||||||||||
Risk-weighted assets – As reported to Basel 3 (fully phased-in) | |||||||||||||||||||
As reported risk weighted assets | $ | 1,282,492 | $ | 1,297,534 | $ | 1,289,444 | $ | 1,288,159 | $ | 1,298,187 | |||||||||
Change in risk-weighted assets from reported to fully phased-in | 165,596 | 164,449 | |||||||||||||||||
Basel 3 Standardized approach risk-weighted assets (fully phased-in) | 1,448,088 | 1,461,983 | |||||||||||||||||
Change in risk-weighted assets for advanced models | (86,201 | ) | (132,939 | ) | 37,140 | 22,276 | 55,454 | ||||||||||||
Basel 3 Advanced approaches risk-weighted assets (fully phased-in) | $ | 1,361,887 | $ | 1,329,044 | $ | 1,326,584 | $ | 1,310,435 | $ | 1,353,641 | |||||||||
Regulatory capital ratios | |||||||||||||||||||
Basel 1 Tier 1 common | n/a | 11.2 | % | 11.1 | % | 10.8 | % | 10.5 | % | ||||||||||
Basel 3 Standardized approach common equity tier 1 (transition) | 11.8 | % | n/a | n/a | n/a | n/a | |||||||||||||
Basel 3 Standardized approach common equity tier 1 (fully phased-in) | 9.3 | 9.1 | n/a | n/a | n/a | ||||||||||||||
Basel 3 Advanced approaches common equity tier 1 (fully phased-in) | 9.9 | 10.0 | 9.9 | 9.6 | 9.5 | ||||||||||||||
(1) | Based on the Basel 3 Advanced approaches, assuming all regulatory model approvals, except for the potential reduction to risk-weighted assets resulting from the removal of the Comprehensive Risk Measure surcharge. |
(2) | On January 1, 2014, the Basel 3 rules became effective, subject to transition provisions primarily related to regulatory deductions and adjustments impacting common equity tier 1 capital and Tier 1 capital. We reported under Basel 1 (which included the Market Risk Final Rules) at December 31, 2013, September 30, 2013, June 30, 2013 and March 31, 2013. |
This information is preliminary and based on company data available at the time of the presentation. | 9 |
Bank of America Corporation and Subsidiaries | |||||||||||||||||||
Net Interest Income Excluding Trading-related Net Interest Income | |||||||||||||||||||
(Dollars in millions) | |||||||||||||||||||
First Quarter 2014 | Fourth Quarter 2013 | Third Quarter 2013 | Second Quarter 2013 | First Quarter 2013 | |||||||||||||||
Net interest income (FTE basis) | |||||||||||||||||||
As reported | $ | 10,286 | $ | 10,999 | $ | 10,479 | $ | 10,771 | $ | 10,875 | |||||||||
Impact of trading-related net interest income | (903 | ) | (1,051 | ) | (888 | ) | (919 | ) | (1,010 | ) | |||||||||
Net interest income excluding trading-related net interest income (1) | $ | 9,383 | $ | 9,948 | $ | 9,591 | $ | 9,852 | $ | 9,865 | |||||||||
Average earning assets (2) | |||||||||||||||||||
As reported | $ | 1,803,298 | $ | 1,798,697 | $ | 1,789,045 | $ | 1,833,541 | $ | 1,857,894 | |||||||||
Impact of trading-related earning assets | (442,732 | ) | (445,725 | ) | (446,212 | ) | (487,345 | ) | (497,730 | ) | |||||||||
Average earning assets excluding trading-related earning assets (1) | $ | 1,360,566 | $ | 1,352,972 | $ | 1,342,833 | $ | 1,346,196 | $ | 1,360,164 | |||||||||
Net interest yield contribution (FTE basis) (2, 3) | |||||||||||||||||||
As reported | 2.29 | % | 2.44 | % | 2.33 | % | 2.35 | % | 2.36 | % | |||||||||
Impact of trading-related activities | 0.48 | 0.49 | 0.51 | 0.58 | 0.56 | ||||||||||||||
Net interest yield on earning assets excluding trading-related activities (1) | 2.77 | % | 2.93 | % | 2.84 | % | 2.93 | % | 2.92 | % | |||||||||
(1) | Represents a non-GAAP financial measure. |
(2) | Beginning in the first quarter of 2014, interest-bearing deposits placed with the Federal Reserve and certain non-U.S. central banks are included in earning assets. In prior periods, these balances were included with cash and due from banks in the cash and cash equivalents line, consistent with the Consolidated Balance Sheet presentation. Prior periods have been reclassified to conform to current period presentation. |
(3) | Calculated on an annualized basis. |
This information is preliminary and based on company data available at the time of the presentation. | 10 |
Bank of America Corporation and Subsidiaries | |||||||||||||||||||||||||||||||||||
Quarterly Average Balances and Interest Rates – Fully Taxable-equivalent Basis | |||||||||||||||||||||||||||||||||||
(Dollars in millions) | |||||||||||||||||||||||||||||||||||
First Quarter 2014 | Fourth Quarter 2013 | First Quarter 2013 | |||||||||||||||||||||||||||||||||
Average Balance | Interest Income/ Expense | Yield/ Rate | Average Balance | Interest Income/ Expense | Yield/ Rate | Average Balance | Interest Income/ Expense | Yield/ Rate | |||||||||||||||||||||||||||
Earning assets | |||||||||||||||||||||||||||||||||||
Interest-bearing deposits with the Federal Reserve and non-U.S. central banks (1) | $ | 112,570 | $ | 72 | 0.26 | % | $ | 90,196 | $ | 59 | 0.26 | % | $ | 57,108 | $ | 33 | 0.23 | % | |||||||||||||||||
Time deposits placed and other short-term investments | 13,880 | 49 | 1.43 | 15,782 | 48 | 1.21 | 16,129 | 46 | 1.17 | ||||||||||||||||||||||||||
Federal funds sold and securities borrowed or purchased under agreements to resell | 212,504 | 265 | 0.51 | 203,415 | 304 | 0.59 | 237,463 | 315 | 0.54 | ||||||||||||||||||||||||||
Trading account assets | 147,583 | 1,213 | 3.32 | 156,194 | 1,182 | 3.01 | 194,364 | 1,380 | 2.87 | ||||||||||||||||||||||||||
Debt securities (2) | 329,711 | 2,005 | 2.41 | 325,119 | 2,455 | 3.02 | 356,399 | 2,556 | 2.87 | ||||||||||||||||||||||||||
Loans and leases (3): | |||||||||||||||||||||||||||||||||||
Residential mortgage | 247,556 | 2,240 | 3.62 | 253,974 | 2,374 | 3.74 | 258,630 | 2,340 | 3.62 | ||||||||||||||||||||||||||
Home equity | 92,759 | 851 | 3.71 | 95,388 | 953 | 3.97 | 105,939 | 997 | 3.80 | ||||||||||||||||||||||||||
U.S. credit card | 89,545 | 2,092 | 9.48 | 90,057 | 2,125 | 9.36 | 91,712 | 2,249 | 9.95 | ||||||||||||||||||||||||||
Non-U.S. credit card | 11,554 | 308 | 10.79 | 11,171 | 310 | 11.01 | 11,027 | 329 | 12.10 | ||||||||||||||||||||||||||
Direct/Indirect consumer | 81,728 | 530 | 2.63 | 82,990 | 565 | 2.70 | 82,364 | 620 | 3.06 | ||||||||||||||||||||||||||
Other consumer | 1,962 | 18 | 3.66 | 1,929 | 17 | 3.73 | 1,666 | 19 | 4.36 | ||||||||||||||||||||||||||
Total consumer | 525,104 | 6,039 | 4.64 | 535,509 | 6,344 | 4.72 | 551,338 | 6,554 | 4.79 | ||||||||||||||||||||||||||
U.S. commercial | 228,058 | 1,651 | 2.93 | 225,596 | 1,700 | 2.99 | 210,706 | 1,666 | 3.20 | ||||||||||||||||||||||||||
Commercial real estate | 48,753 | 368 | 3.06 | 46,341 | 374 | 3.20 | 39,179 | 326 | 3.38 | ||||||||||||||||||||||||||
Commercial lease financing | 24,727 | 234 | 3.78 | 24,468 | 206 | 3.37 | 23,534 | 236 | 4.01 | ||||||||||||||||||||||||||
Non-U.S. commercial | 92,840 | 543 | 2.37 | 97,863 | 544 | 2.20 | 81,502 | 467 | 2.32 | ||||||||||||||||||||||||||
Total commercial | 394,378 | 2,796 | 2.87 | 394,268 | 2,824 | 2.84 | 354,921 | 2,695 | 3.07 | ||||||||||||||||||||||||||
Total loans and leases | 919,482 | 8,835 | 3.88 | 929,777 | 9,168 | 3.92 | 906,259 | 9,249 | 4.12 | ||||||||||||||||||||||||||
Other earning assets | 67,568 | 697 | 4.18 | 78,214 | 709 | 3.61 | 90,172 | 733 | 3.29 | ||||||||||||||||||||||||||
Total earning assets (4) | 1,803,298 | 13,136 | 2.93 | 1,798,697 | 13,925 | 3.08 | 1,857,894 | 14,312 | 3.11 | ||||||||||||||||||||||||||
Cash and due from banks (1) | 28,258 | 35,063 | 35,738 | ||||||||||||||||||||||||||||||||
Other assets, less allowance for loan and lease losses | 307,710 | 301,115 | 318,798 | ||||||||||||||||||||||||||||||||
Total assets | $ | 2,139,266 | $ | 2,134,875 | $ | 2,212,430 | |||||||||||||||||||||||||||||
(1) | Beginning in the first quarter of 2014, interest-bearing deposits placed with the Federal Reserve and certain non-U.S. central banks are included in earning assets. In prior periods, these balances were included in the cash and cash equivalents line, consistent with the Consolidated Balance Sheet presentation. Prior periods have been reclassified to conform to current period presentation. |
(2) | Beginning in the first quarter of 2014, yields on debt securities carried at fair value are calculated on the cost basis. Prior to the first quarter of 2014, yields on debt securities carried at fair value were calculated based on fair value rather than the cost basis. The use of fair value did not have a material impact on net interest yield. |
(3) | Nonperforming loans are included in the respective average loan balances. Income on these nonperforming loans is generally recognized on a cost recovery basis. Purchased credit-impaired loans were recorded at fair value upon acquisition and accrete interest income over the remaining life of the loan. |
(4) | The impact of interest rate risk management derivatives on interest income is presented below. Interest income includes the impact of interest rate risk management contracts, which increased (decreased) interest income on: |
First Quarter 2014 | Fourth Quarter 2013 | First Quarter 2013 | ||||||||||||||||||||||||
Federal funds sold and securities borrowed or purchased under agreements to resell | $ | 13 | $ | 15 | $ | 11 | ||||||||||||||||||||
Debt securities | (2 | ) | (1 | ) | (122 | ) | ||||||||||||||||||||
U.S. commercial | (16 | ) | (14 | ) | (29 | ) | ||||||||||||||||||||
Non-U.S. commercial | — | — | (1 | ) | ||||||||||||||||||||||
Net hedge expenses on assets | $ | (5 | ) | $ | — | $ | (141 | ) | ||||||||||||||||||
This information is preliminary and based on company data available at the time of the presentation. | 11 |
Bank of America Corporation and Subsidiaries | |||||||||||||||||||||||||||||||||||
Quarterly Average Balances and Interest Rates – Fully Taxable-equivalent Basis (continued) | |||||||||||||||||||||||||||||||||||
(Dollars in millions) | |||||||||||||||||||||||||||||||||||
First Quarter 2014 | Fourth Quarter 2013 | First Quarter 2013 | |||||||||||||||||||||||||||||||||
Average Balance | Interest Income/ Expense | Yield/ Rate | Average Balance | Interest Income/ Expense | Yield/ Rate | Average Balance | Interest Income/ Expense | Yield/ Rate | |||||||||||||||||||||||||||
Interest-bearing liabilities | |||||||||||||||||||||||||||||||||||
U.S. interest-bearing deposits: | |||||||||||||||||||||||||||||||||||
Savings | $ | 45,196 | $ | 1 | 0.01 | % | $ | 43,665 | $ | 5 | 0.05 | % | $ | 42,934 | $ | 6 | 0.05 | % | |||||||||||||||||
NOW and money market deposit accounts | 523,237 | 83 | 0.06 | 514,220 | 89 | 0.07 | 501,177 | 117 | 0.09 | ||||||||||||||||||||||||||
Consumer CDs and IRAs | 71,141 | 84 | 0.48 | 74,635 | 96 | 0.51 | 85,109 | 135 | 0.64 | ||||||||||||||||||||||||||
Negotiable CDs, public funds and other deposits | 29,826 | 27 | 0.37 | 29,060 | 29 | 0.39 | 24,147 | 29 | 0.50 | ||||||||||||||||||||||||||
Total U.S. interest-bearing deposits | 669,400 | 195 | 0.12 | 661,580 | 219 | 0.13 | 653,367 | 287 | 0.18 | ||||||||||||||||||||||||||
Non-U.S. interest-bearing deposits: | |||||||||||||||||||||||||||||||||||
Banks located in non-U.S. countries | 11,058 | 20 | 0.74 | 13,902 | 22 | 0.62 | 12,163 | 21 | 0.71 | ||||||||||||||||||||||||||
Governments and official institutions | 1,857 | 1 | 0.14 | 1,750 | 1 | 0.18 | 1,546 | 1 | 0.17 | ||||||||||||||||||||||||||
Time, savings and other | 60,519 | 75 | 0.50 | 58,513 | 72 | 0.49 | 53,944 | 73 | 0.55 | ||||||||||||||||||||||||||
Total non-U.S. interest-bearing deposits | 73,434 | 96 | 0.53 | 74,165 | 95 | 0.51 | 67,653 | 95 | 0.57 | ||||||||||||||||||||||||||
Total interest-bearing deposits | 742,834 | 291 | 0.16 | 735,745 | 314 | 0.17 | 721,020 | 382 | 0.22 | ||||||||||||||||||||||||||
Federal funds purchased, securities loaned or sold under agreements to repurchase and short-term borrowings | 252,971 | 609 | 0.98 | 271,538 | 682 | 1.00 | 337,644 | 749 | 0.90 | ||||||||||||||||||||||||||
Trading account liabilities | 90,448 | 435 | 1.95 | 82,393 | 364 | 1.75 | 92,047 | 472 | 2.08 | ||||||||||||||||||||||||||
Long-term debt | 253,678 | 1,515 | 2.41 | 251,055 | 1,566 | 2.48 | 273,999 | 1,834 | 2.70 | ||||||||||||||||||||||||||
Total interest-bearing liabilities (1) | 1,339,931 | 2,850 | 0.86 | 1,340,731 | 2,926 | 0.87 | 1,424,710 | 3,437 | 0.98 | ||||||||||||||||||||||||||
Noninterest-bearing sources: | |||||||||||||||||||||||||||||||||||
Noninterest-bearing deposits | 375,344 | 376,929 | 354,260 | ||||||||||||||||||||||||||||||||
Other liabilities | 187,438 | 183,800 | 196,465 | ||||||||||||||||||||||||||||||||
Shareholders’ equity | 236,553 | 233,415 | 236,995 | ||||||||||||||||||||||||||||||||
Total liabilities and shareholders’ equity | $ | 2,139,266 | $ | 2,134,875 | $ | 2,212,430 | |||||||||||||||||||||||||||||
Net interest spread | 2.07 | % | 2.21 | % | 2.13 | % | |||||||||||||||||||||||||||||
Impact of noninterest-bearing sources | 0.22 | 0.23 | 0.23 | ||||||||||||||||||||||||||||||||
Net interest income/yield on earning assets | $ | 10,286 | 2.29 | % | $ | 10,999 | 2.44 | % | $ | 10,875 | 2.36 | % | |||||||||||||||||||||||
(1) | The impact of interest rate risk management derivatives on interest expense is presented below. Interest expense includes the impact of interest rate risk management contracts, which increased (decreased) interest expense on: |
First Quarter 2014 | Fourth Quarter 2013 | First Quarter 2013 | ||||||||||||||||||||||||
Consumer CDs and IRAs | $ | 20 | $ | 20 | $ | 13 | ||||||||||||||||||||
Negotiable CDs, public funds and other deposits | 3 | 3 | 3 | |||||||||||||||||||||||
Banks located in non-U.S. countries | 3 | 4 | 3 | |||||||||||||||||||||||
Federal funds purchased, securities loaned or sold under agreements to repurchase and short-term borrowings | 257 | 260 | 260 | |||||||||||||||||||||||
Long-term debt | (875 | ) | (875 | ) | (897 | ) | ||||||||||||||||||||
Net hedge income on liabilities | $ | (592 | ) | $ | (588 | ) | $ | (618 | ) | |||||||||||||||||
This information is preliminary and based on company data available at the time of the presentation. | 12 |
Bank of America Corporation and Subsidiaries | |||||||||||||||
Debt Securities and Available-for-Sale Marketable Equity Securities | |||||||||||||||
(Dollars in millions) | |||||||||||||||
March 31, 2014 | |||||||||||||||
Amortized Cost | Gross Unrealized Gains | Gross Unrealized Losses | Fair Value | ||||||||||||
Available-for-sale debt securities | |||||||||||||||
U.S. Treasury and agency securities | $ | 29,580 | $ | 108 | $ | (121 | ) | $ | 29,567 | ||||||
Mortgage-backed securities: | |||||||||||||||
Agency | 169,216 | 830 | (4,299 | ) | 165,747 | ||||||||||
Agency-collateralized mortgage obligations | 18,464 | 217 | (109 | ) | 18,572 | ||||||||||
Non-agency residential | 5,111 | 244 | (97 | ) | 5,258 | ||||||||||
Commercial | 1,713 | 26 | (5 | ) | 1,734 | ||||||||||
Non-U.S. securities | 7,109 | 31 | (18 | ) | 7,122 | ||||||||||
Corporate/Agency bonds | 831 | 18 | (4 | ) | 845 | ||||||||||
Other taxable securities, substantially all asset-backed securities | 14,695 | 42 | (15 | ) | 14,722 | ||||||||||
Total taxable securities | 246,719 | 1,516 | (4,668 | ) | 243,567 | ||||||||||
Tax-exempt securities | 6,443 | 4 | (33 | ) | 6,414 | ||||||||||
Total available-for-sale debt securities | 253,162 | 1,520 | (4,701 | ) | 249,981 | ||||||||||
Other debt securities carried at fair value | 36,453 | 82 | (940 | ) | 35,595 | ||||||||||
Total debt securities carried at fair value | 289,615 | 1,602 | (5,641 | ) | 285,576 | ||||||||||
Held-to-maturity debt securities, substantially all U.S. agency mortgage-backed securities | 55,120 | 50 | (2,064 | ) | 53,106 | ||||||||||
Total debt securities | $ | 344,735 | $ | 1,652 | $ | (7,705 | ) | $ | 338,682 | ||||||
Available-for-sale marketable equity securities (1) | $ | 236 | $ | — | $ | (20 | ) | $ | 216 | ||||||
December 31, 2013 | |||||||||||||||
Available-for-sale debt securities | |||||||||||||||
U.S. Treasury and agency securities | $ | 8,910 | $ | 106 | $ | (62 | ) | $ | 8,954 | ||||||
Mortgage-backed securities: | |||||||||||||||
Agency | 170,112 | 777 | (5,954 | ) | 164,935 | ||||||||||
Agency-collateralized mortgage obligations | 22,731 | 76 | (315 | ) | 22,492 | ||||||||||
Non-agency residential | 6,124 | 238 | (123 | ) | 6,239 | ||||||||||
Commercial | 2,429 | 63 | (12 | ) | 2,480 | ||||||||||
Non-U.S. securities | 7,207 | 37 | (24 | ) | 7,220 | ||||||||||
Corporate/Agency bonds | 860 | 20 | (7 | ) | 873 | ||||||||||
Other taxable securities, substantially all asset-backed securities | 16,805 | 30 | (5 | ) | 16,830 | ||||||||||
Total taxable securities | 235,178 | 1,347 | (6,502 | ) | 230,023 | ||||||||||
Tax-exempt securities | 5,967 | 10 | (49 | ) | 5,928 | ||||||||||
Total available-for-sale debt securities | 241,145 | 1,357 | (6,551 | ) | 235,951 | ||||||||||
Other debt securities carried at fair value | 34,145 | 34 | (1,335 | ) | 32,844 | ||||||||||
Total debt securities carried at fair value | 275,290 | 1,391 | (7,886 | ) | 268,795 | ||||||||||
Held-to-maturity debt securities, substantially all U.S. agency mortgage-backed securities | 55,150 | 20 | (2,740 | ) | 52,430 | ||||||||||
Total debt securities | $ | 330,440 | $ | 1,411 | $ | (10,626 | ) | $ | 321,225 | ||||||
Available-for-sale marketable equity securities (1) | $ | 230 | $ | — | $ | (7 | ) | $ | 223 | ||||||
(1) | Classified in other assets on the Consolidated Balance Sheet. |
Other Debt Securities Carried at Fair Value | |||||||
(Dollars in millions) | March 31 2014 | December 31 2013 | |||||
U.S. Treasury and agency securities | $ | 4,182 | $ | 4,062 | |||
Mortgage-backed securities: | |||||||
Agency | 16,290 | 16,500 | |||||
Agency-collateralized mortgage obligations | 123 | 218 | |||||
Commercial | 770 | 749 | |||||
Non-U.S. securities (1) | 14,230 | 11,315 | |||||
Total | $ | 35,595 | $ | 32,844 | |||
(1) | These securities are primarily used to satisfy certain international regulatory liquidity requirements. |
This information is preliminary and based on company data available at the time of the presentation. | 13 |
Bank of America Corporation and Subsidiaries | |||||||||||||||||||||||||||||
Quarterly Results by Business Segment | |||||||||||||||||||||||||||||
(Dollars in millions) | |||||||||||||||||||||||||||||
First Quarter 2014 | |||||||||||||||||||||||||||||
Total Corporation | Consumer & Business Banking | Consumer Real Estate Services | GWIM | Global Banking | Global Markets | All Other | |||||||||||||||||||||||
Net interest income (FTE basis) | $ | 10,286 | $ | 4,951 | $ | 701 | $ | 1,485 | $ | 2,301 | $ | 1,000 | $ | (152 | ) | ||||||||||||||
Noninterest income | 12,481 | 2,487 | 491 | 3,062 | 1,968 | 4,015 | 458 | ||||||||||||||||||||||
Total revenue, net of interest expense (FTE basis) | 22,767 | 7,438 | 1,192 | 4,547 | 4,269 | 5,015 | 306 | ||||||||||||||||||||||
Provision for credit losses | 1,009 | 812 | 25 | 23 | 265 | 19 | (135 | ) | |||||||||||||||||||||
Noninterest expense | 22,238 | 3,975 | 8,129 | 3,359 | 2,028 | 3,078 | 1,669 | ||||||||||||||||||||||
Income (loss) before income taxes | (480 | ) | 2,651 | (6,962 | ) | 1,165 | 1,976 | 1,918 | (1,228 | ) | |||||||||||||||||||
Income tax expense (benefit) (FTE basis) | (204 | ) | 993 | (1,935 | ) | 436 | 740 | 608 | (1,046 | ) | |||||||||||||||||||
Net income (loss) | $ | (276 | ) | $ | 1,658 | $ | (5,027 | ) | $ | 729 | $ | 1,236 | $ | 1,310 | $ | (182 | ) | ||||||||||||
Average | |||||||||||||||||||||||||||||
Total loans and leases | $ | 919,482 | $ | 162,042 | $ | 88,914 | $ | 115,945 | $ | 271,475 | $ | 63,696 | $ | 217,410 | |||||||||||||||
Total assets (1) | 2,139,266 | 595,549 | 110,564 | 273,080 | 392,991 | 601,541 | 165,541 | ||||||||||||||||||||||
Total deposits | 1,118,178 | 534,576 | n/m | 242,792 | 256,349 | n/m | 34,152 | ||||||||||||||||||||||
Period end | |||||||||||||||||||||||||||||
Total loans and leases | $ | 916,217 | $ | 160,116 | $ | 88,355 | $ | 116,482 | $ | 273,239 | $ | 64,598 | $ | 213,427 | |||||||||||||||
Total assets (1) | 2,149,851 | 613,244 | 112,264 | 274,234 | 396,952 | 594,936 | 158,221 | ||||||||||||||||||||||
Total deposits | 1,133,650 | 552,256 | n/m | 244,051 | 257,437 | n/m | 32,403 | ||||||||||||||||||||||
Fourth Quarter 2013 | |||||||||||||||||||||||||||||
Total Corporation | Consumer & Business Banking | Consumer Real Estate Services | GWIM | Global Banking | Global Markets | All Other | |||||||||||||||||||||||
Net interest income (FTE basis) | $ | 10,999 | $ | 4,948 | $ | 716 | $ | 1,485 | $ | 2,301 | $ | 1,143 | $ | 406 | |||||||||||||||
Noninterest income | 10,702 | 2,550 | 996 | 2,994 | 2,002 | 2,067 | 93 | ||||||||||||||||||||||
Total revenue, net of interest expense (FTE basis) | 21,701 | 7,498 | 1,712 | 4,479 | 4,303 | 3,210 | 499 | ||||||||||||||||||||||
Provision for credit losses | 336 | 427 | (474 | ) | 26 | 441 | 104 | (188 | ) | ||||||||||||||||||||
Noninterest expense | 17,307 | 4,051 | 3,788 | 3,263 | 1,926 | 3,280 | 999 | ||||||||||||||||||||||
Income (loss) before income taxes | 4,058 | 3,020 | (1,602 | ) | 1,190 | 1,936 | (174 | ) | (312 | ) | |||||||||||||||||||
Income tax expense (benefit) (FTE basis) | 619 | 1,058 | (544 | ) | 413 | 670 | (131 | ) | (847 | ) | |||||||||||||||||||
Net income (loss) | $ | 3,439 | $ | 1,962 | $ | (1,058 | ) | $ | 777 | $ | 1,266 | $ | (43 | ) | $ | 535 | |||||||||||||
Average | |||||||||||||||||||||||||||||
Total loans and leases | $ | 929,777 | $ | 163,152 | $ | 89,687 | $ | 115,546 | $ | 268,849 | $ | 66,494 | $ | 226,049 | |||||||||||||||
Total assets (1) | 2,134,875 | 590,195 | 113,584 | 268,683 | 379,855 | 603,111 | 179,447 | ||||||||||||||||||||||
Total deposits | 1,112,674 | 528,808 | n/m | 240,395 | 259,122 | n/m | 34,029 | ||||||||||||||||||||||
Period end | |||||||||||||||||||||||||||||
Total loans and leases | $ | 928,233 | $ | 165,090 | $ | 89,753 | $ | 115,846 | $ | 269,469 | $ | 67,381 | $ | 220,694 | |||||||||||||||
Total assets (1) | 2,102,273 | 593,163 | 113,386 | 274,112 | 378,590 | 575,710 | 167,312 | ||||||||||||||||||||||
Total deposits | 1,119,271 | 531,707 | n/m | 244,901 | 265,102 | n/m | 27,701 | ||||||||||||||||||||||
First Quarter 2013 | |||||||||||||||||||||||||||||
Total Corporation | Consumer & Business Banking | Consumer Real Estate Services | GWIM | Global Banking | Global Markets | All Other | |||||||||||||||||||||||
Net interest income (FTE basis) | $ | 10,875 | $ | 5,013 | $ | 743 | $ | 1,596 | $ | 2,159 | $ | 1,110 | $ | 254 | |||||||||||||||
Noninterest income | 12,533 | 2,399 | 1,569 | 2,825 | 1,871 | 3,670 | 199 | ||||||||||||||||||||||
Total revenue, net of interest expense (FTE basis) | 23,408 | 7,412 | 2,312 | 4,421 | 4,030 | 4,780 | 453 | ||||||||||||||||||||||
Provision for credit losses | 1,713 | 952 | 335 | 22 | 149 | 5 | 250 | ||||||||||||||||||||||
Noninterest expense | 19,500 | 4,155 | 5,405 | 3,252 | 1,842 | 3,074 | 1,772 | ||||||||||||||||||||||
Income (loss) before income taxes | 2,195 | 2,305 | (3,428 | ) | 1,147 | 2,039 | 1,701 | (1,569 | ) | ||||||||||||||||||||
Income tax expense (benefit) (FTE basis) | 712 | 857 | (1,272 | ) | 426 | 758 | 589 | (646 | ) | ||||||||||||||||||||
Net income (loss) | $ | 1,483 | $ | 1,448 | $ | (2,156 | ) | $ | 721 | $ | 1,281 | $ | 1,112 | $ | (923 | ) | |||||||||||||
Average | |||||||||||||||||||||||||||||
Total loans and leases | $ | 906,259 | $ | 165,845 | $ | 92,963 | $ | 106,082 | $ | 244,068 | $ | 52,744 | $ | 244,557 | |||||||||||||||
Total assets (1) | 2,212,430 | 564,658 | 128,340 | 282,300 | 317,198 | 670,286 | 249,648 | ||||||||||||||||||||||
Total deposits | 1,075,280 | 502,508 | n/m | 253,413 | 221,275 | n/m | 35,550 | ||||||||||||||||||||||
Period end | |||||||||||||||||||||||||||||
Total loans and leases | $ | 911,592 | $ | 163,820 | $ | 90,971 | $ | 107,048 | $ | 250,985 | $ | 57,362 | $ | 241,406 | |||||||||||||||
Total assets (1) | 2,174,819 | 593,338 | 129,118 | 268,266 | 321,169 | 626,798 | 236,130 | ||||||||||||||||||||||
Total deposits | 1,095,183 | 530,581 | n/m | 239,853 | 227,379 | n/m | 35,758 | ||||||||||||||||||||||
(1) | Total assets include asset allocations to match liabilities (i.e., deposits). |
This information is preliminary and based on company data available at the time of the presentation. | 14 |
Bank of America Corporation and Subsidiaries | |||||||||||||||||||
Consumer & Business Banking Segment Results | |||||||||||||||||||
(Dollars in millions) | |||||||||||||||||||
First Quarter 2014 | Fourth Quarter 2013 | Third Quarter 2013 | Second Quarter 2013 | First Quarter 2013 | |||||||||||||||
Net interest income (FTE basis) | $ | 4,951 | $ | 4,948 | $ | 5,056 | $ | 5,034 | $ | 5,013 | |||||||||
Noninterest income: | |||||||||||||||||||
Card income | 1,162 | 1,236 | 1,175 | 1,186 | 1,207 | ||||||||||||||
Service charges | 1,045 | 1,097 | 1,063 | 1,035 | 1,013 | ||||||||||||||
All other income | 280 | 217 | 230 | 179 | 179 | ||||||||||||||
Total noninterest income | 2,487 | 2,550 | 2,468 | 2,400 | 2,399 | ||||||||||||||
Total revenue, net of interest expense (FTE basis) | 7,438 | 7,498 | 7,524 | 7,434 | 7,412 | ||||||||||||||
Provision for credit losses | 812 | 427 | 761 | 967 | 952 | ||||||||||||||
Noninterest expense | 3,975 | 4,051 | 3,986 | 4,187 | 4,155 | ||||||||||||||
Income before income taxes | 2,651 | 3,020 | 2,777 | 2,280 | 2,305 | ||||||||||||||
Income tax expense (FTE basis) | 993 | 1,058 | 1,002 | 891 | 857 | ||||||||||||||
Net income | $ | 1,658 | $ | 1,962 | $ | 1,775 | $ | 1,389 | $ | 1,448 | |||||||||
Net interest yield (FTE basis) | 3.63 | % | 3.58 | % | 3.70 | % | 3.72 | % | 3.89 | % | |||||||||
Return on average allocated capital (1) | 22.81 | 25.96 | 23.49 | 18.60 | 19.61 | ||||||||||||||
Efficiency ratio (FTE basis) | 53.46 | 54.03 | 52.99 | 56.32 | 56.07 | ||||||||||||||
Balance Sheet | |||||||||||||||||||
Average | |||||||||||||||||||
Total loans and leases | $ | 162,042 | $ | 163,152 | $ | 165,707 | $ | 163,593 | $ | 165,845 | |||||||||
Total earning assets (2) | 553,490 | 548,295 | 542,671 | 542,844 | 523,313 | ||||||||||||||
Total assets (2) | 595,549 | 590,195 | 583,980 | 584,289 | 564,658 | ||||||||||||||
Total deposits | 534,576 | 528,808 | 522,023 | 522,259 | 502,508 | ||||||||||||||
Allocated capital (1) | 29,500 | 30,000 | 30,000 | 30,000 | 30,000 | ||||||||||||||
Period end | |||||||||||||||||||
Total loans and leases | $ | 160,116 | $ | 165,090 | $ | 167,254 | $ | 164,851 | $ | 163,820 | |||||||||
Total earning assets (2) | 571,081 | 550,795 | 547,350 | 545,847 | 551,159 | ||||||||||||||
Total assets (2) | 613,244 | 593,163 | 588,790 | 587,738 | 593,338 | ||||||||||||||
Total deposits | 552,256 | 531,707 | 526,876 | 525,099 | 530,581 | ||||||||||||||
(1) | Return on average allocated capital is calculated as net income, adjusted for cost of funds and earnings credits and certain expenses related to intangibles, divided by average allocated capital. Allocated capital and the related return are non-GAAP financial measures. The Corporation believes the use of these non-GAAP financial measures provides additional clarity in assessing the results of the segments. Other companies may define or calculate these measures differently. (See Exhibit A: Non-GAAP Reconciliations - Reconciliations to GAAP Financial Measures on pages 42-45.) |
(2) | Total earning assets and total assets include asset allocations to match liabilities (i.e., deposits) and allocated shareholders' equity. |
This information is preliminary and based on company data available at the time of the presentation. | 15 |
Bank of America Corporation and Subsidiaries | |||||||||||||
Consumer & Business Banking Quarterly Results | |||||||||||||
(Dollars in millions) | |||||||||||||
First Quarter 2014 | |||||||||||||
Total Consumer & Business Banking | Deposits | Consumer Lending | |||||||||||
Net interest income (FTE basis) | $ | 4,951 | $ | 2,544 | $ | 2,407 | |||||||
Noninterest income: | |||||||||||||
Card income | 1,162 | 16 | 1,146 | ||||||||||
Service charges | 1,045 | 1,045 | — | ||||||||||
All other income | 280 | 115 | 165 | ||||||||||
Total noninterest income | 2,487 | 1,176 | 1,311 | ||||||||||
Total revenue, net of interest expense (FTE basis) | 7,438 | 3,720 | 3,718 | ||||||||||
Provision for credit losses | 812 | 80 | 732 | ||||||||||
Noninterest expense | 3,975 | 2,648 | 1,327 | ||||||||||
Income before income taxes | 2,651 | 992 | 1,659 | ||||||||||
Income tax expense (FTE basis) | 993 | 372 | 621 | ||||||||||
Net income | $ | 1,658 | $ | 620 | $ | 1,038 | |||||||
Net interest yield (FTE basis) | 3.63 | % | 1.91 | % | 6.95 | % | |||||||
Return on average allocated capital (1) | 22.81 | 15.24 | 32.41 | ||||||||||
Efficiency ratio (FTE basis) | 53.46 | 71.22 | 35.69 | ||||||||||
Balance Sheet | |||||||||||||
Average | |||||||||||||
Total loans and leases | $ | 162,042 | $ | 22,518 | $ | 139,524 | |||||||
Total earning assets (2) | 553,490 | 539,404 | 140,407 | ||||||||||
Total assets (2) | 595,549 | 572,148 | 149,722 | ||||||||||
Total deposits | 534,576 | 533,831 | n/m | ||||||||||
Allocated capital (1) | 29,500 | 16,500 | 13,000 | ||||||||||
Period end | |||||||||||||
Total loans and leases | $ | 160,116 | $ | 22,504 | $ | 137,612 | |||||||
Total earning assets (2) | 571,081 | 556,997 | 138,774 | ||||||||||
Total assets (2) | 613,244 | 589,705 | 148,229 | ||||||||||
Total deposits | 552,256 | 551,427 | n/m | ||||||||||
Fourth Quarter 2013 | |||||||||||||
Total Consumer & Business Banking | Deposits | Consumer Lending | |||||||||||
Net interest income (FTE basis) | $ | 4,948 | $ | 2,492 | $ | 2,456 | |||||||
Noninterest income: | |||||||||||||
Card income | 1,236 | 15 | 1,221 | ||||||||||
Service charges | 1,097 | 1,097 | — | ||||||||||
All other income | 217 | 165 | 52 | ||||||||||
Total noninterest income | 2,550 | 1,277 | 1,273 | ||||||||||
Total revenue, net of interest expense (FTE basis) | 7,498 | 3,769 | 3,729 | ||||||||||
Provision for credit losses | 427 | 105 | 322 | ||||||||||
Noninterest expense | 4,051 | 2,631 | 1,420 | ||||||||||
Income before income taxes | 3,020 | 1,033 | 1,987 | ||||||||||
Income tax expense (FTE basis) | 1,058 | 363 | 695 | ||||||||||
Net income | $ | 1,962 | $ | 670 | $ | 1,292 | |||||||
Net interest yield (FTE basis) | 3.58 | % | 1.86 | % | 6.87 | % | |||||||
Return on average allocated capital (1) | 25.96 | 17.26 | 35.14 | ||||||||||
Efficiency ratio (FTE basis) | 54.03 | 69.79 | 38.11 | ||||||||||
Balance Sheet | |||||||||||||
Average | |||||||||||||
Total loans and leases | $ | 163,152 | $ | 22,333 | $ | 140,819 | |||||||
Total earning assets (2) | 548,295 | 532,432 | 141,869 | ||||||||||
Total assets (2) | 590,195 | 565,340 | 150,861 | ||||||||||
Total deposits | 528,808 | 528,203 | n/m | ||||||||||
Allocated capital (1) | 30,000 | 15,400 | 14,600 | ||||||||||
Period end | |||||||||||||
Total loans and leases | $ | 165,090 | $ | 22,574 | $ | 142,516 | |||||||
Total earning assets (2) | 550,795 | 535,131 | 143,917 | ||||||||||
Total assets (2) | 593,163 | 568,022 | 153,394 | ||||||||||
Total deposits | 531,707 | 530,947 | n/m | ||||||||||
This information is preliminary and based on company data available at the time of the presentation. | 16 |
Bank of America Corporation and Subsidiaries | |||||||||||||
Consumer & Business Banking Quarterly Results (continued) | |||||||||||||
(Dollars in millions) | |||||||||||||
First Quarter 2013 | |||||||||||||
Total Consumer & Business Banking | Deposits | Consumer Lending | |||||||||||
Net interest income (FTE basis) | $ | 5,013 | $ | 2,387 | $ | 2,626 | |||||||
Noninterest income: | |||||||||||||
Card income | 1,207 | 15 | 1,192 | ||||||||||
Service charges | 1,013 | 1,013 | — | ||||||||||
All other income | 179 | 102 | 77 | ||||||||||
Total noninterest income | 2,399 | 1,130 | 1,269 | ||||||||||
Total revenue, net of interest expense (FTE basis) | 7,412 | 3,517 | 3,895 | ||||||||||
Provision for credit losses | 952 | 63 | 889 | ||||||||||
Noninterest expense | 4,155 | 2,822 | 1,333 | ||||||||||
Income before income taxes | 2,305 | 632 | 1,673 | ||||||||||
Income tax expense (FTE basis) | 857 | 235 | 622 | ||||||||||
Net income | $ | 1,448 | $ | 397 | $ | 1,051 | |||||||
Net interest yield (FTE basis) | 3.89 | % | 1.91 | % | 7.41 | % | |||||||
Return on average allocated capital (1) | 19.61 | 10.46 | 29.25 | ||||||||||
Efficiency ratio (FTE basis) | 56.07 | 80.26 | 34.23 | ||||||||||
Balance Sheet | |||||||||||||
Average | |||||||||||||
Total loans and leases | $ | 165,845 | $ | 22,616 | $ | 143,229 | |||||||
Total earning assets (2) | 523,313 | 506,715 | 143,671 | ||||||||||
Total assets (2) | 564,658 | 539,507 | 152,224 | ||||||||||
Total deposits | 502,508 | 502,063 | n/m | ||||||||||
Allocated capital (1) | 30,000 | 15,400 | 14,600 | ||||||||||
Period end | |||||||||||||
Total loans and leases | $ | 163,820 | $ | 22,488 | $ | 141,332 | |||||||
Total earning assets (2) | 551,159 | 534,268 | 141,778 | ||||||||||
Total assets (2) | 593,338 | 567,517 | 150,708 | ||||||||||
Total deposits | 530,581 | 529,501 | n/m | ||||||||||
(1) | Return on average allocated capital is calculated as net income, adjusted for cost of funds and earnings credits and certain expenses related to intangibles, divided by average allocated capital. Allocated capital and the related return are non-GAAP financial measures. The Corporation believes the use of these non-GAAP financial measures provides additional clarity in assessing the results of the segments. Other companies may define or calculate these measures differently. (See Exhibit A: Non-GAAP Reconciliations - Reconciliations to GAAP Financial Measures on pages 42-45.) |
(2) | For presentation purposes, in segments or businesses where the total of liabilities and equity exceeds assets, the Corporation allocates assets from All Other to match the segments' and businesses' liabilities and allocated shareholders' equity. As a result, total earning assets and total assets of the businesses may not equal total Consumer & Business Banking. |
This information is preliminary and based on company data available at the time of the presentation. | 17 |
Bank of America Corporation and Subsidiaries | |||||||||||||||||||
Consumer & Business Banking Key Indicators | |||||||||||||||||||
(Dollars in millions) | |||||||||||||||||||
First Quarter 2014 | Fourth Quarter 2013 | Third Quarter 2013 | Second Quarter 2013 | First Quarter 2013 | |||||||||||||||
Average deposit balances | |||||||||||||||||||
Checking | $ | 253,026 | $ | 247,286 | $ | 240,484 | $ | 238,489 | $ | 228,299 | |||||||||
Savings | 43,619 | 42,139 | 42,365 | 43,183 | 40,959 | ||||||||||||||
MMS | 169,424 | 166,828 | 163,955 | 161,976 | 154,710 | ||||||||||||||
CDs and IRAs | 65,270 | 68,192 | 70,888 | 74,064 | 74,217 | ||||||||||||||
Non-U.S. and other | 3,237 | 4,363 | 4,331 | 4,547 | 4,323 | ||||||||||||||
Total average deposit balances | $ | 534,576 | $ | 528,808 | $ | 522,023 | $ | 522,259 | $ | 502,508 | |||||||||
Deposit spreads (excludes noninterest costs) | |||||||||||||||||||
Checking | 2.02 | % | 2.01 | % | 2.01 | % | 2.02 | % | 2.06 | % | |||||||||
Savings | 2.29 | 2.23 | 2.21 | 2.20 | 2.20 | ||||||||||||||
MMS | 1.13 | 1.11 | 1.08 | 1.05 | 1.04 | ||||||||||||||
CDs and IRAs | 0.50 | 0.50 | 0.51 | 0.51 | 0.55 | ||||||||||||||
Non-U.S. and other | 0.62 | 0.85 | 0.93 | 1.00 | 1.02 | ||||||||||||||
Total deposit spreads | 1.56 | 1.54 | 1.52 | 1.51 | 1.52 | ||||||||||||||
Client brokerage assets | $ | 100,206 | $ | 96,048 | $ | 89,517 | $ | 84,182 | $ | 82,616 | |||||||||
Online banking active accounts (units in thousands) | 30,470 | 29,950 | 30,197 | 29,867 | 30,102 | ||||||||||||||
Mobile banking active accounts (units in thousands) | 14,986 | 14,395 | 13,967 | 13,214 | 12,641 | ||||||||||||||
Banking centers | 5,095 | 5,151 | 5,243 | 5,328 | 5,389 | ||||||||||||||
ATMs | 16,214 | 16,259 | 16,201 | 16,354 | 16,311 | ||||||||||||||
Total U.S. credit card (1) | |||||||||||||||||||
Loans | |||||||||||||||||||
Average credit card outstandings | $ | 89,545 | $ | 90,057 | $ | 90,005 | $ | 89,722 | $ | 91,712 | |||||||||
Ending credit card outstandings | 87,692 | 92,338 | 90,280 | 90,523 | 90,047 | ||||||||||||||
Credit quality | |||||||||||||||||||
Net charge-offs | $ | 718 | $ | 724 | $ | 788 | $ | 917 | $ | 947 | |||||||||
3.25 | % | 3.19 | % | 3.47 | % | 4.10 | % | 4.19 | % | ||||||||||
30+ delinquency | $ | 1,878 | $ | 2,074 | $ | 2,112 | $ | 2,200 | $ | 2,510 | |||||||||
2.14 | % | 2.25 | % | 2.34 | % | 2.43 | % | 2.79 | % | ||||||||||
90+ delinquency | $ | 966 | $ | 1,053 | $ | 1,049 | $ | 1,167 | $ | 1,360 | |||||||||
1.10 | % | 1.14 | % | 1.16 | % | 1.29 | % | 1.51 | % | ||||||||||
Other Total U.S. credit card indicators (1) | |||||||||||||||||||
Gross interest yield | 9.48 | % | 9.36 | % | 9.82 | % | 9.80 | % | 9.95 | % | |||||||||
Risk-adjusted margin | 9.49 | 9.11 | 8.68 | 8.41 | 8.51 | ||||||||||||||
New accounts (in thousands) | 1,027 | 1,000 | 1,048 | 957 | 906 | ||||||||||||||
Purchase volumes | $ | 48,863 | $ | 54,514 | $ | 52,823 | $ | 51,945 | $ | 46,632 | |||||||||
Debit card data | |||||||||||||||||||
Purchase volumes | $ | 65,890 | $ | 68,000 | $ | 66,712 | $ | 67,740 | $ | 64,635 | |||||||||
(1) | In addition to the U.S. credit card portfolio in Consumer & Business Banking, the remaining U.S. credit card portfolio is in GWIM. |
This information is preliminary and based on company data available at the time of the presentation. | 18 |
Bank of America Corporation and Subsidiaries | ||||||||||||||||||||
Consumer Real Estate Services Segment Results | ||||||||||||||||||||
(Dollars in millions; except as noted) | ||||||||||||||||||||
First Quarter 2014 | Fourth Quarter 2013 | Third Quarter 2013 | Second Quarter 2013 | First Quarter 2013 | ||||||||||||||||
Net interest income (FTE basis) | $ | 701 | $ | 716 | $ | 733 | $ | 699 | $ | 743 | ||||||||||
Noninterest income: | ||||||||||||||||||||
Mortgage banking income | 469 | 913 | 775 | 1,411 | 1,487 | |||||||||||||||
All other income | 22 | 83 | 69 | 5 | 82 | |||||||||||||||
Total noninterest income | 491 | 996 | 844 | 1,416 | 1,569 | |||||||||||||||
Total revenue, net of interest expense (FTE basis) | 1,192 | 1,712 | 1,577 | 2,115 | 2,312 | |||||||||||||||
Provision for credit losses | 25 | (474 | ) | (308 | ) | 291 | 335 | |||||||||||||
Noninterest expense | 8,129 | 3,788 | 3,414 | 3,383 | 5,405 | |||||||||||||||
Loss before income taxes | (6,962 | ) | (1,602 | ) | (1,529 | ) | (1,559 | ) | (3,428 | ) | ||||||||||
Income tax expense (benefit) (FTE basis) | (1,935 | ) | (544 | ) | (532 | ) | (629 | ) | (1,272 | ) | ||||||||||
Net loss | $ | (5,027 | ) | $ | (1,058 | ) | $ | (997 | ) | $ | (930 | ) | $ | (2,156 | ) | |||||
Net interest yield (FTE basis) | 3.05 | % | 2.89 | % | 2.91 | % | 2.75 | % | 2.85 | % | ||||||||||
Balance Sheet | ||||||||||||||||||||
Average | ||||||||||||||||||||
Total loans and leases | $ | 88,914 | $ | 89,687 | $ | 88,406 | $ | 90,114 | $ | 92,963 | ||||||||||
Total earning assets | 93,290 | 98,220 | 99,759 | 102,086 | 105,715 | |||||||||||||||
Total assets | 110,564 | 113,584 | 118,226 | 122,276 | 128,340 | |||||||||||||||
Allocated capital (1) | 23,000 | 24,000 | 24,000 | 24,000 | 24,000 | |||||||||||||||
Period end | ||||||||||||||||||||
Total loans and leases | $ | 88,355 | $ | 89,753 | $ | 87,586 | $ | 89,257 | $ | 90,971 | ||||||||||
Total earning assets | 92,937 | 97,163 | 98,247 | 102,211 | 105,544 | |||||||||||||||
Total assets | 112,264 | 113,386 | 115,424 | 124,032 | 129,118 | |||||||||||||||
Period end (in billions) | ||||||||||||||||||||
Mortgage serviced portfolio (2, 3) | $ | 780.0 | $ | 810.0 | $ | 889.4 | $ | 986.4 | $ | 1,185.0 | ||||||||||
(1) | Allocated capital is a non-GAAP financial measure. The Corporation believes the use of this non-GAAP financial measure provides additional clarity in assessing the results of the segments. Other companies may define or calculate these measures differently. (See Exhibit A: Non-GAAP Reconciliations - Reconciliations to GAAP Financial Measures on pages 42-45.) |
(2) | Includes servicing of residential mortgage loans, home equity lines of credit and home equity loans. |
(3) | Excludes loans for which servicing transferred to third parties as of March 31, 2014 with an effective mortgage servicing right sales date of April 1, 2014. |
This information is preliminary and based on company data available at the time of the presentation. | 19 |
Bank of America Corporation and Subsidiaries | |||||||||||||
Consumer Real Estate Services Quarterly Results (1) | |||||||||||||
(Dollars in millions) | |||||||||||||
First Quarter 2014 | |||||||||||||
Total Consumer Real Estate Services | Home Loans | Legacy Assets & Servicing | |||||||||||
Net interest income (FTE basis) | $ | 701 | $ | 324 | $ | 377 | |||||||
Noninterest income: | |||||||||||||
Mortgage banking income | 469 | 178 | 291 | ||||||||||
All other income | 22 | 4 | 18 | ||||||||||
Total noninterest income | 491 | 182 | 309 | ||||||||||
Total revenue, net of interest expense (FTE basis) | 1,192 | 506 | 686 | ||||||||||
Provision for credit losses | 25 | 13 | 12 | ||||||||||
Noninterest expense | 8,129 | 715 | 7,414 | ||||||||||
Loss before income taxes | (6,962 | ) | (222 | ) | (6,740 | ) | |||||||
Income tax benefit (FTE basis) | (1,935 | ) | (83 | ) | (1,852 | ) | |||||||
Net loss | $ | (5,027 | ) | $ | (139 | ) | $ | (4,888 | ) | ||||
Balance Sheet | |||||||||||||
Average | |||||||||||||
Total loans and leases | $ | 88,914 | $ | 50,810 | $ | 38,104 | |||||||
Total earning assets | 93,290 | 53,264 | 40,026 | ||||||||||
Total assets | 110,564 | 53,164 | 57,400 | ||||||||||
Allocated capital (2) | 23,000 | 6,000 | 17,000 | ||||||||||
Period end | |||||||||||||
Total loans and leases | $ | 88,355 | $ | 50,954 | $ | 37,401 | |||||||
Total earning assets | 92,937 | 53,796 | 39,141 | ||||||||||
Total assets | 112,264 | 53,658 | 58,606 | ||||||||||
Fourth Quarter 2013 | |||||||||||||
Total Consumer Real Estate Services | Home Loans | Legacy Assets & Servicing | |||||||||||
Net interest income (FTE basis) | $ | 716 | $ | 330 | $ | 386 | |||||||
Noninterest income: | |||||||||||||
Mortgage banking income | 913 | 220 | 693 | ||||||||||
All other income | 83 | 17 | 66 | ||||||||||
Total noninterest income | 996 | 237 | 759 | ||||||||||
Total revenue, net of interest expense (FTE basis) | 1,712 | 567 | 1,145 | ||||||||||
Provision for credit losses | (474 | ) | (18 | ) | (456 | ) | |||||||
Noninterest expense | 3,788 | 755 | 3,033 | ||||||||||
Loss before income taxes | (1,602 | ) | (170 | ) | (1,432 | ) | |||||||
Income tax benefit (FTE basis) | (544 | ) | (62 | ) | (482 | ) | |||||||
Net loss | $ | (1,058 | ) | $ | (108 | ) | $ | (950 | ) | ||||
Balance Sheet | |||||||||||||
Average | |||||||||||||
Total loans and leases | $ | 89,687 | $ | 49,706 | $ | 39,981 | |||||||
Total earning assets | 98,220 | 53,052 | 45,168 | ||||||||||
Total assets | 113,584 | 52,932 | 60,652 | ||||||||||
Allocated capital (2) | 24,000 | 6,000 | 18,000 | ||||||||||
Period end | |||||||||||||
Total loans and leases | $ | 89,753 | $ | 51,021 | $ | 38,732 | |||||||
Total earning assets | 97,163 | 54,071 | 43,092 | ||||||||||
Total assets | 113,386 | 53,927 | 59,459 | ||||||||||
This information is preliminary and based on company data available at the time of the presentation. | 20 |
Bank of America Corporation and Subsidiaries | |||||||||||||
Consumer Real Estate Services Quarterly Results (1) (continued) | |||||||||||||
(Dollars in millions) | |||||||||||||
First Quarter 2013 | |||||||||||||
Total Consumer Real Estate Services | Home Loans | Legacy Assets & Servicing | |||||||||||
Net interest income (FTE basis) | $ | 743 | $ | 347 | $ | 396 | |||||||
Noninterest income: | |||||||||||||
Mortgage banking income | 1,487 | 697 | 790 | ||||||||||
All other income (loss) | 82 | (64 | ) | 146 | |||||||||
Total noninterest income | 1,569 | 633 | 936 | ||||||||||
Total revenue, net of interest expense (FTE basis) | 2,312 | 980 | 1,332 | ||||||||||
Provision for credit losses | 335 | 92 | 243 | ||||||||||
Noninterest expense | 5,405 | 821 | 4,584 | ||||||||||
Income (loss) before income taxes | (3,428 | ) | 67 | (3,495 | ) | ||||||||
Income tax expense (benefit) (FTE basis) | (1,272 | ) | 25 | (1,297 | ) | ||||||||
Net income (loss) | $ | (2,156 | ) | $ | 42 | $ | (2,198 | ) | |||||
Balance Sheet | |||||||||||||
Average | |||||||||||||
Total loans and leases | $ | 92,963 | $ | 47,228 | $ | 45,735 | |||||||
Total earning assets | 105,715 | 53,746 | 51,969 | ||||||||||
Total assets | 128,340 | 54,507 | 73,833 | ||||||||||
Allocated capital (2) | 24,000 | 6,000 | 18,000 | ||||||||||
Period end | |||||||||||||
Total loans and leases | $ | 90,971 | $ | 46,929 | $ | 44,042 | |||||||
Total earning assets | 105,544 | 55,111 | 50,433 | ||||||||||
Total assets | 129,118 | 55,582 | 73,536 | ||||||||||
(1) | Consumer Real Estate Services includes Home Loans and Legacy Assets & Servicing. The results of certain mortgage servicing rights activities, including net hedge results, together with any related assets or liabilities used as economic hedges, are included in Legacy Assets & Servicing. |
(2) | Allocated capital is a non-GAAP financial measure. The Corporation believes the use of this non-GAAP financial measure provides additional clarity in assessing the results of the segments. Other companies may define or calculate these measures differently. (See Exhibit A: Non-GAAP Reconciliations - Reconciliations to GAAP Financial Measures on pages 42-45.) |
This information is preliminary and based on company data available at the time of the presentation. | 21 |
Bank of America Corporation and Subsidiaries | ||||||||||||||||||||
Consumer Real Estate Services Key Indicators | ||||||||||||||||||||
(Dollars in millions, except as noted) | ||||||||||||||||||||
First Quarter 2014 | Fourth Quarter 2013 | Third Quarter 2013 | Second Quarter 2013 | First Quarter 2013 | ||||||||||||||||
Mortgage servicing rights at fair value rollforward: | ||||||||||||||||||||
Balance, beginning of period | $ | 5,042 | $ | 5,058 | $ | 5,827 | $ | 5,776 | $ | 5,716 | ||||||||||
Net additions (sales) | 30 | (197 | ) | (600 | ) | (715 | ) | (60 | ) | |||||||||||
Amortization of expected cash flows (1) | (210 | ) | (229 | ) | (240 | ) | (260 | ) | (314 | ) | ||||||||||
Other changes in mortgage servicing rights fair value (2) | (285 | ) | 410 | 71 | 1,026 | 434 | ||||||||||||||
Balance, end of period | $ | 4,577 | $ | 5,042 | $ | 5,058 | $ | 5,827 | $ | 5,776 | ||||||||||
Capitalized mortgage servicing rights (% of loans serviced for investors) | 87 | bps | 92 | bps | 82 | bps | 77 | bps | 61 | bps | ||||||||||
Mortgage loans serviced for investors (in billions) | $ | 527 | $ | 550 | $ | 616 | $ | 759 | $ | 949 | ||||||||||
Loan production: | ||||||||||||||||||||
Total (3) | ||||||||||||||||||||
First mortgage | $ | 8,850 | $ | 11,624 | $ | 22,601 | $ | 25,276 | $ | 23,920 | ||||||||||
Home equity | 1,983 | 1,915 | 1,831 | 1,497 | 1,118 | |||||||||||||||
Consumer Real Estate Services | ||||||||||||||||||||
First mortgage | $ | 6,702 | $ | 9,303 | $ | 17,833 | $ | 20,509 | $ | 19,269 | ||||||||||
Home equity | 1,791 | 1,674 | 1,599 | 1,283 | 942 | |||||||||||||||
Mortgage banking income | ||||||||||||||||||||
Production income: | ||||||||||||||||||||
Core production revenue | $ | 273 | $ | 404 | $ | 465 | $ | 860 | $ | 815 | ||||||||||
Representations and warranties provision | (178 | ) | (70 | ) | (323 | ) | (197 | ) | (250 | ) | ||||||||||
Total production income | 95 | 334 | 142 | 663 | 565 | |||||||||||||||
Servicing income: | ||||||||||||||||||||
Servicing fees | 514 | 629 | 700 | 785 | 916 | |||||||||||||||
Amortization of expected cash flows (1) | (210 | ) | (229 | ) | (240 | ) | (260 | ) | (314 | ) | ||||||||||
Fair value changes of mortgage servicing rights, net of risk management activities used to hedge certain market risks (4) | 66 | 174 | 167 | 215 | 311 | |||||||||||||||
Other servicing-related revenue | 4 | 5 | 6 | 8 | 9 | |||||||||||||||
Total net servicing income | 374 | 579 | 633 | 748 | 922 | |||||||||||||||
Total Consumer Real Estate Services mortgage banking income | 469 | 913 | 775 | 1,411 | 1,487 | |||||||||||||||
Other business segments’ mortgage banking loss (5) | (57 | ) | (65 | ) | (190 | ) | (233 | ) | (224 | ) | ||||||||||
Total consolidated mortgage banking income | $ | 412 | $ | 848 | $ | 585 | $ | 1,178 | $ | 1,263 | ||||||||||
(1) | Represents the net change in fair value of the MSR asset due to the recognition of modeled cash flows. |
(2) | These amounts reflect the changes in modeled mortgage servicing rights fair value primarily due to observed changes in interest rates, volatility, spreads and the shape of the forward swap curve. In addition, these amounts reflect periodic adjustments to the valuation model to reflect changes in the modeled relationship between inputs and their impact on projected cash flows, changes in certain cash flow assumptions such as cost to service and ancillary income per loan, changes in OAS rate inputs and the impact of periodic recalibrations of the model to reflect changes in the relationship between market interest rate spreads and projected cash flows. |
(3) | In addition to loan production in Consumer Real Estate Services, the remaining first mortgage and home equity loan production is primarily in GWIM. |
(4) | Includes gains and losses on sales of mortgage servicing rights. |
(5) | Includes the effect of transfers of mortgage loans from Consumer Real Estate Services to the asset and liability management portfolio included in All Other. |
This information is preliminary and based on company data available at the time of the presentation. | 22 |
Bank of America Corporation and Subsidiaries | |||||||||||||||||||
Global Wealth & Investment Management Segment Results | |||||||||||||||||||
(Dollars in millions) | |||||||||||||||||||
First Quarter 2014 | Fourth Quarter 2013 | Third Quarter 2013 | Second Quarter 2013 | First Quarter 2013 | |||||||||||||||
Net interest income (FTE basis) | $ | 1,485 | $ | 1,485 | $ | 1,478 | $ | 1,505 | $ | 1,596 | |||||||||
Noninterest income: | |||||||||||||||||||
Investment and brokerage services | 2,604 | 2,524 | 2,413 | 2,441 | 2,331 | ||||||||||||||
All other income | 458 | 470 | 499 | 553 | 494 | ||||||||||||||
Total noninterest income | 3,062 | 2,994 | 2,912 | 2,994 | 2,825 | ||||||||||||||
Total revenue, net of interest expense (FTE basis) | 4,547 | 4,479 | 4,390 | 4,499 | 4,421 | ||||||||||||||
Provision for credit losses | 23 | 26 | 23 | (15 | ) | 22 | |||||||||||||
Noninterest expense | 3,359 | 3,263 | 3,248 | 3,270 | 3,252 | ||||||||||||||
Income before income taxes | 1,165 | 1,190 | 1,119 | 1,244 | 1,147 | ||||||||||||||
Income tax expense (FTE basis) | 436 | 413 | 399 | 485 | 426 | ||||||||||||||
Net income | $ | 729 | $ | 777 | $ | 720 | $ | 759 | $ | 721 | |||||||||
Net interest yield (FTE basis) | 2.38 | % | 2.37 | % | 2.35 | % | 2.47 | % | 2.46 | % | |||||||||
Return on average allocated capital (1) | 24.74 | 30.99 | 28.71 | 30.59 | 29.41 | ||||||||||||||
Efficiency ratio (FTE basis) | 73.88 | 72.85 | 73.98 | 72.70 | 73.56 | ||||||||||||||
Balance Sheet | |||||||||||||||||||
Average | |||||||||||||||||||
Total loans and leases | $ | 115,945 | $ | 115,546 | $ | 112,752 | $ | 109,589 | $ | 106,082 | |||||||||
Total earning assets (2) | 253,537 | 248,156 | 249,203 | 244,860 | 263,554 | ||||||||||||||
Total assets (2) | 273,080 | 268,683 | 268,611 | 263,735 | 282,300 | ||||||||||||||
Total deposits | 242,792 | 240,395 | 239,663 | 235,344 | 253,413 | ||||||||||||||
Allocated capital (1) | 12,000 | 10,000 | 10,000 | 10,000 | 10,000 | ||||||||||||||
Period end | |||||||||||||||||||
Total loans and leases | $ | 116,482 | $ | 115,846 | $ | 114,175 | $ | 111,785 | $ | 107,048 | |||||||||
Total earning assets (2) | 254,801 | 254,031 | 250,677 | 244,340 | 248,941 | ||||||||||||||
Total assets (2) | 274,234 | 274,112 | 270,484 | 263,867 | 268,266 | ||||||||||||||
Total deposits | 244,051 | 244,901 | 241,553 | 235,012 | 239,853 | ||||||||||||||
(1) | Return on average allocated capital is calculated as net income, adjusted for cost of funds and earnings credits and certain expenses related to intangibles, divided by average allocated capital. Allocated capital and the related return are non-GAAP financial measures. The Corporation believes the use of these non-GAAP financial measures provides additional clarity in assessing the results of the segments. Other companies may define or calculate these measures differently. (See Exhibit A: Non-GAAP Reconciliations - Reconciliations to GAAP Financial Measures on pages 42-45.) |
(2) | Total earning assets and total assets include asset allocations to match liabilities (i.e., deposits) and allocated shareholders' equity. |
This information is preliminary and based on company data available at the time of the presentation. | 23 |
Bank of America Corporation and Subsidiaries | |||||||||||||||||||
Global Wealth & Investment Management Key Indicators | |||||||||||||||||||
(Dollars in millions, except as noted) | |||||||||||||||||||
First Quarter 2014 | Fourth Quarter 2013 | Third Quarter 2013 | Second Quarter 2013 | First Quarter 2013 | |||||||||||||||
Revenues | |||||||||||||||||||
Merrill Lynch Global Wealth Management | $ | 3,764 | $ | 3,703 | $ | 3,646 | $ | 3,742 | $ | 3,680 | |||||||||
U.S. Trust | 768 | 762 | 730 | 740 | 721 | ||||||||||||||
Other (1) | 15 | 14 | 14 | 17 | 20 | ||||||||||||||
Total revenues | $ | 4,547 | $ | 4,479 | $ | 4,390 | $ | 4,499 | $ | 4,421 | |||||||||
Client Balances | |||||||||||||||||||
Client Balances by Business | |||||||||||||||||||
Merrill Lynch Global Wealth Management | $ | 1,946,922 | $ | 1,916,803 | $ | 1,853,980 | $ | 1,800,151 | $ | 1,812,412 | |||||||||
U.S. Trust | 378,177 | 376,487 | 362,791 | 351,119 | 354,721 | ||||||||||||||
Other (1) | 70,720 | 73,148 | 66,665 | 63,781 | 64,603 | ||||||||||||||
Client Balances by Type | |||||||||||||||||||
Assets under management | $ | 841,818 | $ | 821,449 | $ | 779,614 | $ | 743,613 | $ | 745,260 | |||||||||
Brokerage assets | 1,054,052 | 1,045,122 | 1,013,688 | 992,664 | 1,009,507 | ||||||||||||||
Assets in custody | 136,342 | 136,190 | 131,386 | 128,854 | 127,013 | ||||||||||||||
Deposits | 244,051 | 244,901 | 241,553 | 235,012 | 239,853 | ||||||||||||||
Loans and leases (2) | 119,556 | 118,776 | 117,195 | 114,908 | 110,103 | ||||||||||||||
Total client balances | $ | 2,395,819 | $ | 2,366,438 | $ | 2,283,436 | $ | 2,215,051 | $ | 2,231,736 | |||||||||
Assets Under Management Flows | |||||||||||||||||||
Liquidity assets under management (3) | $ | (2,429 | ) | $ | 6,492 | $ | 2,932 | $ | (695 | ) | $ | (2,227 | ) | ||||||
Long-term assets under management (4) | 17,382 | 9,425 | 10,341 | 7,692 | 20,361 | ||||||||||||||
Total assets under management flows | $ | 14,953 | $ | 15,917 | $ | 13,273 | $ | 6,997 | $ | 18,134 | |||||||||
Associates (5) | |||||||||||||||||||
Number of Financial Advisors | 15,323 | 15,317 | 15,624 | 15,759 | 16,065 | ||||||||||||||
Total Wealth Advisors | 16,481 | 16,517 | 16,846 | 16,989 | 17,293 | ||||||||||||||
Total Client Facing Professionals | 19,198 | 19,217 | 19,524 | 19,679 | 20,018 | ||||||||||||||
Merrill Lynch Global Wealth Management Metrics | |||||||||||||||||||
Financial Advisor Productivity (6) (in thousands) | $ | 1,056 | $ | 1,039 | $ | 1,000 | $ | 1,012 | $ | 971 | |||||||||
U.S. Trust Metrics | |||||||||||||||||||
Client Facing Professionals | 2,116 | 2,091 | 2,080 | 2,074 | 2,090 | ||||||||||||||
(1) | Other includes the results of BofA Global Capital Management and other administrative items. |
(2) | Includes margin receivables which are classified in customer and other receivables on the Consolidated Balance Sheet. |
(3) | Defined as assets under advisory and discretion of GWIM in which the investment strategy seeks a high level of income while maintaining liquidity and capital preservation. The duration of these strategies is primarily less than one year. |
(4) | Defined as assets under advisory and discretion of GWIM in which the duration of the investment strategy is longer than one year. |
(5) | Includes Financial Advisors in the Consumer & Business Banking segment of 1,598, 1,545, 1,585, 1,587 and 1,591 at March 31, 2014, December 31, 2013, September 30, 2013, June 30, 2013 and March 31, 2013, respectively. |
(6) | Financial Advisor Productivity is defined as annualized Merrill Lynch Global Wealth Management total revenue divided by the total number of Financial Advisors (excluding Financial Advisors in the Consumer & Business Banking segment). Total revenue excludes corporate allocation of net interest income related to certain ALM activities. |
This information is preliminary and based on company data available at the time of the presentation. | 24 |
Bank of America Corporation and Subsidiaries | |||||||||||||||||||
Global Banking Segment Results | |||||||||||||||||||
(Dollars in millions) | |||||||||||||||||||
First Quarter 2014 | Fourth Quarter 2013 | Third Quarter 2013 | Second Quarter 2013 | First Quarter 2013 | |||||||||||||||
Net interest income (FTE basis) | $ | 2,301 | $ | 2,301 | $ | 2,201 | $ | 2,252 | $ | 2,159 | |||||||||
Noninterest income: | |||||||||||||||||||
Service charges | 687 | 684 | 716 | 701 | 686 | ||||||||||||||
Investment banking income | 822 | 958 | 693 | 792 | 790 | ||||||||||||||
All other income | 459 | 360 | 398 | 393 | 395 | ||||||||||||||
Total noninterest income | 1,968 | 2,002 | 1,807 | 1,886 | 1,871 | ||||||||||||||
Total revenue, net of interest expense (FTE basis) | 4,269 | 4,303 | 4,008 | 4,138 | 4,030 | ||||||||||||||
Provision for credit losses | 265 | 441 | 322 | 163 | 149 | ||||||||||||||
Noninterest expense | 2,028 | 1,926 | 1,927 | 1,856 | 1,842 | ||||||||||||||
Income before income taxes | 1,976 | 1,936 | 1,759 | 2,119 | 2,039 | ||||||||||||||
Income tax expense (FTE basis) | 740 | 670 | 625 | 827 | 758 | ||||||||||||||
Net income | $ | 1,236 | $ | 1,266 | $ | 1,134 | $ | 1,292 | $ | 1,281 | |||||||||
Net interest yield (FTE basis) | 2.68 | % | 2.71 | % | 2.87 | % | 3.17 | % | 3.18 | % | |||||||||
Return on average allocated capital (1) | 16.18 | 21.84 | 19.57 | 22.55 | 22.59 | ||||||||||||||
Efficiency ratio (FTE basis) | 47.50 | 44.77 | 48.06 | 44.87 | 45.70 | ||||||||||||||
Balance Sheet | |||||||||||||||||||
Average | |||||||||||||||||||
Total loans and leases | $ | 271,475 | $ | 268,849 | $ | 260,085 | $ | 255,674 | $ | 244,068 | |||||||||
Total earnings assets (2) | 347,843 | 336,301 | 304,686 | 284,955 | 275,186 | ||||||||||||||
Total assets (2) | 392,991 | 379,855 | 346,371 | 326,729 | 317,198 | ||||||||||||||
Total deposits | 256,349 | 259,122 | 239,148 | 226,866 | 221,275 | ||||||||||||||
Allocated capital (1) | 31,000 | 23,000 | 23,000 | 23,000 | 23,000 | ||||||||||||||
Period end | |||||||||||||||||||
Total loans and leases | $ | 273,239 | $ | 269,469 | $ | 267,165 | $ | 258,502 | $ | 250,985 | |||||||||
Total earnings assets (2) | 354,150 | 336,538 | 329,968 | 292,250 | 279,235 | ||||||||||||||
Total assets (2) | 396,952 | 378,590 | 372,451 | 334,116 | 321,169 | ||||||||||||||
Total deposits | 257,437 | 265,102 | 262,463 | 228,882 | 227,379 | ||||||||||||||
(1) | Return on average allocated capital is calculated as net income, adjusted for cost of funds and earnings credits and certain expenses related to intangibles, divided by average allocated capital. Allocated capital and the related return are non-GAAP financial measures. The Corporation believes the use of these non-GAAP financial measures provides additional clarity in assessing the results of the segments. Other companies may define or calculate these measures differently. (See Exhibit A: Non-GAAP Reconciliations - Reconciliations to GAAP Financial Measures on pages 42-45.) |
(2) | Total earning assets and total assets include asset allocations to match liabilities (i.e., deposits) and allocated shareholders' equity. |
This information is preliminary and based on company data available at the time of the presentation. | 25 |
Bank of America Corporation and Subsidiaries | |||||||||||||||||||
Global Banking Key Indicators | |||||||||||||||||||
(Dollars in millions) | |||||||||||||||||||
First Quarter 2014 | Fourth Quarter 2013 | Third Quarter 2013 | Second Quarter 2013 | First Quarter 2013 | |||||||||||||||
Investment Banking fees (1) | |||||||||||||||||||
Advisory (2) | $ | 257 | $ | 323 | $ | 226 | $ | 240 | $ | 233 | |||||||||
Debt issuance | 447 | 443 | 343 | 405 | 429 | ||||||||||||||
Equity issuance | 118 | 192 | 124 | 147 | 128 | ||||||||||||||
Total Investment Banking fees (3) | $ | 822 | $ | 958 | $ | 693 | $ | 792 | $ | 790 | |||||||||
Business Lending | |||||||||||||||||||
Corporate | $ | 904 | $ | 817 | $ | 884 | $ | 855 | $ | 851 | |||||||||
Commercial | 1,009 | 1,011 | 960 | 1,050 | 946 | ||||||||||||||
Total Business Lending revenue | $ | 1,913 | $ | 1,828 | $ | 1,844 | $ | 1,905 | $ | 1,797 | |||||||||
Global Treasury Services | |||||||||||||||||||
Corporate | $ | 740 | $ | 734 | $ | 713 | $ | 702 | $ | 666 | |||||||||
Commercial | 735 | 747 | 741 | 733 | 718 | ||||||||||||||
Total Global Treasury Services revenue | $ | 1,475 | $ | 1,481 | $ | 1,454 | $ | 1,435 | $ | 1,384 | |||||||||
Average deposit balances | |||||||||||||||||||
Interest-bearing | $ | 77,566 | $ | 78,223 | $ | 73,011 | $ | 69,362 | $ | 67,797 | |||||||||
Noninterest-bearing | 178,783 | 180,899 | 166,137 | 157,504 | 153,478 | ||||||||||||||
Total average deposits | $ | 256,349 | $ | 259,122 | $ | 239,148 | $ | 226,866 | $ | 221,275 | |||||||||
Loan spread | 1.80 | % | 1.75 | % | 1.78 | % | 1.89 | % | 1.86 | % | |||||||||
Provision for credit losses | $ | 265 | $ | 441 | $ | 322 | $ | 163 | $ | 149 | |||||||||
Credit quality (4, 5) | |||||||||||||||||||
Reservable utilized criticized exposure | $ | 9,512 | $ | 9,357 | $ | 10,111 | $ | 10,632 | $ | 10,342 | |||||||||
3.19 | % | 3.17 | % | 3.44 | % | 3.73 | % | 3.71 | % | ||||||||||
Nonperforming loans, leases and foreclosed properties | $ | 650 | $ | 639 | $ | 919 | $ | 1,087 | $ | 1,643 | |||||||||
0.24 | % | 0.24 | % | 0.35 | % | 0.43 | % | 0.66 | % | ||||||||||
Average loans and leases by product | |||||||||||||||||||
U.S. commercial | $ | 135,247 | $ | 132,249 | $ | 128,600 | $ | 127,742 | $ | 124,891 | |||||||||
Commercial real estate | 44,436 | 42,622 | 39,172 | 36,684 | 34,825 | ||||||||||||||
Commercial lease financing | 25,427 | 25,115 | 24,846 | 24,584 | 24,486 | ||||||||||||||
Non-U.S. commercial | 66,362 | 68,860 | 67,459 | 66,656 | 59,859 | ||||||||||||||
Other | 3 | 3 | 8 | 8 | 7 | ||||||||||||||
Total average loans and leases | $ | 271,475 | $ | 268,849 | $ | 260,085 | $ | 255,674 | $ | 244,068 | |||||||||
Total Corporation Investment Banking fees | |||||||||||||||||||
Advisory (2) | $ | 286 | $ | 356 | $ | 256 | $ | 262 | $ | 257 | |||||||||
Debt issuance | 1,025 | 986 | 810 | 987 | 1,022 | ||||||||||||||
Equity issuance | 313 | 461 | 329 | 356 | 323 | ||||||||||||||
Total investment banking fees including self-led | 1,624 | 1,803 | 1,395 | 1,605 | 1,602 | ||||||||||||||
Self-led | (82 | ) | (65 | ) | (98 | ) | (49 | ) | (67 | ) | |||||||||
Total Investment Banking fees | $ | 1,542 | $ | 1,738 | $ | 1,297 | $ | 1,556 | $ | 1,535 | |||||||||
(1) | Investment banking fees represent total investment banking fees for Global Banking inclusive of self-led deals and fees included within Business Lending. |
(2) | Advisory includes fees on debt and equity advisory and mergers and acquisitions. |
(3) | Investment banking fees represent only the fee component in Global Banking and do not include certain less significant items shared with the Investment Banking Group under internal revenue sharing agreements. |
(4) | Criticized exposure corresponds to the Special Mention, Substandard and Doubtful asset categories defined by regulatory authorities. The reservable criticized exposure is on an end-of-period basis and is also shown as a percentage of total commercial utilized reservable criticized exposure, including loans and leases, standby letters of credit, financial guarantees, commercial letters of credit and bankers' acceptances. |
(5) | Nonperforming loans, leases and foreclosed properties are on an end-of-period basis. The nonperforming ratio is nonperforming assets divided by loans, leases and foreclosed properties. |
This information is preliminary and based on company data available at the time of the presentation. | 26 |
Bank of America Corporation and Subsidiaries | |||||||||||
Investment Banking Product Rankings | |||||||||||
Three Months Ended March 31, 2014 | |||||||||||
Global | U.S. | ||||||||||
Product Ranking | Market Share | Product Ranking | Market Share | ||||||||
Net investment banking revenue | 3 | 6.8 | % | 2 | 10.0 | % | |||||
Announced mergers and acquisitions | 4 | 20.8 | 4 | 32.3 | |||||||
Equity capital markets | 4 | 7.3 | 5 | 10.3 | |||||||
Debt capital markets | 3 | 6.2 | 2 | 10.9 | |||||||
High-yield corporate debt | 7 | 6.8 | 5 | 8.4 | |||||||
Leveraged loans | 2 | 9.2 | 2 | 10.2 | |||||||
Mortgage-backed securities | 6 | 8.0 | 6 | 8.9 | |||||||
Asset-backed securities | 1 | 16.9 | 1 | 20.1 | |||||||
Convertible debt | 4 | 7.5 | 4 | 10.2 | |||||||
Common stock underwriting | 3 | 7.3 | 3 | 10.3 | |||||||
Investment-grade corporate debt | 1 | 7.2 | 2 | 13.6 | |||||||
Syndicated loans | 2 | 7.9 | 2 | 10.7 | |||||||
• | Rankings based on deal volumes except for net investment banking revenue rankings which reflect fees. |
• | Debt capital markets excludes loans but includes agencies. |
• | Mergers and acquisitions fees included in investment banking revenues reflect 10 percent fee credit at announcement and 90 percent fee credit at completion as per Dealogic. |
• | Mergers and acquisitions volume rankings are for announced transactions and provide credit only to the investment bank advising the parent company that is domiciled within that region. |
• | Each advisor receives full credit for the deal amount unless advising a minor stakeholder. |
Global top 3 rankings in: | ||
Leveraged loans | Investment-grade corporate debt | |
Asset-backed securities | Syndicated loans | |
Common stock underwriting | Debt capital markets | |
U.S. top 3 rankings in: | ||
Leveraged loans | Investment-grade corporate debt | |
Asset-backed securities | Syndicated loans | |
Common stock underwriting | Debt capital markets | |
Global: | Leveraged loans, Asset-backed securities, Common stock underwriting, Investment-grade corporate debt, Syndicated loans, Equity capital markets |
U.S.: | Leveraged loans, Asset-backed securities, Common stock underwriting, Investment-grade corporate debt, Syndicated loans |
This information is preliminary and based on company data available at the time of the presentation. | 27 |
Bank of America Corporation and Subsidiaries | |||||||||||||||||||
Global Markets Segment Results (1) | |||||||||||||||||||
(Dollars in millions) | |||||||||||||||||||
First Quarter 2014 | Fourth Quarter 2013 | Third Quarter 2013 | Second Quarter 2013 | First Quarter 2013 | |||||||||||||||
Net interest income (FTE basis) | $ | 1,000 | $ | 1,143 | $ | 975 | $ | 1,013 | $ | 1,110 | |||||||||
Noninterest income: | |||||||||||||||||||
Investment and brokerage services | 561 | 489 | 480 | 549 | 528 | ||||||||||||||
Investment banking fees | 736 | 755 | 622 | 668 | 679 | ||||||||||||||
Trading account profits | 2,367 | 795 | 1,201 | 1,848 | 2,890 | ||||||||||||||
All other income (loss) | 351 | 28 | (53 | ) | 121 | (427 | ) | ||||||||||||
Total noninterest income | 4,015 | 2,067 | 2,250 | 3,186 | 3,670 | ||||||||||||||
Total revenue, net of interest expense (FTE basis) (2) | 5,015 | 3,210 | 3,225 | 4,199 | 4,780 | ||||||||||||||
Provision for credit losses | 19 | 104 | 47 | (16 | ) | 5 | |||||||||||||
Noninterest expense | 3,078 | 3,280 | 2,882 | 2,770 | 3,074 | ||||||||||||||
Income (loss) before income taxes | 1,918 | (174 | ) | 296 | 1,445 | 1,701 | |||||||||||||
Income tax expense (benefit) (FTE basis) | 608 | (131 | ) | 1,168 | 480 | 589 | |||||||||||||
Net income (loss) | $ | 1,310 | $ | (43 | ) | $ | (872 | ) | $ | 965 | $ | 1,112 | |||||||
Return on average allocated capital (3) | 15.65 | % | n/m | n/m | 12.92 | % | 15.06 | % | |||||||||||
Efficiency ratio (FTE basis) | 61.38 | 102.17 | % | 89.41 | % | 65.98 | 64.30 | ||||||||||||
Balance Sheet | |||||||||||||||||||
Average | |||||||||||||||||||
Total trading-related assets (4) | $ | 437,128 | $ | 438,909 | $ | 442,597 | $ | 490,972 | $ | 504,266 | |||||||||
Total loans and leases | 63,696 | 66,494 | 64,490 | 56,354 | 52,744 | ||||||||||||||
Total earning assets (4) | 456,911 | 458,988 | 458,657 | 499,396 | 509,694 | ||||||||||||||
Total assets | 601,541 | 603,111 | 602,633 | 656,260 | 670,286 | ||||||||||||||
Allocated capital (3) | 34,000 | 30,000 | 30,000 | 30,000 | 30,000 | ||||||||||||||
Period end | |||||||||||||||||||
Total trading-related assets (4) | $ | 430,894 | $ | 411,080 | $ | 438,137 | $ | 446,505 | $ | 467,826 | |||||||||
Total loans and leases | 64,598 | 67,381 | 68,662 | 63,128 | 57,362 | ||||||||||||||
Total earning assets (4) | 455,135 | 432,821 | 464,613 | 465,166 | 480,039 | ||||||||||||||
Total assets | 594,936 | 575,710 | 601,140 | 608,908 | 626,798 | ||||||||||||||
Trading-related assets (average) | |||||||||||||||||||
Trading account securities | $ | 203,281 | $ | 209,734 | $ | 193,108 | $ | 225,796 | $ | 235,437 | |||||||||
Reverse repurchases | 109,271 | 114,417 | 128,426 | 150,568 | 157,847 | ||||||||||||||
Securities borrowed | 80,981 | 67,862 | 73,820 | 62,813 | 57,425 | ||||||||||||||
Derivative assets | 43,595 | 46,896 | 47,243 | 51,795 | 53,557 | ||||||||||||||
Total trading-related assets (4) | $ | 437,128 | $ | 438,909 | $ | 442,597 | $ | 490,972 | $ | 504,266 | |||||||||
(1) | During the first quarter of 2014, the management of structured liabilities and the associated debit valuation adjustment were moved into Global Markets from All Other to better align the performance risk of these instruments. As such, net debit valuation adjustment represents the combined total of net debit valuation adjustment on derivatives and structured liabilities. Prior periods have been reclassified to conform to current period presentation. |
(2) | Substantially all of Global Markets total revenue is sales and trading revenue and investment banking fees, with a small portion related to certain revenue sharing agreements with other business segments. For additional sales and trading revenue information, see page 29. |
(3) | Return on average allocated capital is calculated as net income, adjusted for cost of funds and earnings credits and certain expenses related to intangibles, divided by average allocated capital. Allocated capital and the related return are non-GAAP financial measures. The Corporation believes the use of these non-GAAP financial measures provides additional clarity in assessing the results of the segments. Other companies may define or calculate these measures differently. (See Exhibit A: Non-GAAP Reconciliations - Reconciliations to GAAP Financial Measures on pages 42-45.) |
(4) | Trading-related assets include derivative assets, which are considered non-earning assets. |
This information is preliminary and based on company data available at the time of the presentation. | 28 |
Bank of America Corporation and Subsidiaries | |||||||||||||||||||
Global Markets Key Indicators | |||||||||||||||||||
(Dollars in millions) | |||||||||||||||||||
First Quarter 2014 | Fourth Quarter 2013 | Third Quarter 2013 | Second Quarter 2013 | First Quarter 2013 | |||||||||||||||
Sales and trading revenue (1) | |||||||||||||||||||
Fixed income, currency and commodities | $ | 3,030 | $ | 1,545 | $ | 1,641 | $ | 2,220 | $ | 2,852 | |||||||||
Equities | 1,185 | 822 | 919 | 1,281 | 1,153 | ||||||||||||||
Total sales and trading revenue | $ | 4,215 | $ | 2,367 | $ | 2,560 | $ | 3,501 | $ | 4,005 | |||||||||
Sales and trading revenue, excluding net debit valuation adjustment (2) | |||||||||||||||||||
Fixed income, currency and commodities | $ | 2,950 | $ | 2,080 | $ | 2,033 | $ | 2,259 | $ | 3,001 | |||||||||
Equities | 1,153 | 904 | 970 | 1,194 | 1,149 | ||||||||||||||
Total sales and trading revenue, excluding net debit valuation adjustment | $ | 4,103 | $ | 2,984 | $ | 3,003 | $ | 3,453 | $ | 4,150 | |||||||||
Sales and trading revenue breakdown | |||||||||||||||||||
Net interest income | $ | 912 | $ | 1,059 | $ | 898 | $ | 930 | $ | 1,020 | |||||||||
Commissions | 561 | 489 | 480 | 549 | 528 | ||||||||||||||
Trading | 2,367 | 795 | 1,201 | 1,848 | 2,890 | ||||||||||||||
Other | 375 | 24 | (19 | ) | 174 | (433 | ) | ||||||||||||
Total sales and trading revenue | $ | 4,215 | $ | 2,367 | $ | 2,560 | $ | 3,501 | $ | 4,005 | |||||||||
(1) | Includes Global Banking sales and trading revenue of $85 million for the first quarter of 2014, and $65 million, $108 million, $142 million and $67 million for the fourth, third, second and first quarters of 2013, respectively. |
(2) | For this presentation, sales and trading revenue excludes net debit valuation adjustment gains (losses) which include net debit valuation adjustment on derivatives and structured liabilities, and are presented in the table below. Sales and trading revenue excluding net debit valuation adjustment gains (losses) represents a non-GAAP financial measure. |
First Quarter 2014 | Fourth Quarter 2013 | Third Quarter 2013 | Second Quarter 2013 | First Quarter 2013 | ||||||||||||||||
Net debit valuation adjustment gains (losses) on derivatives: | ||||||||||||||||||||
Fixed income, currency and commodities | $ | (92 | ) | $ | (193 | ) | $ | (266 | ) | $ | 33 | $ | (65 | ) | ||||||
Equities | 7 | (7 | ) | (25 | ) | 5 | 10 | |||||||||||||
Total | $ | (85 | ) | $ | (200 | ) | $ | (291 | ) | $ | 38 | $ | (55 | ) | ||||||
Net debit valuation adjustment gains (losses) on structured liabilities: | ||||||||||||||||||||
Fixed income, currency and commodities | $ | 172 | $ | (342 | ) | $ | (126 | ) | $ | (72 | ) | $ | (84 | ) | ||||||
Equities | 25 | (75 | ) | (26 | ) | 82 | (6 | ) | ||||||||||||
Total | $ | 197 | $ | (417 | ) | $ | (152 | ) | $ | 10 | $ | (90 | ) | |||||||
Total net debit valuation adjustment gains (losses): | ||||||||||||||||||||
Fixed income, currency and commodities | $ | 80 | $ | (535 | ) | $ | (392 | ) | $ | (39 | ) | $ | (149 | ) | ||||||
Equities | 32 | (82 | ) | (51 | ) | 87 | 4 | |||||||||||||
Total | $ | 112 | $ | (617 | ) | $ | (443 | ) | $ | 48 | $ | (145 | ) | |||||||
This information is preliminary and based on company data available at the time of the presentation. | 29 |
Bank of America Corporation and Subsidiaries | |||||||||||||||||||
All Other Results (1) | |||||||||||||||||||
(Dollars in millions) | |||||||||||||||||||
First Quarter 2014 | Fourth Quarter 2013 | Third Quarter 2013 | Second Quarter 2013 | First Quarter 2013 | |||||||||||||||
Net interest income (FTE basis) | $ | (152 | ) | $ | 406 | $ | 36 | $ | 268 | $ | 254 | ||||||||
Noninterest income: | |||||||||||||||||||
Card income | 86 | 83 | 79 | 81 | 85 | ||||||||||||||
Equity investment income | 674 | 393 | 1,122 | 576 | 520 | ||||||||||||||
Gains on sales of debt securities | 357 | 363 | 347 | 452 | 67 | ||||||||||||||
All other loss | (659 | ) | (746 | ) | (565 | ) | (813 | ) | (473 | ) | |||||||||
Total noninterest income | 458 | 93 | 983 | 296 | 199 | ||||||||||||||
Total revenue, net of interest expense (FTE basis) | 306 | 499 | 1,019 | 564 | 453 | ||||||||||||||
Provision for credit losses | (135 | ) | (188 | ) | (549 | ) | (179 | ) | 250 | ||||||||||
Noninterest expense | 1,669 | 999 | 932 | 552 | 1,772 | ||||||||||||||
Income (loss) before income taxes | (1,228 | ) | (312 | ) | 636 | 191 | (1,569 | ) | |||||||||||
Income tax expense (benefit) (FTE basis) | (1,046 | ) | (847 | ) | (101 | ) | (346 | ) | (646 | ) | |||||||||
Net income (loss) | $ | (182 | ) | $ | 535 | $ | 737 | $ | 537 | $ | (923 | ) | |||||||
Balance Sheet | |||||||||||||||||||
Average | |||||||||||||||||||
Total loans and leases | $ | 217,410 | $ | 226,049 | $ | 232,538 | $ | 238,910 | $ | 244,557 | |||||||||
Total assets (2) | 165,541 | 179,447 | 203,609 | 231,321 | 249,648 | ||||||||||||||
Total deposits | 34,152 | 34,029 | 35,126 | 33,774 | 35,550 | ||||||||||||||
Period end | |||||||||||||||||||
Total loans and leases | $ | 213,427 | $ | 220,694 | $ | 229,550 | $ | 234,047 | $ | 241,406 | |||||||||
Total assets (3) | 158,221 | 167,312 | 178,364 | 204,659 | 236,130 | ||||||||||||||
Total deposits | 32,403 | 27,701 | 30,704 | 34,597 | 35,758 | ||||||||||||||
(1) | All Other consists of ALM activities, equity investments, the international consumer card business, liquidating businesses, residual expense allocations and other. ALM activities encompass the whole-loan residential mortgage portfolio and investment securities, interest rate and foreign currency risk management activities including the residual net interest income allocation, the impact of certain allocation methodologies and accounting hedge ineffectiveness. The results of certain ALM activities are allocated to our business segments. Equity investments include Global Principal Investments and certain other investments. Additionally, All Other includes certain residential mortgage loans that are managed by Legacy Assets & Servicing. During the first quarter of 2014, the management of structured liabilities and the associated debit valuation adjustment (previously referred to as fair value adjustments on structured liabilities) were moved into Global Markets from All Other to better align the performance risk of these instruments. Prior periods have been reclassified to conform to current period presentation. |
(2) | Includes elimination of segments’ excess asset allocations to match liabilities (i.e., deposits) and allocated shareholders' equity of $585.2 billion, $564.0 billion, $540.5 billion, $524.5 billion and $526.1 billion for the first quarter of 2014, and the fourth, third, second and first quarters of 2013, respectively. |
(3) | Includes elimination of segments’ excess asset allocations to match liabilities (i.e., deposits) and allocated shareholders' equity of $609.2 billion, $569.8 billion, $557.5 billion, $529.0 billion and $537.0 billion at March 31, 2014, December 31, 2013, September 30, 2013, June 30, 2013 and March 31, 2013, respectively. |
This information is preliminary and based on company data available at the time of the presentation. | 30 |
Bank of America Corporation and Subsidiaries | |||||||||||||||||||
Equity Investments | |||||||||||||||||||
(Dollars in millions) | |||||||||||||||||||
Global Principal Investments Exposures | |||||||||||||||||||
March 31, 2014 | December 31 2013 | Equity Investment Income (Loss) | |||||||||||||||||
Book Value | Unfunded Commitments | Total | Total | First Quarter 2014 | |||||||||||||||
Global Principal Investments: | |||||||||||||||||||
Private Equity Investments | $ | 16 | $ | — | $ | 16 | $ | 20 | $ | 1 | |||||||||
Global Real Estate | 263 | 8 | 271 | 327 | (7 | ) | |||||||||||||
Global Strategic Capital | 614 | 60 | 674 | 855 | (30 | ) | |||||||||||||
Legacy/Other Investments | 409 | — | 409 | 529 | 8 | ||||||||||||||
Total Global Principal Investments | $ | 1,302 | $ | 68 | $ | 1,370 | $ | 1,731 | $ | (28 | ) | ||||||||
Components of Equity Investment Income | |||||||||||||||||||
(Dollars in millions) | |||||||||||||||||||
First Quarter 2014 | Fourth Quarter 2013 | Third Quarter 2013 | Second Quarter 2013 | First Quarter 2013 | |||||||||||||||
Global Principal Investments | $ | (28 | ) | $ | 101 | $ | 122 | $ | 52 | $ | 104 | ||||||||
Strategic and other investments | 702 | 292 | 1,000 | 524 | 416 | ||||||||||||||
Total equity investment income included in All Other | 674 | 393 | 1,122 | 576 | 520 | ||||||||||||||
Total equity investment income included in the business segments | 110 | 81 | 62 | 104 | 43 | ||||||||||||||
Total consolidated equity investment income | $ | 784 | $ | 474 | $ | 1,184 | $ | 680 | $ | 563 | |||||||||
This information is preliminary and based on company data available at the time of the presentation. | 31 |
Bank of America Corporation and Subsidiaries | |||||||||||
Outstanding Loans and Leases | |||||||||||
(Dollars in millions) | |||||||||||
March 31 2014 | December 31 2013 | March 31 2013 | |||||||||
Consumer | |||||||||||
Residential mortgage (1) | $ | 242,977 | $ | 248,066 | $ | 256,804 | |||||
Home equity | 91,476 | 93,672 | 103,338 | ||||||||
U.S. credit card | 87,692 | 92,338 | 90,047 | ||||||||
Non-U.S. credit card | 11,563 | 11,541 | 10,620 | ||||||||
Direct/Indirect consumer (2) | 81,552 | 82,192 | 81,518 | ||||||||
Other consumer (3) | 1,980 | 1,977 | 1,696 | ||||||||
Total consumer loans excluding loans accounted for under the fair value option | 517,240 | 529,786 | 544,023 | ||||||||
Consumer loans accounted for under the fair value option (4) | 2,149 | 2,164 | 1,041 | ||||||||
Total consumer | 519,389 | 531,950 | 545,064 | ||||||||
Commercial | |||||||||||
U.S. commercial (5) | 228,795 | 225,851 | 213,762 | ||||||||
Commercial real estate (6) | 48,840 | 47,893 | 39,060 | ||||||||
Commercial lease financing | 24,649 | 25,199 | 23,467 | ||||||||
Non-U.S. commercial | 85,630 | 89,462 | 82,460 | ||||||||
Total commercial loans excluding loans accounted for under the fair value option | 387,914 | 388,405 | 358,749 | ||||||||
Commercial loans accounted for under the fair value option (4) | 8,914 | 7,878 | 7,779 | ||||||||
Total commercial | 396,828 | 396,283 | 366,528 | ||||||||
Total loans and leases | $ | 916,217 | $ | 928,233 | $ | 911,592 | |||||
(1) | Includes pay option loans of $3.8 billion, $4.4 billion and $6.5 billion and non-U.S. residential mortgage loans of $0, $0 and $86 million at March 31, 2014, December 31, 2013 and March 31, 2013, respectively. The Corporation no longer originates pay option loans. |
(2) | Includes dealer financial services loans of $38.0 billion, $38.5 billion and $36.1 billion, consumer lending loans of $2.3 billion, $2.7 billion and $4.1 billion, U.S. securities-based lending loans of $31.8 billion, $31.2 billion and $28.2 billion, non-U.S. consumer loans of $4.6 billion, $4.7 billion and $7.4 billion, student loans of $3.9 billion, $4.1 billion and $4.6 billion and other consumer loans of $899 million, $1.0 billion and $1.1 billion at March 31, 2014, December 31, 2013 and March 31, 2013, respectively. |
(3) | Includes consumer finance loans of $1.1 billion, $1.2 billion and $1.4 billion, consumer leases of $701 million, $606 million and $222 million, consumer overdrafts of $137 million, $176 million and $115 million and other non-U.S. consumer loans of $5 million, $5 million and $5 million at March 31, 2014, December 31, 2013 and March 31, 2013, respectively. |
(4) | Consumer loans accounted for under the fair value option were residential mortgage loans of $2.0 billion, $2.0 billion and $1.0 billion and home equity loans of $152 million, $147 million and $0 at March 31, 2014, December 31, 2013 and March 31, 2013, respectively. Commercial loans accounted for under the fair value option were U.S. commercial loans of $1.4 billion, $1.5 billion and $2.1 billion and non-U.S. commercial loans of $7.5 billion, $6.4 billion and $5.7 billion at March 31, 2014, December 31, 2013 and March 31, 2013, respectively. |
(5) | Includes U.S. small business commercial loans, including card-related products, of $13.4 billion, $13.3 billion and $12.4 billion at March 31, 2014, December 31, 2013 and March 31, 2013, respectively. |
(6) | Includes U.S. commercial real estate loans of $47.1 billion, $46.3 billion and $37.6 billion and non-U.S. commercial real estate loans of $1.7 billion, $1.6 billion and $1.4 billion at March 31, 2014, December 31, 2013 and March 31, 2013, respectively. |
This information is preliminary and based on company data available at the time of the presentation. | 32 |
Bank of America Corporation and Subsidiaries | ||||||||||||||||||||||||||||
Quarterly Average Loans and Leases by Business Segment | ||||||||||||||||||||||||||||
(Dollars in millions) | ||||||||||||||||||||||||||||
First Quarter 2014 | ||||||||||||||||||||||||||||
Total Corporation | Consumer & Business Banking | Consumer Real Estate Services | GWIM | Global Banking | Global Markets | All Other | ||||||||||||||||||||||
Consumer | ||||||||||||||||||||||||||||
Residential mortgage | $ | 247,556 | $ | 727 | $ | 4,602 | $ | 48,236 | $ | — | $ | — | $ | 193,991 | ||||||||||||||
Home equity | 92,759 | 148 | 84,217 | 6,696 | — | 168 | 1,530 | |||||||||||||||||||||
U.S. credit card | 89,545 | 86,285 | — | 3,260 | — | — | — | |||||||||||||||||||||
Non-U.S. credit card | 11,554 | — | — | — | — | — | 11,554 | |||||||||||||||||||||
Direct/Indirect consumer | 81,728 | 40,758 | 47 | 35,800 | 1 | 45 | 5,077 | |||||||||||||||||||||
Other consumer | 1,962 | 791 | — | 5 | 2 | — | 1,164 | |||||||||||||||||||||
Total consumer | 525,104 | 128,709 | 88,866 | 93,997 | 3 | 213 | 213,316 | |||||||||||||||||||||
Commercial | ||||||||||||||||||||||||||||
U.S. commercial | 228,058 | 32,601 | 48 | 20,094 | 135,247 | 34,719 | 5,349 | |||||||||||||||||||||
Commercial real estate | 48,753 | 723 | — | 1,698 | 44,436 | 1,625 | 271 | |||||||||||||||||||||
Commercial lease financing | 24,727 | — | — | 4 | 25,427 | 836 | (1,540 | ) | ||||||||||||||||||||
Non-U.S. commercial | 92,840 | 9 | — | 152 | 66,362 | 26,303 | 14 | |||||||||||||||||||||
Total commercial | 394,378 | 33,333 | 48 | 21,948 | 271,472 | 63,483 | 4,094 | |||||||||||||||||||||
Total loans and leases | $ | 919,482 | $ | 162,042 | $ | 88,914 | $ | 115,945 | $ | 271,475 | $ | 63,696 | $ | 217,410 | ||||||||||||||
Fourth Quarter 2013 | ||||||||||||||||||||||||||||
Total Corporation | Consumer & Business Banking | Consumer Real Estate Services | GWIM | Global Banking | Global Markets | All Other | ||||||||||||||||||||||
Consumer | ||||||||||||||||||||||||||||
Residential mortgage | $ | 253,974 | $ | 678 | $ | 4,262 | $ | 47,407 | $ | — | $ | 56 | $ | 201,571 | ||||||||||||||
Home equity | 95,388 | 145 | 85,274 | 8,364 | — | 144 | 1,461 | |||||||||||||||||||||
U.S. credit card | 90,057 | 86,746 | — | 3,311 | — | — | — | |||||||||||||||||||||
Non-U.S. credit card | 11,171 | — | — | — | — | — | 11,171 | |||||||||||||||||||||
Direct/Indirect consumer | 82,990 | 42,002 | 45 | 35,094 | 1 | 37 | 5,811 | |||||||||||||||||||||
Other consumer | 1,929 | 707 | — | 5 | 2 | — | 1,215 | |||||||||||||||||||||
Total consumer | 535,509 | 130,278 | 89,581 | 94,181 | 3 | 237 | 221,229 | |||||||||||||||||||||
Commercial | ||||||||||||||||||||||||||||
U.S. commercial | 225,596 | 32,134 | 106 | 19,623 | 132,249 | 35,430 | 6,054 | |||||||||||||||||||||
Commercial real estate | 46,341 | 732 | — | 1,587 | 42,622 | 1,075 | 325 | |||||||||||||||||||||
Commercial lease financing | 24,468 | — | — | 4 | 25,115 | 929 | (1,580 | ) | ||||||||||||||||||||
Non-U.S. commercial | 97,863 | 8 | — | 151 | 68,860 | 28,823 | 21 | |||||||||||||||||||||
Total commercial | 394,268 | 32,874 | 106 | 21,365 | 268,846 | 66,257 | 4,820 | |||||||||||||||||||||
Total loans and leases | $ | 929,777 | $ | 163,152 | $ | 89,687 | $ | 115,546 | $ | 268,849 | $ | 66,494 | $ | 226,049 | ||||||||||||||
First Quarter 2013 | ||||||||||||||||||||||||||||
Total Corporation | Consumer & Business Banking | Consumer Real Estate Services | GWIM | Global Banking | Global Markets | All Other | ||||||||||||||||||||||
Consumer | ||||||||||||||||||||||||||||
Residential mortgage | $ | 258,630 | $ | 499 | $ | 1,332 | $ | 41,509 | $ | — | $ | 90 | $ | 215,200 | ||||||||||||||
Home equity | 105,939 | 144 | 91,509 | 12,674 | — | 84 | 1,528 | |||||||||||||||||||||
U.S. credit card | 91,712 | 91,712 | — | — | — | — | — | |||||||||||||||||||||
Non-U.S. credit card | 11,027 | — | — | — | — | — | 11,027 | |||||||||||||||||||||
Direct/Indirect consumer | 82,364 | 40,604 | 59 | 32,261 | 4 | 3 | 9,433 | |||||||||||||||||||||
Other consumer | 1,666 | 272 | — | 6 | 3 | — | 1,385 | |||||||||||||||||||||
Total consumer | 551,338 | 133,231 | 92,900 | 86,450 | 7 | 177 | 238,573 | |||||||||||||||||||||
Commercial | ||||||||||||||||||||||||||||
U.S. commercial | 210,706 | 30,585 | 63 | 18,122 | 124,891 | 30,013 | 7,032 | |||||||||||||||||||||
Commercial real estate | 39,179 | 2,021 | — | 1,369 | 34,825 | 446 | 518 | |||||||||||||||||||||
Commercial lease financing | 23,534 | — | — | 4 | 24,486 | 694 | (1,650 | ) | ||||||||||||||||||||
Non-U.S. commercial | 81,502 | 8 | — | 137 | 59,859 | 21,414 | 84 | |||||||||||||||||||||
Total commercial | 354,921 | 32,614 | 63 | 19,632 | 244,061 | 52,567 | 5,984 | |||||||||||||||||||||
Total loans and leases | $ | 906,259 | $ | 165,845 | $ | 92,963 | $ | 106,082 | $ | 244,068 | $ | 52,744 | $ | 244,557 | ||||||||||||||
This information is preliminary and based on company data available at the time of the presentation. | 33 |
Bank of America Corporation and Subsidiaries | |||||||||||||||||||||||
Commercial Credit Exposure by Industry (1, 2, 3) | |||||||||||||||||||||||
(Dollars in millions) | |||||||||||||||||||||||
Commercial Utilized | Total Commercial Committed | ||||||||||||||||||||||
March 31 2014 | December 31 2013 | March 31 2013 | March 31 2014 | December 31 2013 | March 31 2013 | ||||||||||||||||||
Diversified financials | $ | 69,137 | $ | 76,673 | $ | 68,098 | $ | 111,172 | $ | 118,092 | $ | 102,132 | |||||||||||
Real estate (4) | 55,613 | 54,336 | 47,513 | 77,337 | 76,418 | 65,855 | |||||||||||||||||
Retailing | 33,836 | 32,859 | 29,337 | 53,902 | 54,616 | 49,757 | |||||||||||||||||
Capital goods | 28,012 | 28,016 | 24,995 | 52,356 | 52,849 | 48,444 | |||||||||||||||||
Banking | 42,296 | 41,399 | 42,442 | 49,821 | 48,078 | 49,082 | |||||||||||||||||
Healthcare equipment and services | 31,854 | 30,828 | 29,107 | 48,681 | 49,063 | 45,556 | |||||||||||||||||
Government and public education | 40,435 | 40,253 | 39,671 | 48,175 | 48,322 | 48,022 | |||||||||||||||||
Materials | 23,163 | 22,384 | 22,243 | 42,291 | 42,699 | 42,264 | |||||||||||||||||
Energy | 19,835 | 19,739 | 21,167 | 39,846 | 41,156 | 40,853 | |||||||||||||||||
Consumer services | 21,147 | 21,080 | 22,193 | 34,010 | 34,217 | 35,195 | |||||||||||||||||
Commercial services and supplies | 19,448 | 19,770 | 18,345 | 31,529 | 32,007 | 29,861 | |||||||||||||||||
Food, beverage and tobacco | 15,359 | 14,437 | 14,909 | 31,379 | 30,541 | 32,936 | |||||||||||||||||
Utilities | 9,404 | 9,253 | 8,900 | 25,346 | 25,243 | 23,104 | |||||||||||||||||
Media | 13,066 | 13,070 | 12,907 | 23,880 | 22,655 | 21,835 | |||||||||||||||||
Transportation | 15,351 | 15,280 | 15,606 | 22,425 | 22,595 | 21,968 | |||||||||||||||||
Individuals and trusts | 15,159 | 14,864 | 14,107 | 18,743 | 18,681 | 18,166 | |||||||||||||||||
Software and services | 6,667 | 6,814 | 5,571 | 13,933 | 14,172 | 11,740 | |||||||||||||||||
Pharmaceuticals and biotechnology | 6,052 | 6,455 | 4,439 | 13,111 | 13,986 | 11,191 | |||||||||||||||||
Technology hardware and equipment | 6,051 | 6,166 | 4,735 | 12,697 | 12,733 | 10,761 | |||||||||||||||||
Insurance, including monolines | 5,473 | 5,926 | 6,800 | 11,744 | 12,203 | 12,503 | |||||||||||||||||
Telecommunication services | 4,654 | 4,541 | 3,689 | 10,328 | 11,423 | 10,191 | |||||||||||||||||
Consumer durables and apparel | 5,797 | 5,427 | 5,198 | 10,002 | 9,757 | 9,362 | |||||||||||||||||
Automobiles and components | 3,303 | 3,165 | 3,349 | 8,601 | 8,424 | 7,702 | |||||||||||||||||
Food and staples retailing | 4,083 | 3,950 | 4,004 | 7,779 | 7,909 | 7,334 | |||||||||||||||||
Religious and social organizations | 5,404 | 5,452 | 6,235 | 7,384 | 7,677 | 8,435 | |||||||||||||||||
Other | 5,167 | 5,357 | 4,721 | 8,097 | 8,309 | 7,706 | |||||||||||||||||
Total commercial credit exposure by industry | $ | 505,766 | $ | 507,494 | $ | 480,281 | $ | 814,569 | $ | 823,825 | $ | 771,955 | |||||||||||
Net credit default protection purchased on total commitments (5) | $ | (8,341 | ) | $ | (8,085 | ) | $ | (12,444 | ) | ||||||||||||||
(1) | Includes loans and leases, standby letters of credit and financial guarantees, derivative assets, assets held-for-sale, commercial letters of credit, bankers' acceptances, securitized assets, foreclosed properties and other collateral acquired. Derivative assets are carried at fair value, reflect the effects of legally enforceable master netting agreements and have been reduced by the amount of cash collateral applied of $42.8 billion, $47.3 billion and $57.7 billion at March 31, 2014, December 31, 2013 and March 31, 2013, respectively. Not reflected in utilized and committed exposure is additional derivative collateral held of $16.1 billion, $17.1 billion and $18.0 billion, which consists primarily of other marketable securities, at March 31, 2014, December 31, 2013 and March 31, 2013, respectively. |
(2) | Total commercial utilized and total commercial committed exposure includes loans and letters of credit accounted for under the fair value option and are comprised of loans outstanding of $8.9 billion, $7.9 billion and $7.8 billion and issued letters of credit at notional value of $576 million, $503 million and $567 million at March 31, 2014, December 31, 2013 and March 31, 2013, respectively. In addition, total commercial committed exposure includes unfunded loan commitments at notional value of $11.3 billion, $12.5 billion and $15.1 billion at March 31, 2014, December 31, 2013 and March 31, 2013, respectively. |
(3) | Includes U.S. small business commercial exposure. |
(4) | Industries are viewed from a variety of perspectives to best isolate the perceived risks. For purposes of this table, the real estate industry is defined based on the borrowers' or counterparties' primary business activity using operating cash flows and primary source of repayment as key factors. |
(5) | Represents net notional credit protection purchased. |
This information is preliminary and based on company data available at the time of the presentation. | 34 |
Bank of America Corporation and Subsidiaries | ||||||
Net Credit Default Protection by Maturity Profile (1) | ||||||
March 31 2014 | December 31 2013 | |||||
Less than or equal to one year | 32 | % | 35 | % | ||
Greater than one year and less than or equal to five years | 64 | 63 | ||||
Greater than five years | 4 | 2 | ||||
Total net credit default protection | 100 | % | 100 | % | ||
(1) | To mitigate the cost of purchasing credit protection, credit exposure can be added by selling credit protection. The distribution of maturities for net credit default protection purchased is shown above. |
Net Credit Default Protection by Credit Exposure Debt Rating (1) | ||||||||||||||
(Dollars in millions) | ||||||||||||||
March 31, 2014 | December 31, 2013 | |||||||||||||
Ratings (2, 3) | Net Notional (4) | Percent of Total | Net Notional (4) | Percent of Total | ||||||||||
AA | $ | (42 | ) | 0.5 | % | $ | (7 | ) | 0.1 | % | ||||
A | (2,173 | ) | 26.1 | (2,560 | ) | 31.7 | ||||||||
BBB | (4,379 | ) | 52.5 | (3,880 | ) | 48.0 | ||||||||
BB | (1,082 | ) | 13.0 | (1,137 | ) | 14.1 | ||||||||
B | (571 | ) | 6.8 | (452 | ) | 5.6 | ||||||||
CCC and below | (130 | ) | 1.6 | (115 | ) | 1.4 | ||||||||
NR (5) | 36 | (0.5 | ) | 66 | (0.9 | ) | ||||||||
Total net credit default protection | $ | (8,341 | ) | 100.0 | % | $ | (8,085 | ) | 100.0 | % | ||||
(1) | To mitigate the cost of purchasing credit protection, credit exposure can be added by selling credit protection. The distribution of debt rating for net notional credit default protection purchased is shown as a negative and the net notional credit protection sold is shown as a positive amount. |
(2) | Ratings are refreshed on a quarterly basis. |
(3) | Ratings of BBB- or higher are considered to meet the definition of investment grade. |
(4) | Represents net credit default protection (purchased) sold. |
(5) | NR is comprised of index positions held and any names that have not been rated. |
This information is preliminary and based on company data available at the time of the presentation. | 35 |
Bank of America Corporation and Subsidiaries | |||||||||||||||||||||||||||||||
Top 20 Non-U.S. Countries Exposure | |||||||||||||||||||||||||||||||
(Dollars in millions) | |||||||||||||||||||||||||||||||
Funded Loans and Loan Equivalents (1) | Unfunded Loan Commitments | Net Counterparty Exposure (2) | Securities/ Other Investments (3) | Country Exposure at March 31 2014 | Hedges and Credit Default Protection (4) | Net Country Exposure at March 31 2014 (5) | Increase (Decrease) from December 31 2013 | ||||||||||||||||||||||||
United Kingdom | $ | 25,526 | $ | 12,766 | $ | 5,994 | $ | 6,929 | $ | 51,215 | $ | (3,913 | ) | $ | 47,302 | $ | 3,716 | ||||||||||||||
Canada | 6,555 | 6,569 | 2,188 | 5,427 | 20,739 | (1,451 | ) | 19,288 | 877 | ||||||||||||||||||||||
Germany | 6,129 | 4,901 | 2,112 | 4,590 | 17,732 | (4,119 | ) | 13,613 | 895 | ||||||||||||||||||||||
China | 10,984 | 461 | 618 | 1,282 | 13,345 | (301 | ) | 13,044 | 123 | ||||||||||||||||||||||
Brazil | 8,930 | 590 | 393 | 3,226 | 13,139 | (222 | ) | 12,917 | (715 | ) | |||||||||||||||||||||
France | 3,500 | 6,595 | 1,204 | 6,007 | 17,306 | (4,485 | ) | 12,821 | 2,658 | ||||||||||||||||||||||
India | 5,929 | 632 | 307 | 3,614 | 10,482 | (82 | ) | 10,400 | 149 | ||||||||||||||||||||||
Australia | 3,722 | 2,106 | 466 | 2,362 | 8,656 | (354 | ) | 8,302 | 305 | ||||||||||||||||||||||
Netherlands | 4,031 | 3,809 | 488 | 1,030 | 9,358 | (1,424 | ) | 7,934 | 299 | ||||||||||||||||||||||
Hong Kong | 5,809 | 344 | 74 | 760 | 6,987 | (101 | ) | 6,886 | 1,529 | ||||||||||||||||||||||
South Korea | 3,901 | 871 | 542 | 1,956 | 7,270 | (571 | ) | 6,699 | 264 | ||||||||||||||||||||||
Switzerland | 2,343 | 2,951 | 641 | 603 | 6,538 | (1,180 | ) | 5,358 | (188 | ) | |||||||||||||||||||||
Russian Federation | 5,709 | 201 | 319 | 68 | 6,297 | (1,084 | ) | 5,213 | (1,509 | ) | |||||||||||||||||||||
Singapore | 3,065 | 167 | 152 | 1,491 | 4,875 | (50 | ) | 4,825 | 996 | ||||||||||||||||||||||
Italy | 2,780 | 2,014 | 2,115 | 1,646 | 8,555 | (4,064 | ) | 4,491 | (711 | ) | |||||||||||||||||||||
Japan | 3,639 | 509 | 1,168 | 1,106 | 6,422 | (2,171 | ) | 4,251 | (3,864 | ) | |||||||||||||||||||||
Taiwan | 2,691 | 100 | 144 | 1,284 | 4,219 | (15 | ) | 4,204 | 132 | ||||||||||||||||||||||
Mexico | 3,058 | 716 | 113 | 334 | 4,221 | (458 | ) | 3,763 | (236 | ) | |||||||||||||||||||||
Spain | 2,999 | 834 | 125 | 584 | 4,542 | (1,585 | ) | 2,957 | (446 | ) | |||||||||||||||||||||
Turkey | 2,188 | 75 | 38 | 111 | 2,412 | (25 | ) | 2,387 | (306 | ) | |||||||||||||||||||||
Total top 20 non-U.S. countries exposure | $ | 113,488 | $ | 47,211 | $ | 19,201 | $ | 44,410 | $ | 224,310 | $ | (27,655 | ) | $ | 196,655 | $ | 3,968 | ||||||||||||||
(1) | Includes loans, leases and other extensions of credit and funds, including letters of credit and due from placements, which have not been reduced by collateral, hedges or credit default protection. Funded loans and loan equivalents are reported net of charge-offs but prior to any allowance for loan and lease losses. |
(2) | Net counterparty exposure includes the fair value of derivatives, including the counterparty risk associated with credit default swaps and secured financing transactions. Derivative exposures are presented net of $32.3 billion in collateral, which is predominantly cash, pledged under legally enforceable master netting agreements. Secured financing transaction exposures are presented net of eligible cash or securities pledged as collateral. The notional amount of reverse repurchase transactions was $95.4 billion. Counterparty exposure is not presented net of hedges or credit default protection. |
(3) | Long securities exposures are netted on a single-name basis to, but not below, zero by short exposures and net credit default swaps purchased, consisting of single-name and net indexed and tranched credit default swaps. |
(4) | Represents credit default protection purchased, net of credit default protection sold, which is used to mitigate the Corporation's risk to country exposures as listed, consisting of net single-name and net indexed and tranched credit default swaps. Amounts are calculated based on the credit default swaps notional amount assuming a zero recovery rate less any fair value receivable or payable. |
(5) | Represents country exposure less hedges and credit default protection purchased, net of credit default protection sold. |
This information is preliminary and based on company data available at the time of the presentation. | 36 |
Bank of America Corporation and Subsidiaries | ||||||||||||||||||||||||||||||||
Select European Countries | ||||||||||||||||||||||||||||||||
(Dollars in millions) | ||||||||||||||||||||||||||||||||
Funded Loans and Loan Equivalents (1) | Unfunded Loan Commitments | Net Counterparty Exposure (2) | Securities/ Other Investments (3) | Country Exposure at March 31 2014 | Hedges and Credit Default Protection (4) | Net Country Exposure at March 31 2014 (5) | Increase (Decrease) from December 31 2013 | |||||||||||||||||||||||||
Greece | ||||||||||||||||||||||||||||||||
Sovereign | $ | — | $ | — | $ | — | $ | 27 | $ | 27 | $ | — | $ | 27 | $ | (31 | ) | |||||||||||||||
Financial institutions | — | — | 1 | 2 | 3 | (18 | ) | (15 | ) | (12 | ) | |||||||||||||||||||||
Corporates | 63 | 68 | — | 8 | 139 | (26 | ) | 113 | 15 | |||||||||||||||||||||||
Total Greece | $ | 63 | $ | 68 | $ | 1 | $ | 37 | $ | 169 | $ | (44 | ) | $ | 125 | $ | (28 | ) | ||||||||||||||
Ireland | ||||||||||||||||||||||||||||||||
Sovereign | $ | 19 | $ | — | $ | 10 | $ | 62 | $ | 91 | $ | (10 | ) | $ | 81 | $ | 86 | |||||||||||||||
Financial institutions | 794 | 27 | 119 | 25 | 965 | (11 | ) | 954 | (26 | ) | ||||||||||||||||||||||
Corporates | 395 | 347 | 77 | 47 | 866 | (22 | ) | 844 | 75 | |||||||||||||||||||||||
Total Ireland | $ | 1,208 | $ | 374 | $ | 206 | $ | 134 | $ | 1,922 | $ | (43 | ) | $ | 1,879 | $ | 135 | |||||||||||||||
Italy | ||||||||||||||||||||||||||||||||
Sovereign | $ | 20 | $ | — | $ | 1,790 | $ | 1,293 | $ | 3,103 | $ | (2,091 | ) | $ | 1,012 | $ | 1,225 | |||||||||||||||
Financial institutions | 1,484 | 3 | 178 | 64 | 1,729 | (1,078 | ) | 651 | (759 | ) | ||||||||||||||||||||||
Corporates | 1,276 | 2,011 | 147 | 289 | 3,723 | (895 | ) | 2,828 | (1,177 | ) | ||||||||||||||||||||||
Total Italy | $ | 2,780 | $ | 2,014 | $ | 2,115 | $ | 1,646 | $ | 8,555 | $ | (4,064 | ) | $ | 4,491 | $ | (711 | ) | ||||||||||||||
Portugal | ||||||||||||||||||||||||||||||||
Sovereign | $ | — | $ | — | $ | 17 | $ | 144 | $ | 161 | $ | (35 | ) | $ | 126 | $ | 103 | |||||||||||||||
Financial institutions | 13 | — | 1 | — | 14 | (50 | ) | (36 | ) | 66 | ||||||||||||||||||||||
Corporates | 90 | 103 | — | 50 | 243 | (217 | ) | 26 | 85 | |||||||||||||||||||||||
Total Portugal | $ | 103 | $ | 103 | $ | 18 | $ | 194 | $ | 418 | $ | (302 | ) | $ | 116 | $ | 254 | |||||||||||||||
Spain | ||||||||||||||||||||||||||||||||
Sovereign | $ | 36 | $ | — | $ | 66 | $ | 7 | $ | 109 | $ | (293 | ) | $ | (184 | ) | $ | (123 | ) | |||||||||||||
Financial institutions | 1,157 | 1 | 22 | 105 | 1,285 | (281 | ) | 1,004 | 56 | |||||||||||||||||||||||
Corporates | 1,806 | 833 | 37 | 472 | 3,148 | (1,011 | ) | 2,137 | (379 | ) | ||||||||||||||||||||||
Total Spain | $ | 2,999 | $ | 834 | $ | 125 | $ | 584 | $ | 4,542 | $ | (1,585 | ) | $ | 2,957 | $ | (446 | ) | ||||||||||||||
Total | ||||||||||||||||||||||||||||||||
Sovereign | $ | 75 | $ | — | $ | 1,883 | $ | 1,533 | $ | 3,491 | $ | (2,429 | ) | $ | 1,062 | $ | 1,260 | |||||||||||||||
Financial institutions | 3,448 | 31 | 321 | 196 | 3,996 | (1,438 | ) | 2,558 | (675 | ) | ||||||||||||||||||||||
Corporates | 3,630 | 3,362 | 261 | 866 | 8,119 | (2,171 | ) | 5,948 | (1,381 | ) | ||||||||||||||||||||||
Total select European exposure | $ | 7,153 | $ | 3,393 | $ | 2,465 | $ | 2,595 | $ | 15,606 | $ | (6,038 | ) | $ | 9,568 | $ | (796 | ) | ||||||||||||||
(1) | Includes loans, leases and other extensions of credit and funds, including letters of credit and due from placements, which have not been reduced by collateral, hedges or credit default protection. Funded loans and loan equivalents are reported net of charge-offs but prior to any allowance for loan and lease losses. |
(2) | Net counterparty exposure includes the fair value of derivatives, including the counterparty risk associated with credit default swaps, and secured financing transactions. Derivative exposures are presented net of $1.6 billion in collateral, which is predominantly cash, pledged under legally enforceable master netting agreements. Secured financing transaction exposures are presented net of eligible cash or securities pledged as collateral. The notional amount of reverse repurchase transactions was $4.9 billion. Counterparty exposure is not presented net of hedges or credit default protection. |
(3) | Long securities exposures are netted on a single-name basis to, but not below, zero by short exposures of $4.3 billion and net credit default swaps purchased of $807 million, consisting of $435 million of net single-name credit default swaps purchased and $372 million of net indexed and tranched credit default swaps sold. |
(4) | Represents credit default protection purchased, net of credit default protection sold, which is used to mitigate the Corporation's risk to country exposures as listed, includes $3.6 billion to hedge loans and securities, consisting of $2.0 billion in net single-name credit default swaps purchased and $1.6 billion in net indexed and tranched credit default swaps purchased, $2.4 billion in additional credit default protection purchased to hedge derivative assets and $120 million in other short exposures. Amounts are calculated based on the credit default swaps notional amount assuming a zero recovery rate less any fair value receivable or payable. |
(5) | Represents country exposure less hedges and credit default protection purchased, net of credit default protection sold. |
This information is preliminary and based on company data available at the time of the presentation. | 37 |
Bank of America Corporation and Subsidiaries | ||||||||||||||||||||
Nonperforming Loans, Leases and Foreclosed Properties | ||||||||||||||||||||
(Dollars in millions) | ||||||||||||||||||||
March 31 2014 | December 31 2013 | September 30 2013 | June 30 2013 | March 31 2013 | ||||||||||||||||
Residential mortgage | $ | 11,611 | $ | 11,712 | $ | 13,328 | $ | 14,316 | $ | 15,001 | ||||||||||
Home equity | 4,185 | 4,075 | 4,176 | 4,151 | 4,196 | |||||||||||||||
Direct/Indirect consumer | 32 | 35 | 59 | 72 | 84 | |||||||||||||||
Other consumer | 16 | 18 | 18 | 1 | 1 | |||||||||||||||
Total consumer | 15,844 | 15,840 | 17,581 | 18,540 | 19,282 | |||||||||||||||
U.S. commercial | 841 | 819 | 1,059 | 1,279 | 1,354 | |||||||||||||||
Commercial real estate | 300 | 322 | 488 | 627 | 1,139 | |||||||||||||||
Commercial lease financing | 10 | 16 | 49 | 10 | 19 | |||||||||||||||
Non-U.S. commercial | 18 | 64 | 86 | 80 | 112 | |||||||||||||||
1,169 | 1,221 | 1,682 | 1,996 | 2,624 | ||||||||||||||||
U.S. small business commercial | 96 | 88 | 103 | 107 | 110 | |||||||||||||||
Total commercial | 1,265 | 1,309 | 1,785 | 2,103 | 2,734 | |||||||||||||||
Total nonperforming loans and leases | 17,109 | 17,149 | 19,366 | 20,643 | 22,016 | |||||||||||||||
Foreclosed properties (1) | 623 | 623 | 662 | 637 | 826 | |||||||||||||||
Total nonperforming loans, leases and foreclosed properties (2, 3, 4) | $ | 17,732 | $ | 17,772 | $ | 20,028 | $ | 21,280 | $ | 22,842 | ||||||||||
Fully-insured home loans past due 30 days or more and still accruing | $ | 18,098 | $ | 20,681 | $ | 21,797 | $ | 24,072 | $ | 24,733 | ||||||||||
Consumer credit card past due 30 days or more and still accruing | 2,115 | 2,321 | 2,376 | 2,487 | 2,847 | |||||||||||||||
Other loans past due 30 days or more and still accruing | 5,472 | 5,416 | 5,512 | 5,587 | 6,147 | |||||||||||||||
Total loans past due 30 days or more and still accruing (3, 5, 6) | $ | 25,685 | $ | 28,418 | $ | 29,685 | $ | 32,146 | $ | 33,727 | ||||||||||
Fully-insured home loans past due 90 days or more and still accruing | $ | 15,125 | $ | 16,961 | $ | 17,960 | $ | 20,604 | $ | 21,617 | ||||||||||
Consumer credit card past due 90 days or more and still accruing | 1,090 | 1,184 | 1,191 | 1,325 | 1,541 | |||||||||||||||
Other loans past due 90 days or more and still accruing | 649 | 614 | 723 | 662 | 655 | |||||||||||||||
Total loans past due 90 days or more and still accruing (3, 5, 6) | $ | 16,864 | $ | 18,759 | $ | 19,874 | $ | 22,591 | $ | 23,813 | ||||||||||
Nonperforming loans, leases and foreclosed properties/Total assets (7) | 0.83 | % | 0.85 | % | 0.95 | % | 1.01 | % | 1.05 | % | ||||||||||
Nonperforming loans, leases and foreclosed properties/Total loans, leases and foreclosed properties (7) | 1.96 | 1.93 | 2.17 | 2.33 | 2.53 | |||||||||||||||
Nonperforming loans and leases/Total loans and leases (7) | 1.89 | 1.87 | 2.10 | 2.26 | 2.44 | |||||||||||||||
Commercial utilized reservable criticized exposure (8) | $ | 12,781 | $ | 12,861 | $ | 14,086 | $ | 14,928 | $ | 15,006 | ||||||||||
Commercial utilized reservable criticized exposure/Commercial utilized reservable exposure (8) | 3.01 | % | 3.02 | % | 3.31 | % | 3.62 | % | 3.75 | % | ||||||||||
Total commercial utilized criticized exposure/Commercial utilized exposure (8) | 3.21 | 3.08 | 3.48 | 3.64 | 4.08 | |||||||||||||||
(1) | Foreclosed property balances do not include loans that are insured by the Federal Housing Administration and have entered foreclosure of $1.1 billion, $1.4 billion, $1.6 billion, $1.6 billion and $2.3 billion at March 31, 2014, December 31, 2013, September 30, 2013, June 30, 2013 and March 31, 2013, respectively. |
(2) | Balances do not include past due consumer credit card, consumer loans secured by real estate where repayments are insured by the Federal Housing Administration and individually insured long-term stand-by agreements (fully-insured home loans), and in general, other consumer and commercial loans not secured by real estate. |
(3) | Balances do not include purchased credit-impaired loans even though the customer may be contractually past due. Purchased credit-impaired loans were recorded at fair value upon acquisition and accrete interest income over the remaining life of the loan. |
(4) Balances do not include the following: | March 31 2014 | December 31 2013 | September 30 2013 | June 30 2013 | March 31 2013 | |||||||||||||||
Nonperforming loans held-for-sale | $ | 293 | $ | 672 | $ | 972 | $ | 891 | $ | 1,050 | ||||||||||
Nonperforming loans accounted for under the fair value option | 431 | 448 | 467 | 398 | 412 | |||||||||||||||
Nonaccruing troubled debt restructured loans removed from the purchased credit-impaired portfolio prior to January 1, 2010 | 257 | 260 | 356 | 485 | 512 | |||||||||||||||
(5) | Balances do not include loans held-for-sale past due 30 days or more and still accruing of $80 million, $106 million, $301 million, $374 million and $315 million at March 31, 2014, December 31, 2013, September 30, 2013, June 30, 2013 and March 31, 2013, respectively, and loans held-for-sale past due 90 days or more and still accruing of $6 million, $8 million, $0, $17 million and $18 million at March 31, 2014, December 31, 2013, September 30, 2013, June 30, 2013 and March 31, 2013, respectively. At March 31, 2014, December 31, 2013, September 30, 2013, June 30, 2013 and March 31, 2013, there were $129 million, $158 million, $153 million, $81 million and $83 million, respectively, of loans accounted for under the fair value option past due 30 days or more and still accruing interest. |
(6) | These balances are excluded from total nonperforming loans, leases and foreclosed properties. |
(7) | Total assets and total loans and leases do not include loans accounted for under the fair value option of $11.1 billion, $10.0 billion, $10.2 billion, $9.5 billion and $8.8 billion at March 31, 2014, December 31, 2013, September 30, 2013, June 30, 2013 and March 31, 2013, respectively. |
(8) | Criticized exposure corresponds to the Special Mention, Substandard and Doubtful asset categories defined by regulatory authorities. The reservable criticized exposure excludes loans held-for-sale, exposure accounted for under the fair value option and other nonreservable exposure. |
This information is preliminary and based on company data available at the time of the presentation. | 38 |
Bank of America Corporation and Subsidiaries | ||||||||||||||||||||
Nonperforming Loans, Leases and Foreclosed Properties Activity (1) | ||||||||||||||||||||
(Dollars in millions) | ||||||||||||||||||||
First Quarter 2014 | Fourth Quarter 2013 | Third Quarter 2013 | Second Quarter 2013 | First Quarter 2013 | ||||||||||||||||
Nonperforming Consumer Loans and Leases: | ||||||||||||||||||||
Balance, beginning of period | $ | 15,840 | $ | 17,581 | $ | 18,540 | $ | 19,282 | $ | 19,431 | ||||||||||
Additions to nonperforming loans and leases: | ||||||||||||||||||||
New nonperforming loans and leases | 2,027 | 2,199 | 2,503 | 2,289 | 2,661 | |||||||||||||||
Reductions to nonperforming loans and leases: | ||||||||||||||||||||
Paydowns and payoffs | (468 | ) | (863 | ) | (544 | ) | (695 | ) | (680 | ) | ||||||||||
Sales | — | (729 | ) | (624 | ) | (175 | ) | — | ||||||||||||
Returns to performing status (2) | (800 | ) | (1,112 | ) | (1,079 | ) | (1,139 | ) | (943 | ) | ||||||||||
Charge-offs (3) | (583 | ) | (752 | ) | (758 | ) | (932 | ) | (1,072 | ) | ||||||||||
Transfers to foreclosed properties | (172 | ) | (147 | ) | (131 | ) | (90 | ) | (115 | ) | ||||||||||
Transfers to loans held-for-sale | — | (337 | ) | (326 | ) | — | — | |||||||||||||
Total net additions (reductions) to nonperforming loans and leases | 4 | (1,741 | ) | (959 | ) | (742 | ) | (149 | ) | |||||||||||
Total nonperforming consumer loans and leases, end of period | 15,844 | 15,840 | 17,581 | 18,540 | 19,282 | |||||||||||||||
Foreclosed properties | 538 | 533 | 546 | 508 | 620 | |||||||||||||||
Nonperforming consumer loans, leases and foreclosed properties, end of period | $ | 16,382 | $ | 16,373 | $ | 18,127 | $ | 19,048 | $ | 19,902 | ||||||||||
Nonperforming Commercial Loans and Leases (4): | ||||||||||||||||||||
Balance, beginning of period | $ | 1,309 | $ | 1,785 | $ | 2,103 | $ | 2,734 | $ | 3,224 | ||||||||||
Additions to nonperforming loans and leases: | ||||||||||||||||||||
New nonperforming loans and leases | 262 | 143 | 350 | 269 | 350 | |||||||||||||||
Advances | 8 | 12 | 9 | 3 | 6 | |||||||||||||||
Reductions to nonperforming loans and leases: | ||||||||||||||||||||
Paydowns | (171 | ) | (322 | ) | (380 | ) | (312 | ) | (328 | ) | ||||||||||
Sales | (27 | ) | (92 | ) | (88 | ) | (171 | ) | (147 | ) | ||||||||||
Return to performing status (5) | (63 | ) | (87 | ) | (91 | ) | (243 | ) | (167 | ) | ||||||||||
Charge-offs | (50 | ) | (98 | ) | (104 | ) | (170 | ) | (177 | ) | ||||||||||
Transfers to foreclosed properties | (3 | ) | (12 | ) | (14 | ) | (7 | ) | (21 | ) | ||||||||||
Transfers to loans held-for-sale | — | (20 | ) | — | — | (6 | ) | |||||||||||||
Total net reductions to nonperforming loans and leases | (44 | ) | (476 | ) | (318 | ) | (631 | ) | (490 | ) | ||||||||||
Total nonperforming commercial loans and leases, end of period | 1,265 | 1,309 | 1,785 | 2,103 | 2,734 | |||||||||||||||
Foreclosed properties | 85 | 90 | 116 | 129 | 206 | |||||||||||||||
Nonperforming commercial loans, leases and foreclosed properties, end of period | $ | 1,350 | $ | 1,399 | $ | 1,901 | $ | 2,232 | $ | 2,940 | ||||||||||
(1) | For amounts excluded from nonperforming loans, leases and foreclosed properties, see footnotes to Nonperforming Loans, Leases and Foreclosed Properties table on page 38. |
(2) | Consumer loans and leases may be returned to performing status when all principal and interest is current and full repayment of the remaining contractual principal and interest is expected, or when the loan otherwise becomes well-secured and is in the process of collection. Certain troubled debt restructurings are classified as nonperforming at the time of restructuring and may only be returned to performing status after considering the borrower's sustained repayment performance for a reasonable period, generally six months. |
(3) | Our policy is not to classify consumer credit card and non-bankruptcy related consumer loans not secured by real estate as nonperforming; therefore, the charge-offs on these loans have no impact on nonperforming activity and, accordingly, are excluded from this table. |
(4) | Includes U.S. small business commercial activity. Small business card loans are excluded as they are not classified as nonperforming. |
(5) | Commercial loans and leases may be returned to performing status when all principal and interest is current and full repayment of the remaining contractual principal and interest is expected or when the loan otherwise becomes well-secured and is in the process of collection. Troubled debt restructurings are generally classified as performing after a sustained period of demonstrated payment performance. |
This information is preliminary and based on company data available at the time of the presentation. | 39 |
Bank of America Corporation and Subsidiaries | ||||||||||||||||||||||||||||||||||
Quarterly Net Charge-offs and Net Charge-off Ratios (1, 2) | ||||||||||||||||||||||||||||||||||
(Dollars in millions) | ||||||||||||||||||||||||||||||||||
First Quarter 2014 | Fourth Quarter 2013 | Third Quarter 2013 | Second Quarter 2013 | First Quarter 2013 | ||||||||||||||||||||||||||||||
Net Charge-offs | Amount | Percent | Amount | Percent | Amount | Percent | Amount | Percent | Amount | Percent | ||||||||||||||||||||||||
Residential mortgage (3) | $ | 127 | 0.21 | % | $ | 209 | 0.33 | % | $ | 221 | 0.35 | % | $ | 271 | 0.43 | % | $ | 383 | 0.60 | % | ||||||||||||||
Home equity (3) | 302 | 1.32 | 331 | 1.38 | 302 | 1.22 | 486 | 1.92 | 684 | 2.62 | ||||||||||||||||||||||||
U.S. credit card | 718 | 3.25 | 724 | 3.19 | 788 | 3.47 | 917 | 4.10 | 947 | 4.19 | ||||||||||||||||||||||||
Non-U.S. credit card | 76 | 2.66 | 94 | 3.34 | 89 | 3.32 | 104 | 3.93 | 112 | 4.14 | ||||||||||||||||||||||||
Direct/Indirect consumer | 58 | 0.29 | 73 | 0.35 | 62 | 0.30 | 86 | 0.42 | 124 | 0.61 | ||||||||||||||||||||||||
Other consumer | 58 | 12.07 | 66 | 13.58 | 65 | 13.75 | 51 | 11.57 | 52 | 12.76 | ||||||||||||||||||||||||
Total consumer (3) | 1,339 | 1.04 | 1,497 | 1.11 | 1,527 | 1.12 | 1,915 | 1.42 | 2,302 | 1.70 | ||||||||||||||||||||||||
U.S. commercial (4) | 5 | 0.01 | (28 | ) | (0.05 | ) | 68 | 0.13 | 43 | 0.09 | 45 | 0.09 | ||||||||||||||||||||||
Commercial real estate | (37 | ) | (0.31 | ) | 1 | — | 11 | 0.11 | 44 | 0.43 | 93 | 0.96 | ||||||||||||||||||||||
Commercial lease financing | (2 | ) | (0.04 | ) | (2 | ) | (0.03 | ) | (8 | ) | (0.13 | ) | (5 | ) | (0.08 | ) | (10 | ) | (0.18 | ) | ||||||||||||||
Non-U.S. commercial | 19 | 0.09 | 46 | 0.20 | (2 | ) | (0.01 | ) | 16 | 0.08 | (15 | ) | (0.08 | ) | ||||||||||||||||||||
(15 | ) | (0.02 | ) | 17 | 0.02 | 69 | 0.08 | 98 | 0.11 | 113 | 0.14 | |||||||||||||||||||||||
U.S. small business commercial | 64 | 1.95 | 68 | 2.07 | 91 | 2.86 | 98 | 3.15 | 102 | 3.33 | ||||||||||||||||||||||||
Total commercial | 49 | 0.05 | 85 | 0.09 | 160 | 0.17 | 196 | 0.22 | 215 | 0.25 | ||||||||||||||||||||||||
Total net charge-offs (3) | $ | 1,388 | 0.62 | $ | 1,582 | 0.68 | $ | 1,687 | 0.73 | $ | 2,111 | 0.94 | $ | 2,517 | 1.14 | |||||||||||||||||||
By Business Segment | ||||||||||||||||||||||||||||||||||
Consumer & Business Banking | $ | 881 | 2.20 | % | $ | 922 | 2.24 | % | $ | 1,027 | 2.46 | % | $ | 1,158 | 2.84 | % | $ | 1,241 | 3.03 | % | ||||||||||||||
Consumer Real Estate Services | 294 | 1.36 | 323 | 1.45 | 281 | 1.28 | 465 | 2.09 | 660 | 2.91 | ||||||||||||||||||||||||
Global Wealth & Investment Management | 25 | 0.09 | 35 | 0.12 | 26 | 0.09 | 51 | 0.19 | 61 | 0.23 | ||||||||||||||||||||||||
Global Banking | (17 | ) | (0.03 | ) | 7 | 0.01 | 35 | 0.05 | 78 | 0.12 | 68 | 0.12 | ||||||||||||||||||||||
Global Markets | (1 | ) | (0.01 | ) | 1 | 0.01 | — | — | (1 | ) | — | 2 | 0.01 | |||||||||||||||||||||
All Other | 206 | 0.39 | 294 | 0.52 | 318 | 0.54 | 360 | 0.60 | 485 | 0.80 | ||||||||||||||||||||||||
Total net charge-offs | $ | 1,388 | 0.62 | $ | 1,582 | 0.68 | $ | 1,687 | 0.73 | $ | 2,111 | 0.94 | $ | 2,517 | 1.14 | |||||||||||||||||||
(1) | Net charge-off ratios are calculated as annualized net charge-offs divided by average outstanding loans and leases excluding loans accounted for under the fair value option during the period for each loan and lease category. Excluding the purchased credit-impaired loan portfolio, total annualized net charge-offs as a percentage of total average loans and leases outstanding were 0.64, 0.70, 0.75, 0.97 and 1.18 for the three months ended March 31, 2014, December 31, 2013, September 30, 2013, June 30, 2013 and March 31, 2013, respectively. |
(2) | Excludes write-offs of purchased credit-impaired loans of $391 million, $741 million, $443 million, $313 million and $839 million for the three months ended March 31, 2014, December 31, 2013, September 30, 2013, June 30, 2013 and March 31, 2013, respectively. Including the write-offs of purchased credit-impaired loans, total annualized net charge-offs and purchased credit-impaired write-offs as a percentage of total average loans and leases outstanding were 0.79, 1.00, 0.92, 1.07 and 1.52 for the three months ended March 31, 2014, December 31, 2013, September 30, 2013, June 30, 2013 and March 31, 2013, respectively. |
(3) | Includes the impact of a clarification of regulatory guidance on accounting for troubled debt restructurings of $56 million for residential mortgage loans and $88 million for home equity loans for the three months ended December 31, 2013. Excluding this impact, annualized net charge-offs as a percentage of total average loans and leases outstanding were 0.24 for residential mortgage loans, 1.01 for home equity loans, 1.01 for total consumer loans and 0.62 for total net charge-offs for the three months ended December 31, 2013. |
(4) | Excludes U.S. small business commercial loans. |
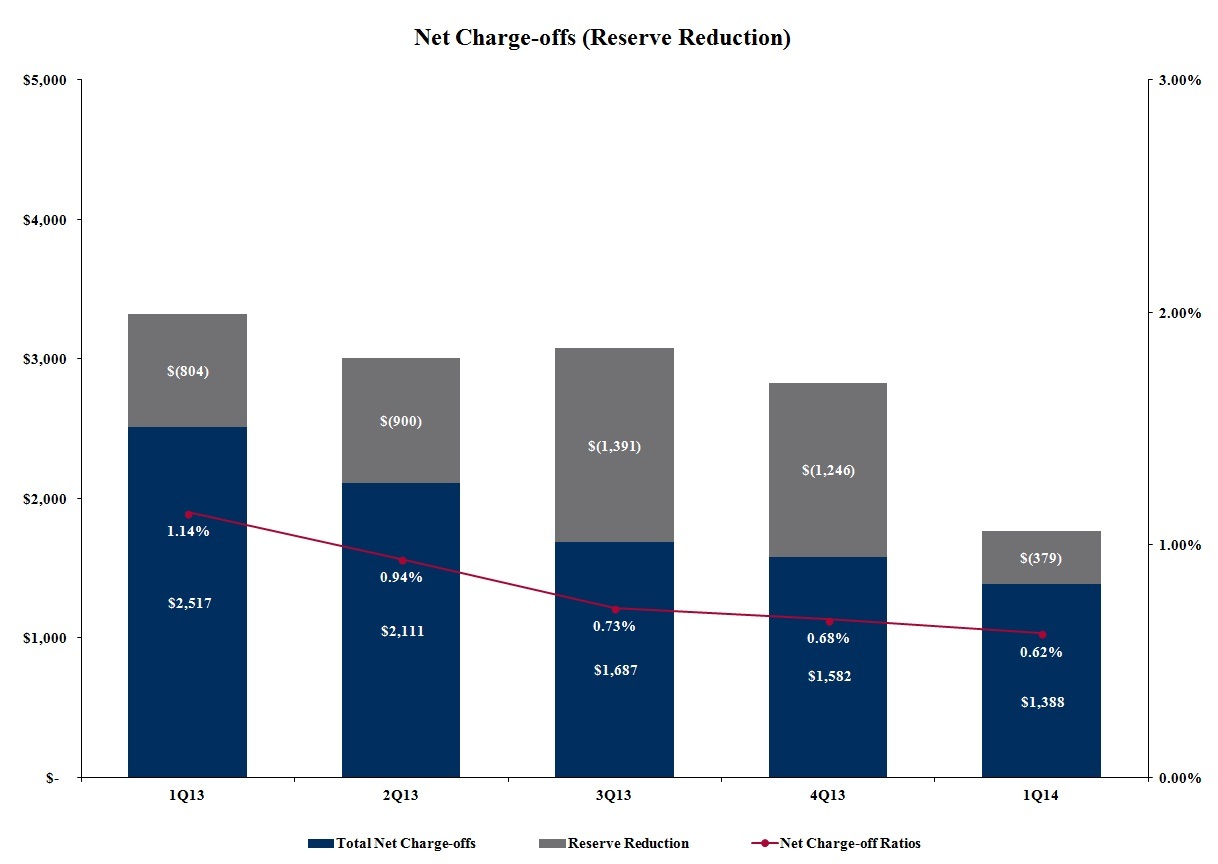
This information is preliminary and based on company data available at the time of the presentation. | 40 |
Bank of America Corporation and Subsidiaries | ||||||||||||||||||||||||||||||
Allocation of the Allowance for Credit Losses by Product Type | ||||||||||||||||||||||||||||||
(Dollars in millions) | ||||||||||||||||||||||||||||||
March 31, 2014 | December 31, 2013 | March 31, 2013 | ||||||||||||||||||||||||||||
Allowance for loan and lease losses | Amount | Percent of Total | Percent of Loans and Leases Outstanding (1) | Amount | Percent of Total | Percent of Loans and Leases Outstanding (1) | Amount | Percent of Total | Percent of Loans and Leases Outstanding (1) | |||||||||||||||||||||
Residential mortgage | $ | 3,502 | 21.07 | % | 1.44 | % | $ | 4,084 | 23.43 | % | 1.65 | % | $ | 6,731 | 29.99 | % | 2.62 | % | ||||||||||||
Home equity | 4,054 | 24.40 | 4.43 | 4,434 | 25.44 | 4.73 | 6,707 | 29.89 | 6.50 | |||||||||||||||||||||
U.S. credit card | 3,857 | 23.21 | 4.40 | 3,930 | 22.55 | 4.26 | 4,506 | 20.08 | 5.00 | |||||||||||||||||||||
Non-U.S. credit card | 432 | 2.60 | 3.74 | 459 | 2.63 | 3.98 | 572 | 2.55 | 5.38 | |||||||||||||||||||||
Direct/Indirect consumer | 389 | 2.34 | 0.48 | 417 | 2.39 | 0.51 | 690 | 3.08 | 0.85 | |||||||||||||||||||||
Other consumer | 97 | 0.58 | 4.86 | 99 | 0.58 | 5.02 | 106 | 0.47 | 6.24 | |||||||||||||||||||||
Total consumer | 12,331 | 74.20 | 2.38 | 13,423 | 77.02 | 2.53 | 19,312 | 86.06 | 3.55 | |||||||||||||||||||||
U.S. commercial (2) | 2,563 | 15.43 | 1.12 | 2,394 | 13.74 | 1.06 | 1,866 | 8.31 | 0.87 | |||||||||||||||||||||
Commercial real estate | 972 | 5.85 | 1.99 | 917 | 5.26 | 1.91 | 815 | 3.63 | 2.09 | |||||||||||||||||||||
Commercial lease financing | 122 | 0.73 | 0.50 | 118 | 0.68 | 0.47 | 85 | 0.38 | 0.36 | |||||||||||||||||||||
Non-U.S. commercial | 630 | 3.79 | 0.74 | 576 | 3.30 | 0.64 | 363 | 1.62 | 0.44 | |||||||||||||||||||||
Total commercial (3) | 4,287 | 25.80 | 1.11 | 4,005 | 22.98 | 1.03 | 3,129 | 13.94 | 0.87 | |||||||||||||||||||||
Allowance for loan and lease losses | 16,618 | 100.00 | % | 1.84 | 17,428 | 100.00 | % | 1.90 | 22,441 | 100.00 | % | 2.49 | ||||||||||||||||||
Reserve for unfunded lending commitments | 509 | 484 | 486 | |||||||||||||||||||||||||||
Allowance for credit losses | $ | 17,127 | $ | 17,912 | $ | 22,927 | ||||||||||||||||||||||||
Asset Quality Indicators | ||||||||||||||||||||||||||||||
Allowance for loan and lease losses/Total loans and leases (4) | 1.84 | % | 1.90 | % | 2.49 | % | ||||||||||||||||||||||||
Allowance for loan and lease losses (excluding the valuation allowance for purchased credit-impaired loans)/Total loans and leases (excluding purchased credit-impaired loans) (4, 5) | 1.65 | 1.67 | 2.06 | |||||||||||||||||||||||||||
Allowance for loan and lease losses/Total nonperforming loans and leases (6) | 97 | 102 | 102 | |||||||||||||||||||||||||||
Allowance for loan and lease losses (excluding the valuation allowance for purchased credit-impaired loans)/Total nonperforming loans and leases (5) | 85 | 87 | 82 | |||||||||||||||||||||||||||
Ratio of the allowance for loan and lease losses/Annualized net charge-offs (7) | 2.95 | 2.78 | 2.20 | |||||||||||||||||||||||||||
Ratio of the allowance for loan and lease losses (excluding purchased credit-impaired loans)/Annualized net charge-offs (5) | 2.58 | 2.38 | 1.76 | |||||||||||||||||||||||||||
Ratio of the allowance for loan and lease losses/Annualized net charge-offs and purchased credit-impaired write-offs | 2.30 | 1.89 | 1.65 | |||||||||||||||||||||||||||
(1) | Ratios are calculated as allowance for loan and lease losses as a percentage of loans and leases outstanding excluding loans accounted for under the fair value option. Consumer loans accounted for under the fair value option included residential mortgage loans of $2.0 billion, $2.0 billion and $1.0 billion and home equity loans of $152 million, $147 million and $0 at March 31, 2014, December 31, 2013 and March 31, 2013, respectively. Commercial loans accounted for under the fair value option included U.S. commercial loans of $1.4 billion, $1.5 billion and $2.1 billion and non-U.S. commercial loans of $7.5 billion, $6.4 billion and $5.7 billion at March 31, 2014, December 31, 2013 and March 31, 2013, respectively. |
(2) | Includes allowance for loan and lease losses for U.S. small business commercial loans of $462 million, $462 million and $611 million at March 31, 2014, December 31, 2013 and March 31, 2013, respectively. |
(3) | Includes allowance for loan and lease losses for impaired commercial loans of $277 million, $277 million and $408 million at March 31, 2014, December 31, 2013 and March 31, 2013, respectively. |
(4) | Total loans and leases do not include loans accounted for under the fair value option of $11.1 billion, $10.0 billion and $8.8 billion at March 31, 2014, December 31, 2013 and March 31, 2013, respectively. |
(5) | Excludes valuation allowance on purchased credit-impaired loans of $2.1 billion, $2.5 billion and $4.5 billion at March 31, 2014, December 31, 2013 and March 31, 2013, respectively. |
(6) | Allowance for loan and lease losses includes $7.1 billion, $7.7 billion and $10.7 billion allocated to products (primarily the Consumer Lending portfolios within Consumer & Business Banking and purchased credit-impaired loans) that are excluded from nonperforming loans and leases at March 31, 2014, December 31, 2013 and March 31, 2013, respectively. Excluding these amounts, allowance for loan and lease losses as a percentage of total nonperforming loans and leases was 55 percent, 57 percent and 53 percent at March 31, 2014, December 31, 2013 and March 31, 2013, respectively. |
(7) | Net charge-offs exclude $391 million, $741 million and $839 million of write-offs in the purchased credit-impaired loan portfolio at March 31, 2014, December 31, 2013 and March 31, 2013. These write-offs decreased the purchased credit-impaired valuation allowance included as part of the allowance for loan and lease losses. |
This information is preliminary and based on company data available at the time of the presentation. | 41 |
Exhibit A: Non-GAAP Reconciliations | |||||
Bank of America Corporation and Subsidiaries | |||||
Reconciliations to GAAP Financial Measures | |||||
(Dollars in millions) | |||||
First Quarter 2014 | Fourth Quarter 2013 | Third Quarter 2013 | Second Quarter 2013 | First Quarter 2013 | |||||||||||||||
Reconciliation of net interest income to net interest income on a fully taxable-equivalent basis | |||||||||||||||||||
Net interest income | $ | 10,085 | $ | 10,786 | $ | 10,266 | $ | 10,549 | $ | 10,664 | |||||||||
Fully taxable-equivalent adjustment | 201 | 213 | 213 | 222 | 211 | ||||||||||||||
Net interest income on a fully taxable-equivalent basis | $ | 10,286 | $ | 10,999 | $ | 10,479 | $ | 10,771 | $ | 10,875 | |||||||||
Reconciliation of total revenue, net of interest expense to total revenue, net of interest expense on a fully taxable-equivalent basis | |||||||||||||||||||
Total revenue, net of interest expense | $ | 22,566 | $ | 21,488 | $ | 21,530 | $ | 22,727 | $ | 23,197 | |||||||||
Fully taxable-equivalent adjustment | 201 | 213 | 213 | 222 | 211 | ||||||||||||||
Total revenue, net of interest expense on a fully taxable-equivalent basis | $ | 22,767 | $ | 21,701 | $ | 21,743 | $ | 22,949 | $ | 23,408 | |||||||||
Reconciliation of income tax expense (benefit) to income tax expense (benefit) on a fully taxable-equivalent basis | |||||||||||||||||||
Income tax expense (benefit) | $ | (405 | ) | $ | 406 | $ | 2,348 | $ | 1,486 | $ | 501 | ||||||||
Fully taxable-equivalent adjustment | 201 | 213 | 213 | 222 | 211 | ||||||||||||||
Income tax expense (benefit) on a fully taxable-equivalent basis | $ | (204 | ) | $ | 619 | $ | 2,561 | $ | 1,708 | $ | 712 | ||||||||
Reconciliation of average common shareholders' equity to average tangible common shareholders' equity | |||||||||||||||||||
Common shareholders' equity | $ | 223,201 | $ | 220,088 | $ | 216,766 | $ | 218,790 | $ | 218,225 | |||||||||
Goodwill | (69,842 | ) | (69,864 | ) | (69,903 | ) | (69,930 | ) | (69,945 | ) | |||||||||
Intangible assets (excluding mortgage servicing rights) | (5,474 | ) | (5,725 | ) | (5,993 | ) | (6,270 | ) | (6,549 | ) | |||||||||
Related deferred tax liabilities | 2,165 | 2,231 | 2,296 | 2,360 | 2,425 | ||||||||||||||
Tangible common shareholders' equity | $ | 150,050 | $ | 146,730 | $ | 143,166 | $ | 144,950 | $ | 144,156 | |||||||||
Reconciliation of average shareholders' equity to average tangible shareholders' equity | |||||||||||||||||||
Shareholders' equity | $ | 236,553 | $ | 233,415 | $ | 230,392 | $ | 235,063 | $ | 236,995 | |||||||||
Goodwill | (69,842 | ) | (69,864 | ) | (69,903 | ) | (69,930 | ) | (69,945 | ) | |||||||||
Intangible assets (excluding mortgage servicing rights) | (5,474 | ) | (5,725 | ) | (5,993 | ) | (6,270 | ) | (6,549 | ) | |||||||||
Related deferred tax liabilities | 2,165 | 2,231 | 2,296 | 2,360 | 2,425 | ||||||||||||||
Tangible shareholders' equity | $ | 163,402 | $ | 160,057 | $ | 156,792 | $ | 161,223 | $ | 162,926 | |||||||||
This information is preliminary and based on company data available at the time of the presentation. | 42 |
Exhibit A: Non-GAAP Reconciliations (continued) | |||||||||||||||||||
Bank of America Corporation and Subsidiaries | |||||||||||||||||||
Reconciliations to GAAP Financial Measures | |||||||||||||||||||
(Dollars in millions) | |||||||||||||||||||
First Quarter 2014 | Fourth Quarter 2013 | Third Quarter 2013 | Second Quarter 2013 | First Quarter 2013 | |||||||||||||||
Reconciliation of period-end common shareholders' equity to period-end tangible common shareholders' equity | |||||||||||||||||||
Common shareholders' equity | $ | 218,536 | $ | 219,333 | $ | 218,967 | $ | 216,791 | $ | 218,513 | |||||||||
Goodwill | (69,842 | ) | (69,844 | ) | (69,891 | ) | (69,930 | ) | (69,930 | ) | |||||||||
Intangible assets (excluding mortgage servicing rights) | (5,337 | ) | (5,574 | ) | (5,843 | ) | (6,104 | ) | (6,379 | ) | |||||||||
Related deferred tax liabilities | 2,100 | 2,166 | 2,231 | 2,297 | 2,363 | ||||||||||||||
Tangible common shareholders' equity | $ | 145,457 | $ | 146,081 | $ | 145,464 | $ | 143,054 | $ | 144,567 | |||||||||
Reconciliation of period-end shareholders' equity to period-end tangible shareholders' equity | |||||||||||||||||||
Shareholders' equity | $ | 231,888 | $ | 232,685 | $ | 232,282 | $ | 231,032 | $ | 237,293 | |||||||||
Goodwill | (69,842 | ) | (69,844 | ) | (69,891 | ) | (69,930 | ) | (69,930 | ) | |||||||||
Intangible assets (excluding mortgage servicing rights) | (5,337 | ) | (5,574 | ) | (5,843 | ) | (6,104 | ) | (6,379 | ) | |||||||||
Related deferred tax liabilities | 2,100 | 2,166 | 2,231 | 2,297 | 2,363 | ||||||||||||||
Tangible shareholders' equity | $ | 158,809 | $ | 159,433 | $ | 158,779 | $ | 157,295 | $ | 163,347 | |||||||||
Reconciliation of period-end assets to period-end tangible assets | |||||||||||||||||||
Assets | $ | 2,149,851 | $ | 2,102,273 | $ | 2,126,653 | $ | 2,123,320 | $ | 2,174,819 | |||||||||
Goodwill | (69,842 | ) | (69,844 | ) | (69,891 | ) | (69,930 | ) | (69,930 | ) | |||||||||
Intangible assets (excluding mortgage servicing rights) | (5,337 | ) | (5,574 | ) | (5,843 | ) | (6,104 | ) | (6,379 | ) | |||||||||
Related deferred tax liabilities | 2,100 | 2,166 | 2,231 | 2,297 | 2,363 | ||||||||||||||
Tangible assets | $ | 2,076,772 | $ | 2,029,021 | $ | 2,053,150 | $ | 2,049,583 | $ | 2,100,873 | |||||||||
This information is preliminary and based on company data available at the time of the presentation. | 43 |
Exhibit A: Non-GAAP Reconciliations (continued) | |||||||||||||||||||
Bank of America Corporation and Subsidiaries | |||||||||||||||||||
Reconciliations to GAAP Financial Measures | |||||||||||||||||||
(Dollars in millions) | |||||||||||||||||||
First Quarter 2014 | Fourth Quarter 2013 | Third Quarter 2013 | Second Quarter 2013 | First Quarter 2013 | |||||||||||||||
Reconciliation of return on average allocated capital (1) | |||||||||||||||||||
Consumer & Business Banking | |||||||||||||||||||
Reported net income | $ | 1,658 | $ | 1,962 | $ | 1,775 | $ | 1,389 | $ | 1,448 | |||||||||
Adjustment related to intangibles (2) | 1 | 1 | 2 | 2 | 2 | ||||||||||||||
Adjusted net income | $ | 1,659 | $ | 1,963 | $ | 1,777 | $ | 1,391 | $ | 1,450 | |||||||||
Average allocated equity (3) | $ | 61,483 | $ | 62,007 | $ | 62,033 | $ | 62,058 | $ | 62,084 | |||||||||
Adjustment related to goodwill and a percentage of intangibles | (31,983 | ) | (32,007 | ) | (32,033 | ) | (32,058 | ) | (32,084 | ) | |||||||||
Average allocated capital | $ | 29,500 | $ | 30,000 | $ | 30,000 | $ | 30,000 | $ | 30,000 | |||||||||
Global Wealth & Investment Management | |||||||||||||||||||
Reported net income | $ | 729 | $ | 777 | $ | 720 | $ | 759 | $ | 721 | |||||||||
Adjustment related to intangibles (2) | 3 | 4 | 4 | 4 | 4 | ||||||||||||||
Adjusted net income | $ | 732 | $ | 781 | $ | 724 | $ | 763 | $ | 725 | |||||||||
Average allocated equity (3) | $ | 22,243 | $ | 20,265 | $ | 20,283 | $ | 20,300 | $ | 20,323 | |||||||||
Adjustment related to goodwill and a percentage of intangibles | (10,243 | ) | (10,265 | ) | (10,283 | ) | (10,300 | ) | (10,323 | ) | |||||||||
Average allocated capital | $ | 12,000 | $ | 10,000 | $ | 10,000 | $ | 10,000 | $ | 10,000 | |||||||||
Global Banking | |||||||||||||||||||
Reported net income | $ | 1,236 | $ | 1,266 | $ | 1,134 | $ | 1,292 | $ | 1,281 | |||||||||
Adjustment related to intangibles (2) | — | — | 1 | — | 1 | ||||||||||||||
Adjusted net income | $ | 1,236 | $ | 1,266 | $ | 1,135 | $ | 1,292 | $ | 1,282 | |||||||||
Average allocated equity (3) | $ | 53,407 | $ | 45,410 | $ | 45,413 | $ | 45,416 | $ | 45,406 | |||||||||
Adjustment related to goodwill and a percentage of intangibles | (22,407 | ) | (22,410 | ) | (22,413 | ) | (22,416 | ) | (22,406 | ) | |||||||||
Average allocated capital | $ | 31,000 | $ | 23,000 | $ | 23,000 | $ | 23,000 | $ | 23,000 | |||||||||
Global Markets | |||||||||||||||||||
Reported net income (loss) | $ | 1,310 | $ | (43 | ) | $ | (872 | ) | $ | 965 | $ | 1,112 | |||||||
Adjustment related to intangibles (2) | 2 | 2 | 2 | 2 | 2 | ||||||||||||||
Adjusted net income (loss) | $ | 1,312 | $ | (41 | ) | $ | (870 | ) | $ | 967 | $ | 1,114 | |||||||
Average allocated equity (3) | $ | 39,377 | $ | 35,380 | $ | 35,369 | $ | 35,372 | $ | 35,372 | |||||||||
Adjustment related to goodwill and a percentage of intangibles | (5,377 | ) | (5,380 | ) | (5,369 | ) | (5,372 | ) | (5,372 | ) | |||||||||
Average allocated capital | $ | 34,000 | $ | 30,000 | $ | 30,000 | $ | 30,000 | $ | 30,000 | |||||||||
This information is preliminary and based on company data available at the time of the presentation. | 44 |
Exhibit A: Non-GAAP Reconciliations (continued) | |||||||||||
Bank of America Corporation and Subsidiaries | |||||||||||
Reconciliations to GAAP Financial Measures | |||||||||||
(Dollars in millions) | |||||||||||
First Quarter 2014 | Fourth Quarter 2013 | First Quarter 2013 | |||||||||
Consumer & Business Banking | |||||||||||
Deposits | |||||||||||
Reported net income | $ | 620 | $ | 670 | $ | 397 | |||||
Adjustment related to intangibles (2) | — | — | — | ||||||||
Adjusted net income | $ | 620 | $ | 670 | $ | 397 | |||||
Average allocated equity (3) | $ | 36,490 | $ | 35,394 | $ | 35,407 | |||||
Adjustment related to goodwill and a percentage of intangibles | (19,990 | ) | (19,994 | ) | (20,007 | ) | |||||
Average allocated capital | $ | 16,500 | $ | 15,400 | $ | 15,400 | |||||
Consumer Lending | |||||||||||
Reported net income | $ | 1,038 | $ | 1,292 | $ | 1,051 | |||||
Adjustment related to intangibles (2) | 1 | 1 | 2 | ||||||||
Adjusted net income | $ | 1,039 | $ | 1,293 | $ | 1,053 | |||||
Average allocated equity (3) | $ | 24,993 | $ | 26,613 | $ | 26,676 | |||||
Adjustment related to goodwill and a percentage of intangibles | (11,993 | ) | (12,013 | ) | (12,076 | ) | |||||
Average allocated capital | $ | 13,000 | $ | 14,600 | $ | 14,600 | |||||
(1) | There are no adjustments to reported net income (loss) or average allocated equity for Consumer Real Estate Services. |
(2) | Represents cost of funds, earnings credits and certain expenses related to intangibles. |
(3) | Average allocated equity is comprised of average allocated capital plus capital for the portion of goodwill and intangibles specifically assigned to the business segment. |
This information is preliminary and based on company data available at the time of the presentation. | 45 |