Item 7. Bank of America Corporation and Subsidiaries
Management’s Discussion and Analysis of Financial Condition and Results of Operation
Table of Contents


Page


Consumer Banking


Legacy Assets & Servicing


Bank of America 2014     1


Management’s Discussion and Analysis of Financial Condition and Results of Operations
This report, the documents that it incorporates by reference and the documents into which it may be incorporated by reference may contain, and from time to time Bank of America Corporation (collectively with its subsidiaries, the Corporation) and its management may make certain statements that constitute forward-looking statements within the meaning of the Private Securities Litigation Reform Act of 1995. These statements can be identified by the fact that they do not relate strictly to historical or current facts. Forward-looking statements often use words such as “anticipates,” “targets,” “expects,” “hopes,” “estimates,” “intends,” “plans,” “goal,” “believes,” “continue” and other similar expressions or future or conditional verbs such as “will,” “may,” “might,” “should,” “would” and “could.” The forward-looking statements made represent the Corporations current expectations, plans or forecasts of its future results and revenues, and future business and economic conditions more generally, and other future matters. These statements are not guarantees of future results or performance and involve certain known and unknown risks, uncertainties and assumptions that are difficult to predict and are often beyond the Corporations control. Actual outcomes and results may differ materially from those expressed in, or implied by, any of these forward-looking statements.
You should not place undue reliance on any forward-looking statement and should consider the following uncertainties and risks, as well as the risks and uncertainties more fully discussed elsewhere in this report, including under Item 1A. Risk Factors of the Corporation's 2014 Annual Report on Form 10-K and in any of the Corporation’s subsequent Securities and Exchange Commission filings for further information about factors that could affect such forward-looking statements: the Corporations ability to resolve representations and warranties repurchase claims and the chance that the Corporation could face related servicing, securities, fraud, indemnity or other claims from one or more counterparties, including monolines or private-label and other investors; the possibility that final court approval of negotiated settlements is not obtained, including the possibility that the court decision with respect to the BNY Mellon Settlement is overturned on appeal in whole or in part; the possibility that future representations and warranties losses may occur in excess of the Corporations recorded liability and estimated range of possible loss for its representations and warranties exposures; the possibility that the Corporation may not collect mortgage insurance claims; potential claims, damages, penalties, fines and reputational damage resulting from pending or future litigation and regulatory proceedings, including the possibility that amounts may be in excess of the Corporation’s recorded liability and estimated range of possible losses for litigation exposures; the
 
possibility that the European Commission will impose remedial measures in relation to its investigation of the Corporations competitive practices; the possible outcome of LIBOR, other reference rate and foreign exchange inquiries and investigations; uncertainties about the financial stability and growth rates of non-U.S. jurisdictions, the risk that those jurisdictions may face difficulties servicing their sovereign debt, and related stresses on financial markets, currencies and trade, and the Corporations exposures to such risks, including direct, indirect and operational; the impact of U.S. and global interest rates, currency exchange rates and economic conditions; the negative impact of the Dodd-Frank Wall Street Reform and Consumer Protection Act on the Corporations business and earnings, including as a result of additional regulatory interpretations and rulemaking and the success of the Corporations actions to mitigate such impacts; the potential impact of a prolonged low interest rate environment on the Corporations business, financial condition and results of operations; adverse changes to the Corporations credit ratings from the major credit rating agencies; estimates of the fair value of certain of the Corporations assets and liabilities; uncertainty regarding the content, timing and impact of regulatory capital and liquidity requirements, including, but not limited to, any GSIB surcharge or as a result of changes to our Basel 3 Advanced approaches estimates; the Corporations ability to fully realize the cost savings and other anticipated benefits from cost-saving initiatives, including in accordance with currently anticipated timeframes, the impact of implementation and compliance with new and evolving U.S. and international regulations, including, but not limited to, recovery and resolution planning requirements, the Volcker Rule, and derivatives regulations; the potential impact of the U.K. tax authorities proposal to limit how much NOLs can offset annual profit; a failure in or breach of the Corporation’s operational or security systems or infrastructure, or those of third parties with whom we do business, including as a result of cyber attacks; and other similar matters.
Forward-looking statements speak only as of the date they are made, and the Corporation undertakes no obligation to update any forward-looking statement to reflect the impact of circumstances or events that arise after the date the forward-looking statement was made.
Notes to the Consolidated Financial Statements referred to in the Management’s Discussion and Analysis of Financial Condition and Results of Operations (MD&A) are incorporated by reference into the MD&A. Certain prior-year amounts have been reclassified to conform to current-year presentation. Throughout the MD&A, the Corporation uses certain acronyms and abbreviations which are defined in the Glossary.


2     Bank of America 2014


Executive Summary
Business Overview
The Corporation is a Delaware corporation, a bank holding company (BHC) and a financial holding company. When used in this report, “the Corporation” may refer to Bank of America Corporation individually, Bank of America Corporation and its subsidiaries, or certain of Bank of America Corporation’s subsidiaries or affiliates. Our principal executive offices are located in Charlotte, North Carolina. Through our banking and various nonbank subsidiaries throughout the U.S. and in international markets, we provide a diversified range of banking and nonbank financial services and products. Prior to October 1, 2014, we operated our banking activities primarily under two charters: Bank of America, National Association (Bank of America, N.A. or BANA) and, to a lesser extent, FIA Card Services, National Association (FIA Card Services, N.A. or FIA). On October 1, 2014, FIA was merged into BANA. At December 31, 2014, the Corporation had approximately $2.1 trillion in assets and approximately 224,000 full-time equivalent employees.
In the Annual Report on Form 10-K for the year ended December 31, 2014, we reported our results of operations through five business segments: Consumer & Business Banking (CBB), Consumer Real Estate Services (CRES), Global Wealth & Investment Management (GWIM), Global Banking and Global Markets, with the remaining operations recorded in All Other. Effective January 1, 2015, to align the segments with how we manage the businesses in 2015, we changed our basis of presentation, and following such change, we report our results of operations through the following five business segments: Consumer Banking, Global Wealth & Investment Management (GWIM), Global Banking, Global Markets and Legacy Assets & Servicing (LAS), with the remaining operations recorded in All Other. The Home Loans business, which was included in the former CRES segment, is now included in Consumer Banking, and LAS (also in the former CRES segment) has become a separate segment. A portion of the Business Banking business, based on the size of the client, was moved from the former CBB segment to Global Banking, and the former CBB segment was renamed Consumer Banking. Also, our merchant services joint venture moved from the former CBB segment to All Other. In addition, certain management accounting methodologies, including the treatment of intersegment assets and liabilities, and related allocations were refined. Prior periods have been reclassified to conform to the current period presentation.
As of December 31, 2014, we operated in all 50 states, the District of Columbia, the U.S. Virgin Islands, Puerto Rico and more than 35 countries. Our retail banking footprint covers approximately 80 percent of the U.S. population, and we serve approximately 48 million consumer and small business relationships with approximately 4,800 financial centers, 15,800 ATMs, nationwide call centers, and leading online and mobile banking platforms (www.bankofamerica.com). We offer industry-leading support to approximately three million small business owners. Our industry leading wealth management and trust businesses, with client balances of $2.5 trillion, provide tailored solutions to meet client needs through a full set of brokerage, banking, trust and retirement products. We are a global leader in corporate and investment banking and trading across a broad range of asset classes serving corporations, governments, institutions and individuals around the world.
 
2014 Economic and Business Environment
In the U.S., economic growth continued in 2014, ending the year in the midst of its sixth consecutive year of recovery. After a tentative and generally soft trajectory for five years where annualized GDP growth averaged 2.3 percent, there were clear signs of accelerated growth in the final three quarters of 2014 following a first quarter impacted by adverse weather conditions. Employment gains picked up during the year, and the unemployment rate fell to 5.6 percent at year end. Consumption grew slowly early in the year, before picking up steadily and ending with a robust pace in the final quarter. Core inflation remained relatively unchanged in 2014, rising modestly in the first half and falling thereafter, and ended the year more than half a percentage point below the Board of Governors of the Federal Reserve System’s (Federal Reserve) longer-term annual target of two percent.
U.S. household net worth continued to rise in 2014 but at a substantially slower pace than 2013. Home price appreciation was less in 2014 than 2013 but prices still rose approximately five percent in 2014 while equity markets gained approximately 11 percent. However, consumer spending was more significantly enhanced by sharply lower oil prices late in the year, reflecting foreign economic weakness amid an ample and growing energy supply.
U.S. Treasury yields fell over the course of the year, reversing much of the previous year’s increase. Declining world inflation and interest rates helped push U.S. Treasury yields lower even as the Federal Reserve steadily reduced and finally ended its purchases of agency mortgage-backed securities (MBS) and long-term U.S. Treasury securities. The Federal Reserve ended the year amid indications that it can be patient with regard to normalizing monetary policy.
Internationally, the eurozone grew modestly for much of the year, with growth restrained by continued deleveraging of the financial sector, high unemployment and political uncertainty. Inflation in the eurozone also fell significantly to near zero by year end. European bond yields continued to decline, especially as the European Central Bank eased monetary policy and expectations grew late in the year for outright purchases of sovereign and/or corporate securities in 2015, and were subsequently confirmed to begin in March 2015. The Euro/U.S. Dollar exchange rate also fell significantly, boosting European competitiveness, particularly in the second half of 2014, in direct reaction to the differing directions of U.S. and eurozone monetary policies. Contentious negotiations between parties to Greek sovereign and bank support programs added to uncertainty and market volatility in the first quarter of 2015.
In Russia, the combination of the U.S. and European Union sanctions and sharply lower oil prices weakened growth. Select emerging nations that are net energy suppliers also saw growth diminish sharply, although other nations, including some emerging economies in Asia received some benefits from declining energy prices.
Following a quarter of strong economic growth ahead of a consumption tax increase, Japan contracted through the middle of the year and the Bank of Japan responded with stepped up quantitative easing. Amid gradual economic moderation, China also eased monetary policy late in the year.


Bank of America 2014     3


Selected Financial Data
Table 1 provides selected consolidated financial data for 2014 and 2013.


Table 1
Selected Financial Data


(Dollars in millions, except per share information)
2014
2013
Income statement


Revenue, net of interest expense (FTE basis) (1)
$
85,116

$
89,801

Net income
4,833

11,431

Diluted earnings per common share
0.36

0.90

Dividends paid per common share
0.12

0.04

Performance ratios


Return on average assets
0.23
%
0.53
%
Return on average tangible common shareholders’ equity (1)
2.52

6.97

Efficiency ratio (FTE basis) (1)
88.25

77.07

Asset quality


Allowance for loan and lease losses at December 31
$
14,419

$
17,428

Allowance for loan and lease losses as a percentage of total loans and leases outstanding at December 31 (2)
1.65
%
1.90
%
Nonperforming loans, leases and foreclosed properties at December 31 (2)
$
12,629

$
17,772

Net charge-offs (3)
4,383

7,897

Net charge-offs as a percentage of average loans and leases outstanding (2, 3)
0.49
%
0.87
%
Net charge-offs as a percentage of average loans and leases outstanding, excluding the purchased credit-impaired loan portfolio (2)
0.50

0.90

Net charge-offs and purchased credit-impaired write-offs as a percentage of average loans and leases outstanding (2)
0.58

1.13

Ratio of the allowance for loan and lease losses at December 31 to net charge-offs (3)
3.29

2.21

Ratio of the allowance for loan and lease losses at December 31 to net charge-offs, excluding the purchased credit-impaired loan portfolio
2.91

1.89

Ratio of the allowance for loan and lease losses at December 31 to net charge-offs and purchased credit-impaired write-offs
2.78

1.70

Balance sheet at year end


Total loans and leases
$
881,391

$
928,233

Total assets
2,104,534

2,102,273

Total deposits
1,118,936

1,119,271

Total common shareholders’ equity
224,162

219,333

Total shareholders’ equity
243,471

232,685

Capital ratios at year end (4)


Common equity tier 1 capital
12.3
%
n/a

Tier 1 common capital
n/a

10.9
%
Tier 1 capital
13.4

12.2

Total capital
16.5

15.1

Tier 1 leverage
8.2

7.7

(1) 
Fully taxable-equivalent (FTE) basis, return on average tangible common shareholders’ equity and the efficiency ratio are non-GAAP financial measures. Other companies may define or calculate these measures differently. For more information, see Supplemental Financial Data on page 12, and for corresponding reconciliations to GAAP financial measures, see Statistical Table XV.
(2) 
Balances and ratios do not include loans accounted for under the fair value option. For additional exclusions from nonperforming loans, leases and foreclosed properties, see Consumer Portfolio Credit Risk Management – Nonperforming Consumer Loans, Leases and Foreclosed Properties Activity on page 62 and corresponding Table 39, and Commercial Portfolio Credit Risk Management – Nonperforming Commercial Loans, Leases and Foreclosed Properties Activity on page 69 and corresponding Table 48.
(3) 
Net charge-offs exclude $810 million of write-offs in the purchased credit-impaired loan portfolio for 2014 compared to $2.3 billion for 2013. These write-offs decreased the purchased credit-impaired valuation allowance included as part of the allowance for loan and lease losses. For more information on purchased credit-impaired write-offs, see Consumer Portfolio Credit Risk Management – Purchased Credit-impaired Loan Portfolio on page 58.
(4) 
On January 1, 2014, the Basel 3 rules became effective, subject to transition provisions primarily related to regulatory deductions and adjustments impacting Common equity tier 1 capital and Tier 1 capital. We reported under Basel 1 (which included the Market Risk Final Rules) at December 31, 2013.
n/a = not applicable


4     Bank of America 2014


Financial Highlights
Net income was $4.8 billion, or $0.36 per diluted share in 2014 compared to $11.4 billion, or $0.90 per diluted share in 2013. The results for 2014 included an increase of $10.3 billion in litigation expense primarily as a result of charges related to the settlements with the U.S. Department of Justice (DoJ) and the Federal Housing Finance Agency (FHFA).


Table 2
Summary Income Statement


(Dollars in millions)
2014
 
2013
Net interest income (FTE basis) (1)
$
40,821

 
$
43,124

Noninterest income
44,295

 
46,677

Total revenue, net of interest expense (FTE basis) (1)
85,116

 
89,801

Provision for credit losses
2,275

 
3,556

Noninterest expense
75,117

 
69,214

Income before income taxes (FTE basis) (1)
7,724

 
17,031

Income tax expense (FTE basis) (1)
2,891

 
5,600

Net income
4,833

 
11,431

Preferred stock dividends
1,044

 
1,349

Net income applicable to common shareholders
$
3,789

 
$
10,082


Per common share information


Earnings
$
0.36

 
$
0.94

Diluted earnings
0.36

 
0.90

(1) 
FTE basis is a non-GAAP financial measure. For more information on this measure, see Supplemental Financial Data on page 12, and for a corresponding reconciliation to GAAP financial measures, see Statistical Table XV.
Net Interest Income
Net interest income on a fully taxable-equivalent (FTE) basis decreased $2.3 billion to $40.8 billion for 2014 compared to 2013. The net interest yield on an FTE basis decreased 12 basis points (bps) to 2.25 percent for 2014. These declines were primarily due to the acceleration of market-related premium amortization on debt securities as the decline in long-term interest rates shortened the expected lives of the securities. Also contributing to these declines were lower loan yields and consumer loan balances, lower net interest income from the asset and liability management (ALM) portfolio and a decrease in trading-related net interest income. Market-related premium amortization was an expense of $1.2 billion in 2014 compared to a benefit of $784 million in 2013. Partially offsetting these declines were reductions in funding yields, lower long-term debt balances and commercial loan growth.
Noninterest Income


Table 3
Noninterest Income


(Dollars in millions)
2014
 
2013
Card income
$
5,944

 
$
5,826

Service charges
7,443

 
7,390

Investment and brokerage services
13,284

 
12,282

Investment banking income
6,065

 
6,126

Equity investment income
1,130

 
2,901

Trading account profits
6,309

 
7,056

Mortgage banking income
1,563

 
3,874

Gains on sales of debt securities
1,354

 
1,271

Other income (loss)
1,203

 
(49
)
Total noninterest income
$
44,295

 
$
46,677

 
Noninterest income decreased $2.4 billion to $44.3 billion for 2014 compared to 2013. The following highlights the significant changes.
Ÿ
Investment and brokerage services income increased $1.0 billion primarily driven by increased asset management fees driven by the impact of long-term assets under management (AUM) inflows and higher market levels.
Ÿ
Equity investment income decreased $1.8 billion to $1.1 billion primarily due to a lower level of gains compared to 2013 and the continued wind-down of Global Principal Investments (GPI).
Ÿ
Trading account profits decreased $747 million, which included a charge of $497 million in 2014 related to the adoption of a funding valuation adjustment (FVA) in Global Markets, partially offset by a $359 million change in net debit valuation adjustments (DVA) on derivatives. Excluding the FVA/DVA charges, trading account profits decreased $609 million due to both lower market volumes and volatility.
Ÿ
Mortgage banking income decreased $2.3 billion primarily driven by lower servicing income and core production revenue, partially offset by lower representations and warranties provision.
Ÿ
Other income (loss) improved $1.3 billion due to an increase of $1.1 billion in net DVA gains on structured liabilities as our spreads widened, and gains associated with the sales of residential mortgage loans, partially offset by increases in U.K. consumer payment protection insurance (PPI) costs. The prior year also included the write-down of $450 million on a monoline receivable.
Provision for Credit Losses
The provision for credit losses decreased $1.3 billion to $2.3 billion for 2014 compared to 2013. The provision for credit losses was $2.1 billion lower than net charge-offs for 2014, resulting in a reduction in the allowance for credit losses. The decrease from the prior year was driven by portfolio improvement, including increased home prices in the consumer real estate portfolio and lower unemployment levels driving improvement in the credit card portfolios, and improved asset quality in the commercial portfolio. Partially offsetting this decline was $400 million of additional costs in 2014 associated with the consumer relief portion of the settlement with the DoJ. We expect reserve releases in 2015 to moderate when compared to 2014.
Net charge-offs totaled $4.4 billion, or 0.49 percent of average loans and leases for 2014 compared to $7.9 billion, or 0.87 percent for 2013. The decrease in net charge-offs was due to credit quality improvement across all major portfolios and the impact of increased recoveries primarily from nonperforming and delinquent loan sales. For more information on the provision for credit losses, see Provision for Credit Losses on page 75.


Bank of America 2014     5


Noninterest Expense


Table 4
Noninterest Expense


(Dollars in millions)
2014
 
2013
Personnel
$
33,787

 
$
34,719

Occupancy
4,260

 
4,475

Equipment
2,125

 
2,146

Marketing
1,829

 
1,834

Professional fees
2,472

 
2,884

Amortization of intangibles
936

 
1,086

Data processing
3,144

 
3,170

Telecommunications
1,259

 
1,593

Other general operating
25,305

 
17,307

Total noninterest expense
$
75,117

 
$
69,214

Noninterest expense increased $5.9 billion to $75.1 billion for 2014 compared to 2013 primarily driven by higher litigation expense in other general operating expense. Litigation expense increased $10.3 billion primarily as a result of charges related to the settlements with the DoJ and FHFA. The increase in litigation expense was partially offset by a decrease of $3.3 billion in default-related staffing and other default-related servicing expenses in LAS. Also, personnel expense decreased $932 million in 2014 as we continued to streamline processes and achieve cost savings.
In connection with Project New BAC, which we first announced in the third quarter of 2011, we expected to achieve cost savings in certain noninterest expense categories as we streamlined workflows, simplified processes and aligned expenses with our overall strategic plan and operating principles. We expected total cost savings from Project New BAC to reach $8 billion on an annualized basis, or $2 billion per quarter, by mid-2015. We successfully completed our Project New BAC expense program ahead of schedule by reaching our target of $2 billion in cost savings per quarter, in the third quarter of 2014.
 
Income Tax Expense


Table 5
Income Tax Expense


(Dollars in millions)
2014
 
2013
Income before income taxes
$
6,855

 
$
16,172

Income tax expense
2,022

 
4,741

Effective tax rate
29.5
%
 
29.3
%
The effective tax rate for 2014 was driven by our recurring tax preference items, the resolution of several tax examinations and tax benefits from non-U.S. restructurings, partially offset by the non-deductible treatment of certain litigation charges. We expect an effective tax rate in the low 30 percent range, absent unusual items, for 2015.
The effective tax rate for 2013 was driven by our recurring tax preference items and by certain tax benefits related to non-U.S. operations, partially offset by the $1.1 billion negative impact from the U.K. 2013 Finance Act, enacted in July 2013, which reduced the U.K. corporate income tax rate by three percent. The $1.1 billion charge resulted from remeasuring our U.K. net deferred tax assets, in the period of enactment, using the lower rates.


6     Bank of America 2014


Balance Sheet Overview


Table 6
Selected Balance Sheet Data


December 31


Average Balance
 
 
(Dollars in millions)
2014
 
2013
 
% Change
 
2014
 
2013
 
% Change
Assets


Cash and cash equivalents
$
138,589

 
$
131,322

 
6
 %
 
$
141,078

 
$
109,014

 
29
 %
Federal funds sold and securities borrowed or purchased under agreements to resell
191,823

 
190,328

 
1

 
222,483

 
224,331

 
(1
)
Trading account assets
191,785

 
200,993

 
(5
)
 
202,416

 
217,865

 
(7
)
Debt securities
380,461

 
323,945

 
17

 
351,702

 
337,953

 
4

Loans and leases
881,391

 
928,233

 
(5
)
 
903,901

 
918,641

 
(2
)
Allowance for loan and lease losses
(14,419
)
 
(17,428
)
 
(17
)
 
(15,973
)
 
(21,188
)
 
(25
)
All other assets
334,904

 
344,880

 
(3
)
 
339,983

 
376,897

 
(10
)
Total assets
$
2,104,534

 
$
2,102,273


$
2,145,590

 
$
2,163,513

 
(1
)
Liabilities


Deposits
$
1,118,936

 
$
1,119,271


$
1,124,207

 
$
1,089,735

 
3

Federal funds purchased and securities loaned or sold under agreements to repurchase
201,277

 
198,106

 
2

 
215,792

 
257,600

 
(16
)
Trading account liabilities
74,192

 
83,469

 
(11
)
 
87,151

 
88,323

 
(1
)
Short-term borrowings
31,172

 
45,999

 
(32
)
 
41,886

 
43,816

 
(4
)
Long-term debt
243,139

 
249,674

 
(3
)
 
253,607

 
263,417

 
(4
)
All other liabilities
192,347

 
173,069

 
11

 
184,471

 
186,675

 
(1
)
Total liabilities
1,861,063

 
1,869,588


1,907,114

 
1,929,566

 
(1
)
Shareholders’ equity
243,471

 
232,685

 
5

 
238,476

 
233,947

 
2

Total liabilities and shareholders’ equity
$
2,104,534

 
$
2,102,273


$
2,145,590

 
$
2,163,513

 
(1
)
Year-end balance sheet amounts may vary from average balance sheet amounts due to liquidity and balance sheet management activities, primarily involving our portfolios of highly liquid assets. These portfolios are designed to ensure the adequacy of capital while enhancing our ability to manage liquidity requirements for the Corporation and our customers, and to position the balance sheet in accordance with the Corporation’s risk appetite. The execution of these activities requires the use of balance sheet and capital-related limits including spot, average and risk-weighted asset limits, particularly within the market-making activities of our trading businesses. One of our key regulatory metrics, Tier 1 leverage ratio, is calculated based on adjusted quarterly average total assets.
Balance Sheet Management Actions in 2014
The Corporation took certain actions during 2014 to further optimize its balance sheet. While the overall size of the balance sheet remained relatively unchanged compared to December 31, 2013, the composition has improved in terms of liquidity in response to the new Basel 3 Liquidity Coverage Ratio (LCR) requirements. We shifted the mix of certain discretionary assets out of less liquid loans to more liquid debt securities. This included the sale of $10.7 billion of residential mortgage loans with standby insurance agreements and purchase of agency securities, and the sale of $6.7 billion of nonperforming and other delinquent loans. Though the Global Markets balance sheet was relatively stable, there was a decrease of $11.8 billion in low-margin prime brokerage loans. Ending deposits remained relatively unchanged
 
as we took actions to optimize the LCR liquidity value of deposits while growing retail deposits. Additionally, from a capital standpoint, $6.0 billion of preferred stock was issued during the year and amendments to our outstanding Series T preferred stock also improved Basel 3 Tier 1 regulatory capital.
Assets
Year-end total assets remained relatively unchanged from December 31, 2013, though the asset mix changed in connection with preparing for the new Basel 3 LCR requirements as discussed above. The key drivers were increased debt securities due to purchases of U.S. Treasury securities, and higher cash and cash equivalents from higher interest-bearing deposits with the Federal Reserve and non-U.S. central banks. These increases were largely offset by a decline in consumer loan balances due to paydowns, sales of residential loans with long-term standby agreements, nonperforming and delinquent loan sales and net charge-offs collectively outpacing new originations, and declines in all other assets and in trading account assets.
Cash and Cash Equivalents
Year-end and average cash and cash equivalents increased $7.3 billion from December 31, 2013 and $32.1 billion in 2014 driven by an increase in interest-bearing deposits with the Federal Reserve and non-U.S. central banks in connection with preparing for the Basel 3 LCR requirements. For more information, see Liquidity Risk – Basel 3 Liquidity Standards on page 47.


Bank of America 2014     7


Federal Funds Sold and Securities Borrowed or Purchased Under Agreements to Resell
Federal funds transactions involve lending reserve balances on a short-term basis. Securities borrowed or purchased under agreements to resell are collateralized lending transactions utilized to accommodate customer transactions, earn interest rate spreads, and obtain securities for settlement and for collateral. Year-end federal funds sold and securities borrowed or purchased under agreements to resell increased $1.5 billion from December 31, 2013 driven by matched-book activity, partially offset by roll-off of supranational positions and a mix shift into securities. Average federal funds sold and securities borrowed or purchased under agreements to resell decreased $1.8 billion in 2014 compared to 2013 due to lower matched-book activity.
Trading Account Assets
Trading account assets consist primarily of long positions in equity and fixed-income securities including U.S. government and agency securities, corporate securities and non-U.S. sovereign debt. Year-end trading account assets decreased $9.2 billion primarily due to lower equity securities inventory as a result of a decrease in client hedging activity. Average trading account assets decreased $15.4 billion primarily due to a reduction in U.S. Treasury securities inventory.
Debt Securities
Debt securities primarily include U.S. Treasury and agency securities, MBS, principally agency MBS, foreign bonds, corporate bonds and municipal debt. We use the debt securities portfolio primarily to manage interest rate and liquidity risk and to take advantage of market conditions that create economically attractive returns on these investments. Year-end and average debt securities increased $56.5 billion and $13.7 billion primarily due to net purchases of U.S. Treasury securities driven by the new LCR rules, and increases in the fair value of available-for-sale (AFS) debt securities resulting from the impact of lower interest rates. For more information on debt securities, see Note 3 – Securities to the Consolidated Financial Statements.
Loans and Leases
Year-end and average loans and leases decreased $46.8 billion and $14.7 billion. The decreases were primarily driven by a decline in consumer loan balances due to paydowns, loan sales and net charge-offs outpacing new originations, and a decline in commercial loan balances. For more information on the loan portfolio, see Credit Risk Management on page 50.
Allowance for Loan and Lease Losses
Year-end and average allowance for loan and lease losses decreased $3.0 billion and $5.2 billion primarily due to the impact of improvements in credit quality from the improving economy. For more information, see Allowance for Credit Losses on page 75.
All Other Assets
Year-end all other assets decreased $10.0 billion driven by other earning assets and time deposits placed, partially offset by an increase in derivative assets. Average all other assets decreased $36.9 billion primarily driven by lower customer and other receivables, time deposits placed, loans held-for-sale (LHFS) and derivative assets.
 
Liabilities
At December 31, 2014, total liabilities were approximately $1.9 trillion, down $8.5 billion from December 31, 2013, driven by planned reductions in short-term borrowings and long-term debt as well as a decrease in trading account liabilities, partially offset by increases in all other liabilities.
Deposits
Year-end deposits remained relatively unchanged from December 31, 2013 due to declines in Global Banking offset by an increase in retail deposits. Average deposits increased $34.5 billion primarily driven by customer and client shifts into more liquid products in the low rate environment.
Federal Funds Purchased and Securities Loaned or Sold Under Agreements to Repurchase
Federal funds transactions involve borrowing reserve balances on a short-term basis. Securities loaned or sold under agreements to repurchase are collateralized borrowing transactions utilized to accommodate customer transactions, earn interest rate spreads and finance assets on the balance sheet. Year-end federal funds purchased and securities loaned or sold under agreements to repurchase increased $3.2 billion primarily driven by matched-book activity. Average federal funds purchased and securities loaned or sold under agreements to repurchase decreased $41.8 billion primarily due to targeted reductions in the balance sheet.
Trading Account Liabilities
Trading account liabilities consist primarily of short positions in equity and fixed-income securities including U.S. Treasury and agency securities, corporate securities, and non-U.S. sovereign debt. Year-end and average trading account liabilities decreased $9.3 billion and $1.2 billion primarily due to lower levels of short U.S. Treasury positions.
Short-term Borrowings
Short-term borrowings provide an additional funding source and primarily consist of Federal Home Loan Bank (FHLB) short-term borrowings, notes payable and various other borrowings that generally have maturities of one year or less. Year-end and average short-term borrowings decreased $14.8 billion and $1.9 billion due to planned reductions in FHLB borrowings. For more information on short-term borrowings, see Note 10 – Federal Funds Sold or Purchased, Securities Financing Agreements and Short-term Borrowings to the Consolidated Financial Statements.
Long-term Debt
Year-end and average long-term debt decreased $6.5 billion and $9.8 billion. The decreases were a result of maturities outpacing new issuances. For more information on long-term debt, see Note 11 – Long-term Debt to the Consolidated Financial Statements.
All Other Liabilities
Year-end all other liabilities increased $19.3 billion driven by increases in derivative liabilities and payables. Average all other liabilities decreased $2.2 billion driven by decreases in payables and derivative liabilities.


8     Bank of America 2014


Shareholders’ Equity
Year-end shareholders’ equity increased $10.8 billion driven by issuances of preferred stock, an increase in accumulated other comprehensive income (OCI) due to a positive net change in the fair value of AFS debt securities, and earnings, partially offset by common stock repurchases and dividends. Average shareholders’ equity increased $4.5 billion driven by earnings and accumulated OCI, partially offset by common stock repurchases and dividends.
Cash Flows Overview
The Corporation’s operating assets and liabilities support our global markets and lending activities. We believe that cash flows from operations, available cash balances and our ability to generate cash through short- and long-term debt are sufficient to fund our operating liquidity needs. Our investing activities primarily include the debt securities portfolio and other short-term investments. Our financing activities reflect cash flows primarily related to increased customer deposits and net long-term debt reductions.
Cash and cash equivalents increased $7.3 billion during 2014 due to net cash provided by operating activities, partially offset by net cash used in financing and investing activities. This reflects actions taken in preparation for the Basel 3 LCR requirements. These changes were primarily due to higher interest-bearing deposits with the Federal Reserve and non-U.S. central banks as well as the sale of residential mortgage loans with standby insurance agreements and the purchase of agency securities, and the sale of nonperforming and other delinquent loans to further
 
optimize the balance sheet. Cash and cash equivalents increased $20.6 billion during 2013 due to net cash provided by operating and investing activities, partially offset by net cash used in financing activities.
During 2014, net cash provided by operating activities was $26.7 billion. The more significant drivers included net decreases in trading and derivative instruments, as well as a net increase in accrued expenses and other liabilities. During 2013, net cash provided by operating activities was $92.8 billion. The more significant drivers included net decreases in other assets, and trading and derivative instruments, as well as net proceeds from sales, securitizations and paydowns of LHFS.
During 2014, net cash used in investing activities was $4.2 billion, primarily driven by net purchases of debt securities, partially offset by net decreases in loans and leases. During 2013, net cash provided by investing activities was $25.1 billion, primarily driven by a decrease in federal funds sold and securities borrowed or purchased under agreements to resell and net sales of debt securities, partially offset by a net increase in loans and leases.
During 2014, net cash used in financing activities of $12.2 billion primarily reflected a reduction in short-term borrowings, partially offset by the issuance of preferred stock. During 2013, the net cash used in financing activities of $95.4 billion primarily reflected a decrease in federal funds purchased and securities loaned or sold under agreements to repurchase and net reductions in long-term debt, partially offset by growth in short-term borrowings and deposits.


Bank of America 2014     9


Table 7
Five-year Summary of Selected Financial Data


(In millions, except per share information)
2014
 
2013
 
2012
 
2011
 
2010
Income statement


Net interest income
$
39,952

 
$
42,265

 
$
40,656

 
$
44,616

 
$
51,523

Noninterest income
44,295

 
46,677

 
42,678

 
48,838

 
58,697

Total revenue, net of interest expense
84,247

 
88,942

 
83,334

 
93,454

 
110,220

Provision for credit losses
2,275

 
3,556

 
8,169

 
13,410

 
28,435

Goodwill impairment


3,184

 
12,400

Merger and restructuring charges


638

 
1,820

All other noninterest expense
75,117

 
69,214

 
72,093

 
76,452

 
68,888

Income (loss) before income taxes
6,855

 
16,172

 
3,072

 
(230
)
 
(1,323
)
Income tax expense (benefit)
2,022

 
4,741

 
(1,116
)
 
(1,676
)
 
915

Net income (loss)
4,833

 
11,431

 
4,188

 
1,446

 
(2,238
)
Net income (loss) applicable to common shareholders
3,789

 
10,082

 
2,760

 
85

 
(3,595
)
Average common shares issued and outstanding
10,528

 
10,731

 
10,746

 
10,143

 
9,790

Average diluted common shares issued and outstanding (1)
10,585

 
11,491

 
10,841

 
10,255

 
9,790

Performance ratios


Return on average assets
0.23
%
 
0.53
%
 
0.19
%
 
0.06
%
 
n/m

Return on average common shareholders’ equity
1.70

 
4.62

 
1.27

 
0.04

 
n/m

Return on average tangible common shareholders’ equity (2)
2.52

 
6.97

 
1.94

 
0.06

 
n/m

Return on average tangible shareholders’ equity (2)
2.92

 
7.13

 
2.60

 
0.96

 
n/m

Total ending equity to total ending assets
11.57

 
11.07

 
10.72

 
10.81

 
10.08
%
Total average equity to total average assets
11.11

 
10.81

 
10.75

 
9.98

 
9.56

Dividend payout
33.31

 
4.25

 
15.86

 
n/m

 
n/m

Per common share data


Earnings (loss)
$
0.36

 
$
0.94

 
$
0.26

 
$
0.01

 
$
(0.37
)
Diluted earnings (loss) (1)
0.36

 
0.90

 
0.25

 
0.01

 
(0.37
)
Dividends paid
0.12

 
0.04

 
0.04

 
0.04

 
0.04

Book value
21.32

 
20.71

 
20.24

 
20.09

 
20.99

Tangible book value (2)
14.43

 
13.79

 
13.36

 
12.95

 
12.98

Market price per share of common stock


Closing
$
17.89

 
$
15.57

 
$
11.61

 
$
5.56

 
$
13.34

High closing
18.13

 
15.88

 
11.61

 
15.25

 
19.48

Low closing
14.51

 
11.03

 
5.80

 
4.99

 
10.95

Market capitalization
$
188,141

 
$
164,914

 
$
125,136

 
$
58,580

 
$
134,536

(1) 
The diluted earnings (loss) per common share excluded the effect of any equity instruments that are antidilutive to earnings per share. There were no potential common shares that were dilutive in 2010 because of the net loss applicable to common shareholders.
(2) 
Tangible equity ratios and tangible book value per share of common stock are non-GAAP financial measures. Other companies may define or calculate these measures differently. For more information on these ratios, see Supplemental Financial Data on page 12, and for corresponding reconciliations to GAAP financial measures, see Statistical Table XV on page 113.
(3) 
For more information on the impact of the purchased credit-impaired loan portfolio on asset quality, see Consumer Portfolio Credit Risk Management on page 50.
(4) 
Includes the allowance for loan and lease losses and the reserve for unfunded lending commitments.
(5) 
Balances and ratios do not include loans accounted for under the fair value option. For additional exclusions from nonperforming loans, leases and foreclosed properties, see Consumer Portfolio Credit Risk Management – Nonperforming Consumer Loans, Leases and Foreclosed Properties Activity on page 62 and corresponding Table 39, and Commercial Portfolio Credit Risk Management – Nonperforming Commercial Loans, Leases and Foreclosed Properties Activity on page 69 and corresponding Table 48.
(6) 
Primarily includes amounts allocated to the U.S. credit card and unsecured consumer lending portfolios in Consumer Banking, purchased credit-impaired loans and the non-U.S. credit card portfolio in All Other.
(7) 
Net charge-offs exclude $810 million, $2.3 billion and $2.8 billion of write-offs in the purchased credit-impaired loan portfolio for 2014, 2013 and 2012, respectively. These write-offs decreased the purchased credit-impaired valuation allowance included as part of the allowance for loan and lease losses. For more information on purchased credit-impaired write-offs, see Consumer Portfolio Credit Risk Management – Purchased Credit-impaired Loan Portfolio on page 58.
(8) 
There were no write-offs of PCI loans in 2011 and 2010.
(9) 
On January 1, 2014, the Basel 3 rules became effective, subject to transition provisions primarily related to regulatory deductions and adjustments impacting Common equity tier 1 capital and Tier 1 capital. We reported under Basel 1 (which included the Market Risk Final Rules) at December 31, 2013. Basel 1 did not include the Basel 1 – 2013 Rules prior to 2013.
n/a = not applicable
n/m = not meaningful


10     Bank of America 2014


Table 7
Five-year Summary of Selected Financial Data (continued)


(Dollars in millions)
2014
 
2013
 
2012
 
2011
 
2010
Average balance sheet


Total loans and leases
$
903,901

 
$
918,641

 
$
898,768

 
$
938,096

 
$
958,331

Total assets
2,145,590

 
2,163,513

 
2,191,356

 
2,296,322

 
2,439,606

Total deposits
1,124,207

 
1,089,735

 
1,047,782

 
1,035,802

 
988,586

Long-term debt
253,607

 
263,417

 
316,393

 
421,229

 
490,497

Common shareholders’ equity
223,066

 
218,468

 
216,996

 
211,709

 
212,686

Total shareholders’ equity
238,476

 
233,947

 
235,677

 
229,095

 
233,235

Asset quality (3)


Allowance for credit losses (4)
$
14,947

 
$
17,912

 
$
24,692

 
$
34,497

 
$
43,073

Nonperforming loans, leases and foreclosed properties (5)
12,629

 
17,772

 
23,555

 
27,708

 
32,664

Allowance for loan and lease losses as a percentage of total loans and leases outstanding (5)
1.65
%
 
1.90
%
 
2.69
%
 
3.68
%
 
4.47
%
Allowance for loan and lease losses as a percentage of total nonperforming loans and leases (5)
121

 
102

 
107

 
135

 
136

Allowance for loan and lease losses as a percentage of total nonperforming loans and leases, excluding the PCI loan portfolio (5)
107

 
87

 
82

 
101

 
116

Amounts included in allowance for loan and lease losses for loans and leases that are excluded from nonperforming loans and leases (6)
$
5,944

 
$
7,680

 
$
12,021

 
$
17,490

 
$
22,908

Allowance for loan and lease losses as a percentage of total nonperforming loans and leases, excluding the allowance for loan and lease losses for loans and leases that are excluded from nonperforming loans and leases (5, 6)
71
%
 
57
%
 
54
%
 
65
%
 
62
%
Net charge-offs (7)
$
4,383

 
$
7,897

 
$
14,908

 
$
20,833

 
$
34,334

Net charge-offs as a percentage of average loans and leases outstanding (5, 7)
0.49
%
 
0.87
%
 
1.67
%
 
2.24
%
 
3.60
%
Net charge-offs as a percentage of average loans and leases outstanding, excluding the PCI loan portfolio (5)
0.50

 
0.90

 
1.73

 
2.32

 
3.73

Net charge-offs and PCI write-offs as a percentage of average loans and leases outstanding (5, 8)
0.58

 
1.13

 
1.99

 
2.24

 
3.60

Nonperforming loans and leases as a percentage of total loans and leases outstanding (5)
1.37

 
1.87

 
2.52

 
2.74

 
3.27

Nonperforming loans, leases and foreclosed properties as a percentage of total loans, leases and foreclosed properties (5)
1.45

 
1.93

 
2.62

 
3.01

 
3.48

Ratio of the allowance for loan and lease losses at December 31 to net charge-offs (7)
3.29

 
2.21

 
1.62

 
1.62

 
1.22

Ratio of the allowance for loan and lease losses at December 31 to net charge-offs, excluding the PCI loan portfolio
2.91

 
1.89

 
1.25

 
1.22

 
1.04

Ratio of the allowance for loan and lease losses at December 31 to net charge-offs and PCI write-offs (8)
2.78

 
1.70

 
1.36

 
1.62

 
1.22

Capital ratios at year end (9)


Risk-based capital:


Common equity tier 1 capital
12.3
%
 
n/a

 
n/a

 
n/a

 
n/a

Tier 1 common capital
n/a

 
10.9
%
 
10.8
%
 
9.7
%
 
8.5
%
Tier 1 capital
13.4

 
12.2

 
12.7

 
12.2

 
11.1

Total capital
16.5

 
15.1

 
16.1

 
16.6

 
15.7

Tier 1 leverage
8.2

 
7.7

 
7.2

 
7.4

 
7.1

Tangible equity (2)
8.4

 
7.9

 
7.6

 
7.5

 
6.8

Tangible common equity (2)
7.5

 
7.2

 
6.7

 
6.6

 
6.0

For footnotes see page 10.


Bank of America 2014     11


Supplemental Financial Data
We view net interest income and related ratios and analyses on an FTE basis, which when presented on a consolidated basis, are non-GAAP financial measures. We believe managing the business with net interest income on an FTE basis provides a more accurate picture of the interest margin for comparative purposes. To derive the FTE basis, net interest income is adjusted to reflect tax-exempt income on an equivalent before-tax basis with a corresponding increase in income tax expense. For purposes of this calculation, we use the federal statutory tax rate of 35 percent. This measure ensures comparability of net interest income arising from taxable and tax-exempt sources.
Certain performance measures including the efficiency ratio and net interest yield utilize net interest income (and thus total revenue) on an FTE basis. The efficiency ratio measures the costs expended to generate a dollar of revenue, and net interest yield measures the bps we earn over the cost of funds.
We also evaluate our business based on certain ratios that utilize tangible equity, a non-GAAP financial measure. Tangible equity represents an adjusted shareholders’ equity or common shareholders’ equity amount which has been reduced by goodwill and intangible assets (excluding mortgage servicing rights (MSRs)), net of related deferred tax liabilities. These measures are used to evaluate our use of equity. In addition, profitability, relationship and investment models use both return on average tangible common shareholders’ equity and return on average tangible shareholders’ equity as key measures to support our overall growth goals. These ratios are as follows:
Ÿ
Return on average tangible common shareholders’ equity measures our earnings contribution as a percentage of adjusted common shareholders’ equity. The tangible common equity ratio represents adjusted ending common shareholders’ equity divided by total assets less goodwill and intangible assets (excluding MSRs), net of related deferred tax liabilities.
 
Ÿ
Return on average tangible shareholders’ equity measures our earnings contribution as a percentage of adjusted average total shareholders’ equity. The tangible equity ratio represents adjusted ending shareholders’ equity divided by total assets less goodwill and intangible assets (excluding MSRs), net of related deferred tax liabilities.
Ÿ
Tangible book value per common share represents adjusted ending common shareholders’ equity divided by ending common shares outstanding.
The aforementioned supplemental data and performance measures are presented in Table 7 and Statistical Table XII. In addition, in Table 8, we have excluded the impact of goodwill impairment charges of $3.2 billion and $12.4 billion recorded in 2011 and 2010 when presenting certain of these metrics. Accordingly, these are non-GAAP financial measures.
We evaluate our business segment results based on measures that utilize average allocated capital. Return on average allocated capital is calculated as net income adjusted for cost of funds and earnings credits and certain expenses related to intangibles, divided by average allocated capital. Allocated capital and the related return both represent non-GAAP financial measures. In addition, for purposes of goodwill impairment testing, the Corporation utilizes allocated equity as a proxy for the carrying value of its reporting units. Allocated equity in the reporting units is comprised of allocated capital plus capital for the portion of goodwill and intangibles specifically assigned to the reporting unit. For additional information, see Business Segment Operations on page 14 and Note 8 – Goodwill and Intangible Assets to the Consolidated Financial Statements.
Statistical Tables XV, XVI and XVII on pages 113, 114 and 115 provide reconciliations of these non-GAAP financial measures to GAAP financial measures. We believe the use of these non-GAAP financial measures provides additional clarity in assessing the results of the Corporation and our segments. Other companies may define or calculate these measures and ratios differently.


Table 8
Five-year Supplemental Financial Data


(Dollars in millions, except per share information)
2014
 
2013
 
2012
 
2011
 
2010
Fully taxable-equivalent basis data


Net interest income
$
40,821

 
$
43,124

 
$
41,557

 
$
45,588

 
$
52,693

Total revenue, net of interest expense
85,116

 
89,801

 
84,235

 
94,426

 
111,390

Net interest yield (1)
2.25
%
 
2.37
%
 
2.24
%
 
2.38
%
 
2.59
%
Efficiency ratio
88.25

 
77.07

 
85.59

 
85.01

 
74.61

Performance ratios, excluding goodwill impairment charges (2)


Per common share information


Earnings


$
0.32

 
$
0.87

Diluted earnings


0.32

 
0.86

Efficiency ratio (FTE basis)


81.64
%
 
63.48
%
Return on average assets


0.20

 
0.42

Return on average common shareholders’ equity


1.54

 
4.14

Return on average tangible common shareholders’ equity


2.46

 
7.03

Return on average tangible shareholders’ equity


3.08

 
7.11

(1) 
Beginning in 2014, interest-bearing deposits placed with the Federal Reserve and certain non-U.S. central banks are included in earning assets. In prior periods, these balances were included with cash and due from banks in the cash and cash equivalents line, consistent with the Consolidated Balance Sheet presentation. Prior periods have been reclassified to conform to current period presentation.
(2) 
Performance ratios are calculated excluding the impact of goodwill impairment charges of $3.2 billion and $12.4 billion recorded in 2011 and 2010.

12     Bank of America 2014


Net Interest Income Excluding Trading-related Net Interest Income
We manage net interest income on an FTE basis and excluding the impact of trading-related activities. As discussed in Global Markets on page 23, we evaluate our sales and trading results and strategies on a total market-based revenue approach by combining net interest income and noninterest income for Global Markets. An analysis of net interest income, average earning assets and net interest yield on earning assets, all of which adjust for the impact of trading-related net interest income from reported net interest income on an FTE basis, is shown below. We believe the use of this non-GAAP presentation in Table 9 provides additional clarity in assessing our results.


Table 9
Net Interest Income Excluding Trading-related Net Interest Income


(Dollars in millions)
2014
 
2013
Net interest income (FTE basis)


As reported
$
40,821

 
$
43,124

Impact of trading-related net interest income
(3,615
)
 
(3,852
)
Net interest income excluding trading-related net interest income (1)
$
37,206

 
$
39,272

Average earning assets (2)


As reported
$
1,814,930

 
$
1,819,548

Impact of trading-related earning assets
(445,760
)
 
(468,999
)
Average earning assets excluding trading-related earning assets (1)
$
1,369,170

 
$
1,350,549

Net interest yield contribution (FTE basis) (2)


As reported 
2.25
%
 
2.37
%
Impact of trading-related activities 
0.47

 
0.54

Net interest yield on earning assets excluding trading-related activities (1)
2.72
%
 
2.91
%
(1) 
Represents a non-GAAP financial measure.
(2) 
Beginning in 2014, interest-bearing deposits placed with the Federal Reserve and certain non-U.S. central banks are included in earning assets. In prior periods, these balances were included with cash and due from banks in the cash and cash equivalents line, consistent with the Consolidated Balance Sheet presentation. Prior periods have been reclassified to conform to current period presentation.
 
Net interest income excluding trading-related net interest income decreased $2.1 billion to $37.2 billion for 2014 compared to 2013. The decline was primarily due to the impact of market-related premium amortization as lower long-term interest rates shortened the expected lives of the securities, lower loan yields and consumer loan balances, and lower net interest income from the ALM portfolio. Market-related premium amortization was an expense of $1.2 billion in 2014 compared to a benefit of $784 million in 2013. Partially offsetting the decline were reductions in funding yields, lower long-term debt balances and commercial loan growth. For more information on the impact of interest rates, see Interest Rate Risk Management for Non-trading Activities on page 85. For more information on market-related premium amortization, see Note 1 – Summary of Significant Accounting Principles to the Consolidated Financial Statements.
Average earning assets excluding trading-related earning assets increased $18.6 billion to $1,369.2 billion for 2014 compared to 2013. The increase was primarily in interest-bearing deposits with the Federal Reserve and commercial loans, partially offset by declines in consumer loans and other earning assets.
Net interest yield on earning assets excluding trading-related activities decreased 19 bps to 2.72 percent for 2014 compared to 2013 due to the same factors as described above.


Bank of America 2014     13


Business Segment Operations
Segment Description and Basis of Presentation
Effective January 1, 2015, to align the segments with how we manage the businesses in 2015, we changed our basis of presentation, and following such change, we report our results of operations through the following five business segments: Consumer Banking, Global Wealth & Investment Management (GWIM), Global Banking, Global Markets and Legacy Assets & Servicing (LAS), with the remaining operations recorded in All Other.
 
For more information on our segment realignment, see Note 1 – Summary of Significant Accounting Principles to the Consolidated Financial Statements. The primary activities, products and businesses of the business segments and All Other are shown below. For additional detailed information, see the business segment and All Other discussions which follow.


14     Bank of America 2014


We prepare and evaluate segment results using certain non-GAAP measures. For additional information, see Supplemental Financial Data on page 12. Table 10 provides selected summary financial data for our business segments and All Other for 2014 and 2013.


Table 10
Business Segment Results


Total Revenue (1)
 
Provision for Credit Losses
 
Noninterest Expense
 
Net Income (Loss)
(Dollars in millions)
2014
 
2013
 
2014
 
2013
 
2014
 
2013
 
2014
 
2013
Consumer Banking
$
30,808

 
$
31,933

 
$
2,680

 
$
3,166

 
$
17,856

 
$
18,911

 
$
6,441

 
$
6,243

Global Wealth & Investment Management
18,404

 
17,790

 
14

 
56

 
13,647

 
13,033

 
2,974

 
2,977

Global Banking
17,677

 
17,504

 
322

 
1,142

 
8,262

 
8,149

 
5,755

 
5,200

Global Markets
16,119

 
15,390

 
110

 
140

 
11,771

 
11,995

 
2,719

 
1,154

Legacy Assets & Servicing
2,680

 
4,456

 
127

 
(283
)
 
20,643

 
12,483

 
(13,114
)
 
(4,905
)
All Other
(572
)
 
2,728

 
(978
)
 
(665
)
 
2,938

 
4,643

 
58

 
762

Total FTE basis
85,116

 
89,801

 
2,275

 
3,556

 
75,117

 
69,214

 
4,833

 
11,431

FTE adjustment
(869
)
 
(859
)


Total Consolidated
$
84,247

 
$
88,942

 
$
2,275

 
$
3,556

 
$
75,117

 
$
69,214

 
$
4,833

 
$
11,431

(1) 
Total revenue is net of interest expense and is on an FTE basis which for consolidated revenue is a non-GAAP financial measure. For more information on this measure, see Supplemental Financial Data on page 12, and for a corresponding reconciliation to a GAAP financial measure, see Statistical Table XV.
The Corporation periodically reviews capital allocated to its businesses and allocates capital annually during the strategic and capital planning processes. We utilize a methodology that considers the effect of regulatory capital requirements in addition to internal risk-based capital models. The Corporation’s internal risk-based capital models use a risk-adjusted methodology incorporating each segment’s credit, market, interest rate, business and operational risk components. For more information on the nature of these risks, see Managing Risk on page 35. The capital allocated to the business segments is referred to as allocated capital, which represents a non-GAAP financial measure. For purposes of goodwill impairment testing, the Corporation utilizes allocated equity as a proxy for the carrying value of its reporting units. Allocated equity in the reporting units is comprised of allocated capital plus capital for the portion of goodwill and intangibles specifically assigned to the reporting unit. For additional information, see Note 8 – Goodwill and Intangible Assets to the Consolidated Financial Statements.
 
During 2014, we made refinements to the amount of capital allocated to each of our businesses based on multiple considerations that included, but were not limited to, Basel 3 Standardized and Advanced risk-weighted assets, business segment exposures and risk profile, and strategic plans. As a result of this process, in 2014, we adjusted the amount of capital being allocated to our business segments. This change resulted in a reduction of unallocated capital, which is included in All Other, and an aggregate increase in the amount of capital being allocated to the business segments, primarily Global Banking and Global Markets. Also, certain changes were made to allocated capital to reflect the segment realignment described above. Prior periods have been reclassified to conform to the current period presentation.
For more information on the business segments and reconciliations to consolidated total revenue, net income and year-end total assets, see Note 24 – Business Segment Information to the Consolidated Financial Statements.


Bank of America 2014     15


Consumer Banking


Deposits
 
Consumer
Lending
 
Total Consumer Banking
 
 
(Dollars in millions)
2014
2013
 
2014
2013
 
2014
2013
 
% Change

Net interest income (FTE basis)
$
9,437

$
9,028

 
$
10,741

$
11,592

 
$
20,178

$
20,620

 
(2
)%
Noninterest income:


Card income
10

12

 
4,834

4,744

 
4,844

4,756

 
2

Service charges
4,159

3,978

 
1

1

 
4,160

3,979

 
5

Mortgage banking income


813

1,916

 
813

1,916

 
(58
)
All other income
415

374

 
398

288

 
813

662

 
23

Total noninterest income
4,584

4,364

 
6,046

6,949

 
10,630

11,313

 
(6
)
Total revenue, net of interest expense (FTE basis)
14,021

13,392

 
16,787

18,541

 
30,808

31,933

 
(4
)


Provision for credit losses
268

231

 
2,412

2,935

 
2,680

3,166

 
(15
)
Noninterest expense
9,848

10,249

 
8,008

8,662

 
17,856

18,911

 
(6
)
Income before income taxes (FTE basis)
3,905

2,912

 
6,367

6,944

 
10,272

9,856

 
4

Income tax expense (FTE basis)
1,456

1,066

 
2,375

2,547

 
3,831

3,613

 
6

Net income
$
2,449

$
1,846

 
$
3,992

$
4,397

 
$
6,441

$
6,243

 
3


Net interest yield (FTE basis)
1.83
%
1.83
%
 
5.54
%
5.92
%
 
3.73
%
3.96
%
 
 
Return on average allocated capital
22

18

 
21

21

 
21

20


Efficiency ratio (FTE basis)
70.24

76.53

 
47.70

46.72

 
57.96

59.22


Balance Sheet


Average


Total loans and leases
$
6,059

$
6,373

 
$
191,056

$
189,804

 
$
197,115

$
196,177


Total earning assets (1)
516,142

492,555

 
193,923

195,869

 
541,225

520,476

 
4

Total assets (1)
542,850

519,133

 
203,330

204,860

 
577,340

556,045

 
4

Total deposits
511,923

488,915

 
n/m

n/m

 
512,818

489,464

 
5

Allocated capital
11,000

10,100

 
19,000

20,600

 
30,000

30,700

 
(2
)


Year end


Total loans and leases
$
5,951

$
6,166

 
$
196,049

$
193,537

 
$
202,000

$
199,703

 
1

Total earning assets (1)
527,045

504,428

 
199,097

197,987

 
552,117

531,557

 
4

Total assets (1)
554,344

531,290

 
208,729

207,309

 
589,048

567,741

 
4

Total deposits
523,348

501,220

 
n/m

n/m

 
524,413

502,054

 
4

(1) 
In segments and businesses where the total of liabilities and equity exceeds assets, we allocate assets from All Other to match the segments’ and businesses’ liabilities and allocated shareholders’ equity. As a result, total earning assets and total assets of the businesses may not equal total Consumer Banking.
n/m = not meaningful
Consumer Banking, which is comprised of Deposits and Consumer Lending, offers a diversified range of credit, banking and investment products and services to consumers and small businesses. Our customers and clients have access to a franchise network that stretches coast to coast through 32 states and the District of Columbia. The franchise network includes approximately 4,800 financial centers, 15,800 ATMs, nationwide call centers, and online and mobile platforms.
Consumer Banking Results
Net income for Consumer Banking increased $198 million to $6.4 billion in 2014 compared to 2013 primarily driven by lower noninterest expense and provision for credit losses, partially offset by lower revenue. Net interest income decreased $442 million to $20.2 billion due to lower average card loan balances and lower card yields, partially offset by the beneficial impact of an increase in investable assets as a result of higher deposit balances. Noninterest income decreased $683 million to $10.6 billion primarily due to lower mortgage banking income and lower revenue from consumer protection products, partially offset by portfolio divestiture gains, and higher service charges and card income.
 
The provision for credit losses decreased $486 million to $2.7 billion in 2014 primarily as a result of improvements in credit quality. Noninterest expense decreased $1.1 billion to $17.9 billion primarily driven by lower personnel, operating, litigation and Federal Deposit Insurance Corporation (FDIC) expenses.
The return on average allocated capital was 21 percent, up from 20 percent, reflecting an increase in net income combined with a small decrease in allocated capital. For more information on capital allocated to the business segments, see Business Segment Operations on page 14.
Deposits
Deposits includes the results of consumer deposit activities which consist of a comprehensive range of products provided to consumers and small businesses. Our deposit products include traditional savings accounts, money market savings accounts, CDs and IRAs, noninterest- and interest-bearing checking accounts, as well as investment accounts and products. The revenue is allocated to the deposit products using our funds transfer pricing process that matches assets and liabilities with similar interest rate sensitivity and maturity characteristics. Deposits generates fees such as account service fees, non-sufficient funds fees,


16     Bank of America 2014


overdraft charges and ATM fees, as well as investment and brokerage fees from Merrill Edge accounts. Merrill Edge is an integrated investing and banking service targeted at customers with less than $250,000 in investable assets. Merrill Edge provides investment advice and guidance, client brokerage asset services, a self-directed online investing platform and key banking capabilities including access to the Corporation’s network of financial centers and ATMs.
Deposits includes the net impact of migrating customers and their related deposit balances between Deposits and GWIM as well as other client-managed businesses. For more information on the migration of customer balances to or from GWIM, see GWIM on page 19.
Net income for Deposits increased $603 million to $2.4 billion in 2014 driven by higher revenue and a decrease in noninterest expense. Net interest income increased $409 million to $9.4 billion primarily driven by a combination of pricing discipline and the beneficial impact of an increase in investable assets as a result of higher deposit balances. Noninterest income increased $220 million to $4.6 billion primarily due to higher deposit service charges.
The provision for credit losses increased $37 million to $268 million as a result of a slower pace of improvement in credit quality. Noninterest expense decreased $401 million to $9.8 billion due to lower operating expenses, driven in part by a reduction in financial centers as customers migrate to self-service touchpoints, in addition to lower FDIC and litigation expenses.
Average deposits increased $23.0 billion to $511.9 billion in 2014 driven by a continuing customer shift to more liquid products in the low rate environment. Growth in checking, traditional savings and money market savings of $34.1 billion was partially offset by a decline in time deposits of $10.4 billion. As a result of our continued pricing discipline and the shift in the mix of deposits, the rate paid on average deposits declined by five bps to six bps.


Key Statistics  Deposits


2014
 
2013
Total deposit spreads (excludes noninterest costs)
1.60
%
 
1.53
%


Year end


Client brokerage assets (in millions)
$
113,763

 
$
96,048

Online banking active accounts (units in thousands)
30,904

 
29,950

Mobile banking active accounts (units in thousands)
16,539

 
14,395

Financial centers
4,855

 
5,151

ATMs
15,838

 
16,259

Client brokerage assets increased $17.7 billion in 2014 driven by new accounts, increased account flows and higher market valuations. Mobile banking active accounts increased 2.1 million reflecting continuing changes in our customers’ banking preferences. The number of financial centers declined 296 and ATMs declined 421 as we continue to optimize our consumer banking network and improve our cost-to-serve.
 
Consumer Lending
Consumer Lending offers products to consumers and small businesses across the U.S. The products offered include credit and debit cards, residential mortgages and home equity loans, and direct and indirect loans such as automotive, marine, aircraft and recreational vehicle, and consumer personal loans. In addition to earning net interest spread revenue on its lending activities, Consumer Lending generates interchange revenue from credit and debit card transactions, late fees, cash advance fees, annual credit card fees, mortgage banking fee income and other miscellaneous fees. Consumer Lending products are available to our customers through our retail network, direct telephone, and online and mobile channels.
Consumer Lending includes the net impact of migrating customers and their related loan balances between Consumer Lending and GWIM. For more information on the migration of customer balances to or from GWIM, see GWIM on page 19.
Net income for Consumer Lending decreased $405 million to $4.0 billion in 2014 primarily due to lower revenue, partially offset by lower noninterest expense and provision for credit losses. Net interest income decreased $851 million to $10.7 billion driven by the impact of lower average card loan balances and lower card and home loan yields, partially offset by higher average home loan balances. Noninterest income decreased $903 million to $6.0 billion driven by lower mortgage banking income and lower revenue from consumer protection products, partially offset by portfolio divestiture gains and higher card income.
The provision for credit losses decreased $523 million to $2.4 billion in 2014 as a result of continued improvement in credit quality, due in part to lower delinquencies. Noninterest expense decreased $654 million to $8.0 billion driven by lower personnel and litigation expenses, partially offset by higher operating expenses.
Average loans increased $1.3 billion to $191.1 billion in 2014 primarily driven by an increase in residential mortgages, small business lending, consumer auto loans and home equity, partially offset by continued run-off of non-core portfolios and portfolio divestitures.


Key Statistics  Consumer Lending


(Dollars in millions)
2014
 
2013
Total U.S. credit card (1)


Gross interest yield
9.35
%
 
9.73
%
Risk-adjusted margin
9.44

 
8.68

New accounts (in thousands)
4,541

 
3,911

Purchase volumes
$
212,088

 
$
205,914

Debit card purchase volumes
$
272,576

 
$
267,087

(1) 
Total U.S. credit card includes portfolios in Consumer Banking and GWIM.
During 2014, the total U.S. credit card risk-adjusted margin increased 76 bps due to an improvement in credit quality and portfolio divestiture gains. Total U.S. credit card purchase volumes increased $6.2 billion to $212.1 billion and debit card purchase volumes increased $5.5 billion to $272.6 billion, reflecting higher levels of consumer spending.


Bank of America 2014     17


Mortgage Banking Income
Mortgage banking income is earned primarily in Consumer Banking and LAS. Mortgage banking income in Consumer Lending consists mainly of core production income, which is comprised primarily of revenue from the fair value gains and losses recognized on our interest rate lock commitments (IRLCs) and LHFS, the related secondary market execution, and costs related to representations and warranties in the sales transactions along with other obligations incurred in the sales of mortgage loans.
The table below summarizes the components of mortgage banking income.


Mortgage Banking Income


(Dollars in millions)
2014
 
2013
Consumer Lending:


Core production revenue
$
875

 
$
2,097

Representations and warranties provision
10

 
(104
)
Other consumer mortgage banking income (1)
(72
)
 
(77
)
Total Consumer Lending mortgage banking income
813

 
1,916

LAS mortgage banking income (2)
1,053

 
2,670

Eliminations (3)
(303
)
 
(712
)
Total consolidated mortgage banking income
$
1,563

 
$
3,874

(1) 
Primarily intercompany charge for loan servicing activities provided by LAS.
(2) 
Amounts for LAS are included in this Consumer Banking table to show the components of consolidated mortgage banking income.
(3) 
Includes the effect of transfers of mortgage loans from Consumer Banking to the ALM portfolio included in All Other and intercompany charges for loan servicing.

Core production revenue decreased $1.2 billion to $875 million in 2014 due to lower first mortgage origination volumes, and to a lesser extent, industry-wide margin compression.


Key Statistics


(Dollars in millions)
2014
 
2013
Loan production (1):


Total (2)


First mortgage
$
43,290

 
$
83,421

Home equity
11.233

 
6,361

Consumer Banking:


First mortgage
$
32,340

 
$
66,913

Home equity
10,286

 
5,948

(1) 
The above loan production amounts represent the unpaid principal balance of loans and in the case of home equity, the principal amount of the total line of credit.
(2) 
In addition to loan production in Consumer Banking, there is also first mortgage and home equity loan production in GWIM.

First mortgage loan originations in Consumer Banking and for the total Corporation declined in 2014 compared to 2013 reflecting a decline in the overall mortgage market as higher interest rates throughout most of 2014 drove a decrease in refinances.
During 2014, 60 percent of the total Corporation first mortgage production volume was for refinance originations and 40 percent was for purchase originations compared to 82 percent and 18 percent in 2013. Home Affordable Refinance Program (HARP) refinance originations were six percent of all refinance originations compared to 23 percent in 2013. Making Home Affordable non-HARP refinance originations were 17 percent of all refinance originations compared to 19 percent in 2013. The remaining 77 percent of refinance originations were conventional refinances compared to 58 percent in 2013.
Home equity production for the total Corporation was $11.2 billion for 2014 compared to $6.4 billion for 2013, with the increase due to a higher demand in the market based on improving housing trends, and increased market share driven by improved financial center engagement with customers and more competitive pricing.


18     Bank of America 2014


Global Wealth & Investment Management


(Dollars in millions)
2014
 
2013
 
% Change
Net interest income (FTE basis)
$
5,836

 
$
6,064

 
(4
)%
Noninterest income:


Investment and brokerage services
10,722

 
9,709

 
10

All other income
1,846

 
2,017

 
(8
)
Total noninterest income
12,568

 
11,726

 
7

Total revenue, net of interest expense (FTE basis)
18,404

 
17,790

 
3


Provision for credit losses
14

 
56

 
(75
)
Noninterest expense
13,647

 
13,033

 
5

Income before income taxes (FTE basis)
4,743

 
4,701

 
1

Income tax expense (FTE basis)
1,769

 
1,724

 
3

Net income
$
2,974

 
$
2,977


Net interest yield (FTE basis)
2.34
%
 
2.46
%
 
 
Return on average allocated capital
25

 
30


Efficiency ratio (FTE basis)
74.15

 
73.26


Balance Sheet


Average


Total loans and leases
$
119,775

 
$
111,023

 
8

Total earning assets
248,979

 
246,653

 
1

Total assets
267,511

 
266,047

 
1

Total deposits
240,242

 
242,161

 
(1
)
Allocated capital
12,000

 
10,000

 
20


Year end


Total loans and leases
$
125,431

 
$
115,846

 
8

Total earning assets
256,519

 
251,209

 
2

Total assets
274,887

 
271,290

 
1

Total deposits
245,391

 
244,901


GWIM consists of two primary businesses: Merrill Lynch Global Wealth Management (MLGWM) and U.S. Trust, Bank of America Private Wealth Management (U.S. Trust).
MLGWM’s advisory business provides a high-touch client experience through a network of financial advisors focused on clients with over $250,000 in total investable assets. MLGWM provides tailored solutions to meet our clients’ needs through a full set of brokerage, banking and retirement products.
U.S. Trust, together with MLGWM’s Private Banking & Investments Group, provides comprehensive wealth management solutions targeted to high net worth and ultra high net worth clients, as well as customized solutions to meet clients’ wealth structuring, investment management, trust and banking needs, including specialty asset management services.
Net income remained relatively unchanged in 2014 compared to 2013 as an increase in noninterest income and lower credit costs were offset by lower net interest income and higher noninterest expense.
Net interest income decreased $228 million to $5.8 billion as a result of the low rate environment, partially offset by the impact of loan growth. Noninterest income, primarily investment and brokerage services, increased $842 million to $12.6 billion driven by increased asset management fees due to the impact of long-term AUM flows and higher market levels, partially offset by lower transactional revenue. Noninterest expense increased $614 million to $13.6 billion primarily due to higher revenue-related incentive compensation and support expenses, partially offset by lower other expenses.
 
Return on average allocated capital was 25 percent, down from 30 percent due to an increase in capital allocations. For more information on capital allocated to the business segments, see Business Segment Operations on page 14.
Revenue by Business
The table below summarizes revenue for MLGWM, U.S. Trust and other GWIM businesses.


Revenue by Business


(Dollars in millions)
2014
 
2013
Merrill Lynch Global Wealth Management
$
15,256

 
$
14,771

U.S. Trust
3,084

 
2,953

Other (1)
64

 
66

Total revenue, net of interest expense (FTE basis)
$
18,404

 
$
17,790

(1) 
Other includes the results of BofA Global Capital Management and certain administrative items.
In 2014, revenue from MLGWM was $15.3 billion, up three percent, driven by increased asset management fees due to the impact of long-term AUM flows and higher market levels, partially offset by the impact of the low rate environment on net interest income and lower transactional revenue. In 2014, revenue from U.S. Trust was $3.1 billion, up four percent, driven by increased asset management fees due to the impact of higher market levels and long-term AUM flows.


Bank of America 2014     19


Client Balances
The table below presents client balances which consist of AUM, brokerage assets, assets in custody, deposits, and loans and leases.


Client Balances by Type


December 31
(Dollars in millions)
2014
 
2013
Assets under management
$
902,872

 
$
821,449

Brokerage assets
1,081,434

 
1,045,122

Assets in custody
139,555

 
136,190

Deposits
245,391

 
244,901

Loans and leases (1)
128,745

 
118,776

Total client balances 
$
2,497,997

 
$
2,366,438

(1) 
Includes margin receivables which are classified in customer and other receivables on the Consolidated Balance Sheet.
The increase of $131.6 billion, or six percent, in client balances was driven by higher market levels and long-term AUM flows.
 
Net Migration Summary
GWIM results are impacted by the net migration of clients and their corresponding deposit, loan and brokerage balances primarily to or from Consumer Banking, as presented in the table below. Migrations result from the movement of clients between business segments to better align with client needs. In addition to business-as-usual migration during 2013, GWIM identified and transferred a client population with deposit balances of $23.3 billion and home equity loan balances of $4.5 billion to Consumer Banking, while Consumer Banking transferred credit card loan balances of $3.2 billion to GWIM.


Net Migration Summary


(Dollars in millions)
2014
 
2013
Total deposits, net – (from) to GWIM
$
1,350

 
$
(20,974
)
Total loans, net – (from) to GWIM
(61
)
 
(1,356
)
Total brokerage, net – (from) to GWIM
(2,710
)
 
(1,251
)


20     Bank of America 2014


Global Banking


(Dollars in millions)
2014
 
2013
 
% Change
Net interest income (FTE basis)
$
9,828

 
$
9,704

 
1
 %
Noninterest income:


Service charges
2,900

 
2,967

 
(2
)
Investment banking fees
3,213

 
3,234

 
(1
)
All other income
1,736

 
1,599

 
9

Total noninterest income
7,849

 
7,800

 
1

Total revenue, net of interest expense (FTE basis)
17,677

 
17,504

 
1


Provision for credit losses
322

 
1,142

 
(72
)
Noninterest expense
8,262

 
8,149

 
1

Income before income taxes (FTE basis)
9,093

 
8,213

 
11

Income tax expense (FTE basis)
3,338

 
3,013

 
11

Net income
$
5,755

 
$
5,200

 
11


Net interest yield (FTE basis)
3.07
%
 
3.38
%
 
 
Return on average allocated capital
17

 
20


Efficiency ratio (FTE basis)
46.74

 
46.56


Balance Sheet


Average


Total loans and leases
$
286,493

 
$
273,320

 
5

Total earning assets
320,194

 
287,228

 
11

Total assets
365,665

 
331,947

 
10

Total deposits
291,366

 
265,733

 
10

Allocated capital
33,500

 
25,400

 
32


Year end


Total loans and leases
$
288,905

 
$
285,880

 
1

Total earning assets
311,782

 
316,349

 
(1
)
Total assets
357,081

 
360,789

 
(1
)
Total deposits
283,191

 
294,559

 
(4
)
Global Banking, which includes Global Corporate Banking, Global Commercial Banking, Business Banking and Global Investment Banking, provides a wide range of lending-related products and services, integrated working capital management and treasury solutions to clients, and underwriting and advisory services through our network of offices and client relationship teams. Our lending products and services include commercial loans, leases, commitment facilities, trade finance, real estate lending and asset-based lending. Our treasury solutions business includes treasury management, foreign exchange and short-term investing options. We also provide investment banking products to our clients such as debt and equity underwriting and distribution, and merger-related and other advisory services. Underwriting debt and equity issuances, fixed-income and equity research, and certain market-based activities are executed through our global broker-dealer affiliates which are our primary dealers in several countries. Within Global Banking, Global Commercial Banking clients generally include middle-market companies, commercial real estate firms, auto dealerships and not-for-profit companies. Global Corporate Banking clients generally include large global
 
corporations, financial institutions and leasing clients. Business Banking clients include mid-sized U.S.-based businesses requiring customized and integrated financial advice and solutions.
Net income for Global Banking increased $555 million to $5.8 billion in 2014 compared to 2013 primarily driven by a reduction in the provision for credit losses and, to a lesser degree, an increase in revenue, partially offset by higher noninterest expense. Revenue increased $173 million to $17.7 billion in 2014 primarily from higher net interest income.
The provision for credit losses decreased $820 million to $322 million in 2014 driven by improved credit quality in the current year, and the prior year included increased reserves from loan growth. Noninterest expense increased $113 million to $8.3 billion in 2014 primarily from additional client-facing personnel expense and higher litigation expense.
Return on average allocated capital was 17 percent in 2014, down from 20 percent in 2013 as growth in earnings was more than offset by increased capital allocations. For more information on capital allocated to the business segments, see Business Segment Operations on page 14.


Bank of America 2014     21


Global Corporate, Global Commercial and Business Banking
Global Corporate, Global Commercial and Business Banking each include Business Lending and Global Transaction Services (formerly Global Treasury Services) activities. Business Lending includes various lending-related products and services, and related hedging activities, including commercial loans, leases,
 
commitment facilities, trade finance, real estate lending and asset-based lending. Global Transaction Services includes deposits, treasury management, credit card, foreign exchange, and short-term investment and custody solutions.
The table below presents a summary of the results, which exclude certain capital markets activity in Global Banking.


Global Corporate, Global Commercial and Business Banking


Global Corporate Banking
 
Global Commercial Banking
 
Business Banking
 
Total
(Dollars in millions)
2014
 
2013
 
2014

2013
 
2014
 
2013
 
2014
 
2013
Revenue


Business Lending
$
3,420

 
$
3,432

 
$
3,942

 
$
3,967

 
$
364

 
$
320

 
$
7,726

 
$
7,719

Global Transaction Services
3,028

 
2,804

 
2,887

 
2,939

 
714

 
705

 
6,629

 
6,448

Total revenue, net of interest expense
$
6,448

 
$
6,236

 
$
6,829

 
$
6,906

 
$
1,078

 
$
1,025

 
$
14,355

 
$
14,167


Balance Sheet


Average


Total loans and leases
$
129,610

 
$
126,629

 
$
140,539

 
$
130,606

 
$
16,329

 
$
16,072

 
$
286,478

 
$
273,307

Total deposits
143,648

 
128,198

 
117,664

 
108,532

 
30,055

 
28,968

 
291,367

 
265,698


Year end


Total loans and leases
$
131,019

 
$
130,066

 
$
141,555

 
$
139,401

 
$
16,333

 
$
16,411

 
$
288,907

 
$
285,878

Total deposits
130,557

 
144,312

 
120,787

 
120,860

 
31,847

 
29,388

 
283,191

 
294,560

Business Lending revenue remained relatively unchanged in 2014 compared to 2013 as the impact of growth in average loan balances was offset by spread compression.
Global Transaction Services revenue in Global Corporate Banking increased $224 million in 2014 driven by the impact of growth in U.S. and non-U.S. deposit balances. Global Transaction Services revenue in Global Commercial Banking and Business Banking remained relatively unchanged as the impact of higher deposit balances was more than offset by spread compression.
Average loans and leases increased five percent in 2014 driven by growth in the commercial and industrial and commercial real estate portfolios. Average deposits increased 10 percent in 2014 due to client liquidity and international growth.
Global Investment Banking
Client teams and product specialists underwrite and distribute debt, equity and loan products, and provide advisory services and tailored risk management solutions. The economics of most investment banking and underwriting activities are shared primarily between Global Banking and Global Markets based on the activities performed by each segment. To provide a complete discussion of our consolidated investment banking fees, the table below
 
presents total Corporation investment banking fees including the portion attributable to Global Banking.


Investment Banking Fees


Global Banking
 
Total Corporation
(Dollars in millions)
2014

2013
 
2014
 
2013
Products


Advisory
$
1,098

 
$
1,019

 
$
1,207

 
$
1,125

Debt issuance
1,532

 
1,620

 
3,583

 
3,804

Equity issuance
583

 
595

 
1,490

 
1,472

Gross investment banking fees
3,213

 
3,234

 
6,280

 
6,401

Self-led deals
(91
)
 
(92
)
 
(215
)
 
(275
)
Total investment banking fees
$
3,122

 
$
3,142

 
$
6,065

 
$
6,126

Total Corporation investment banking fees of $6.1 billion, excluding self-led deals, included within Global Banking and Global Markets remained relatively unchanged in 2014 compared to 2013 as strong investment-grade underwriting and advisory fees were offset by lower underwriting fees for other debt products.


22     Bank of America 2014


Global Markets


(Dollars in millions)
2014
 
2013
 
% Change
Net interest income (FTE basis)
$
3,986

 
$
4,224

 
(6
)%
Noninterest income:


Investment and brokerage services
2,163

 
2,046

 
6

Investment banking fees
2,743

 
2,724

 
1

Trading account profits
5,997

 
6,734

 
(11
)
All other income (loss)
1,230

 
(338
)
 
n/m

Total noninterest income
12,133

 
11,166

 
9

Total revenue, net of interest expense (FTE basis)
16,119

 
15,390

 
5


Provision for credit losses
110

 
140

 
(21
)
Noninterest expense
11,771

 
11,995

 
(2
)
Income before income taxes (FTE basis)
4,238

 
3,255

 
30

Income tax expense (FTE basis)
1,519

 
2,101

 
(28
)
Net income
$
2,719

 
$
1,154

 
136


Return on average allocated capital
8
%
 
4
%
 
 
Efficiency ratio (FTE basis)
73.03

 
77.94


Balance Sheet


Average


Total trading-related assets (1)
$
449,814

 
$
468,934

 
(4
)
Total loans and leases
62,064

 
60,058

 
3

Total earning assets (1)
461,179

 
481,433

 
(4
)
Total assets
607,535

 
632,681

 
(4
)
Allocated capital
34,000

 
30,000

 
13


Year end


Total trading-related assets (1)
$
418,860

 
$
411,080

 
2

Total loans and leases
59,388

 
67,381

 
(12
)
Total earning assets (1)
421,799

 
432,807

 
(3
)
Total assets
579,512

 
575,473

 
1

(1) 
Trading-related assets include derivative assets, which are considered non-earning assets.
n/m = not meaningful
Global Markets offers sales and trading services, including research, to institutional clients across fixed-income, credit, currency, commodity and equity businesses. Global Markets product coverage includes securities and derivative products in both the primary and secondary markets. Global Markets provides market-making, financing, securities clearing, settlement and custody services globally to our institutional investor clients in support of their investing and trading activities. We also work with our commercial and corporate clients to provide risk management products using interest rate, equity, credit, currency and commodity derivatives, foreign exchange, fixed-income and mortgage-related products. As a result of our market-making activities in these products, we may be required to manage risk in a broad range of financial products including government securities, equity and equity-linked securities, high-grade and high-yield corporate debt securities, syndicated loans, MBS, commodities and asset-backed securities (ABS). In addition, the economics of most investment banking and underwriting activities are shared primarily between Global Markets and Global Banking based on the activities performed by each segment. Global Banking originates certain deal-related transactions with our corporate and commercial clients that are executed and distributed by Global Markets. For more information on investment banking fees on a consolidated basis, see page 22.
 
Net income for Global Markets increased $1.6 billion to $2.7 billion in 2014 compared to 2013. In 2014, we adopted a funding valuation adjustment into our valuation estimates primarily to include funding costs on uncollateralized derivatives and derivatives where we are not permitted to use the collateral we receive. This change in estimate resulted in a net FVA pretax charge of $497 million. Excluding net DVA/FVA and charges in 2013 related to the U.K. corporate income tax rate reduction, net income decreased $141 million to $2.9 billion primarily driven by lower trading account profits and net interest income, partially offset by a decrease in noninterest expense, a $240 million gain in 2014 related to the initial public offering (IPO) of an equity investment and higher investment and brokerage services income. Results for 2013 included a $450 million write-down of a monoline receivable due to the settlement of a legacy matter. Net DVA/FVA losses were $240 million compared to losses of $1.2 billion in 2013. Noninterest expense decreased $224 million to $11.8 billion due to lower litigation expense and revenue-related incentives, partially offset by higher technology costs and investments in infrastructure.
Average earning assets decreased $20.3 billion to $461.2 billion in 2014 largely driven by a decrease in trading assets to further optimize the balance sheet.


Bank of America 2014     23


Year-end loans and leases decreased $8.0 billion in 2014 due to a decrease in low-margin prime brokerage loans.
The return on average allocated capital was eight percent, up from four percent, largely driven by higher net income, partially offset by an increase in allocated capital. Excluding net DVA/FVA and charges in 2013 related to the U.K. corporate income tax rate reduction, the return on average allocated capital was eight percent, a decrease from 10 percent, driven by lower net income, excluding net DVA/FVA and the tax change, and an increase in allocated capital.
Sales and Trading Revenue
Sales and trading revenue includes unrealized and realized gains and losses on trading and other assets, net interest income, and fees primarily from commissions on equity securities. Sales and trading revenue is segregated into fixed income (government debt obligations, investment and non-investment grade corporate debt obligations, commercial mortgage-backed securities, residential mortgage-backed securities (RMBS), collateralized loan obligations (CLOs), interest rate and credit derivative contracts), currencies (interest rate and foreign exchange contracts), commodities (primarily futures, forwards, swaps and options) and equities (equity-linked derivatives and cash equity activity). The following table and related discussion present sales and trading revenue, substantially all of which is in Global Markets, with the remainder in Global Banking. In addition, the following table and related discussion present sales and trading revenue excluding the impact of net DVA/FVA, which is a non-GAAP financial measure. We believe the use of this non-GAAP financial measure provides clarity in assessing the underlying performance of these businesses.


Sales and Trading Revenue (1, 2)


(Dollars in millions)
2014
 
2013
Sales and trading revenue


Fixed income, currencies and commodities
$
8,706

 
$
8,231

Equities
4,215

 
4,180

Total sales and trading revenue
$
12,921

 
$
12,411


Sales and trading revenue, excluding net DVA/FVA (3)


Fixed income, currencies and commodities
$
9,013

 
$
9,345

Equities
4,148

 
4,224

Total sales and trading revenue, excluding net DVA/FVA
$
13,161

 
$
13,569

(1) 
Includes FTE adjustments of $181 million and $180 million for 2014 and 2013. For more information on sales and trading revenue, see Note 2 – Derivatives to the Consolidated Financial Statements.
(2) 
Includes Global Banking sales and trading revenue of $382 million and $385 million for 2014 and 2013.
(3) 
FICC and Equities sales and trading revenue, excluding the impact of net DVA and FVA, is a non-GAAP financial measure. FICC net DVA/FVA losses were $307 million for 2014 compared to net DVA losses of $1.1 billion in 2013. Equities net DVA/FVA gains were $67 million for 2014 compared to net DVA losses of $44 million in 2013.
Fixed-income, currency and commodities (FICC) revenue, excluding net DVA/FVA, decreased $332 million to $9.0 billion driven by declines in the rates and credit-related businesses due to both lower market volumes and volatility, partially offset by improvement in the commodities business. The prior year included a $450 million write-down of a monoline receivable related to the settlement of a legacy matter. Equities revenue, excluding net DVA/FVA, decreased $76 million to $4.1 billion due to financing additional liquid asset buffers, pursuant to current regulatory requirements, primarily in our broker-dealer entities, which also negatively impacted FICC results.


24     Bank of America 2014


Legacy Assets & Servicing


(Dollars in millions)
2014
 
2013
 
% Change
Net interest income (FTE basis)
$
1,516

 
$
1,541

 
(2
)%
Noninterest income:


Mortgage banking income
1,053

 
2,670

 
(61
)
All other income
111

 
245

 
(55
)
Total noninterest income
1,164

 
2,915

 
(60
)
Total revenue, net of interest expense (FTE basis)
2,680

 
4,456

 
(40
)


Provision for credit losses
127

 
(283
)
 
(145
)
Noninterest expense
20,643

 
12,483

 
65

Loss before income taxes (FTE basis)
(18,090
)
 
(7,744
)
 
134

Income tax benefit (FTE basis)
(4,976
)
 
(2,839
)
 
75

Net loss
$
(13,114
)
 
$
(4,905
)
 
n/m


Net interest yield (FTE basis)
4.03
%
 
3.19
%


Balance Sheet


Average


Total loans and leases
$
35,941

 
$
42,604

 
(16
)
Total earning assets
37,593

 
48,272

 
(22
)
Total assets
52,134

 
67,129

 
(22
)
Allocated capital
17,000

 
18,000

 
(6
)


Year end


Total loans and leases
$
33,055

 
$
38,732

 
(15
)
Total earning assets
33,923

 
43,092

 
(21
)
Total assets
45,958

 
59,458

 
(23
)
n/m = not meaningful
LAS is responsible for our mortgage servicing activities related to residential first mortgage and home equity loans serviced for others and loans held by the Corporation, including loans that have been designated as the LAS Portfolios. The LAS Portfolios (both owned and serviced), herein referred to as the Legacy Owned and Legacy Serviced Portfolios, respectively (together, the Legacy Portfolios), and as further defined below, include those loans originated prior to January 1, 2011 that would not have been originated under our established underwriting standards as of December 31, 2010. For more information on our Legacy Portfolios, see page 26. In addition, LAS is responsible for managing certain legacy exposures related to mortgage originations, sales and servicing activities (e.g., litigation, representations and warranties). LAS also includes the financial results of the home equity portfolio selected as part of the Legacy Owned Portfolio and the results of MSR activities, including net hedge results.
LAS includes certain revenues and expenses on loans serviced for others, including owned loans serviced for Consumer Banking, GWIM and All Other.
The net loss for LAS increased $8.2 billion to a net loss of $13.1 billion for 2014 compared to 2013 primarily driven by significantly higher litigation expense, which is included in noninterest expense, as a result of the settlements with the DoJ and FHFA, a lower tax benefit rate resulting from the non-deductible treatment of a portion of the settlement with the DoJ, lower mortgage banking income and higher provision for credit losses.
Mortgage banking income decreased $1.6 billion primarily due to lower servicing income, partially offset by a lower representations and warranties provision. The provision for credit losses increased $410 million driven by additional costs
 
associated with the consumer relief portion of the settlement with the DoJ. Noninterest expense increased $8.2 billion due to a $11.4 billion increase in litigation expense as a result of the settlements with the DoJ and FHFA. Excluding litigation, noninterest expense decreased $3.3 billion to $5.4 billion driven by a decline in default-related servicing expenses, including mortgage-related assessments, waivers and similar costs related to foreclosure delays. We expect that noninterest expense in LAS, excluding litigation expense, will decline to approximately $800 million per quarter by the end of 2015.
Servicing
LAS is responsible for all of our in-house servicing activities related to the residential mortgage and home equity loan portfolios, including owned loans and loans serviced for others (collectively, the mortgage serviced portfolio). A portion of this portfolio has been designated as the Legacy Serviced Portfolio, which represented 26 percent, 30 percent and 39 percent of the total mortgage serviced portfolio, as measured by unpaid principal balance, at December 31, 2014, 2013 and 2012, respectively. In addition, LAS is responsible for managing subservicing agreements.
Servicing activities include collecting cash for principal, interest and escrow payments from borrowers, disbursing customer draws for lines of credit, accounting for and remitting principal and interest payments to investors and escrow payments to third parties, and responding to customer inquiries. Our home retention efforts, including single point of contact resources, are also part of our servicing activities, along with supervision of foreclosures and property dispositions. Prior to foreclosure, LAS evaluates various workout options in an effort to help our


Bank of America 2014     25


customers avoid foreclosure. For more information on our servicing activities, including the impact of foreclosure delays, see Off-Balance Sheet Arrangements and Contractual Obligations – Servicing, Foreclosure and Other Mortgage Matters on page 33.
Legacy Portfolios
The Legacy Portfolios (both owned and serviced) include those loans originated prior to January 1, 2011 that would not have been originated under our established underwriting standards in place as of December 31, 2010. The purchased credit-impaired (PCI) portfolio, as well as certain loans that met a pre-defined delinquency status or probability of default threshold as of January 1, 2011, are also included in the Legacy Portfolios. Since determining the pool of loans to be included in the Legacy Portfolios as of January 1, 2011, the criteria have not changed for these portfolios, but will continue to be evaluated over time.
Legacy Owned Portfolio
The Legacy Owned Portfolio includes those loans that met the criteria as described above and are on the balance sheet of the Corporation. Home equity loans in this portfolio are held on the balance sheet of LAS, and residential mortgage loans in this portfolio are included as part of All Other. The financial results of the on-balance sheet loans are reported in the segment that owns the loans or in All Other. Total loans in the Legacy Owned Portfolio decreased $22.2 billion in 2014 to $89.9 billion at December 31, 2014, of which $33.1 billion was held on the LAS balance sheet and the remainder was included as part of All Other. The decrease was due to payoffs, paydowns and loan sales.
Legacy Serviced Portfolio
The Legacy Serviced Portfolio includes loans serviced by LAS in both the Legacy Owned Portfolio and those loans serviced for outside investors that met the criteria as described above. The table below summarizes the balances of the residential mortgage loans included in the Legacy Serviced Portfolio (the Legacy Residential Mortgage Serviced Portfolio) representing 24 percent, 28 percent and 38 percent of the total residential mortgage serviced portfolio of $609 billion, $719 billion and $1.2 trillion, as measured by unpaid principal balance, at December 31, 2014, 2013 and 2012, respectively. The decline in the Legacy Residential Mortgage Serviced Portfolio was due to paydowns and payoffs, and MSR and loan sales.


Legacy Residential Mortgage Serviced Portfolio, a subset of the Residential Mortgage Serviced Portfolio (1)


December 31
(Dollars in billions)
 
2014
 
2013
 
2012
Unpaid principal balance


Residential mortgage loans


Total
 
$
148

 
$
203

 
$
467

60 days or more past due
 
25

 
49

 
137


Number of loans serviced (in thousands)


Residential mortgage loans


Total
 
794

 
1,083

 
2,542

60 days or more past due
 
135

 
258

 
649

(1) 
Excludes $34 billion, $39 billion and $52 billion of home equity loans and HELOCs at December 31, 2014, 2013 and 2012, respectively.
Non-Legacy Portfolio
As previously discussed, LAS is responsible for all of our servicing activities. The table below summarizes the balances of the residential mortgage loans that are not included in the Legacy Serviced Portfolio (the Non-Legacy Residential Mortgage Serviced Portfolio) representing 76 percent, 72 percent and 62 percent of the total residential mortgage serviced portfolio, as measured by unpaid principal balance, at December 31, 2014, 2013 and 2012, respectively. The decline in the Non-Legacy Residential Mortgage Serviced Portfolio was primarily due to MSR sales and other servicing transfers, paydowns and payoffs, partially offset by new originations.


Non-Legacy Residential Mortgage Serviced Portfolio, a subset of the Residential Mortgage Serviced Portfolio (1)


December 31
(Dollars in billions)
 
2014
 
2013
 
2012
Unpaid principal balance


Residential mortgage loans


Total
 
$
461

 
$
516

 
$
755

60 days or more past due
 
9

 
12

 
22


Number of loans serviced (in thousands)


Residential mortgage loans


Total
 
2,951

 
3,267

 
4,764

60 days or more past due
 
54

 
67

 
124

(1) 
Excludes $50 billion, $52 billion and $58 billion of home equity loans and HELOCs at December 31, 2014, 2013 and 2012, respectively.


26     Bank of America 2014


LAS Mortgage Banking Income
LAS mortgage banking income includes income earned in connection with servicing activities and MSR valuation adjustments, net of results from risk management activities used to hedge certain market risks of the MSRs. The costs associated with our servicing activities are included in noninterest expense. LAS mortgage banking income also includes the cost of legacy representations and warranties exposures and revenue from the sales of loans that had returned to performing status. The table below summarizes LAS mortgage banking income.


LAS Mortgage Banking Income


(Dollars in millions)
2014
 
2013
Servicing income:


Servicing fees
$
1,957

 
$
3,105

Amortization of expected cash flows (1)
(818
)
 
(1,043
)
Fair value changes of MSRs, net of risk management activities used to hedge certain market risks (2)
294

 
867

Other servicing-related revenue
8

 
30

Total net servicing income
1,441

 
2,959

Representations and warranties provision
(693
)
 
(736
)
Other mortgage banking income (3)
305

 
447

Total LAS mortgage banking income
$
1,053

 
$
2,670

(1) 
Represents the net change in fair value of the MSR asset due to the recognition of modeled cash flows.
(2) 
Includes gains (losses) on sales of MSRs.
(3) 
Consists primarily of revenue from sales of repurchased loans that had returned to performing status.
LAS mortgage banking income decreased $1.6 billion to $1.1 billion primarily driven by a decline in servicing fees due to a smaller servicing portfolio and less favorable MSR net-of-hedge performance, partially offset by lower amortization of expected cash flows. The decline in the size of our servicing portfolio was driven by strategic sales of MSRs during 2014 and 2013 as well as loan prepayment activity, which exceeded new originations primarily due to our exit from non-retail channels. In addition, the representations and warranties provision decreased $43 million to $693 million and was primarily related to non-government-
 
sponsored enterprises exposures, partially offset by lower exposure to mortgage insurance companies as a result of settlements in 2014.


Key Statistics


(Dollars in millions, except as noted)
2014
 
2013
 
Year end


Mortgage serviced portfolio (in billions) (1, 2)
$
693

 
$
810

 
Mortgage loans serviced for investors (in billions) (1)
474

 
550

 
Mortgage servicing rights:


Balance (3)
3,271

 
5,042

 
Capitalized mortgage servicing rights
 (% of loans serviced for investors)
69

bps
92

bps
(1) 
The servicing portfolio and mortgage loans serviced for investors represent the unpaid principal balance of loans.
(2) 
Servicing of residential mortgage loans, HELOCs and home equity loans by LAS.
(3) 
At December 31, 2014, excludes $259 million of certain non-U.S. residential mortgage MSR balances that are recorded in Global Markets.
Mortgage Servicing Rights
At December 31, 2014, the balance of consumer MSRs managed within LAS, which excludes $259 million of certain non-U.S. residential mortgage MSRs recorded in Global Markets, was $3.3 billion, which represented 69 bps of the related unpaid principal balance compared to $5.0 billion, or 92 bps of the related unpaid principal balance at December 31, 2013. The consumer MSR balance managed within LAS decreased $1.8 billion during 2014 primarily driven by a decrease in value due to lower mortgage rates at December 31, 2014 compared to December 31, 2013, which resulted in higher forecasted prepayment speeds, and the recognition of modeled cash flows, partially offset by additions to the portfolio. For more information on our servicing activities, see Off-Balance Sheet Arrangements and Contractual Obligations – Servicing, Foreclosure and Other Mortgage Matters on page 33. For more information on MSRs, see Note 23 – Mortgage Servicing Rights to the Consolidated Financial Statements.


Bank of America 2014     27


All Other


(Dollars in millions)
2014
 
2013
 
% Change
Net interest income (FTE basis)
$
(523
)
 
$
971

 
n/m

Noninterest income:


Card income
356

 
329

 
8
 %
Equity investment income
729

 
2,737

 
(73
)
Gains on sales of debt securities
1,310

 
1,231

 
6

All other loss
(2,444
)
 
(2,540
)
 
(4
)
Total noninterest income
(49
)
 
1,757

 
n/m

Total revenue, net of interest expense (FTE basis)
(572
)
 
2,728

 
n/m


Provision (benefit) for credit losses
(978
)
 
(665
)
 
47

Noninterest expense
2,938

 
4,643

 
(37
)
Loss before income taxes (FTE basis)
(2,532
)
 
(1,250
)
 
103

Income tax benefit (FTE basis)
(2,590
)
 
(2,012
)
 
29

Net income
$
58

 
$
762

 
(92
)


Balance Sheet


Average


Loans and leases:


Residential mortgage
$
180,249

 
$
208,535

 
(14
)
Non-U.S. credit card
11,511

 
10,861

 
6

Other
10,753

 
16,063

 
(33
)
Total loans and leases
202,513

 
235,459

 
(14
)
Total assets (1)
275,405

 
309,664

 
(11
)
Total deposits
30,837

 
35,443

 
(13
)


Year end


Loans and leases:


Residential mortgage
$
155,595

 
$
197,061

 
(21
)
Non-U.S. credit card
10,465

 
11,541

 
(9
)
Other
6,552

 
12,089

 
(46
)
Total loans and leases
172,612

 
220,691

 
(22
)
Total assets (1)
258,048

 
267,522

 
(4
)
Total deposits
19,242

 
28,165

 
(32
)
(1) 
In segments where the total of liabilities and equity exceeds assets, which are generally deposit-taking segments, we allocate assets from All Other to those segments to match liabilities (i.e., deposits) and allocated shareholders’ equity. Such allocated assets were $483.7 billion and $448.9 billion for 2014 and 2013, and $478.2 billion and $473.5 billion at December 31, 2014 and 2013.
n/m = not meaningful
All Other consists of ALM activities, equity investments, the international consumer card business, liquidating businesses, residual expense allocations and other. ALM activities encompass residential mortgage securities, interest rate and foreign currency risk management activities including the residual net interest income allocation, the impact of certain allocation methodologies and accounting hedge ineffectiveness. Additionally, certain residential mortgage loans that are managed by LAS are held in All Other. The results of certain ALM activities are allocated to our business segments. For more information on our ALM activities, see Interest Rate Risk Management for Non-trading Activities on page 85.
 
Equity investments include our merchant services joint venture as well as GPI which is comprised of a portfolio of equity, real estate and other alternative investments. These investments are made either directly in a company or held through a fund with related income recorded in equity investment income. In connection with our strategy to focus on our core businesses and to conform with the Volcker Rule, the GPI portfolio has been actively winding down over the last several years through a series of portfolio and individual asset sale transactions. For more information on our merchant services joint venture, see Note 12 – Commitments and Contingencies to the Consolidated Financial Statements.


28     Bank of America 2014


Net income for All Other decreased $704 million to $58 million in 2014 primarily due to the negative impact on net interest income of market-related premium amortization expense on debt securities of $1.2 billion compared to a benefit of $784 million in 2013 as lower long-term interest rates shortened the expected lives of the securities, a decrease of $2.0 billion in equity investment income and a $363 million increase in U.K. PPI costs. Partially offsetting these decreases were gains related to the sales of residential mortgage loans, a $313 million improvement in the provision (benefit) for credit losses and a decrease of $1.7 billion in noninterest expense. The provision (benefit) for credit losses improved $313 million to a benefit of $978 million in 2014 primarily driven by the impact of recoveries related to nonperforming and delinquent loan sales, partially offset by a slower pace of credit quality improvement related to the residential mortgage portfolio. Noninterest expense decreased $1.7 billion to $2.9 billion primarily due to a decline in litigation expense, lower net occupancy expense and a decline in professional fees. Also offsetting the decrease was a $578 million increase in the income tax benefit. For more information on the U.K. PPI costs, see Note 12 – Commitments and Contingencies to the Consolidated Financial Statements.
The income tax benefit was $2.6 billion in 2014 compared to a benefit of $2.0 billion in 2013 with the increase driven by the increase in the pretax loss in All Other and the resolution of several tax examinations, partially offset by a decrease in benefits from non-U.S. restructurings.
Equity Investment Activity
The following tables present the components of equity investments in All Other at December 31, 2014 and 2013, and also a reconciliation to the total consolidated equity investment income for 2014 and 2013.


Equity Investments


December 31
(Dollars in millions)
2014
 
2013
Global Principal Investments
$
913

 
$
1,604

Strategic and other investments
3,973

 
4,033

Total equity investments included in All Other
$
4,886

 
$
5,637

 
Equity investments included in All Other decreased $751 million to $4.9 billion during 2014, with the decrease primarily due to sales resulting from the continued wind down of the GPI portfolio. GPI had unfunded equity commitments of $31 million and $127 million at December 31, 2014 and 2013.


Equity Investment Income


(Dollars in millions)
2014
 
2013
Global Principal Investments
$
(46
)
 
$
379

Strategic and other investments
775

 
2,358

Total equity investment income included in All Other
729

 
2,737

Total equity investment income included in the business segments
401

 
164

Total consolidated equity investment income
$
1,130

 
$
2,901

Equity investment income decreased $1.8 billion primarily due to a $753 million gain related to the sale of our remaining investment in China Construction Bank Corporation (CCB) in 2013, lower gains on sales of portions of an equity investment compared to 2013, and lower GPI results. These declines were partially offset by a gain in 2014 related to the IPO of an equity investment.


Bank of America 2014     29


Off-Balance Sheet Arrangements and Contractual Obligations
We have contractual obligations to make future payments on debt and lease agreements. Additionally, in the normal course of business, we enter into contractual arrangements whereby we commit to future purchases of products or services from unaffiliated parties. Purchase obligations are defined as obligations that are legally binding agreements whereby we agree to purchase products or services with a specific minimum quantity at a fixed, minimum or variable price over a specified period of time. Included in purchase obligations are vendor contracts, the most significant of which include communication services, processing services and software contracts. Other long-term liabilities include our contractual funding obligations related to the Qualified Pension Plans, Non-U.S. Pension Plans, Nonqualified and Other Pension Plans, and Postretirement Health and Life Plans (collectively, the Plans). Obligations to the Plans are based on the current and projected obligations of the Plans, performance of the Plans’ assets and any participant contributions, if applicable.
 
During 2014 and 2013, we contributed $234 million and $290 million to the Plans, and we expect to make $244 million of contributions during 2015. The Plans are more fully discussed in Note 17 – Employee Benefit Plans to the Consolidated Financial Statements.
Debt, lease, equity and other obligations are more fully discussed in Note 11 – Long-term Debt and Note 12 – Commitments and Contingencies to the Consolidated Financial Statements.
We enter into commitments to extend credit such as loan commitments, standby letters of credit (SBLCs) and commercial letters of credit to meet the financing needs of our customers. For a summary of the total unfunded, or off-balance sheet, credit extension commitment amounts by expiration date, see Credit Extension Commitments in Note 12 – Commitments and Contingencies to the Consolidated Financial Statements.
Table 11 includes certain contractual obligations at December 31, 2014.


Table 11
Contractual Obligations


December 31, 2014
(Dollars in millions)
Due in One
Year or Less
 
Due After
One Year Through
Three Years
 
Due After
Three Years Through
Five Years
 
Due After
Five Years
 
Total
Long-term debt
$
30,724

 
$
80,753

 
$
49,136

 
$
82,526

 
$
243,139

Operating lease obligations
2,553

 
4,157

 
2,725

 
4,971

 
14,406

Purchase obligations
2,077

 
2,864

 
361

 
242

 
5,544

Time deposits
75,604

 
5,865

 
1,640

 
1,734

 
84,843

Other long-term liabilities
1,470

 
928

 
698

 
1,136

 
4,232

Estimated interest expense on long-term debt and time deposits (1)
5,036

 
10,511

 
7,665

 
12,323

 
35,535

Total contractual obligations
$
117,464

 
$
105,078

 
$
62,225

 
$
102,932

 
$
387,699

(1) 
Represents forecasted net interest expense on long-term debt and time deposits. Forecasts are based on the contractual maturity dates of each liability, and are net of derivative hedges, where applicable.
Representations and Warranties
We securitize first-lien residential mortgage loans generally in the form of RMBS guaranteed by the government-sponsored enterprises (GSEs) or by the Government National Mortgage Association (GNMA) in the case of Federal Housing Administration (FHA)-insured, U.S. Department of Veterans Affairs (VA)-guaranteed and Rural Housing Service-guaranteed mortgage loans, and sell pools of first-lien residential mortgage loans in the form of whole loans. In addition, in prior years, legacy companies and certain subsidiaries sold pools of first-lien residential mortgage loans and home equity loans as private-label securitizations (in certain of these securitizations, monoline insurers or other financial guarantee providers insured all or some of the securities) or in the form of whole loans. In connection with these transactions, we or certain of our subsidiaries or legacy companies make or have made various representations and warranties. Breaches of these representations and warranties have resulted in and may continue to result in the requirement to repurchase mortgage loans or to otherwise make whole or provide other remedies to the GSEs, U.S. Department of Housing and Urban Development (HUD) with respect to FHA-insured loans, VA, whole-loan investors, securitization trusts, monoline insurers or other financial guarantors (collectively, repurchases). In all such cases, subsequent to repurchasing the loan, we would be exposed to any credit loss on the repurchased mortgage loans, after
 
accounting for any mortgage insurance (MI) or mortgage guarantee payments that we may receive.
We have vigorously contested any request for repurchase when we conclude that a valid basis for repurchase does not exist and will continue to do so in the future. However, in an effort to resolve these legacy mortgage-related issues, we have reached settlements, certain of which have been for significant amounts, in lieu of a loan-by-loan review process, including with the GSEs, four monoline insurers and Bank of New York Mellon (BNY Mellon), as trustee. The settlement with BNY Mellon (BNY Mellon Settlement) remains subject to final court approval and certain other conditions. It is not currently possible to predict the ultimate outcome or timing of the court approval process, which includes appeals and could take a substantial period of time. If final court approval is not obtained, or if we and Countrywide Financial Corporation (Countrywide) withdraw from the BNY Mellon Settlement in accordance with its terms, our future representations and warranties losses could be substantially different from existing accruals and the estimated range of possible loss over existing accruals.
For more information on accounting for representations and warranties, repurchase claims and exposures, including a summary of the larger bulk settlements, see Note 7 – Representations and Warranties Obligations and Corporate Guarantees and Note 12 – Commitments and Contingencies to the


30     Bank of America 2014


Consolidated Financial Statements and Item 1A. Risk Factors of the Corporation's 2014 Annual Report on Form 10-K.
Unresolved Repurchase Claims
Unresolved representations and warranties repurchase claims represent the notional amount of repurchase claims made by counterparties, typically the outstanding principal balance or the unpaid principal balance at the time of default. In the case of first-lien mortgages, the claim amount is often significantly greater than the expected loss amount due to the benefit of collateral and, in some cases, MI or mortgage guarantee payments. Claims received from a counterparty remain outstanding until the underlying loan is repurchased, the claim is rescinded by the counterparty or the representations and warranties claims with respect to the applicable trust are settled, and fully and finally released. When a claim is denied and the Corporation does not receive a response from the counterparty, the claim remains in the unresolved repurchase claims balance until resolution.
At December 31, 2014, we had $22.8 billion of unresolved repurchase claims, net of duplicate claims, compared to $18.7 billion at December 31, 2013. These repurchase claims relate primarily to private-label securitizations and include claims in the amount of $4.7 billion, net of duplicate claims, where we believe the statute of limitations has expired under current law. For additional information, see Note 7 – Representations and Warranties Obligations and Corporate Guarantees to the Consolidated Financial Statements.
The continued increase in the notional amount of unresolved repurchase claims during 2014 is primarily due to: (1) continued submission of claims by private-label securitization trustees, (2) the level of detail, support and analysis accompanying such claims, which impact overall claim quality and, therefore, claims resolution, (3) the lack of an established process to resolve disputes related to these claims, (4) the submission of claims where we believe the statute of limitations has expired under current law and (5) the submission of duplicate claims, often in multiple submissions, on the same loan. For example, claims submitted without individual file reviews generally lack the level of detail and analysis of individual loans found in other claims that is necessary to support a claim. Absent any settlements, the Corporation expects unresolved repurchase claims related to private-label securitizations to increase as such claims continue to be submitted and there is not an established process for the ultimate resolution of such claims on which there is a disagreement.
In addition to unresolved repurchase claims, we have received notifications pertaining to loans for which we have not received a repurchase request from sponsors of third-party securitizations with whom we engaged in whole-loan transactions and that we may owe indemnity obligations. These notifications totaled $2.0 billion and $737 million at December 31, 2014 and 2013.
We also from time to time receive correspondence purporting to raise representations and warranties breach issues from entities that do not have contractual standing or ability to bring such claims. We believe such communications to be procedurally and/or substantively invalid, and generally do not respond to such correspondence.
The presence of repurchase claims on a given trust, receipt of notices of indemnification obligations and other communication, as discussed above, are all factors that inform our estimated liability for obligations under representations and warranties and the corresponding estimated range of possible loss.
 
Representations and Warranties Liability
The liability for representations and warranties and corporate guarantees is included in accrued expenses and other liabilities on the Consolidated Balance Sheet and the related provision is included in mortgage banking income in the Consolidated Statement of Income. For more information on the representations and warranties liability and the corresponding estimated range of possible loss, see Off-Balance Sheet Arrangements and Contractual Obligations – Estimated Range of Possible Loss on page 33.
At December 31, 2014 and 2013, the liability for representations and warranties was $12.1 billion and $13.3 billion. For 2014, the representations and warranties provision was $683 million compared to $840 million for 2013.
Our estimated liability at December 31, 2014 for obligations under representations and warranties is necessarily dependent on, and limited by a number of factors including for private-label securitizations the implied repurchase experience based on the BNY Mellon Settlement, as well as certain other assumptions and judgmental factors. Accordingly, future provisions associated with obligations under representations and warranties may be materially impacted if actual experiences are different from historical experience or our understandings, interpretations or assumptions. Although we have not recorded any representations and warranties liability for certain potential private-label securitization and whole-loan exposures where we have had little to no claim activity, or where the applicable statute of limitations has expired under current law, these exposures are included in the estimated range of possible loss.
Experience with Government-sponsored Enterprises
As a result of various settlements with the GSEs, we have resolved substantially all outstanding and potential representations and warranties repurchase claims on whole loans sold by legacy Bank of America and Countrywide to Fannie Mae (FNMA) and Freddie Mac (FHLMC) through June 30, 2012 and December 31, 2009, respectively. For additional information, see Note 7 – Representations and Warranties Obligations and Corporate Guarantees to the Consolidated Financial Statements.
Experience with Investors Other than Government-sponsored Enterprises
In prior years, legacy companies and certain subsidiaries sold pools of first-lien residential mortgage loans and home equity loans as private-label securitizations or in the form of whole loans to investors other than GSEs (although the GSEs are investors in certain private-label securitizations). Such loans originated from 2004 through 2008 had an original principal balance of $970 billion, including $786 billion sold to private-label and whole-loan investors without monoline insurance and $185 billion with monoline insurance. Of the $970 billion, $574 billion in principal has been paid, $201 billion in principal has defaulted, $44 billion in principal was severely delinquent, and $151 billion in principal was current or less than 180 days past due at December 31, 2014 as summarized in Table 12. Of the original principal balance of $716 billion for Countrywide, $409 billion is included in the BNY Mellon Settlement and, of this amount, $109 billion was defaulted or severely delinquent at December 31, 2014.


Bank of America 2014     31


Table 12
Overview of Non-Agency Securitization and Whole-loan Balances from 2004 to 2008


Principal Balance
 
 Defaulted or Severely Delinquent
(Dollars in billions)

By Entity
Original
Principal
Balance
 
Outstanding
Principal Balance December 31, 2014
 
Outstanding
Principal Balance
180 Days or More
Past Due
 
Defaulted
Principal
Balance
 
Defaulted or Severely Delinquent
 
Borrower Made
Less than 13 Payments
 
Borrower
Made
13 to 24
Payments
 
Borrower
Made
25 to 36
Payments
 
Borrower
Made
More than 36
Payments
Bank of America
$
100

 
$
15

 
$
3

 
$
7

 
$
10

 
$
1

 
$
2

 
$
2

 
$
5

Countrywide
716

 
153

 
35

 
150

 
185

 
24

 
44

 
44

 
73

Merrill Lynch
72

 
13

 
3

 
18

 
21

 
3

 
4

 
3

 
11

First Franklin
82

 
14

 
3

 
26

 
29

 
5

 
6

 
5

 
13

Total (1, 2)
$
970

 
$
195

 
$
44

 
$
201

 
$
245

 
$
33

 
$
56

 
$
54

 
$
102

By Product


Prime
$
302

 
$
55

 
$
7

 
$
27

 
$
34

 
$
2

 
$
6

 
$
7

 
$
19

Alt-A
173

 
44

 
10

 
40

 
50

 
7

 
12

 
11

 
20

Pay option
150

 
32

 
10

 
44

 
54

 
5

 
13

 
15

 
21

Subprime
251

 
50

 
15

 
70

 
85

 
17

 
20

 
16

 
32

Home equity
88

 
9


18

 
18

 
2

 
5

 
4

 
7

Other
6

 
5

 
2

 
2

 
4


1

 
3

Total
$
970

 
$
195

 
$
44

 
$
201

 
$
245

 
$
33

 
$
56

 
$
54

 
$
102

(1) 
Excludes transactions sponsored by Bank of America and Merrill Lynch where no representations or warranties were made.
(2) 
Includes exposures on third-party sponsored transactions related to legacy entity originations.
As it relates to private-label securitizations, we believe a contractual liability to repurchase mortgage loans generally arises if there is a breach of representations and warranties that materially and adversely affects the interest of the investor or all the investors in a securitization trust or of the monoline insurer or other financial guarantor (as applicable). We believe many of the loan defaults observed in these securitizations and whole-loan transactions were driven by external factors like the substantial depreciation in home prices experienced after the economic downturn, persistently high unemployment and other negative economic trends, diminishing the likelihood that any loan defect, to the extent any exists, was the cause of a loan’s default.
Experience with Private-label Securitization and Whole Loan Investors
Legacy entities, and to a lesser extent Bank of America, sold loans to investors via private-label securitizations or as whole loans. The majority of the loans sold were included in private-label securitizations, including third-party sponsored transactions. We provided representations and warranties to the whole-loan investors and these investors may retain those rights even when the whole loans were aggregated with other collateral into private-label securitizations sponsored by the whole-loan investors. Loans originated between 2004 and 2008 and sold without monoline insurance had an original total principal balance of $786 billion included in Table 12. Of the $786 billion, $469 billion have been paid in full and $193 billion were defaulted or severely delinquent at December 31, 2014. At least 25 payments have been made on approximately 64 percent of the defaulted and severely delinquent loans.
 
We have received approximately $33 billion of representations and warranties repurchase claims related to these vintages, including $24 billion from private-label securitization trustees and a financial guarantee provider, $8 billion from whole-loan investors and $815 million from one private-label securitization counterparty. Continued high levels of new private-label claims are primarily related to repurchase requests received from trustees for private-label securitization transactions not included in the BNY Mellon Settlement. We have resolved $9 billion of these claims with losses of $2 billion. The majority of these resolved claims were from third-party whole-loan investors. Approximately $4 billion of these claims were resolved through repurchase or indemnification, $5 billion were rescinded by the investor and $336 million were resolved through settlements. As of December 31, 2014, 15 percent of the whole-loan claims for loans originated between 2004 and 2008 that we initially denied have subsequently been resolved through repurchase or make-whole payments and 45 percent have been resolved through rescission of the claim by the counterparty or repayment in full by the borrower. At December 31, 2014, for loans originated between 2004 and 2008, the notional amount of unresolved repurchase claims submitted by private-label securitization trustees, whole-loan investors, including third-party securitization sponsors and others was $24 billion, including $3 billion of duplicate claims primarily submitted without a loan file review. We have performed an initial review with respect to substantially all of these claims and although we do not believe a valid basis for repurchase has been established by the claimant, we consider claims activity in the computation of our liability for representations and warranties. Until we receive a repurchase claim, we generally do not review loan files related to private-label securitizations and believe we are not required by the governing documents to do so.


32     Bank of America 2014


Experience with Monoline Insurers
During 2014, we had limited loan-level representations and warranties repurchase claims experience with the monoline insurers due to settlements and ongoing litigation with a single monoline insurer. For more information related to the monolines, see Note 7 – Representations and Warranties Obligations and Corporate Guarantees and Note 12 – Commitments and Contingencies to the Consolidated Financial Statements.
Estimated Range of Possible Loss
We currently estimate that the range of possible loss for representations and warranties exposures could be up to $4 billion over existing accruals at December 31, 2014. The estimated range of possible loss reflects principally non-GSE exposures. It represents a reasonably possible loss, but does not represent a probable loss, and is based on currently available information, significant judgment and a number of assumptions that are subject to change.
For more information on the methodology used to estimate the representations and warranties liability, the corresponding estimated range of possible loss and the types of losses not considered in such estimates, see Item 1A. Risk Factors of the Corporation's 2014 Annual Report on Form 10-K and Note 7 – Representations and Warranties Obligations and Corporate Guarantees to the Consolidated Financial Statements and, for more information related to the sensitivity of the assumptions used to estimate our liability for obligations under representations and warranties, see Complex Accounting Estimates – Representations and Warranties Liability on page 93.
Department of Justice Settlement
On August 20, 2014, we reached a comprehensive settlement with the DoJ and certain federal and state agencies (DoJ Settlement). The DoJ Settlement included releases for securitization, origination, sale and other specified conduct relating to RMBS and collateralized debt obligations (CDOs), and an origination release on specified populations of residential mortgage loans sold to GSEs and private-label RMBS trusts. The DoJ Settlement resolved certain actual and potential civil claims by the DoJ, the Securities and Exchange Commission and State Attorneys General from six states, the FHA and GNMA, as well as all pending RMBS claims against Bank of America entities brought by the FDIC. For FHA-insured loans originated on or after May 1, 2009, we also received a release of origination liability for loans only if an insurance claim had been submitted to the FHA prior to January 1, 2014. If a claim had not been submitted by that date, we did not receive a release and we may be exposed to losses on such loans. For more information on FHA-insured loans originated on or before April 30, 2009, see Off-Balance Sheet Arrangements and Contractual Obligations – National Mortgage Settlement on page 34.
As part of the DoJ Settlement, we paid civil monetary penalties and compensatory remediation payments totaling $9.65 billion in 2014 and agreed to provide $7.0 billion worth of creditable consumer relief activities primarily in the form of mortgage modifications, including first-lien principal forgiveness and forbearance modifications and second- and junior-lien extinguishments, low- to moderate-income mortgage originations, and community reinvestment and neighborhood stabilization efforts, with initiatives focused on communities experiencing, or
 
at risk of, blight. In addition, we recorded $400 million of provision for credit losses for additional costs associated with the consumer relief portion of the settlement. Also, we will support the expansion of available affordable rental housing. We have committed to complete delivery of the consumer relief by no later than August 31, 2018. The consumer relief requirements are subject to oversight by an independent monitor.
Servicing, Foreclosure and Other Mortgage Matters
We service a large portion of the loans we or our subsidiaries have securitized and also service loans on behalf of third-party securitization vehicles and other investors. Our servicing obligations are set forth in servicing agreements with the applicable counterparty. These obligations may include, but are not limited to, loan repurchase requirements in certain circumstances, indemnifications, payment of fees, advances for foreclosure costs that are not reimbursable, or responsibility for losses in excess of partial guarantees for VA loans.
Servicing agreements with the GSEs generally provide the GSEs with broader rights relative to the servicer than are found in servicing agreements with private investors. For example, the GSEs claim that they have the contractual right to demand indemnification or loan repurchase for certain servicing breaches. In addition, the GSEs’ first-lien mortgage seller/servicer guides provide timelines to resolve delinquent loans through workout efforts or liquidation, if necessary, and purport to require the imposition of compensatory fees if those deadlines are not satisfied except for reasons beyond the control of the servicer. In addition, many non-agency RMBS and whole-loan servicing agreements state that the servicer may be liable for failure to perform its servicing obligations in keeping with industry standards or for acts or omissions that involve willful malfeasance, bad faith or gross negligence in the performance of, or reckless disregard of, the servicer’s duties.
It is not possible to reasonably estimate our liability with respect to certain potential servicing-related claims. While we have recorded certain accruals for servicing-related claims, the amount of potential liability in excess of existing accruals could be material to the Corporation’s results of operations or cash flows for any particular reporting period.
2013 IFR Acceleration Agreement
On January 7, 2013, we and other mortgage servicing institutions entered into an agreement in principle with the Office of the Comptroller of the Currency (OCC) and the Federal Reserve to cease the Independent Foreclosure Review (IFR) that had commenced pursuant to consent orders entered into by Bank of America with the Federal Reserve (2011 FRB Consent Order) and the 2011 OCC Consent Order entered into between BANA and the OCC and replaced it with an accelerated remediation process (2013 IFR Acceleration Agreement). The 2013 IFR Acceleration Agreement requires us to provide $1.8 billion of borrower assistance in the form of loan modifications and other foreclosure prevention actions, and in addition, we made a cash payment of $1.1 billion into a qualified settlement fund in 2013. The borrower assistance program is not expected to result in any incremental credit provision, as we believe that the existing allowance for credit losses is adequate to absorb any costs that have not already been recorded as charge-offs.


Bank of America 2014     33


National Mortgage Settlement
In March 2012, we entered into settlement agreements (collectively, the National Mortgage Settlement) with the U.S. Department of Justice, 49 State Attorneys General and certain federal agencies. The National Mortgage Settlement provided for the establishment of certain uniform servicing standards, upfront cash payments of approximately $1.9 billion to the state and federal governments and for borrower restitution, an upfront cash payment of $500 million to settle certain claims related to FHA-insured loans, approximately $7.6 billion worth of borrower assistance in the form of credits earned for, among other things, principal reduction, and approximately $1.0 billion of credits earned for interest rate reduction modifications. The resulting interest rate reductions, which were not accounted for as troubled debt restructurings, resulted in an estimated decrease in fair value of the modified loans of approximately $740 million and a reduction in annual interest income of approximately $120 million.
The parties to the National Mortgage Settlement agreed to release us from further liability for certain alleged residential mortgage origination, servicing and foreclosure deficiencies. For FHA-guaranteed loans originated on or before April 30, 2009, we also received (1) a release of origination liability for loans where an insurance claim had been submitted to the FHA prior to January 1, 2012 and (2) a release of multiple damages and penalties, but not administrative indemnification claims for single damages, for loans where no insurance claim had been submitted by January 1, 2012.
The independent monitor appointed as a result of the National Mortgage Settlement to review and certify compliance with its provisions has confirmed that we have substantially fulfilled all commitments for borrower assistance, including principal reductions, and interest rate reductions.
Mortgage Electronic Registration Systems, Inc.
We are subject to certain legal and contractual requirements for how we hold, transfer, use or enforce promissory notes, security instruments and other documents for residential mortgage loans that we service. In recent years, challenges have been raised to whether we have adhered to these requirements, and whether, as a result in some instances, the loans can be enforced as local law otherwise would permit. Additionally, we currently use the MERS system for approximately half of the residential mortgage loans that remain in our servicing portfolio, but individuals and certain local governments have contended that the use of MERS is improper or otherwise adversely affects the security interest. If documentation requirements were not met, or if the use of MERS or the MERS system is found not valid or effective, we could be obligated to, or choose to, take remedial actions and may be subject to additional costs or losses.
Impact of Foreclosure Delays
Foreclosure delays that impact our default-related servicing costs, which include mortgage-related assessments, waivers and similar costs, peaked in mid-2013 and have declined throughout 2014 as delinquencies declined. However, unexpected foreclosure delays could impact the rate of decline. In 2014, we recorded $14 million of mortgage-related assessments, waivers and similar costs related to foreclosure delays compared to $514 million in 2013.
 
Other Mortgage-related Matters
We continue to be subject to additional borrower and non-borrower litigation and governmental and regulatory scrutiny related to our past and current origination, servicing, transfer of servicing and servicing rights, and foreclosure activities, including those claims not covered by the National Mortgage Settlement or the DoJ Settlement. This scrutiny may extend beyond our pending foreclosure matters to issues arising out of alleged irregularities with respect to previously completed foreclosure activities. The ongoing environment of additional regulation, increased regulatory compliance obligations, and enhanced regulatory enforcement, combined with ongoing uncertainty related to the continuing evolution of the regulatory environment, has resulted in operational and compliance costs and may limit our ability to continue providing certain products and services. For more information on management’s estimate of the aggregate range of possible loss and on regulatory investigations, see Note 12 – Commitments and Contingencies to the Consolidated Financial Statements.
Mortgage-related Settlements – Servicing Matters
In connection with the BNY Mellon Settlement, BANA has agreed to implement certain servicing changes related to loss mitigation activities. BANA also agreed to transfer the servicing rights related to certain high-risk loans to qualified subservicers on a schedule that began with the signing of the BNY Mellon Settlement. This servicing transfer protocol has reduced the servicing fees payable to BANA. Upon final court approval of the BNY Mellon Settlement, failure to meet the established benchmarking standards for loans not in subservicing arrangements can trigger payment of agreed-upon fees. Additionally, we and Countrywide have agreed to work to resolve with the Trustee certain mortgage documentation issues related to the enforceability of mortgages in foreclosure and to reimburse the related Covered Trust for any loss if BANA is unable to foreclose on the mortgage and the Covered Trust is not made whole by a title policy because of these issues. These agreements will terminate if final court approval of the BNY Mellon Settlement is not obtained, although we could still have exposure under the pooling and servicing agreements related to the mortgages in the Covered Trusts for these issues.
BANA has agreed to implement uniform servicing standards established under the National Mortgage Settlement. These standards are intended to strengthen procedural safeguards and documentation requirements associated with foreclosure, bankruptcy and loss mitigation activities, as well as addressing the imposition of fees and the integrity of documentation, with a goal of ensuring greater transparency for borrowers. These uniform servicing standards also obligate us to implement compliance processes reasonably designed to provide assurance of the achievement of these objectives. Compliance with the uniform servicing standards is subject to ongoing review by the independent monitor. Implementation of these uniform servicing standards has contributed to elevated costs associated with the servicing process, but is not expected to result in material delays or dislocation in the performance of our mortgage servicing obligations, including the completion of foreclosures.


34     Bank of America 2014


Managing Risk
Overview
Risk is inherent in all our business activities. Sound risk management enables us to serve our customers and deliver for our shareholders. If not managed well, risks can result in financial loss, regulatory sanctions and penalties, and damage to our reputation, each of which may adversely impact our ability to execute our business strategies. The seven types of risk faced by Bank of America are strategic, credit, market, liquidity, compliance, operational and reputational risks.
Strategic risk is the risk resulting from incorrect assumptions about external or internal factors, inappropriate business plans, ineffective business strategy execution, or failure to respond in a timely manner to changes in the regulatory, macroeconomic or competitive environments. Credit risk is the risk of loss arising from the inability or failure of a borrower or counterparty to meet its obligations. Market risk is the risk that changes in market conditions may adversely impact the value of assets or liabilities, or otherwise negatively impact earnings. Liquidity risk is the potential inability to meet contractual or contingent financial obligations, either on- or off-balance sheet, as they come due. Compliance risk is the risk of legal or regulatory sanctions or penalties arising from the failure of the Corporation to comply with requirements of applicable laws, rules and regulations. Operational risk is the risk of loss resulting from inadequate or failed internal processes, people and systems, or from external events. Reputational risk is the potential that negative perceptions of the Corporation’s conduct or business practices may adversely impact its profitability or operations through an inability to establish new or maintain existing customer/client relationships. Reputational risk is evaluated along with all of the risk categories and throughout the risk management process and, as such, is not discussed separately herein. The following sections, Strategic Risk Management on page 38, Capital Management on page 39 Liquidity Risk on page 45, Credit Risk Management on page 50, Market Risk Management on page 79, Compliance Risk Management on page 88 and Operational Risk Management on page 89, address in more detail the specific procedures, measures and analyses of the major categories of risk. This discussion of managing risk focuses on the Risk Framework that, as part of its annual review process, was approved by the Corporation’s Board of Directors (the Board) and its Enterprise Risk Committee (ERC) in January 2015. The key enhancements from the 2014 Risk Framework include further increasing the focus on our strong risk culture and ensuring consistency with recent regulatory guidance. It continues to recognize the same seven key risk types as discussed above, and the five components of our risk management approach as outlined below.
A strong risk culture is fundamental to our core values and operating principles. It requires us to focus on risk in all activities and encourages the necessary mindset and behavior to enable effective risk management, and promotes sound risk taking within our risk appetite. Sustaining a strong risk culture throughout the organization is critical to the success of the Corporation and is a clear expectation of our executive management team and the Board.
Our Risk Framework is the foundation for comprehensive management of the risks facing the Corporation. It outlines clear responsibilities and accountabilities for managing risk. The Risk Framework sets forth roles and responsibilities for the
 
management of risk by front line units (FLUs), independent risk management, control functions and Corporate Audit, each of which is described below in Managing Risk – Risk Management Governance, and provides a blueprint for how the Board, through delegation of authority to committees and executive officers, establishes risk appetite and associated limits for our activities. It describes the five components of our risk management approach (risk culture, risk appetite, risk management processes, risk data aggregation and reporting, and risk governance) and the seven key types of risk we face.
Executive management assesses, with Board oversight, the risk-adjusted returns of each business. Management reviews and approves strategic and financial operating plans, and recommends a financial plan annually to the Board for approval. Our strategic plan takes into consideration return objectives and financial resources, which must align with risk capacity and risk appetite. Management sets financial objectives for each business by allocating capital and setting a target for return on capital for each business. Capital allocations and operating limits are regularly evaluated as part of our overall governance processes as the businesses and the economic environment in which we operate continue to evolve. For more information regarding capital allocations, see Business Segment Operations on page 14.
Our Risk Appetite Statement is intended to ensure that the Corporation maintains an acceptable risk profile by providing a common framework and a comparable set of measures for senior management and the Board to clearly indicate the level of risk the Corporation is willing to accept. The Risk Appetite Statement includes both quantitative limits and qualitative components. Risk appetite is set at least annually in conjunction with the strategic, capital and financial operating plans to align risk appetite with the Corporation’s strategy and financial resources. Line of business strategies and risk appetite are also aligned. As part of its annual review, the Board approved the Risk Appetite Statement in January 2015.
Our overall capacity to take risk is limited; therefore, we prioritize the risks we take in order to maintain a strong and flexible financial position so we can withstand challenging economic times and take advantage of organic growth opportunities. Therefore, we set objectives and targets for capital and liquidity that are intended to permit the Corporation to continue to operate in a safe and sound manner at all times, including during periods of stress.
Each of our lines of business operates within their credit, market and operational risk appetite limits. These limits are based on analyses of risk and reward within each line of business. Executive management is responsible for tracking and reporting performance measurements as well as any exceptions to guidelines or limits. The Board, and its committees when appropriate, oversees financial performance, execution of the strategic and financial operating plans, adherence to risk appetite limits and the adequacy of internal controls.
Risk Management Governance
The Risk Framework includes delegations of authority whereby the Board and its committees may delegate authority to management-level committees or executive officers. Such delegations may authorize certain decision-making and approval functions, which may be evidenced in, for example, committee charters, job descriptions, meeting minutes and resolutions.


Bank of America 2014     35


The chart below illustrates the inter-relationship among the Board, Board committees and management committees that have the majority of risk oversight responsibilities for the Corporation. This chart reflects the revised Risk Framework approved by the Board in January 2015.
(1) This presentation does not include committees for other legal entities.
(2) Reports to the CEO and CFO with oversight by the Audit Committee.
Board of Directors and Board Committees
The Board, which consists of a substantial majority of independent directors, authorizes management to maintain an effective Risk Framework, and oversees compliance with safe and sound banking practices. In addition, the Board or its committees conduct appropriate inquiries of, and receive reports from management on risk-related matters to determine whether there are scope or resource limitations that impede the ability of independent risk management and/or Corporate Audit to execute its responsibilities. The following Board committees have the principal responsibility for enterprise-wide oversight of our risk management activities. These committees and other Board committees, as applicable, regularly report to the Board on risk-related matters. Through these activities, the Board and applicable committees are provided with thorough information on the Corporation’s risk profile, and challenge executive management to appropriately address key risks facing the Corporation. Other Board committees as described below provide additional oversight of specific risks.
Each of the committees shown on the above chart regularly reports to the Board on risk related matters within the committee’s responsibilities, which is intended to collectively provide the Board with integrated, thorough insight about our management of enterprise-wide risks.
Enterprise Risk Committee
The Enterprise Risk Committee (ERC) has primary responsibility for oversight of the Corporation’s Risk Framework and material risks facing the Corporation. It approves the Risk Framework and the Risk Appetite Statement and further recommends these documents to the Board for approval. The ERC oversees senior management’s responsibilities for the identification, measure-ment, monitoring and control of all key risks facing the Corporation. The ERC may consult with other Board committees on risk-related matters.
 
Audit Committee
The Audit Committee oversees the qualifications, performance and independence of the Independent Registered Public Accounting Firm, the performance of the Corporation’s corporate audit function, the integrity of the Corporation’s consolidated financial statements, compliance by the Corporation with legal and regulatory requirements, and makes inquiries of management or the Corporate General Auditor (CGA) to determine whether there are scope or resource limitations that impede the ability of Corporate Audit to execute its responsibilities. The Audit Committee is also responsible for overseeing compliance risk pursuant to the New York Stock Exchange listing standards.
Credit Committee
The Credit Committee provides additional oversight of senior management’s responsibilities for the identification and management of corporation-wide credit exposures. Our Credit Committee oversees, among other things, the identification and management of our credit exposures on an enterprise-wide basis, our responses to trends affecting those exposures, the adequacy of the allowance for credit losses and our credit-related policies.
Other Board Committees
Our Corporate Governance Committee oversees our Board’s governance processes, identifies and reviews the qualifications of potential Board members, recommends nominees for election to our Board and recommends committee appointments for Board approval.
Our Compensation and Benefits Committee oversees establishing, maintaining and administering our compensation programs and employee benefit plans, including approving and recommending our Chief Executive Officer’s (CEO) compensation to our Board for further approval by all independent directors, and reviewing and approving all of our executive officers’ compensation.


36     Bank of America 2014


Management Committees
Management committees may receive their authority from the Board, a Board committee, another management committee or from one or more executive officers. The primary management-level risk committee for the Corporation is the Management Risk Committee (MRC). Subject to Board oversight, the MRC is responsible for management oversight of all key risks facing the Corporation. The MRC provides management oversight of the Corporation’s credit portfolio, compliance and operational risk programs, balance sheet and capital management, funding activities and other liquidity activities, stress testing, trading activities, recovery and resolution planning, model risk, subsidiary governance and activities between banks and their nonbank affiliates pursuant to Federal Reserve rules and regulations. The MRC is responsible for holistic risk management, including an integrated evaluation of risk, earnings, capital and liquidity, and it reports on these matters to the Board or Board committees.
Lines of Defense
In addition to the role of Executive Officers in managing risk, we have clear ownership and accountability across the three lines of defense: FLUs, independent risk management and Corporate Audit. The Corporation also has control functions outside of FLUs and independent risk management (e.g., Legal and Global Human Resources). The three lines of defense are integrated into our management-level governance structure. Each of these is described in more detail below.
Executive Officers
Executive officers lead various functions representing the functional roles. Authority for functional roles may be delegated to executive officers from the Board, Board committees or management-level committees. Executive officers, in turn, may further delegate responsibilities, as appropriate, to management-level committees, management routines or individuals. Executive officers review the Corporation’s activities for consistency with our Risk Framework, Risk Appetite Statement, and applicable strategic, capital and financial operating plans, as well as applicable policies, standards, procedures and processes. Executive officers and other employees make decisions individually on a day-to-day basis, consistent with the authority they have been delegated. Executive officers and other employees may also serve on committees and participate in committee decisions.
Front Line Units
FLUs include the lines of business and two organizational units, the Global Technology and Operations Group and Strategic Initiatives. FLUs are held accountable by the CEO and the Board for appropriately assessing and effectively managing all of the risks associated with their activities.
Two organizational units that include FLU and control function activities, but are not part of independent risk management are the Chief Financial Officer (CFO) Group and Global Marketing and Corporate Affairs (GM&CA).
Independent Risk Management
Independent risk management (IRM) is part of our control functions and includes Global Risk Management and Global Compliance. We have other control functions that are not part of IRM (other control functions may also provide oversight to FLU activities), including Legal, Global Human Resources and certain activities
 
within the CFO Group, and GM&CA. IRM, led by the CRO, is responsible for independently assessing and overseeing risks within FLUs and other control functions. IRM establishes written enterprise policies and procedures that include concentration risk limits where appropriate. Such policies and procedures outline how aggregate risks are identified, measured, monitored and controlled.
The CRO has the authority and independence to develop and implement a meaningful risk management framework. The CRO has unrestricted access to the Board and reports directly to both the ERC and to the CEO. Global Risk Management is organized into enterprise risk teams and FLU risk teams that work collaboratively in executing their respective duties.
Within IRM, Global Compliance independently assesses compliance risk, and evaluates adherence to applicable laws, rules and regulations, including identifying compliance issues and risks, performing monitoring and testing, and reporting on the state of compliance activities across the Corporation. Additionally, Global Compliance works with FLUs and control functions so that day-to-day activities operate in a compliant manner.
Corporate Audit
Corporate Audit and the CGA maintain their independence from the FLUs, IRM and other control functions by reporting directly to the Audit Committee. The CGA administratively reports to the CEO. Corporate Audit provides independent assessment and validation through testing of key processes and controls across the Corporation. Corporate Audit includes Credit Review which periodically tests and examines credit portfolios and processes.
Risk Management Processes
The Corporation’s Risk Framework requires that strong risk management practices are integrated in key strategic, capital and financial planning processes and day-to-day business processes across the Corporation, with a goal of ensuring risks are appropriately considered, evaluated and responded to in a timely manner.
We employ a risk management process, referred to as IMMC: Identify, Measure, Monitor and Control, as part of our daily activities.
Identify – To be effectively managed, risks must be clearly defined and proactively identified. Proper risk identification focuses on recognizing and understanding all key risks inherent in our business activities and risks that may arise from business initiatives or external factors. Risk identification is an ongoing process occurring at both the individual transaction and portfolio level. Each employee is expected to identify and escalate risks promptly.
Measure – Once a risk is identified, it must be measured. Risk is measured at various levels including, but not limited to, risk type, FLU, legal entity and on an aggregate basis. These metrics help us assess our risk profile and adherence to our risk appetite.
Monitor – We monitor risk levels regularly to track adherence to risk appetites, policies, standards, procedures and processes. Through our monitoring, we can determine our level of risk relative to limits and can take action in a timely manner. We also can determine when risk limits are breached and have processes to appropriately report and escalate exceptions. This includes immediate requests for approval to managers


Bank of America 2014     37


and alerts to executive management, management-level committees or the Board (directly or through an appropriate committee).
Control – We establish and communicate risk limits and controls through policies, standards, procedures and processes that define the responsibilities and authority for risk taking. The limits and controls can be adjusted by the Board or management when conditions or risk tolerances warrant. These limits may be absolute (e.g., loan amount, trading volume) or relative (e.g., percentage of loan book in higher-risk categories). Our lines of business are held accountable to perform within the established limits.
Among the key tools in the risk management process are the Risk and Control Self Assessments (RCSAs). The RCSA process, consistent with IMMC, is one of our primary methods for capturing the identification and assessment of operational risk exposures, including inherent and residual operational risk ratings, and control effectiveness ratings. The end-to-end RCSA process incorporates risk identification and assessment of the control environment; monitoring, reporting and escalating risk; quality assurance and data validation; and integration with the risk appetite. This results in a comprehensive risk management view that enables understanding of and action on operational risks and controls for our processes, products, activities and systems.
The formal processes used to manage risk represent a part of our overall risk management process. Corporate culture and the actions of our employees are also critical to effective risk management. Through our Code of Conduct, we set a high standard for our employees. The Code of Conduct provides a framework for all of our employees to conduct themselves with the highest integrity. We instill a strong and comprehensive risk management culture through communications, training, policies, procedures, and organizational roles and responsibilities. Additionally, we continue to strengthen the link between the employee performance management process and individual compensation to encourage employees to work toward enterprise-wide risk goals.
Corporation-wide Stress Testing
As a part of our core risk management practices, we conduct corporation-wide stress tests on a periodic basis to better understand balance sheet, earnings, capital and liquidity sensitivities to certain economic and business scenarios, including economic and market conditions that are more severe than anticipated. These corporation-wide stress tests provide illustrative hypothetical potential impacts from our risk profile on our balance sheet, earnings, capital and liquidity and serve as a key component of our capital, liquidity and risk management practices. Scenarios are recommended by the MRC and approved by the CFO and the CRO. Impacts to each business from each scenario are then determined and analyzed, primarily by leveraging the models and processes utilized in everyday management routines. Impacts are assessed along with potential mitigating actions that may be taken. Analysis from such stress scenarios is compiled for and reviewed by the MRC and ERC.
Contingency Planning Routines
We have developed and maintain contingency plans that are designed to prepare us in advance to respond in the event of potential adverse outcomes and scenarios. These contingency planning routines include capital contingency planning, liquidity
 
contingency funding plans, recovery planning and enterprise resiliency, and provide monitoring, escalation routines and response plans. Contingency response plans are designed to enable us to increase capital, access funding sources and reduce risk through consideration of potential actions that include asset sales, business sales, capital or debt issuances, and other de-risking strategies.
Strategic Risk Management
Strategic risk is embedded in every business and is one of the major risk categories along with credit, market, liquidity, compliance, operational and reputational risks. It is the risk that results from incorrect assumptions, unsuitable business plans, ineffective strategy execution, or failure to respond in a timely manner to changes in the regulatory, macroeconomic and competitive environments, customer preferences, and technology developments in the geographic locations in which we operate. We face significant strategic risk due to the changing regulatory environment and the fast-paced development of new products and technologies in the financial services industries. Our appetite for strategic risk is assessed based on the strategic plan, with strategic risks selectively and carefully considered against the backdrop of the evolving marketplace. Strategic risk is managed in the context of our overall financial condition, risk appetite and stress test results, among other considerations. The CEO and executive management team manage and act on significant strategic actions, such as divestitures, consolidation of legal entities or capital actions subsequent to required review and approval by the Board.
Executive management develops and approves a strategic plan each year, which is reviewed and approved by the Board. Annually, executive management develops a financial operating plan, which is reviewed and approved by the Board, that implements the strategic goals for that year. With oversight by the Board, executive management ensures that consistency is applied while executing the Corporation’s strategic plan, core operating tenets and risk appetite. The following are assessed in the executive reviews: forecasted earnings and returns on capital, the current risk profile, current capital and liquidity requirements, staffing levels and changes required to support the plan, stress testing results, and other qualitative factors such as market growth rates and peer analysis. At the business level, as we introduce new products, we monitor their performance relative to expectations (e.g., for earnings and returns on capital). With oversight by the Board and the ERC, executive management performs similar analyses throughout the year, and evaluates changes to the financial forecast or the risk, capital or liquidity positions as deemed appropriate to balance and optimize achieving the targeted risk appetite, shareholder returns and maintaining the targeted financial strength.
We use proprietary models to measure the capital requirements for credit, country, market, operational and strategic risks. The allocated capital assigned to each business is based on its unique risk exposures. With oversight by the Board, executive management assesses the risk-adjusted returns of each business in approving strategic and financial operating plans. The businesses use allocated capital to define business strategies, and price products and transactions. For more information on how this measure is calculated, see Supplemental Financial Data on page 12.


38     Bank of America 2014


Capital Management
The Corporation manages its capital position to maintain sufficient capital to support its business activities and maintain capital, risk and risk appetite commensurate with one another. Additionally, we seek to maintain safety and soundness at all times even under adverse scenarios, take advantage of organic growth opportunities, maintain ready access to financial markets, continue to serve as a credit intermediary, remain a source of strength for our subsidiaries, and satisfy current and future regulatory capital requirements. Capital management is integrated into our risk and governance processes, as capital is a key consideration in the development of our strategic plan, risk appetite and risk limits.
We set goals for capital ratios to meet key stakeholder expectations, including investors, regulators and rating agencies, and to achieve our financial performance objectives and strategic goals, while maintaining adequate capital, including during periods of stress. We assess capital adequacy at least on a quarterly basis to operate in a safe and sound manner and maintain adequate capital in relation to the risks associated with our business activities and strategy.
We conduct an Internal Capital Adequacy Assessment Process (ICAAP) on a quarterly basis. The ICAAP is a forward-looking assessment of our projected capital needs and resources, incorporating earnings, balance sheet and risk forecasts under baseline and adverse economic and market conditions. We utilize quarterly stress tests to assess the potential impacts to our balance sheet, earnings, regulatory capital and liquidity under a variety of stress scenarios. We perform qualitative risk assessments to identify and assess material risks not fully captured in our forecasts or stress tests. We assess the capital impacts of proposed changes to regulatory capital requirements. Management assesses ICAAP results and provides documented quarterly assessments of the adequacy of our capital guidelines and capital position to the Board or its committees.
The Corporation periodically reviews capital allocated to its businesses and allocates capital annually during the strategic and capital planning processes. For more information, see Business Segment Operations on page 14.
CCAR and Capital Planning
The Federal Reserve requires BHCs to submit a capital plan and requests for capital actions on an annual basis, consistent with the rules governing the Comprehensive Capital Analysis and Review (CCAR) capital plan. The CCAR capital plan is the central element of the Federal Reserve’s approach to ensure that large BHCs have adequate capital and robust processes for managing their capital.
On October 17, 2014, the Federal Reserve released 2015 CCAR instructions as well as an update to the capital plan and stress test rules. The revised rules shift the dates of the annual stress testing cycle by approximately three months to April, beginning with 2016 CCAR capital plans.
In January 2015, we submitted our 2015 CCAR capital plan and related supervisory stress tests. The Federal Reserve has announced that it will release summary results, including supervisory projections of capital ratios, losses and revenues under stress scenarios, and publish the results of stress tests
 
conducted under the supervisory adverse and supervisory severely adverse scenarios in March 2015.
In January 2014, we submitted our 2014 CCAR capital plan and received results in March 2014. Based on the information in our January 2014 submission, the Federal Reserve advised that it did not object to our 2014 capital actions. In April 2014, we announced the revision of certain regulatory capital amounts and ratios that had previously been reported, and suspended our previously announced 2014 capital actions stating that we would resubmit information pursuant to the 2014 CCAR to the Federal Reserve. In May 2014, we submitted our revised 2014 CCAR capital plan, and in August 2014, the Federal Reserve informed us that it did not object to our revised 2014 CCAR capital plan. The requested capital actions included an increase in the quarterly common stock dividend to $0.05 per share from $0.01 per share, but no additional common stock repurchases.
Regulatory Capital
As a financial services holding company, we are subject to regulatory capital rules issued by U.S. banking regulators. On January 1, 2014, we became subject to the Basel 3 rules, which include certain transition provisions through January 1, 2019 (Basel 3 Standardized Transition). Basel 3 generally continues to be subject to interpretation and clarification by U.S. banking regulators. Basel 3 also expands and modifies the risk-sensitive calculation of risk-weighted assets (defined in the Basel 1 2013 Rules) for credit and market risk (applicable to banks that meet the definition as advanced approaches); and introduces a Standardized approach for the calculation of risk-weighted assets, which serves as a minimum. The Corporation and its primary affiliated banking entity, BANA, meet the definition of an advanced approaches bank and measure regulatory capital adequacy based on the Basel 3 rules. Through December 31, 2013, we were subject to the Basel 1 general risk-based capital rules which included new measures of market risk including a charge related to stressed Value-at-Risk (VaR), an incremental risk charge and the comprehensive risk measure (CRM), as well as other technical modifications to Basel 1 (the Basel 1 2013 Rules).
The risk-sensitive approach for calculating risk-weighted assets under Basel 3 replaces the approach under the Basel 1 2013 Rules. Risk-weighted assets are calculated for credit risk for all on- and off-balance sheet credit exposures and for market risk on trading assets and liabilities, including derivative exposures. Credit risk-weighted assets are calculated by assigning a prescribed risk weight to all on-balance sheet assets and to the credit equivalent amount of certain off-balance sheet exposures. Off-balance sheet exposures include financial guarantees, unfunded lending commitments, letters of credit and derivatives. Market risk-weighted assets are calculated using risk models for trading account positions, including all foreign exchange and commodity positions regardless of the applicable accounting guidance. Any assets that are a direct deduction from the computation of capital are excluded from risk-weighted assets and adjusted average total assets, consistent with regulatory guidance.
For more information on the regulatory capital amounts and calculations, see Basel 3 below.


Bank of America 2014     39


Basel 3
Basel 3 materially changes Tier 1 and Total capital calculations and formally establishes a Common equity tier 1 capital ratio. Basel 3 introduces new minimum capital ratios and buffer requirements and a supplementary leverage ratio (SLR); changes the composition of regulatory capital; and revises the adequately capitalized minimum requirements under the Prompt Corrective Action (PCA) framework. Changes to the composition of regulatory capital under Basel 3, as compared to the Basel 1 2013 Rules, are subject to a transition period as described below. The new minimum capital ratio requirements and related buffers will be phased in from January 1, 2014 through January 1, 2019. For more information on the SLR, see Capital Management – Other Regulatory Capital Matters on page 44.
As an advanced approaches bank, under Basel 3, we are required to complete a qualification period (parallel run) to demonstrate compliance with the final Basel 3 rules to the satisfaction of U.S. banking regulators. Upon notification of approval by U.S. banking regulators to exit our parallel run, we will be required to calculate regulatory capital ratios and risk-weighted assets under both the Standardized and Advanced approaches. The approach that yields the lower ratio is to be used to assess capital adequacy including under the PCA framework. Prior to receipt of notification of approval, we are required to assess our capital adequacy under the Standardized approach only.
Effective January 1, 2015, the PCA framework was amended to reflect the new capital requirements under Basel 3. The PCA framework establishes categories of capitalization, including “well
 
capitalized,” based on regulatory ratio requirements. U.S. banking regulators are required to take certain mandatory actions depending on the category of capitalization, with no mandatory actions required for “well capitalized” banking organizations. Effective January 1, 2015, Common equity tier 1 capital is included in the measurement of “well capitalized.”
Regulatory Capital Composition Transition
Important differences in determining the composition of regulatory capital between the Basel 1 2013 Rules and Basel 3 include changes in capital deductions related to our MSRs, deferred tax assets and defined benefit pension assets, and the inclusion of unrealized gains and losses on AFS debt and certain marketable equity securities recorded in accumulated OCI. These changes will be impacted by, among other things, future changes in interest rates, overall earnings performance and corporate actions. Changes to the composition of regulatory capital under Basel 3, as compared to the Basel 1 2013 Rules, are recognized in 20 percent annual increments, and will be fully recognized as of January 1, 2018. When presented on a fully phased-in basis, capital, risk-weighted assets and the capital ratios assume all regulatory capital adjustments and deductions are fully recognized.
Table 13 summarizes how certain regulatory capital deductions and adjustments have been or will be transitioned from 2014 through 2018 for Common equity tier 1 and Tier 1 capital.


Table 13
Summary of Certain Basel 3 Regulatory Capital Transition Provisions


Beginning on January 1 of each year
2014
 
2015
 
2016
 
2017
 
2018
Common equity tier 1 capital


Percent of total amount deducted from Common equity tier 1 capital includes:
20%
 
40%
 
60%
 
80%
 
100%
Deferred tax assets arising from net operating loss and tax credit carryforwards; intangibles, other than mortgage servicing rights and goodwill; defined benefit pension fund net assets; net unrealized cumulative gains (losses) related to changes in own credit risk on liabilities, including derivatives, measured at fair value; direct and indirect investments in own Common equity tier 1 capital instruments; certain amounts exceeding the threshold by 10 percent individually and 15 percent in aggregate
Percent of total amount used to adjust Common equity tier 1 capital includes (1):
80%
 
60%
 
40%
 
20%
 
0%
Net unrealized gains (losses) on AFS debt and certain marketable equity securities recorded in accumulated OCI; employee benefit plan adjustments recorded in accumulated OCI
Tier 1 capital


Percent of total amount deducted from Tier 1 capital includes:
80%
 
60%
 
40%
 
20%
 
0%
Deferred tax assets arising from net operating loss and tax credit carryforwards; defined benefit pension fund net assets; net unrealized cumulative gains (losses) related to changes in own credit risk on liabilities, including derivatives, measured at fair value
(1) 
Represents the phase-out percentage of the exclusion by year (e.g., 20 percent of net unrealized gains (losses) on AFS debt and certain marketable equity securities recorded in accumulated OCI will be included in 2014).
Additionally, Basel 3 revised the regulatory capital treatment for Trust Securities, requiring them to be partially transitioned from Tier 1 capital into Tier 2 capital in 2014 and 2015, until fully excluded from Tier 1 capital in 2016, and partially transitioned from Tier 2 capital beginning in 2016 with the full amount excluded in 2022. As of December 31, 2014, our qualifying Trust Securities were $2.9 billion (approximately 23 bps of the Tier 1 capital ratio).
Standardized Approach
Under the Basel 3 Standardized approach, exposures subject to market risk are measured on a basis generally consistent with how market risk-weighted assets were measured under the Basel 1 2013 Rules. Credit risk-weighted assets are measured by applying fixed risk weights to each exposure, determined based on the characteristics of the exposure, such as type of obligor,
 
Organization for Economic Cooperation and Development (OECD) country risk code and maturity, among others. Under the Standardized approach, no distinction is made for variations in credit quality for corporate exposures, and the economic benefit of collateral is restricted to a limited list of eligible securities and cash. We estimate our Common equity tier 1 capital ratio under the Basel 3 Standardized approach, on a fully phased-in basis, would have been 10.0 percent at December 31, 2014. As of December 31, 2014, we estimate that our Basel 3 Standardized Common equity tier 1 capital would have been $141.2 billion and total risk-weighted assets would have been $1,415 billion, on a fully phased-in basis. For a reconciliation of Basel 3 Standardized Transition to Basel 3 Standardized estimates on a fully phased-in basis for Common equity tier 1 capital and risk-weighted assets, see Table 16. Our estimates under the Basel 3 Standardized approach may be refined over time as a result of further rulemaking


40     Bank of America 2014


or clarification by U.S. banking regulators or as our understanding and interpretation of the rules evolve. Actual results could differ from those estimates and assumptions.
Advanced Approaches
In addition to the exposures calculated under the Basel 3 Standardized approach, the Basel 3 Advanced approaches include measures of operational risk and risks related to the credit valuation adjustment (CVA) for over-the-counter (OTC) derivative exposures. The Advanced approaches rely on internal analytical models to measure risk weights for credit risk exposures and allow the use of models to estimate the exposure at default (EAD) for certain exposure types. Market risk capital measurements are consistent with the Standardized approach, except for securitization exposures, where the Supervisory Formula Approach is also permitted. Credit risk exposures are measured using internal ratings-based models to determine the applicable risk weight by estimating the probability of default, loss-given default (LGD) and, in certain instances, EAD. The internal analytical models primarily rely on internal historical default and loss experience. Operational risk is measured using internal analytical models which rely on both internal and external operational loss experience and data. The calculations under Basel 3 require management to make estimates, assumptions and interpretations, including with respect to the probability of future events based on historical experience. Actual results could differ from those estimates and assumptions.
The Basel 3 Advanced approaches require approval by the U.S. banking regulators of our internal analytical models used to
 
calculate risk-weighted assets. We estimate our Common equity tier 1 capital ratio under the Basel 3 Advanced approaches, on a fully phased-in basis, would have been 9.6 percent at December 31, 2014. As of December 31, 2014, we estimate that our Basel 3 Advanced Common equity tier 1 capital would have been $141.2 billion and total risk-weighted assets would have been $1,465 billion, on a fully phased-in basis. These estimates assume approval by U.S. banking regulators of our internal analytical models, and do not include the benefit of the removal of the surcharge applicable to the CRM. Our estimates under the Basel 3 Advanced approaches may be refined over time as a result of further rulemaking or clarification by U.S. banking regulators or as our understanding and interpretation of the rules evolve. We are currently working with the U.S. banking regulators to obtain approval of certain internal analytical models including the wholesale (e.g., commercial) and other credit models in order to exit parallel run. The U.S. banking regulators have indicated that they will require modifications to these models which would likely result in a material increase in our risk-weighted assets resulting in a decrease in our capital ratios.
Capital Composition and Ratios
Table 14 presents Bank of America Corporation’s capital ratios and related information in accordance with Basel 3 Standardized Transition as measured at December 31, 2014 and the Basel 1 2013 Rules at December 31, 2013.


Table 14
Bank of America Corporation Regulatory Capital


December 31
 
2014
 
2013
 
Basel 3 Transition
 
Basel 1
(Dollars in billions)
Ratio
 
Minimum
Required 
(1)
 
Ratio
 
Minimum
Required
(1)
Common equity tier 1 capital ratio (2, 3)
12.3
%
 
4.0
%
 
n/a

 
n/a

Tier 1 common capital ratio
n/a

 
n/a

 
10.9
%
 
n/a

Tier 1 capital ratio
13.4

 
6.0

 
12.2

 
6.0
%
Total capital ratio
16.5

 
10.0

 
15.1

 
10.0

Tier 1 leverage ratio
8.2

 
5.0

 
7.7

 
5.0

Risk-weighted assets (3)
$
1,262

 
n/a

 
$
1,298

 
n/a

Adjusted quarterly average total assets (4)
2,060

 
n/a

 
2,052

 
n/a

(1) 
Percent required to meet guidelines to be considered “well capitalized” under the Prompt Corrective Action framework, except for Common equity tier 1 capital which reflects capital adequacy minimum requirements as an advanced approaches bank under Basel 3 during a transition period in 2014.
(2) 
When presented on a fully phased-in basis, beginning January 1, 2019, the minimum Basel 3 Common equity tier 1 capital ratio requirement for the Corporation is expected to significantly increase and will be comprised of the minimum ratio of the then-applicable 4.5 percent, plus a capital conservation buffer and the GSIB buffer.
(3) 
On a pro-forma basis, under Basel 3 Standardized Transition, the December 31, 2013 Common equity tier 1 capital ratio would have been 11.6 percent and risk-weighted assets would have been $1,316 billion.
(4) 
Reflects adjusted average total assets for the three months ended December 31, 2014 and 2013.
n/a = not applicable
Common equity tier 1 capital under Basel 3 Standardized Transition was $155.4 billion at December 31, 2014, an increase of $13.8 billion from Tier 1 common capital under the Basel 1 2013 Rules at December 31, 2013. The increase was largely attributable to the impact of certain transition provisions under Basel 3 Standardized Transition, particularly in regard to deferred tax assets and earnings. For more information on Basel 3 transition provisions, see Table 13. During 2014, Total capital increased
 
$12.1 billion primarily driven by the increase in Common equity tier 1 capital, partially offset by the impact of certain transition provisions under Basel 3 Standardized Transition, particularly in regard to long-term debt that qualifies as Tier 2 capital. The Tier 1 leverage ratio increased 52 bps during 2014 primarily driven by an increase in Tier 1 capital. For additional information, see Tables 14 and 15.


Bank of America 2014     41


At December 31, 2014, an increase or decrease in our Common equity tier 1, Tier 1 or Total capital ratios by one bp would require a change of $126 million in Common equity tier 1, Tier 1 or Total capital. We could also increase our Common equity tier 1, Tier 1 or Total capital ratios by one bp on such date by a reduction in risk-weighted assets of $1.0 billion, $941 million and $762 million, respectively. An increase in our Tier 1 leverage ratio by one bp on such date would require $206 million of additional Tier 1 capital or a reduction of $2.5 billion in adjusted average assets.
 
Risk-weighted assets decreased $36 billion during 2014 to $1,262 billion primarily due to decreases in market risk, and residential mortgage and consumer credit card balances, partially offset by the impact of certain transition provisions under Basel 3 Standardized Transition, and an increase in commercial loans.
Table 15 presents the capital composition as measured under Basel 3 Standardized Transition at December 31, 2014 and the Basel 1 2013 Rules at December 31, 2013.


Table 15
Capital Composition


December 31
 
2014
 
2013
(Dollars in millions)
Basel 3 Transition
 
Basel 1
Total common shareholders’ equity
$
224,162

 
$
219,333

Goodwill
(69,234
)
 
(69,844
)
Intangibles, other than mortgage servicing rights and goodwill
(639
)
 

Nonqualifying intangible assets (includes core deposit intangibles, affinity relationships, customer relationships and other intangibles)

 
(4,263
)
Net unrealized gains (losses) on AFS debt securities and net losses on derivatives recorded in accumulated OCI, net-of-tax
573

 
5,538

Unamortized net periodic benefit costs recorded in accumulated OCI, net-of-tax
2,680

 
2,407

DVA related to liabilities and derivatives (1)
231

 
2,188

Deferred tax assets arising from net operating loss and tax credit carryforwards (2)
(2,226
)
 
(15,391
)
Other
(186
)
 
1,554

Common equity tier 1 capital (3)
155,361

 
141,522

Qualifying preferred stock, net of issuance cost
19,308

 
10,435

Deferred tax assets arising from net operating loss and tax credit carryforwards under transition
(8,905
)
 

DVA related to liabilities and derivatives under transition
925


Defined benefit pension fund assets
(599
)
 

Trust preferred securities
2,893

 
5,785

Other
(10
)
 

Total Tier 1 capital
168,973

 
157,742

Long-term debt qualifying as Tier 2 capital
17,953

 
21,175

Nonqualifying trust preferred securities subject to phase out from Tier 2 capital
3,881


Allowance for loan and lease losses
14,419

 
17,428

Reserve for unfunded lending commitments
528

 
484

Allowance for loan and lease losses exceeding 1.25 percent of risk-weighted assets
(313
)
 
(1,637
)
Other
3,229

 
1,375

Total capital
$
208,670

 
$
196,567

(1) 
Represents loss on structured liabilities and derivatives, net-of-tax, that is excluded from Common equity tier 1, Tier 1 and Total capital for regulatory capital purposes.
(2) 
December 31, 2014 amount represents phase-in portion under Basel 3 Standardized Transition. The December 31, 2013 amount represents the full Basel 1 deferred tax asset disallowance.
(3) 
Tier 1 common capital under the Basel 1 2013 Rules at December 31, 2013.

42     Bank of America 2014


Table 16 presents reconciliations of our Common equity tier 1 capital and risk-weighted assets in accordance with the Basel 1 2013 Rules and Basel 3 Standardized Transition to the Basel 3 Standardized approach fully phased-in estimates and Basel 3 Advanced approaches fully phased-in estimates at December 31,
 
2014 and 2013. Basel 3 regulatory capital ratios on a fully phased-in basis are considered non-GAAP financial measures until the end of the transition period on January 1, 2019 when adopted and required by U.S. banking regulators.


Table 16
Regulatory Capital Reconciliations (1, 2)


December 31
2013
(Dollars in millions)
 
 
Basel 1
Regulatory capital – Basel 1 to Basel 3 (fully phased-in)


Basel 1 Tier 1 capital
 
 
$
157,742

Deduction of qualifying preferred stock and trust preferred securities
 
 
(16,220
)
Basel 1 Tier 1 common capital
 
 
141,522

Deduction of defined benefit pension assets
 
 
(829
)
Deferred tax assets and threshold deductions (deferred tax asset temporary differences, MSRs and significant investments)
 
 
(5,459
)
Net unrealized losses in accumulated OCI on AFS debt and certain marketable equity securities, and employee benefit plans
 
 
(5,664
)
Other deductions, net
 
 
(1,624
)
Basel 3 Common equity tier 1 capital (fully phased-in)
 
 
$
127,946


December 31
2014


Basel 3 Transition
 
 
Regulatory capital – Basel 3 transition to fully phased-in


Common equity tier 1 capital (transition)
$
155,361


Deferred tax assets arising from net operating loss and tax credit carryforwards phased in during transition
(8,905
)
 
 
DVA related to liabilities and derivatives phased in during transition
925


Defined benefit pension fund assets phased in during transition
(599
)
 
 
Other adjustments and deductions phased in during transition
(5,565
)
 
 
Common equity tier 1 capital (fully phased-in)
$
141,217


December 31
 
2014
 
2013
 
Basel 3 Transition
 
Basel 1
Risk-weighted assets – As reported to Basel 3 (fully phased-in)


As reported risk-weighted assets
$
1,261,544

 
$
1,297,593

Changes in risk-weighted assets from reported to fully phased-in
153,722

 
162,731

Basel 3 Standardized approach risk-weighted assets (fully phased-in)
1,415,266

 
1,460,324

Changes in risk-weighted assets for advanced models
50,213

 
(133,027
)
Basel 3 Advanced approaches risk-weighted assets (fully phased-in)
$
1,465,479

 
$
1,327,297


Regulatory capital ratios


Basel 1 Tier 1 common
n/a

 
10.9
%
Basel 3 Standardized approach Common equity tier 1 (transition)
12.3
%
 
n/a

Basel 3 Standardized approach Common equity tier 1 (fully phased-in)
10.0

 
8.8

Basel 3 Advanced approaches Common equity tier 1 (fully phased-in) (3)
9.6

 
9.6

(1) 
Fully phased-in Basel 3 estimates are based on our current understanding of the Standardized and Advanced approaches under the Basel 3 rules. The Advanced approaches estimates assume approval by U.S. banking regulators of our internal analytical models, and do not include the benefit of the removal of the surcharge applicable to the CRM.
(2) 
On January 1, 2014, we became subject to the Basel 3 rules, which include certain transition provisions primarily related to regulatory deductions and adjustments impacting Common equity tier 1 capital and Tier 1 capital. We reported under the Basel 1 2013 Rules at December 31, 2013.
(3) 
We are currently working with the U.S. banking regulators to obtain approval of certain internal analytical models including the wholesale (e.g., commercial) and other credit models in order to exit parallel run. The U.S. banking regulators have indicated that they will require modifications to these models which would likely result in a material increase in our risk-weighted assets resulting in a decrease in our capital ratios.
n/a = not applicable


Bank of America 2014     43


Bank of America, N.A. Regulatory Capital
Prior to October 1, 2014, we operated our banking activities primarily under two charters: BANA and, to a lesser extent, FIA.
 
On October 1, 2014, FIA was merged into BANA. Table 17 presents regulatory capital information for BANA at December 31, 2014 and 2013.


Table 17
Bank of America, N.A. Regulatory Capital


December 31
 
 
2014
 
2013
(Dollars in millions)
Ratio
 
Amount
 
Minimum
Required
 (1)
 
Ratio
 
Amount
 
Minimum
Required 
(1)
Common equity tier 1 capital (2)
13.1
%
 
$
145,150

 
4.0
%
 
n/a

 
n/a

 
n/a

Tier 1 capital
13.1

 
145,150

 
6.0

 
12.3
%
 
$
125,886

 
6.0
%
Total capital
14.6

 
161,623

 
10.0

 
13.8

 
141,232

 
10.0

Tier 1 leverage
9.6

 
145,150

 
5.0

 
9.2

 
125,886

 
5.0

(1) 
Percent required to meet guidelines to be considered “well capitalized” under the Prompt Corrective Action framework, except for Common equity tier 1 capital which reflects capital adequacy minimum requirements as an advanced approaches bank under Basel 3 during a transition period in 2014.
(2) 
When presented on a fully phased-in basis, beginning January 1, 2019, the minimum Basel 3 Common equity tier 1 capital ratio requirement for BANA is expected to significantly increase and will be comprised of the minimum ratio of the then-applicable 4.5 percent, plus a capital conservation buffer and the GSIB buffer.
n/a = not applicable
BANA’s Tier 1 capital ratio under Basel 3 Standardized Transition was 13.1 percent at December 31, 2014, an increase of 80 bps from December 31, 2013. The increase was largely attributable to the merger of FIA into BANA in 2014. The Total capital ratio increased 79 bps to 14.6 percent at December 31, 2014 compared to December 31, 2013. The Tier 1 leverage ratio increased 42 bps to 9.6 percent. The increase in the Total capital ratio was driven by the same factors as the Tier 1 capital ratio. The increase in the Tier 1 leverage ratio was driven by an increase in Tier 1 capital, partially offset by an increase in adjusted quarterly average total assets. Further, the merger with FIA positively impacted these ratios.
Other Regulatory Capital Matters
Supplementary Leverage Ratio
Basel 3 also will require the calculation of a supplementary leverage ratio (SLR). The SLR is determined by dividing Tier 1 capital, using quarter-end Basel 3 Tier 1 capital on a fully phased-in basis, by supplementary leverage exposure calculated as the daily average of the sum of on-balance sheet as well as the simple average of certain off-balance sheet exposures at the end of each month in the quarter. Supplementary leverage exposure is comprised of all on-balance sheet assets, plus a measure of certain off-balance sheet exposures, including among other items, lending commitments, letters of credit, OTC derivatives, repo-style transactions and margin loan commitments. We are required to disclose our SLR effective January 1, 2015. Effective January 1, 2018, the Corporation will be required to maintain a minimum SLR of 3.0 percent, plus a supplementary leverage buffer of 2.0 percent, for a total SLR of 5.0 percent. If the Corporation’s supplementary leverage buffer is not greater than or equal to 2.0 percent, then the Corporation will be subject to mandatory limits on its ability to make distributions of capital to shareholders, whether through dividends, stock repurchases or otherwise. In addition, the insured depository institutions of such BHCs, which for the Corporation is primarily BANA, will be required to maintain a minimum 6.0 percent SLR to be considered “well capitalized.”
On September 3, 2014, U.S. banking regulators adopted a final rule to revise the definition and scope of the denominator of the SLR. The final rule prescribes the calculation of total leverage exposure, the frequency of calculation and required disclosures. The definition of total leverage exposure is revised to include the
 
effective notional principal amount of credit derivatives and other similar instruments through which credit protection is sold. Calculations of the components of total leverage exposure for derivative and repo-style transactions are modified. The credit conversion factors (CCF) applied to certain off-balance sheet exposures are conformed to the graduated CCF used by the Standardized approach, subject to the minimum 10 percent credit conversion factor.
As of December 31, 2014, we estimate the Corporation’s SLR would have been approximately 5.9 percent, which exceeds the 5.0 percent threshold that represents the minimum plus the supplementary leverage buffer for BHCs. The estimated SLR for BANA was approximately 7.0 percent, which exceeds the 6.0 percent “well capitalized” level for insured depository institutions of BHCs.
Global Systemically Important Bank Surcharge
In November 2011, the Basel Committee on Banking Supervision (Basel Committee) published a methodology to identify global systemically important banks (GSIBs) and impose an additional loss absorbency requirement through the introduction of a surcharge of up to 3.5 percent, which must be satisfied with Common equity tier 1 capital. The assessment methodology relies on an indicator-based measurement approach to determine a score relative to the global banking industry. The chosen indicators are size, complexity, cross-jurisdictional activity, inter-connectedness and substitutability/financial institution infrastructure. Institutions with the highest scores are designated as GSIBs and are assigned to one of four loss absorbency buckets from 1.0 percent to 2.5 percent, in 0.5 percent increments based on each institution’s relative score and supervisory judgment. The fifth loss absorbency bucket of 3.5 percent is currently empty and serves to discourage banks from becoming more systemically important. Also in November 2011, the Financial Stability Board (FSB) published an integrated set of policy measures and identified an initial group of GSIBs, which included the Corporation.
In July 2013, the Basel Committee updated the November 2011 methodology to recalibrate the substitutability/financial institution infrastructure indicator by introducing a cap on the weighting of that component, and requiring the annual publication by the FSB of key information necessary to permit each GSIB to calculate its score and observe its position within the buckets and relative to the industry total for each indicator. Every three years,


44     Bank of America 2014


beginning on January 1, 2016, the Basel Committee will reconsider and recalibrate the bucket thresholds. The Basel Committee and FSB expect banks to change their behavior in response to the incentives of the GSIB framework, as well as other aspects of Basel 3 and jurisdiction-specific regulations.
In November 2014, the Basel Committee published an updated list of GSIBs and their respective loss absorbency buckets. As of December 31, 2014, we estimated our surcharge at 1.5 percent based on the Basel 3 information and considering the FSB’s report, “2014 update of list of global systemically important banks (GSIBs).” Our surcharge could change each year based on our actions and those of our peers, as the scoring methods utilize data from the Corporation in combination with the industry. If our score were to increase, we could be subject to a higher GSIB surcharge.
In December 2014, a U.S. banking regulator proposed a regulation that would implement GSIB surcharge requirements for the largest U.S. BHCs. Under the proposal, assignment to loss absorbency buckets would be determined by the higher score as calculated according to two methods. Method 1 is substantially similar to the Basel Committee’s methodology, whereas Method 2 replaces the substitutability/financial institution infrastructure indicator with a measure of short-term wholesale funding and then multiplies the overall score by two. The Federal Reserve estimates that Method 2 will yield a higher surcharge, currently ranging from 1.0 percent to 4.5 percent.
Under the proposed U.S. rules, the GSIB surcharge requirement will begin to phase in effective January 2016, with full implementation in January 2019. Data from the original five indicators, measured as of December 31, 2014, combined with short-term wholesale funding data covering the third quarter of 2015, is proposed to be used to determine the GSIB surcharge that will be effective for us in 2016.
Broker-dealer Regulatory Capital and Securities Regulation
The Corporation’s principal U.S. broker-dealer subsidiaries are Merrill Lynch, Pierce, Fenner & Smith (MLPF&S) and Merrill Lynch Professional Clearing Corp (MLPCC). MLPCC is a fully-guaranteed subsidiary of MLPF&S and provides clearing and settlement services. Both entities are subject to the net capital requirements of SEC Rule 15c3-1. Both entities are also registered as futures commission merchants and are subject to the Commodity Futures Trading Commission Regulation 1.17.
MLPF&S has elected to compute the minimum capital requirement in accordance with the Alternative Net Capital Requirement as permitted by SEC Rule 15c3-1. At December 31, 2014, MLPF&S’s regulatory net capital as defined by Rule 15c3-1 was $9.7 billion and exceeded the minimum requirement of $1.3 billion by $8.4 billion. MLPCC’s net capital of $3.4 billion exceeded the minimum requirement of $508 million by $2.9 billion.
In accordance with the Alternative Net Capital Requirements, MLPF&S is required to maintain tentative net capital in excess of $1.0 billion, net capital in excess of $500 million and notify the SEC in the event its tentative net capital is less than $5.0 billion. At December 31, 2014, MLPF&S had tentative net capital and net capital in excess of the minimum and notification requirements.
Merrill Lynch International (MLI), a U.K. investment firm, is regulated by the Prudential Regulation Authority and the Financial Conduct Authority, and is subject to certain regulatory capital requirements. At December 31, 2014, MLI’s capital resources
 
were $32.3 billion which exceeded the minimum requirement of $17.9 billion.
Common Stock Dividends
For a summary of our declared quarterly cash dividends on common stock during 2014 and through February 25, 2015, see Note 13 – Shareholders’ Equity to the Consolidated Financial Statements.
Liquidity Risk
Funding and Liquidity Risk Management
We define liquidity risk as the potential inability to meet our contractual and contingent financial obligations, on- or off-balance sheet, as they come due. Our primary liquidity objective is to provide adequate funding for our businesses throughout market cycles, including periods of financial stress. To achieve that objective, we analyze and monitor our liquidity risk, maintain excess liquidity and access diverse funding sources including our stable deposit base. We define excess liquidity as readily available assets, limited to cash and high-quality, liquid, unencumbered securities that we can use to meet our funding requirements as those obligations arise.
Global funding and primary liquidity risk management activities are centralized within Corporate Treasury. We believe that a centralized approach to funding and liquidity risk management enhances our ability to monitor liquidity requirements, maximizes access to funding sources, minimizes borrowing costs and facilitates timely responses to liquidity events.
The Board approves the Corporation’s liquidity policy and the ERC approves the contingency funding plan, including establishing liquidity risk tolerance levels. The MRC monitors our liquidity position and reviews the impact of strategic decisions on our liquidity. The MRC is responsible for overseeing liquidity risks and maintaining exposures within the established tolerance levels. MRC reviews and monitors our liquidity position, cash flow forecasts, stress testing scenarios and results, and implements our liquidity limits and guidelines. For additional information, see Managing Risk on page 35. Under this governance framework, we have developed certain funding and liquidity risk management practices which include: maintaining excess liquidity at the parent company and selected subsidiaries, including our bank subsidiaries and other regulated entities; determining what amounts of excess liquidity are appropriate for these entities based on analysis of debt maturities and other potential cash outflows, including those that we may experience during stressed market conditions; diversifying funding sources, considering our asset profile and legal entity structure; and performing contingency planning.
Global Excess Liquidity Sources and Other Unencumbered Assets
We maintain excess liquidity available to Bank of America Corporation, or the parent company and selected subsidiaries in the form of cash and high-quality, liquid, unencumbered securities. These assets, which we call our Global Excess Liquidity Sources, serve as our primary means of liquidity risk mitigation. Our cash is primarily on deposit with the Federal Reserve and, to a lesser extent, central banks outside of the U.S. We limit the composition of high-quality, liquid, unencumbered securities to U.S. government securities, U.S. agency securities, U.S. agency MBS and a select


Bank of America 2014     45


group of non-U.S. government and supranational securities. We believe we can quickly obtain cash for these securities, even in stressed market conditions, through repurchase agreements or outright sales. We hold our Global Excess Liquidity Sources in legal entities that allow us to meet the liquidity requirements of our global businesses, and we consider the impact of potential regulatory, tax, legal and other restrictions that could limit the transferability of funds among entities. Our Global Excess Liquidity Sources are substantially the same in composition to what qualifies as High Quality Liquid Assets (HQLA) under the final LCR rules. For more information on the final rules, see Liquidity Risk – Basel 3 Liquidity Standards on page 47.
Our Global Excess Liquidity Sources were $439 billion and $376 billion at December 31, 2014 and 2013, and were maintained as presented in Table 18.


Table 18
Global Excess Liquidity Sources


December 31
Average for Three Months Ended December 31 2014
(Dollars in billions)
2014
 
2013
Parent company
$
98

 
$
95

$
92

Bank subsidiaries
306

 
249

314

Other regulated entities
35

 
32

32

Total Global Excess Liquidity Sources
$
439

 
$
376

$
438

As shown in Table 18, parent company Global Excess Liquidity Sources totaled $98 billion and $95 billion at December 31, 2014 and 2013. The increase in parent company liquidity was primarily due to bank subsidiary inflows, partially offset by payments in connection with litigation settlements. Typically, parent company excess liquidity is in the form of cash deposited with BANA.
Global Excess Liquidity Sources available to our bank subsidiaries totaled $306 billion and $249 billion at December 31, 2014 and 2013. The increase in bank subsidiaries’ liquidity was primarily due to a shift from less liquid mortgage loans into more liquid securities, partially offset by dividends and returns of capital to the parent company. Global Excess Liquidity Sources at bank subsidiaries exclude the cash deposited by the parent company. Our bank subsidiaries can also generate incremental liquidity by pledging a range of other unencumbered loans and securities to certain Federal Home Loan Banks (FHLBs) and the Federal Reserve Discount Window. The cash we could have obtained by borrowing against this pool of specifically-identified eligible assets was approximately $214 billion and $218 billion at December 31, 2014 and 2013. We have established operational procedures to enable us to borrow against these assets, including regularly monitoring our total pool of eligible loan and securities collateral. Eligibility is defined by guidelines outlined by the FHLBs and the Federal Reserve and is subject to change at their discretion. Due to regulatory restrictions, liquidity generated by the bank subsidiaries can generally be used only to fund obligations within the bank subsidiaries and can only be transferred to the parent company or nonbank subsidiaries with prior regulatory approval.
Global Excess Liquidity Sources available to our other regulated entities, comprised primarily of broker-dealer subsidiaries, totaled $35 billion and $32 billion at December 31, 2014 and 2013. Our other regulated entities also held other unencumbered investment-grade securities and equities that we believe could be used to
 
generate additional liquidity. Liquidity held in an other regulated entity is primarily available to meet the obligations of that entity and transfers to the parent company or to any other subsidiary may be subject to prior regulatory approval due to regulatory restrictions and minimum requirements.
Table 19 presents the composition of Global Excess Liquidity Sources at December 31, 2014 and 2013.


Table 19
Global Excess Liquidity Sources Composition


December 31
(Dollars in billions)
2014
 
2013
Cash on deposit
$
97

 
$
90

U.S. Treasury securities
74

 
20

U.S. agency securities and mortgage-backed securities
252

 
245

Non-U.S. government and supranational securities
16

 
21

Total Global Excess Liquidity Sources
$
439

 
$
376

Time-to-required Funding and Stress Modeling
We use a variety of metrics to determine the appropriate amounts of excess liquidity to maintain at the parent company, our bank subsidiaries and other regulated entities. One metric we use to evaluate the appropriate level of excess liquidity at the parent company is “time-to-required funding.” This debt coverage measure indicates the number of months that the parent company can continue to meet its unsecured contractual obligations as they come due using only its Global Excess Liquidity Sources without issuing any new debt or accessing any additional liquidity sources. We define unsecured contractual obligations for purposes of this metric as maturities of senior or subordinated debt issued or guaranteed by Bank of America Corporation. These include certain unsecured debt instruments, primarily structured liabilities, which we may be required to settle for cash prior to maturity. Our time-to-required funding was 39 months at December 31, 2014. For purposes of calculating time-to-required funding, at December 31, 2014, we have included in the amount of unsecured contractual obligations $8.6 billion related to the BNY Mellon Settlement. The BNY Mellon Settlement is subject to final court approval and certain other conditions, and the timing of payment is not certain.
We utilize liquidity stress models to assist us in determining the appropriate amounts of excess liquidity to maintain at the parent company, our bank subsidiaries and other regulated entities. These models are risk sensitive and have become increasingly important in analyzing our potential contractual and contingent cash outflows beyond those outflows considered in the time-to-required funding analysis. We evaluate the liquidity requirements under a range of scenarios with varying levels of severity and time horizons. The scenarios we consider and utilize incorporate market-wide and Corporation-specific events, including potential credit rating downgrades for the parent company and our subsidiaries, and are based on historical experience, regulatory guidance, and both expected and unexpected future events.
The types of potential contractual and contingent cash outflows we consider in our scenarios may include, but are not limited to, upcoming contractual maturities of unsecured debt and reductions in new debt issuance; diminished access to secured financing markets; potential deposit withdrawals; increased draws on loan commitments, liquidity facilities and letters of credit; additional collateral that counterparties could call if our credit ratings were downgraded; collateral and margin requirements arising from market value changes; and potential liquidity required to maintain


46     Bank of America 2014


businesses and finance customer activities. Changes in certain market factors, including, but not limited to, credit rating downgrades, could negatively impact potential contractual and contingent outflows and the related financial instruments, and in some cases these impacts could be material to our financial results.
We consider all sources of funds that we could access during each stress scenario and focus particularly on matching available sources with corresponding liquidity requirements by legal entity. We also use the stress modeling results to manage our asset-liability profile and establish limits and guidelines on certain funding sources and businesses.
Basel 3 Liquidity Standards
The Basel Committee has issued two liquidity risk-related standards that are considered part of the Basel 3 liquidity standards: the Liquidity Coverage Ratio (LCR) and the Net Stable Funding Ratio (NSFR). The LCR is calculated as the amount of a financial institution’s unencumbered HQLA relative to the estimated net cash outflows the institution could encounter over a 30-day period of significant liquidity stress, expressed as a percentage. As with other Basel Committee standards, the Basel Committee’s liquidity risk-related standards do not directly apply to U.S. financial institutions, but require adoption by U.S. banking regulators as described below.
In 2014, the U.S. banking regulators finalized LCR requirements for the largest U.S. financial institutions on a consolidated basis and for their subsidiary depository institutions with total assets greater than $10 billion. Under the final rule, an initial minimum LCR of 80 percent is required in January 2015, and will increase thereafter in 10 percentage point increments annually through January 2017. These minimum requirements are applicable to the Corporation on a consolidated basis and to our insured depository institutions. As of December 31, 2014, we estimate the consolidated Corporation to be in compliance with LCR on a fully phased-in basis. For more information on our balance sheet actions to reduce risk and increase liquidity related to LCR, see Executive Summary – Balance Sheet Overview on page 7.
In 2014, the Basel Committee issued a final standard for the NSFR, the standard that is intended to reduce funding risk over a longer time horizon. The NSFR is designed to ensure an appropriate amount of stable funding, generally capital and liabilities maturing beyond one year, given the mix of assets and off-balance sheet items. The final standard aligns the NSFR to the LCR and gives more credit to a wider range of funding. The final standard also includes adjustments to the stable funding required for certain types of assets, some of which reduce the stable funding requirement and some of which increase it. The U.S. banking regulators are expected to propose a similar NSFR regulation in the near future. We expect to meet the NSFR requirement within the regulatory timeline.
Diversified Funding Sources
We fund our assets primarily with a mix of deposits and secured and unsecured liabilities through a centralized, globally coordinated funding strategy. We diversify our funding globally
 
across products, programs, markets, currencies and investor groups.
The primary benefits of our centralized funding strategy include greater control, reduced funding costs, wider name recognition by investors and greater flexibility to meet the variable funding requirements of subsidiaries. Where regulations, time zone differences or other business considerations make parent company funding impractical, certain other subsidiaries may issue their own debt.
We fund a substantial portion of our lending activities through our deposits, which were $1.12 trillion at both December 31, 2014 and 2013. Deposits are primarily generated by our Consumer Banking, GWIM and Global Banking segments. These deposits are diversified by clients, product type and geography, and the majority of our U.S. deposits are insured by the FDIC. We consider a substantial portion of our deposits to be a stable, low-cost and consistent source of funding. We believe this deposit funding is generally less sensitive to interest rate changes, market volatility or changes in our credit ratings than wholesale funding sources. Our lending activities may also be financed through secured borrowings, including credit card securitizations and securitizations with GSEs, the FHA and private-label investors, as well as FHLB loans. During 2014, $4.1 billion of new senior debt was issued to third-party investors from the credit card securitization trusts.
Our trading activities in other regulated entities are primarily funded on a secured basis through securities lending and repurchase agreements and these amounts will vary based on customer activity and market conditions. We believe funding these activities in the secured financing markets is more cost-efficient and less sensitive to changes in our credit ratings than unsecured financing. Repurchase agreements are generally short-term and often overnight. Disruptions in secured financing markets for financial institutions have occurred in prior market cycles which resulted in adverse changes in terms or significant reductions in the availability of such financing. We manage the liquidity risks arising from secured funding by sourcing funding globally from a diverse group of counterparties, providing a range of securities collateral and pursuing longer durations, when appropriate. For more information on secured financing agreements, see Note 10 – Federal Funds Sold or Purchased, Securities Financing Agreements and Short-term Borrowings to the Consolidated Financial Statements.
We issue long-term unsecured debt in a variety of maturities and currencies to achieve cost-efficient funding and to maintain an appropriate maturity profile. During 2014, we issued $32.7 billion of long-term unsecured debt, including structured note issuance of $2.8 billion, a majority of which was issued by the parent company. We also issued $3.3 billion of unsecured long-term debt through BANA. While the cost and availability of unsecured funding may be negatively impacted by general market conditions or by matters specific to the financial services industry or the Corporation, we seek to mitigate refinancing risk by actively managing the amount of our borrowings that we anticipate will mature within any month or quarter.


Bank of America 2014     47


Table 20 presents our long-term debt by major currency at December 31, 2014 and 2013.


Table 20
Long-term Debt by Major Currency


December 31
(Dollars in millions)
2014
 
2013
U.S. Dollar
$
191,264

 
$
176,294

Euro
30,687

 
46,029

British Pound
7,881

 
9,772

Japanese Yen
6,058

 
9,115

Australian Dollar
2,135

 
1,870

Canadian Dollar
1,779

 
2,402

Swiss Franc
897

 
1,274

Other
2,438

 
2,918

Total long-term debt
$
243,139

 
$
249,674

Total long-term debt decreased $6.5 billion, or three percent, in 2014, primarily driven by maturities outpacing new issuances. We may, from time to time, purchase outstanding debt instruments in various transactions, depending on prevailing market conditions, liquidity and other factors. In addition, our other regulated entities may make markets in our debt instruments to provide liquidity for investors. For more information on long-term debt funding, see Note 11 – Long-term Debt to the Consolidated Financial Statements.
We use derivative transactions to manage the duration, interest rate and currency risks of our borrowings, considering the characteristics of the assets they are funding. For further details on our ALM activities, see Interest Rate Risk Management for Non-trading Activities on page 85.
We may also issue unsecured debt in the form of structured notes for client purposes. Structured notes are debt obligations that pay investors returns linked to other debt or equity securities, indices, currencies or commodities. We typically hedge the returns we are obligated to pay on these liabilities with derivative positions and/or investments in the underlying instruments, so that from a funding perspective, the cost is similar to our other unsecured long-term debt. We could be required to settle certain structured liability obligations for cash or other securities prior to maturity under certain circumstances, which we consider for liquidity planning purposes. We believe, however, that a portion of such borrowings will remain outstanding beyond the earliest put or redemption date. We had outstanding structured liabilities with a carrying value of $38.8 billion and $48.4 billion at December 31, 2014 and 2013.
Substantially all of our senior and subordinated debt obligations contain no provisions that could trigger a requirement for an early repayment, require additional collateral support, result in changes to terms, accelerate maturity or create additional financial obligations upon an adverse change in our credit ratings, financial ratios, earnings, cash flows or stock price.
Contingency Planning
We maintain contingency funding plans that outline our potential responses to liquidity stress events at various levels of severity. These policies and plans are based on stress scenarios and include potential funding strategies and communication and notification procedures that we would implement in the event we experienced stressed liquidity conditions. We periodically review and test the contingency funding plans to validate efficacy and assess readiness.
 
Our U.S. bank subsidiaries can access contingency funding through the Federal Reserve Discount Window. Certain non-U.S. subsidiaries have access to central bank facilities in the jurisdictions in which they operate. While we do not rely on these sources in our liquidity modeling, we maintain the policies, procedures and governance processes that would enable us to access these sources if necessary.
Credit Ratings
Our borrowing costs and ability to raise funds are impacted by our credit ratings. In addition, credit ratings may be important to customers or counterparties when we compete in certain markets and when we seek to engage in certain transactions, including OTC derivatives. Thus, it is our objective to maintain high-quality credit ratings, and management maintains an active dialogue with the rating agencies.
Credit ratings and outlooks are opinions expressed by rating agencies on our creditworthiness and that of our obligations or securities, including long-term debt, short-term borrowings, preferred stock and other securities, including asset securitizations. Our credit ratings are subject to ongoing review by the rating agencies and they consider a number of factors, including our own financial strength, performance, prospects and operations as well as factors not under our control. The rating agencies could make adjustments to our ratings at any time and they provide no assurances that they will maintain our ratings at current levels.
Other factors that influence our credit ratings include changes to the rating agencies’ methodologies for our industry or certain security types, the rating agencies’ assessment of the general operating environment for financial services companies, the sovereign credit ratings of the U.S. government, our mortgage exposures (including litigation), our relative positions in the markets in which we compete, reputation, liquidity position, diversity of funding sources, funding costs, the level and volatility of earnings, corporate governance and risk management policies, capital position, capital management practices, and current or future regulatory and legislative initiatives.
All three agencies have indicated that, as a systemically important financial institution, the senior credit ratings of the Corporation and Bank of America, N.A. (or in the case of Moody’s Investors Service, Inc. (Moody’s), only the ratings of Bank of America, N.A.) currently reflect the expectation that, if necessary, we would receive significant support from the U.S. government, and that they will continue to assess such support in the context of sovereign financial strength and regulatory and legislative developments.
On December 2, 2014, Standard & Poor’s Ratings Services (S&P) affirmed the ratings of Bank of America, and revised the outlook on our core operating subsidiaries, including Bank of America, N.A., MLPF&S, and MLI, to stable from negative. The negative outlook on the ratings of Bank of America Corporation reflects S&P’s ongoing evaluation of whether to continue to include uplift for extraordinary U.S. government support in the ratings of systemically-important BHCs. On November 25, 2014, Fitch Ratings (Fitch) concluded their periodic review of 12 large, complex securities trading and universal banks, including Bank of America Corporation. As a result of this review, Fitch affirmed all of the Corporation’s credit ratings and retained a negative outlook. The negative outlook reflects Fitch’s expectation that the probability of the U.S. government providing support to a systemically important financial institution during a crisis is likely to decline due to the


48     Bank of America 2014


orderly liquidation provisions of the Dodd-Frank Wall Street Reform and Consumer Protection Act. On November 14, 2013, Moody’s concluded its review of the ratings for Bank of America and certain other systemically important U.S. BHCs, affirming our current ratings and noting that those ratings no longer incorporate any uplift for U.S. government support. Concurrently, Moody’s upgraded Bank of America, N.A.’s senior debt and stand-alone
 
ratings by one notch, citing a number of positive developments at Bank of America. Moody’s also moved its outlook for all of our ratings to stable.
Table 21 presents the Corporation’s current long-term/short-term senior debt ratings and outlooks expressed by the rating agencies.


Table 21
Senior Debt Ratings


Moody’s Investors Service
 
Standard & Poor’s
 
Fitch Ratings
 
Long-term
 
Short-term
 
Outlook
 
Long-term
 
Short-term
 
Outlook
 
Long-term
 
Short-term
 
Outlook
Bank of America Corporation
Baa2
 
P-2
 
Stable
 
A-
 
A-2
 
Negative
 
A
 
F1
 
Negative
Bank of America, N.A.
A2
 
P-1
 
Stable
 
A
 
A-1
 
Stable
 
A
 
F1
 
Negative
Merrill Lynch, Pierce, Fenner & Smith
NR
 
NR
 
NR
 
A
 
A-1
 
Stable
 
A
 
F1
 
Negative
Merrill Lynch International
NR
 
NR
 
NR
 
A
 
A-1
 
Stable
 
A
 
F1
 
Negative
NR = not rated
A reduction in certain of our credit ratings or the ratings of certain asset-backed securitizations may have a material adverse effect on our liquidity, potential loss of access to credit markets, the related cost of funds, our businesses and on certain trading revenues, particularly in those businesses where counterparty creditworthiness is critical. In addition, under the terms of certain OTC derivative contracts and other trading agreements, in the event of downgrades of our or our rated subsidiaries’ credit ratings, the counterparties to those agreements may require us to provide additional collateral, or to terminate these contracts or agreements, which could cause us to sustain losses and/or adversely impact our liquidity. If the short-term credit ratings of our parent company, bank or broker-dealer subsidiaries were downgraded by one or more levels, the potential loss of access to short-term funding sources such as repo financing and the effect on our incremental cost of funds could be material.
Table 22 presents the amount of additional collateral that would have been contractually required by derivative contracts and other trading agreements at December 31, 2014 if the rating agencies had downgraded their long-term senior debt ratings for the Corporation or certain subsidiaries by one incremental notch and by an additional second incremental notch.


Table 22
Additional Collateral Required to be Posted Upon Downgrade


December 31, 2014
(Dollars in millions)
One
incremental notch
Second
incremental notch
Bank of America Corporation
$
1,402

$
2,825

Bank of America, N.A. and subsidiaries (1)
1,072

1,886

(1) 
Included in Bank of America Corporation collateral requirements in this table.
Table 23 presents the derivative liabilities that would be subject to unilateral termination by counterparties and the amounts of collateral that would have been contractually required at December 31, 2014, if the long-term senior debt ratings for the Corporation or certain subsidiaries had been lower by one incremental notch and by an additional second incremental notch.


Table 23
Derivative Liabilities Subject to Unilateral Termination Upon Downgrade


December 31, 2014
(Dollars in millions)
One
incremental notch
Second
incremental notch
Derivative liability
$
1,785

$
3,850

Collateral posted
1,520

2,986

While certain potential impacts are contractual and quantifiable, the full scope of the consequences of a credit rating downgrade to a financial institution is inherently uncertain, as it depends upon numerous dynamic, complex and inter-related factors and assumptions, including whether any downgrade of a company’s long-term credit ratings precipitates downgrades to its short-term credit ratings, and assumptions about the potential behaviors of various customers, investors and counterparties. For more information on potential impacts of credit rating downgrades, see Liquidity Risk – Time-to-required Funding and Stress Modeling on page 46.
For more information on the additional collateral and termination payments that could be required in connection with certain OTC derivative contracts and other trading agreements as a result of such a credit rating downgrade, see Note 2 – Derivatives to the Consolidated Financial Statements.
On June 6, 2014, S&P affirmed its AA+ long-term and A-1+ short-term sovereign credit rating on the U.S. government with a stable outlook. On March 21, 2014, Fitch affirmed its AAA long-term and F1+ short-term sovereign credit rating on the U.S. government with a stable outlook. This resolved the rating watch negative that was placed on the ratings on October 15, 2013. On July 18, 2013, Moody’s revised its outlook on the U.S. government to stable from negative and affirmed its Aaa long-term sovereign credit rating on the U.S. government.


Bank of America 2014     49


Credit Risk Management
Credit quality improved during 2014 due in part to improving economic conditions. In addition, our proactive credit risk management activities positively impacted the credit portfolio as charge-offs and delinquencies continued to improve. For additional information, see Executive Summary – 2014 Economic and Business Environment on page 3.
Credit risk is the risk of loss arising from the inability or failure of a borrower or counterparty to meet its obligations. Credit risk can also arise from operational failures that result in an erroneous advance, commitment or investment of funds. We define the credit exposure to a borrower or counterparty as the loss potential arising from all product classifications including loans and leases, deposit overdrafts, derivatives, assets held-for-sale and unfunded lending commitments which include loan commitments, letters of credit and financial guarantees. Derivative positions are recorded at fair value and assets held-for-sale are recorded at either fair value or the lower of cost or fair value. Certain loans and unfunded commitments are accounted for under the fair value option. Credit risk for categories of assets carried at fair value is not accounted for as part of the allowance for credit losses but as part of the fair value adjustments recorded in earnings. For derivative positions, our credit risk is measured as the net cost in the event the counterparties with contracts in which we are in a gain position fail to perform under the terms of those contracts. We use the current fair value to represent credit exposure without giving consideration to future mark-to-market changes. The credit risk amounts take into consideration the effects of legally enforceable master netting agreements and cash collateral. Our consumer and commercial credit extension and review procedures encompass funded and unfunded credit exposures. For more information on derivatives and credit extension commitments, see Note 2 – Derivatives and Note 12 – Commitments and Contingencies to the Consolidated Financial Statements.
We manage credit risk based on the risk profile of the borrower or counterparty, repayment sources, the nature of underlying collateral, and other support given current events, conditions and expectations. We classify our portfolios as either consumer or commercial and monitor credit risk in each as discussed below.
We proactively refine our underwriting and credit management practices as well as credit standards to meet the changing economic environment. To actively mitigate losses and enhance customer support in our consumer businesses, we have in place collection programs and loan modification and customer assistance infrastructures. We utilize a number of actions to mitigate losses in the commercial businesses including increasing the frequency and intensity of portfolio monitoring, hedging activity and our practice of transferring management of deteriorating commercial exposures to independent special asset officers as credits enter criticized categories.
We have non-U.S. exposure largely in Europe and Asia Pacific. For more information on our exposures and related risks in non-U.S. countries, see Non-U.S. Portfolio on page 73 and Item 1A. Risk Factors of the Corporation's 2014 Annual Report on Form 10-K.
For more information on our credit risk management activities, see Consumer Portfolio Credit Risk Management on page 50, Commercial Portfolio Credit Risk Management on page 64, Non-U.S. Portfolio on page 73, Provision for Credit Losses on page 75 and Allowance for Credit Losses on page 75, Note 1 – Summary of Significant Accounting Principles, Note 4 – Outstanding Loans
 
and Leases and Note 5 – Allowance for Credit Losses to the Consolidated Financial Statements.
Consumer Portfolio Credit Risk Management
Credit risk management for the consumer portfolio begins with initial underwriting and continues throughout a borrower’s credit cycle. Statistical techniques in conjunction with experiential judgment are used in all aspects of portfolio management including underwriting, product pricing, risk appetite, setting credit limits, and establishing operating processes and metrics to quantify and balance risks and returns. Statistical models are built using detailed behavioral information from external sources such as credit bureaus and/or internal historical experience. These models are a component of our consumer credit risk management process and are used in part to assist in making both new and ongoing credit decisions, as well as portfolio management strategies, including authorizations and line management, collection practices and strategies, and determination of the allowance for loan and lease losses and allocated capital for credit risk.
During 2014, we completed approximately 71,600 customer loan modifications with a total unpaid principal balance of approximately $13 billion, including approximately 33,400 permanent modifications, under the U.S. government’s Making Home Affordable Program. Of the loan modifications completed in 2014, in terms of both the volume of modifications and the unpaid principal balance associated with the underlying loans, approximately half were in the Corporation’s held-for-investment (HFI) portfolio. For modified loans on our balance sheet, these modification types are generally considered troubled debt restructurings (TDRs). For more information on TDRs and portfolio impacts, see Consumer Portfolio Credit Risk Management – Nonperforming Consumer Loans, Leases and Foreclosed Properties Activity on page 62 and Note 4 – Outstanding Loans and Leases to the Consolidated Financial Statements.
Consumer Credit Portfolio
Improvement in the U.S. economy, labor markets and home prices continued during 2014 resulting in improved credit quality and lower credit losses across all consumer portfolios compared to 2013. Consumer loans 30 days or more past due and 90 days or more past due declined during 2014 across all consumer portfolios as a result of improved delinquency trends. Although home prices have shown steady improvement since the beginning of 2012, they have not fully recovered to their 2006 levels.
Improved credit quality, increased home prices and continued loan balance run-off across the consumer portfolio drove a $3.4 billion decrease in the consumer allowance for loan and lease losses in 2014 to $10.0 billion at December 31, 2014. For more information, see Allowance for Credit Losses on page 75.
In connection with the 2013 settlement with FNMA, we repurchased certain residential mortgage loans that had previously been sold to FNMA, which we have valued at less than the purchase price. As of December 31, 2014, these loans had an unpaid principal balance of $4.4 billion and a carrying value of $3.8 billion, of which $4.1 billion of unpaid principal balance and $3.5 billion of carrying value were classified as PCI loans. All of these loans are included in the Legacy Assets & Servicing portfolio in Table 27. For more information on PCI loans, see Consumer Portfolio Credit Risk Management – Purchased Credit-impaired


50     Bank of America 2014


Loan Portfolio on page 58 and Note 4 – Outstanding Loans and Leases to the Consolidated Financial Statements.
For more information on our accounting policies regarding delinquencies, nonperforming status, charge-offs and TDRs for the consumer portfolio, see Note 1 – Summary of Significant Accounting Principles to the Consolidated Financial Statements. For more information on representations and warranties related to our residential mortgage and home equity portfolios, see Off-Balance Sheet Arrangements and Contractual Obligations – Representations and Warranties on page 30 and Note 7 – Representations and Warranties Obligations and Corporate Guarantees to the Consolidated Financial Statements.
 
Table 24 presents our outstanding consumer loans and leases, and the PCI loan portfolio. In addition to being included in the “Outstandings” columns in Table 24, PCI loans are also shown separately, net of purchase accounting adjustments, in the “Purchased Credit-impaired Loan Portfolio” columns. The impact of the PCI loan portfolio on certain credit statistics is reported where appropriate. For more information on PCI loans, see Consumer Portfolio Credit Risk Management – Purchased Credit-impaired Loan Portfolio on page 58 and Note 4 – Outstanding Loans and Leases to the Consolidated Financial Statements.


Table 24
Consumer Loans and Leases


December 31
 
 
Outstandings
 
Purchased Credit-impaired Loan Portfolio
(Dollars in millions)
2014
 
2013
 
2014
 
2013
Residential mortgage (1)
$
216,197

 
$
248,066

 
$
15,152

 
$
18,672

Home equity
85,725

 
93,672

 
5,617

 
6,593

U.S. credit card
91,879

 
92,338

 
n/a

 
n/a

Non-U.S. credit card
10,465

 
11,541

 
n/a

 
n/a

Direct/Indirect consumer (2)
80,381

 
82,192

 
n/a

 
n/a

Other consumer (3)
1,846

 
1,977

 
n/a

 
n/a

Consumer loans excluding loans accounted for under the fair value option
486,493

 
529,786

 
20,769

 
25,265

Loans accounted for under the fair value option (4)
2,077

 
2,164

 
n/a

 
n/a

Total consumer loans and leases
$
488,570

 
$
531,950

 
$
20,769

 
$
25,265

(1) 
Outstandings include pay option loans of $3.2 billion and $4.4 billion at December 31, 2014 and 2013. We no longer originate pay option loans.
(2) 
Outstandings include dealer financial services loans of $37.7 billion and $38.5 billion, unsecured consumer lending loans of $1.5 billion and $2.7 billion, U.S. securities-based lending loans of $35.8 billion and $31.2 billion, non-U.S. consumer loans of $4.0 billion and $4.7 billion, student loans of $632 million and $4.1 billion and other consumer loans of $761 million and $1.0 billion at December 31, 2014 and 2013.
(3) 
Outstandings include consumer finance loans of $676 million and $1.2 billion, consumer leases of $1.0 billion and $606 million, consumer overdrafts of $162 million and $176 million and other non-U.S. consumer loans of $3 million and $5 million at December 31, 2014 and 2013.
(4) 
Consumer loans accounted for under the fair value option include residential mortgage loans of $1.9 billion and $2.0 billion and home equity loans of $196 million and $147 million at December 31, 2014 and 2013. For more information on the fair value option, see Consumer Portfolio Credit Risk Management – Consumer Loans Accounted for Under the Fair Value Option on page 62 and Note 21 – Fair Value Option to the Consolidated Financial Statements.
n/a = not applicable


Bank of America 2014     51


Table 25 presents consumer nonperforming loans and accruing consumer loans past due 90 days or more. Nonperforming loans do not include past due consumer credit card loans, other unsecured loans and in general, consumer non-real estate-secured loans (loans discharged in Chapter 7 bankruptcy are included) as these loans are typically charged off no later than the end of the month in which the loan becomes 180 days past due. Real estate-secured past due consumer loans that are insured by the FHA or individually insured under long-term standby agreements with
 
FNMA and FHLMC (collectively, the fully-insured loan portfolio) are reported as accruing as opposed to nonperforming since the principal repayment is insured. Fully-insured loans included in accruing past due 90 days or more are primarily from our repurchases of delinquent FHA loans pursuant to our servicing agreements with GNMA. Additionally, nonperforming loans and accruing balances past due 90 days or more do not include the PCI loan portfolio or loans accounted for under the fair value option even though the customer may be contractually past due.


Table 25
Consumer Credit Quality


December 31
 
Nonperforming
 
Accruing Past Due
90 Days or More
(Dollars in millions)
2014
 
2013
 
2014
 
2013
Residential mortgage (1)
$
6,889

 
$
11,712

 
$
11,407

 
$
16,961

Home equity 
3,901

 
4,075


U.S. credit card
n/a

 
n/a

 
866

 
1,053

Non-U.S. credit card
n/a

 
n/a

 
95

 
131

Direct/Indirect consumer
28

 
35

 
64

 
408

Other consumer
1

 
18

 
1

 
2

Total (2)
$
10,819

 
$
15,840

 
$
12,433

 
$
18,555

Consumer loans and leases as a percentage of outstanding consumer loans and leases (2)
2.22
%
 
2.99
%
 
2.56
%
 
3.50
%
Consumer loans and leases as a percentage of outstanding loans and leases, excluding PCI and fully-insured loan portfolios (2)
2.70

 
3.80

 
0.26

 
0.38

(1) 
Residential mortgage loans accruing past due 90 days or more are fully-insured loans. At December 31, 2014 and 2013, residential mortgage included $7.3 billion and $13.0 billion of loans on which interest has been curtailed by the FHA, and therefore are no longer accruing interest, although principal is still insured, and $4.1 billion and $4.0 billion of loans on which interest was still accruing.
(2) 
Balances exclude consumer loans accounted for under the fair value option. At December 31, 2014 and 2013, $392 million and $445 million of loans accounted for under the fair value option were past due 90 days or more and not accruing interest.
n/a = not applicable
Table 26 presents net charge-offs and related ratios for consumer loans and leases.


Table 26
Consumer Net Charge-offs and Related Ratios


Net Charge-offs (1)
 
Net Charge-off Ratios (1, 2)
(Dollars in millions)
2014
 
2013
 
2014
 
2013
Residential mortgage
$
(114
)
 
$
1,084

 
(0.05
)%
 
0.42
%
Home equity
907

 
1,803

 
1.01

 
1.80

U.S. credit card
2,638

 
3,376

 
2.96

 
3.74

Non-U.S. credit card
242

 
399

 
2.10

 
3.68

Direct/Indirect consumer
169

 
345

 
0.20

 
0.42

Other consumer
229

 
234

 
11.27

 
12.96

Total
$
4,071

 
$
7,241

 
0.80

 
1.34

(1) 
Net charge-offs exclude write-offs in the PCI loan portfolio of $545 million in residential mortgage and $265 million in home equity in 2014 compared to $1.1 billion in residential mortgage and $1.2 billion in home equity in 2013. These write-offs decreased the PCI valuation allowance included as part of the allowance for loan and lease losses. For more information on PCI write-offs, see Consumer Portfolio Credit Risk Management – Purchased Credit-impaired Loan Portfolio on page 58.
(2) 
Net charge-off ratios are calculated as net charge-offs divided by average outstanding loans and leases excluding loans accounted for under the fair value option.
Net charge-off ratios, excluding the PCI and fully-insured loan portfolios, were (0.08) percent and 0.74 percent for residential mortgage, 1.09 percent and 1.94 percent for home equity and 1.00 percent and 1.71 percent for the total consumer portfolio for 2014 and 2013, respectively. These are the only product classifications that include PCI and fully-insured loans.
Net charge-offs exclude write-offs in the PCI loan portfolio of $545 million and $1.1 billion in residential mortgage and $265 million and $1.2 billion in home equity for 2014 and 2013,
 
respectively. These write-offs decreased the PCI valuation allowance included as part of the allowance for loan and lease losses. Net charge-off ratios including the PCI write-offs were 0.18 percent and 0.85 percent for residential mortgage and 1.31 percent and 3.05 percent for home equity in 2014 and 2013, respectively. For more information on PCI write-offs, see Consumer Portfolio Credit Risk Management – Purchased Credit-impaired Loan Portfolio on page 58.


52     Bank of America 2014


Table 27 presents outstandings, nonperforming balances, net charge-offs, allowance for loan and lease losses and provision for loan and lease losses for the Core portfolio and the Legacy Assets & Servicing portfolio within the consumer real estate portfolio. For more information on the Legacy Assets & Servicing portfolio, see LAS on page 25.


Table 27
Consumer Real Estate Portfolio (1, 2)


December 31


Outstandings
 
Nonperforming
 
Net Charge-offs (3)
(Dollars in millions)
2014
 
2013
 
2014
 
2013
 
2014
 
2013
Core portfolio


Residential mortgage
$
162,220

 
$
177,336

 
$
2,398

 
$
3,316

 
$
140

 
$
274

Home equity
51,887

 
54,499

 
1,496

 
1,431

 
275

 
439

Total Core portfolio
214,107

 
231,835

 
3,894

 
4,747

 
415

 
713

Legacy Assets & Servicing portfolio


Residential mortgage
53,977

 
70,730

 
4,491

 
8,396

 
(254
)
 
810

Home equity
33,838

 
39,173

 
2,405

 
2,644

 
632

 
1,364

Total Legacy Assets & Servicing portfolio
87,815

 
109,903

 
6,896

 
11,040

 
378

 
2,174

Consumer real estate portfolio


Residential mortgage
216,197

 
248,066

 
6,889

 
11,712

 
(114
)
 
1,084

Home equity
85,725

 
93,672

 
3,901

 
4,075

 
907

 
1,803

Total consumer real estate portfolio
$
301,922

 
$
341,738

 
$
10,790

 
$
15,787

 
$
793

 
$
2,887


December 31


Allowance for Loan
and Lease Losses
 
Provision for Loan
and Lease Losses


2014
 
2013
 
2014
 
2013
Core portfolio


Residential mortgage


$
593

 
$
728

 
$
(47
)
 
$
166

Home equity


702

 
965

 
3

 
119

Total Core portfolio


1,295

 
1,693

 
(44
)
 
285

Legacy Assets & Servicing portfolio


Residential mortgage


2,307

 
3,356

 
(696
)
 
(979
)
Home equity


2,333

 
3,469

 
(236
)
 
(430
)
Total Legacy Assets & Servicing portfolio


4,640

 
6,825

 
(932
)
 
(1,409
)
Consumer real estate portfolio


Residential mortgage


2,900

 
4,084

 
(743
)
 
(813
)
Home equity


3,035

 
4,434

 
(233
)
 
(311
)
Total consumer real estate portfolio


$
5,935

 
$
8,518

 
$
(976
)
 
$
(1,124
)
(1) 
Formerly referred to as the Home Loans portfolio.
(2) 
Outstandings and nonperforming amounts exclude loans accounted for under the fair value option. Consumer loans accounted for under the fair value option include residential mortgage loans of $1.9 billion and $2.0 billion and home equity loans of $196 million and $147 million at December 31, 2014 and 2013. For more information on the fair value option, see Consumer Portfolio Credit Risk Management – Consumer Loans Accounted for Under the Fair Value Option on page 62 and Note 21 – Fair Value Option to the Consolidated Financial Statements.
(3) 
Net charge-offs exclude write-offs in the PCI loan portfolio of $545 million in residential mortgage and $265 million in home equity in 2014, which are included in the Legacy Assets & Servicing portfolio, compared to $1.1 billion in residential mortgage and $1.2 billion in home equity in 2013. Write-offs in the PCI loan portfolio decrease the PCI valuation allowance included as part of the allowance for loan and lease losses. For more information on PCI write-offs, see Consumer Portfolio Credit Risk Management – Purchased Credit-impaired Loan Portfolio on page 58.
We believe that the presentation of information adjusted to exclude the impact of the PCI loan portfolio, the fully-insured loan portfolio and loans accounted for under the fair value option is more representative of the ongoing operations and credit quality of the business. As a result, in the following discussions of the residential mortgage and home equity portfolios, we provide information that excludes the impact of the PCI loan portfolio, the fully-insured loan portfolio and loans accounted for under the fair value option in certain credit quality statistics. We separately disclose information on the PCI loan portfolio on page 58.
Residential Mortgage
The residential mortgage portfolio makes up the largest percentage of our consumer loan portfolio at 44 percent of consumer loans and leases at December 31, 2014. Approximately 24 percent of the residential mortgage portfolio is in GWIM and represents residential mortgages that are originated for the home purchase and refinancing needs of our wealth management clients. The remaining portion of the portfolio is primarily in All
 
Other and is comprised of originated loans, purchased loans used in our overall ALM activities, delinquent FHA loans repurchased pursuant to our servicing agreements with GNMA as well as loans repurchased related to our representations and warranties.
Outstanding balances in the residential mortgage portfolio, excluding loans accounted for under the fair value option, decreased $31.9 billion during 2014 due to paydowns, sales, charge-offs and transfers to foreclosed properties. Of the decline, more than 50 percent was due to the sale of $10.7 billion of loans with standby insurance agreements and $6.7 billion of nonperforming and other delinquent loan sales. These were partially offset by new origination volume retained on our balance sheet, as well as repurchases of delinquent loans pursuant to our servicing agreements with GNMA, which are part of our mortgage banking activities.
At December 31, 2014 and 2013, the residential mortgage portfolio included $65.0 billion and $87.2 billion of outstanding fully-insured loans. On this portion of the residential mortgage portfolio, we are protected against principal loss as a result of either FHA insurance or long-term standby agreements with FNMA


Bank of America 2014     53


and FHLMC. At December 31, 2014 and 2013, $47.8 billion and $59.0 billion had FHA insurance with the remainder protected by long-term standby agreements. At December 31, 2014 and 2013, $15.9 billion and $22.5 billion of the FHA-insured loan population were repurchases of delinquent FHA loans pursuant to our servicing agreements with GNMA. All of these loans are individually insured and therefore the Corporation does not record a significant allowance for loan and lease losses with respect to these loans.
The long-term standby agreements with FNMA and FHLMC reduce our regulatory risk-weighted assets due to the transfer of a portion of our credit risk to unaffiliated parties. At December 31, 2014, these programs had the cumulative effect of reducing our risk-weighted assets by $5.2 billion, increasing both our Tier 1 capital ratio and Common equity tier 1 capital ratio by five bps under the Basel 3 Standardized Transition. This compared to reducing our risk-weighted assets by $8.4 billion, increasing our Tier 1 capital ratio by eight bps and increasing our Tier 1 common capital ratio by seven bps at December 31, 2013 under Basel 1 (which included the Market Risk Final Rules).
In addition to the long-term standby agreements with FNMA and FHLMC, we have mitigated a portion of our credit risk on the residential mortgage portfolio through the use of synthetic securitization vehicles. These vehicles issue long-term notes to investors, the proceeds of which are held as cash collateral. We pay a premium to the vehicles to purchase mezzanine loss protection on a portfolio of residential mortgage loans HFI. Cash held in the vehicles is used to reimburse us in the event that losses on the mortgage portfolio exceed 10 bps of the original pool balance, up to the remaining amount of purchased loss protection
 
of $270 million and $339 million at December 31, 2014 and 2013. Amounts due from the vehicles are recorded in other income (loss) in the Consolidated Statement of Income when we recognize a reimbursable loss. Amounts are collected when reimbursable losses are realized through the sale of the underlying collateral. At December 31, 2014 and 2013, the synthetic securitization vehicles referenced principal balances of $7.0 billion and $12.5 billion of residential mortgage loans and we had a receivable of $146 million and $198 million from these vehicles for reimbursement of losses. We record an allowance for loan and lease losses on loans referenced by the synthetic securitization vehicles without regard to the existence of the purchased loss protection as the protection does not represent a guarantee of individual loans. The reported net charge-offs for the residential mortgage portfolio do not include the benefit of amounts reimbursable from these vehicles.
Table 28 presents certain residential mortgage key credit statistics on both a reported basis excluding loans accounted for under the fair value option, and excluding the PCI loan portfolio, our fully-insured loan portfolio and loans accounted for under the fair value option. Additionally, in the “Reported Basis” columns in the table below, accruing balances past due and nonperforming loans do not include the PCI loan portfolio, in accordance with our accounting policies, even though the customer may be contractually past due. As such, the following discussion presents the residential mortgage portfolio excluding the PCI loan portfolio, the fully-insured loan portfolio and loans accounted for under the fair value option. For more information on the PCI loan portfolio, see page 58.


Table 28
Residential Mortgage – Key Credit Statistics


December 31
 
 
Reported Basis (1)
 
Excluding Purchased
Credit-impaired and
Fully-insured Loans
(Dollars in millions)
2014
 
2013
 
2014
 
2013
Outstandings
$
216,197

 
$
248,066

 
$
136,075

 
$
142,147

Accruing past due 30 days or more
16,485

 
23,052

 
1,868

 
2,371

Accruing past due 90 days or more
11,407

 
16,961


Nonperforming loans
6,889

 
11,712

 
6,889

 
11,712

Percent of portfolio


Refreshed LTV greater than 90 but less than or equal to 100 (2)
9
 %
 
11
%
 
6
 %
 
8
%
Refreshed LTV greater than 100 (2)
12

 
17

 
7

 
11

Refreshed FICO below 620
16

 
20

 
8

 
11

2006 and 2007 vintages (3)
19

 
21

 
22

 
27

Net charge-off ratio (4)
(0.05
)
 
0.42

 
(0.08
)
 
0.74

(1) 
Outstandings, accruing past due, nonperforming loans and percentages of portfolio exclude loans accounted for under the fair value option. There were $1.9 billion and $2.0 billion of residential mortgage loans accounted for under the fair value option at December 31, 2014 and 2013. For more information on the fair value option, see Consumer Portfolio Credit Risk Management – Consumer Loans Accounted for Under the Fair Value Option on page 62 and Note 21 – Fair Value Option to the Consolidated Financial Statements.
(2) 
Effective December 31, 2014, with the exception of high-value properties, underlying values for LTV ratios are primarily determined using automated valuation models. For high-value properties, generally with an original value of $1 million or more, estimated property values are determined using the CoreLogic Case-Shiller Index. Prior-period values have been updated to reflect this change. Previously reported values were primarily determined through an index-based approach.
(3) 
These vintages of loans account for $2.8 billion, or 41 percent, and $6.2 billion, or 53 percent, of nonperforming residential mortgage loans at December 31, 2014 and 2013. Additionally, these vintages contributed net recoveries of $233 million to residential mortgage net recoveries in 2014 and $653 million, or 60 percent, of total residential mortgage net charge-offs in 2013.
(4) 
Net charge-off ratios are calculated as net charge-offs divided by average outstanding loans excluding loans accounted for under the fair value option.
Nonperforming residential mortgage loans decreased $4.8 billion in 2014 as sales of $4.1 billion, paydowns, returns to performing status, charge-offs, and transfers to foreclosed properties and held-for-sale outpaced new inflows. Of the nonperforming residential mortgage loans at December 31, 2014, $1.8 billion, or 26 percent were current on contractual payments. Nonperforming loans that are contractually current primarily consist of collateral-dependent TDRs, including those that have
 
been discharged in Chapter 7 bankruptcy, as well as loans that have not yet demonstrated a sustained period of payment performance. In addition, $3.8 billion, or 55 percent of nonperforming residential mortgage loans were 180 days or more past due and had been written down to the estimated fair value of the collateral, less costs to sell. Accruing loans past due 30 days or more decreased $503 million in 2014.


54     Bank of America 2014


Net charge-offs decreased $1.2 billion to a net recovery of $114 million in 2014, or (0.08) percent of total average residential mortgage loans, compared to net charge-offs of $1.1 billion, or 0.74 percent, in 2013. This decrease in net charge-offs was primarily driven by favorable portfolio trends and decreased write-downs on loans greater than 180 days past due, which were written down to the estimated fair value of the collateral, less costs to sell, due in part to improvement in home prices and the U.S. economy. In addition, net charge-offs declined due to the impact of recoveries of $407 million related to nonperforming loan sales in 2014.
Residential mortgage loans with a greater than 90 percent but less than or equal to 100 percent refreshed loan-to-value (LTV) represented six percent and eight percent of the residential mortgage portfolio at December 31, 2014 and 2013. Loans with a refreshed LTV greater than 100 percent represented seven percent and 11 percent of the residential mortgage loan portfolio at December 31, 2014 and 2013. Of the loans with a refreshed LTV greater than 100 percent, 96 percent and 95 percent were performing at December 31, 2014 and 2013. Loans with a refreshed LTV greater than 100 percent reflect loans where the outstanding carrying value of the loan is greater than the most recent valuation of the property securing the loan. The majority of these loans have a refreshed LTV greater than 100 percent primarily due to home price deterioration since 2006, somewhat mitigated by subsequent appreciation. Loans to borrowers with refreshed FICO scores below 620 represented eight percent and 11 percent of the residential mortgage portfolio at December 31, 2014 and 2013.
Of the $136.1 billion in total residential mortgage loans outstanding at December 31, 2014, as shown in Table 29, 39 percent were originated as interest-only loans. The outstanding balance of interest-only residential mortgage loans that have entered the amortization period was $12.5 billion, or 23 percent
 
at December 31, 2014. Residential mortgage loans that have entered the amortization period generally have experienced a higher rate of early stage delinquencies and nonperforming status compared to the residential mortgage portfolio as a whole. At December 31, 2014, $256 million, or two percent of outstanding interest-only residential mortgages that had entered the amortization period were accruing past due 30 days or more compared to $1.9 billion, or one percent for the entire residential mortgage portfolio. In addition, at December 31, 2014, $862 million, or seven percent of outstanding interest-only residential mortgages that had entered the amortization period were nonperforming, of which $441 million were contractually current, compared to $6.9 billion, or five percent for the entire residential mortgage portfolio, of which $1.8 billion were contractually current. Loans in our interest-only residential mortgage portfolio have an interest-only period of three to ten years and more than 90 percent of these loans that have yet to enter the amortization period will not be required to make a fully-amortizing payment until 2016 or later.
Table 29 presents outstandings, nonperforming loans and net charge-offs by certain state concentrations for the residential mortgage portfolio. The Los Angeles-Long Beach-Santa Ana Metropolitan Statistical Area (MSA) within California represented 13 percent of outstandings at both December 31, 2014 and 2013. In 2014, loans within this MSA contributed net recoveries of $81 million within the residential mortgage portfolio. In 2013, loans within this MSA contributed three percent of net charge-offs within the residential mortgage portfolio. In the New York area, the New York-Northern New Jersey-Long Island MSA made up 11 percent and 10 percent of outstandings at December 31, 2014 and 2013. In 2014, loans within this MSA contributed net charge-offs of $27 million within the residential mortgage portfolio. In 2013, loans within this MSA contributed 11 percent of net charge-offs within the residential mortgage portfolio.


Table 29
Residential Mortgage State Concentrations


December 31


Outstandings (1)
 
Nonperforming (1)
 
Net Charge-offs (2)
(Dollars in millions)
2014
 
2013
 
2014
 
2013
 
2014
 
2013
California
$
45,496

 
$
47,885

 
$
1,459

 
$
3,396

 
$
(280
)
 
$
148

New York (3)
11,826

 
11,787

 
477

 
789

 
15

 
59

Florida (3)
10,116

 
10,777

 
858

 
1,359

 
(43
)
 
117

Texas
6,635

 
6,766

 
269

 
407

 
1

 
25

Virginia
4,402

 
4,774

 
244

 
369

 
4

 
31

Other U.S./Non-U.S.
57,600

 
60,158

 
3,582

 
5,392

 
189

 
704

Residential mortgage loans (4)
$
136,075

 
$
142,147

 
$
6,889

 
$
11,712

 
$
(114
)
 
$
1,084

Fully-insured loan portfolio
64,970

 
87,247


Purchased credit-impaired residential mortgage loan portfolio
15,152

 
18,672


Total residential mortgage loan portfolio
$
216,197

 
$
248,066


(1) 
Outstandings and nonperforming amounts exclude loans accounted for under the fair value option. There were $1.9 billion and $2.0 billion of residential mortgage loans accounted for under the fair value option at December 31, 2014 and 2013. For more information on the fair value option, see Consumer Portfolio Credit Risk Management – Consumer Loans Accounted for Under the Fair Value Option on page 62 and Note 21 – Fair Value Option to the Consolidated Financial Statements.
(2) 
Net charge-offs exclude $545 million of write-offs in the residential mortgage PCI loan portfolio in 2014 compared to $1.1 billion in 2013. These write-offs decreased the PCI valuation allowance included as part of the allowance for loan and lease losses. For more information on PCI write-offs, see Consumer Portfolio Credit Risk Management – Purchased Credit-impaired Loan Portfolio on page 58.
(3) 
In these states, foreclosure requires a court order following a legal proceeding (judicial states).
(4) 
Amount excludes the PCI residential mortgage and fully-insured loan portfolios.


Bank of America 2014     55


The Community Reinvestment Act (CRA) encourages banks to meet the credit needs of their communities for housing and other purposes, particularly in neighborhoods with low or moderate incomes. Our CRA portfolio was $9.0 billion and $10.3 billion at December 31, 2014 and 2013, or seven percent of the residential mortgage portfolio, at both December 31, 2014 and 2013. The CRA portfolio included $986 million and $1.7 billion of nonperforming loans at December 31, 2014 and 2013, representing 14 percent of total nonperforming residential mortgage loans, at both December 31, 2014 and 2013. Net charge-offs in the CRA portfolio were $52 million compared to net recoveries of $114 million for the residential mortgage portfolio in 2014 and $260 million of the $1.1 billion total net charge-offs for the residential mortgage portfolio in 2013.

Home Equity
At December 31, 2014, the home equity portfolio made up 18 percent of the consumer portfolio and is comprised of HELOCs, home equity loans and reverse mortgages.
At December 31, 2014, our HELOC portfolio had an outstanding balance of $74.2 billion, or 87 percent of the total home equity portfolio compared to $80.3 billion, or 86 percent, at December 31, 2013. HELOCs generally have an initial draw period of 10 years. During the initial draw period, the borrowers are only required to pay the interest due on the loans on a monthly basis. After the initial draw period ends, the loans generally convert to 15-year amortizing loans.
At December 31, 2014, our home equity loan portfolio had an outstanding balance of $9.8 billion, or 11 percent of the total home equity portfolio compared to $12.0 billion, or 13 percent, at December 31, 2013. Home equity loans are almost all fixed-rate loans with amortizing payment terms of 10 to 30 years and of the $9.8 billion at December 31, 2014, 53 percent have 25- to 30-year terms. At December 31, 2014, our reverse mortgage portfolio had an outstanding balance, excluding loans accounted for under the fair value option, of $1.7 billion, or two percent of the total
 
home equity portfolio compared to $1.4 billion, or one percent, at December 31, 2013. We no longer originate reverse mortgages.
At December 31, 2014, approximately 53 percent of the home equity portfolio was included in Consumer Banking, 37 percent was included in LAS and the remainder of the portfolio was primarily in GWIM. Outstanding balances in the home equity portfolio, excluding loans accounted for under the fair value option, decreased $7.9 billion in 2014 primarily due to paydowns and charge-offs outpacing new originations and draws on existing lines. Of the total home equity portfolio at December 31, 2014 and 2013, $20.6 billion and $20.7 billion, or 24 percent and 22 percent, were in first-lien positions (26 percent and 24 percent excluding the PCI home equity portfolio). At December 31, 2014, outstanding balances in the home equity portfolio that were in a second-lien or more junior-lien position and where we also held the first-lien loan totaled $15.4 billion, or 19 percent of our total home equity portfolio excluding the PCI loan portfolio.
Unused HELOCs totaled $53.7 billion and $56.8 billion at December 31, 2014 and 2013. The decrease was primarily due to customers choosing to close accounts, which more than offset customer paydowns of principal balances, as well as the impact of new production. The HELOC utilization rate was 58 percent and 59 percent at December 31, 2014 and 2013.
Table 30 presents certain home equity portfolio key credit statistics on both a reported basis excluding loans accounted for under the fair value option, and excluding the PCI loan portfolio and loans accounted for under the fair value option. Additionally, in the “Reported Basis” columns in the table below, accruing balances past due 30 days or more and nonperforming loans do not include the PCI loan portfolio, in accordance with our accounting policies, even though the customer may be contractually past due. As such, the following discussion presents the home equity portfolio excluding the PCI loan portfolio and loans accounted for under the fair value option. For more information on the PCI loan portfolio, see page 58.


Table 30
Home Equity – Key Credit Statistics


December 31
 
 
Reported Basis (1)
 
Excluding Purchased
Credit-impaired Loans
(Dollars in millions)
2014
 
2013
 
2014
 
2013
Outstandings
$
85,725

 
$
93,672

 
$
80,108

 
$
87,079

Accruing past due 30 days or more (2)
640

 
901

 
640

 
901

Nonperforming loans (2)
3,901

 
4,075

 
3,901

 
4,075

Percent of portfolio


Refreshed CLTV greater than 90 but less than or equal to 100 (3)
8
%
 
9
%
 
7
%
 
8
%
Refreshed CLTV greater than 100 (3)
16

 
23

 
14

 
21

Refreshed FICO below 620
8

 
8

 
7

 
8

2006 and 2007 vintages (4)
46

 
48

 
43

 
45

Net charge-off ratio (5)
1.01

 
1.80

 
1.09

 
1.94

(1) 
Outstandings, accruing past due, nonperforming loans and percentages of the portfolio exclude loans accounted for under the fair value option. There were $196 million and $147 million of home equity loans accounted for under the fair value option at December 31, 2014 and 2013. For more information on the fair value option, see Consumer Portfolio Credit Risk Management – Consumer Loans Accounted for Under the Fair Value Option on page 62 and Note 21 – Fair Value Option to the Consolidated Financial Statements.
(2) 
Accruing past due 30 days or more includes $98 million and $131 million and nonperforming loans includes $505 million and $582 million of loans where we serviced the underlying first-lien at December 31, 2014 and 2013.
(3) 
Effective December 31, 2014, with the exception of high-value properties, underlying values for LTV ratios are primarily determined using automated valuation models. For high-value properties, generally with an original value of $1 million or more, estimated property values are determined using the CoreLogic Case-Shiller Index. Prior-period values have been updated to reflect this change. Previously reported values were primarily determined through an index-based approach.
(4) 
These vintages of loans have higher refreshed combined LTV ratios and accounted for 47 percent and 50 percent of nonperforming home equity loans at December 31, 2014 and 2013, and 59 percent and 63 percent of net charge-offs in 2014 and 2013.
(5) 
Net charge-off ratios are calculated as net charge-offs divided by average outstanding loans excluding loans accounted for under the fair value option.

56     Bank of America 2014


Nonperforming outstanding balances in the home equity portfolio decreased $174 million in 2014 primarily due to enhanced identification of the delinquency status on first-lien loans serviced by other financial institutions. This was partially offset by an increase in contractually current nonperforming loans where the loan has been modified in a TDR. Of the nonperforming home equity portfolio at December 31, 2014, $1.8 billion, or 45 percent, were current on contractual payments. Nonperforming loans that are contractually current primarily consist of collateral-dependent TDRs, including those that have been discharged in Chapter 7 bankruptcy, junior-lien loans where the underlying first is 90 days or more past due, as well as loans that have not yet demonstrated a sustained period of payment performance. In addition, $1.4 billion, or 37 percent of nonperforming home equity loans, were 180 days or more past due and had been written down to the estimated fair value of the collateral, less costs to sell. Outstanding balances accruing past due 30 days or more decreased $261 million in 2014.
In some cases, the junior-lien home equity outstanding balance that we hold is performing, but the underlying first-lien is not. For outstanding balances in the home equity portfolio on which we service the first-lien loan, we are able to track whether the first-lien loan is in default. For loans where the first-lien is serviced by a third party, we utilize credit bureau data to estimate the delinquency status of the first-lien. Given that the credit bureau database we use does not include a property address for the mortgages, we are unable to identify with certainty whether a reported delinquent first-lien mortgage pertains to the same property for which we hold a junior-lien loan. We also utilize a third-party vendor to combine credit bureau and public record data to better link a junior-lien loan with the underlying first-lien mortgage. At December 31, 2014, we estimate that $1.7 billion of current and $217 million of 30 to 89 days past due junior-lien loans were behind a delinquent first-lien loan. We service the first-lien loans on $279 million of these combined amounts, with the remaining $1.6 billion serviced by third parties. Of the $1.9 billion of current to 89 days past due junior-lien loans, based on available credit bureau data and our own internal servicing data, we estimate that $800 million had first-lien loans that were 90 days or more past due.
Net charge-offs decreased $896 million to $907 million, or 1.09 percent of the total average home equity portfolio in 2014, compared to $1.8 billion, or 1.94 percent, in 2013. The decrease in net charge-offs was primarily driven by favorable portfolio trends due in part to improvement in home prices and the U.S. economy. The net charge-off ratios for 2014 and 2013 were also impacted by lower outstanding balances primarily as a result of paydowns and charge-offs outpacing new originations and draws on existing lines.
Outstanding balances in the home equity portfolio with greater than 90 percent but less than or equal to 100 percent refreshed combined loan-to-value (CLTVs) comprised seven percent and eight percent of the home equity portfolio at December 31, 2014 and 2013. Outstanding balances with refreshed CLTVs greater than
 
100 percent comprised 14 percent and 21 percent of the home equity portfolio at December 31, 2014 and 2013. Outstanding balances in the home equity portfolio with a refreshed CLTV greater than 100 percent reflect loans where the carrying value and available line of credit of the combined loans are equal to or greater than the most recent valuation of the property securing the loan. Depending on the value of the property, there may be collateral in excess of the first-lien that is available to reduce the severity of loss on the second-lien. Home price deterioration since 2006, partially mitigated by subsequent appreciation, has contributed to an increase in CLTV ratios. Of those outstanding balances with a refreshed CLTV greater than 100 percent, 97 percent of the customers were current on their home equity loan and 93 percent of second-lien loans with a refreshed CLTV greater than 100 percent were current on both their second-lien and underlying first-lien loans at December 31, 2014. Outstanding balances in the home equity portfolio to borrowers with a refreshed FICO score below 620 represented seven percent and eight percent of the home equity portfolio at December 31, 2014 and 2013.
Of the $80.1 billion in total home equity portfolio outstandings at December 31, 2014, as shown in Table 31, 75 percent were interest-only loans, almost all of which were HELOCs. The outstanding balance of HELOCs that have entered the amortization period was $5.3 billion, or seven percent of total HELOCs at December 31, 2014. The HELOCs that have entered the amortization period have experienced a higher percentage of early stage delinquencies and nonperforming status when compared to the HELOC portfolio as a whole. At December 31, 2014, $135 million, or three percent of outstanding HELOCs that had entered the amortization period were accruing past due 30 days or more compared to $581 million, or one percent for the entire HELOC portfolio. In addition, at December 31, 2014, $817 million, or 15 percent of outstanding HELOCs that had entered the amortization period were nonperforming, of which $373 million were contractually current, compared to $3.5 billion, or five percent for the entire HELOC portfolio, of which $1.5 billion were contractually current. Loans in our HELOC portfolio generally have an initial draw period of 10 years and more than 75 percent of these loans that have yet to enter the amortization period will not be required to make a fully-amortizing payment until 2016 or later. We communicate to contractually current customers more than a year prior to the end of their draw period to inform them of the potential change to the payment structure before entering the amortization period, and provide payment options to customers prior to the end of the draw period.
Although we do not actively track how many of our home equity customers pay only the minimum amount due on their home equity loans and lines, we can infer some of this information through a review of our HELOC portfolio that we service and that is still in its revolving period (i.e., customers may draw on and repay their line of credit, but are generally only required to pay interest on a monthly basis). During 2014, approximately 41 percent of these customers with an outstanding balance did not pay any principal on their HELOCs.


Bank of America 2014     57


Table 31 presents outstandings, nonperforming balances and net charge-offs by certain state concentrations for the home equity portfolio. In the New York area, the New York-Northern New Jersey-Long Island MSA made up 12 percent of the outstanding home equity portfolio at both December 31, 2014 and 2013. Loans within this MSA contributed 14 percent and nine percent of net
 
charge-offs in 2014 and 2013 within the home equity portfolio. The Los Angeles-Long Beach-Santa Ana MSA within California made up 12 percent of the outstanding home equity portfolio at both December 31, 2014 and 2013. Loans within this MSA contributed four percent and nine percent of net charge-offs in 2014 and 2013 within the home equity portfolio.


Table 31
Home Equity State Concentrations


December 31


Outstandings (1)
 
Nonperforming (1)
 
Net Charge-offs (2)
(Dollars in millions)
2014
 
2013
 
2014
 
2013
 
2014
 
2013
California
$
23,250

 
$
25,061

 
$
1,012

 
$
1,047

 
$
118

 
$
509

Florida (3)
9,633

 
10,604

 
574

 
643

 
170

 
315

New Jersey (3)
5,883

 
6,153

 
299

 
304

 
68

 
93

New York (3)
5,671

 
6,035

 
387

 
405

 
81

 
110

Massachusetts
3,655

 
3,881

 
148

 
144

 
30

 
42

Other U.S./Non-U.S.
32,016

 
35,345

 
1,481

 
1,532

 
440

 
734

Home equity loans (4)
$
80,108

 
$
87,079

 
$
3,901

 
$
4,075

 
$
907

 
$
1,803

Purchased credit-impaired home equity portfolio
5,617

 
6,593


Total home equity loan portfolio
$
85,725

 
$
93,672


(1) 
Outstandings and nonperforming amounts exclude loans accounted for under the fair value option. There were $196 million and $147 million of home equity loans accounted for under the fair value option at December 31, 2014 and 2013. For more information on the fair value option, see Consumer Portfolio Credit Risk Management – Consumer Loans Accounted for Under the Fair Value Option on page 62 and Note 21 – Fair Value Option to the Consolidated Financial Statements.
(2) 
Net charge-offs exclude $265 million of write-offs in the home equity PCI loan portfolio in 2014 compared to $1.2 billion in 2013. These write-offs decreased the PCI valuation allowance included as part of the allowance for loan and lease losses. For more information on PCI write-offs, see Consumer Portfolio Credit Risk Management – Purchased Credit-impaired Loan Portfolio on page 58.
(3) 
In these states, foreclosure requires a court order following a legal proceeding (judicial states).
(4) 
Amount excludes the PCI home equity portfolio.
Purchased Credit-impaired Loan Portfolio
Loans acquired with evidence of credit quality deterioration since origination and for which it is probable at purchase that we will be unable to collect all contractually required payments are accounted for under the accounting guidance for PCI loans, which addresses accounting for differences between contractual and expected cash flows to be collected from the purchaser’s initial investment in loans if those differences are attributable, at least in part, to credit quality. For more information on PCI loans, see Note 1 – Summary of Significant Accounting Principles to the Consolidated Financial Statements.
 
As of December 31, 2014, loans repurchased in connection with the settlement with FNMA had an unpaid principal balance of $4.4 billion and a carrying value of $3.8 billion, of which $4.1 billion of unpaid principal balance and $3.5 billion of carrying value were classified as PCI loans. For additional information, see Note 7 – Representations and Warranties Obligations and Corporate Guarantees to the Consolidated Financial Statements.
Table 32 presents the unpaid principal balance, carrying value, related valuation allowance and the net carrying value as a percentage of the unpaid principal balance for the PCI loan portfolio.


Table 32
Purchased Credit-impaired Loan Portfolio


December 31, 2014
(Dollars in millions)
Unpaid
Principal
Balance
 
Carrying
Value
 
Related
Valuation
Allowance
 
Carrying
Value Net of
Valuation
Allowance
 
Percent of Unpaid
Principal
Balance
Residential mortgage
$
15,726

 
$
15,152

 
$
880

 
$
14,272

 
90.75
%
Home equity
5,605

 
5,617

 
772

 
4,845

 
86.44

Total purchased credit-impaired loan portfolio
$
21,331

 
$
20,769

 
$
1,652

 
$
19,117

 
89.62


December 31, 2013
Residential mortgage
$
19,558

 
$
18,672

 
$
1,446

 
$
17,226

 
88.08
%
Home equity
6,523

 
6,593

 
1,047

 
5,546

 
85.02

Total purchased credit-impaired loan portfolio
$
26,081

 
$
25,265

 
$
2,493

 
$
22,772

 
87.31

The total PCI unpaid principal balance decreased $4.8 billion, or 18 percent, in 2014 primarily driven by sales, payoffs, paydowns and write-offs. During 2014, we sold PCI loans with a carrying value of $1.9 billion compared to sales of $1.3 billion in 2013.
Of the unpaid principal balance of $21.3 billion at December 31, 2014, $17.0 billion, or 80 percent, was current
 
based on the contractual terms, $1.5 billion, or seven percent, was in early stage delinquency, and $2.2 billion was 180 days or more past due, including $2.1 billion of first-lien mortgages and $94 million of home equity loans.


58     Bank of America 2014


During 2014, we recorded a provision benefit of $31 million for the PCI loan portfolio including $21 million for residential mortgage and $10 million for home equity. This compared to a total provision benefit of $707 million in 2013. The provision benefit in 2014 was primarily driven by changes in liquidation assumptions and improved macro-economic conditions.
The PCI valuation allowance declined $841 million during 2014 due to write-offs in the PCI loan portfolio of $545 million in residential mortgage and $265 million in home equity, and a provision benefit of $31 million.
Purchased Credit-impaired Residential Mortgage Loan Portfolio
The PCI residential mortgage loan portfolio represented 73 percent of the total PCI loan portfolio at December 31, 2014. Those loans to borrowers with a refreshed FICO score below 620 represented 40 percent of the PCI residential mortgage loan portfolio at December 31, 2014. Loans with a refreshed LTV greater than 90 percent, after consideration of purchase accounting adjustments and the related valuation allowance, represented 34 percent of the PCI residential mortgage loan portfolio and 46 percent based on the unpaid principal balance at December 31, 2014. Table 33 presents outstandings net of purchase accounting adjustments and before the related valuation allowance, by certain state concentrations.


Table 33
Outstanding Purchased Credit-impaired Loan Portfolio – Residential Mortgage State Concentrations


December 31
(Dollars in millions)
2014
 
2013
California
$
6,885

 
$
8,180

Florida (1)
1,289

 
1,750

Virginia
640

 
760

Maryland
602

 
728

Texas
318

 
433

Other U.S./Non-U.S.
5,418

 
6,821

Total
$
15,152

 
$
18,672

(1) 
In this state, foreclosure requires a court order following a legal proceeding (judicial state).
Pay option adjustable-rate mortgages (ARMs), which are included in the PCI residential mortgage portfolio, have interest rates that adjust monthly and minimum required payments that adjust annually, subject to resetting if minimum payments are made and deferred interest limits are reached. Annual payment adjustments are subject to a 7.5 percent maximum change. To ensure that contractual loan payments are adequate to repay a
 
loan, the fully-amortizing loan payment amount is re-established after the initial five- or ten-year period and again every five years thereafter. These payment adjustments are not subject to the 7.5 percent limit and may be substantial due to changes in interest rates and the addition of unpaid interest to the loan balance. Payment advantage ARMs have interest rates that are fixed for an initial period of five years. Payments are subject to reset if the minimum payments are made and deferred interest limits are reached. If interest deferrals cause a loan’s principal balance to reach a certain level within the first 10 years of the life of the loan, the payment is reset to the interest-only payment; then at the 10-year point, the fully-amortizing payment is required.
The difference between the frequency of changes in a loan’s interest rates and payments along with a limitation on changes in the minimum monthly payments of 7.5 percent per year can result in payments that are not sufficient to pay all of the monthly interest charges (i.e., negative amortization). Unpaid interest is added to the loan balance until the loan balance increases to a specified limit, which can be no more than 115 percent of the original loan amount, at which time a new monthly payment amount adequate to repay the loan over its remaining contractual life is established.
At December 31, 2014, the unpaid principal balance of pay option loans, which include pay option ARMs and payment advantage ARMs, was $3.3 billion, with a carrying value of $3.2 billion, including $2.8 billion of loans that were credit-impaired upon acquisition and, accordingly, the reserve is based on a life-of-loan loss estimate. The total unpaid principal balance of pay option loans with accumulated negative amortization was $1.1 billion, including $63 million of negative amortization. For those borrowers who are making payments in accordance with their contractual terms, one percent and five percent at December 31, 2014 and 2013 elected to make only the minimum payment on pay option loans. We believe the majority of borrowers are now making scheduled payments primarily because the low rate environment has caused the fully indexed rates to be affordable to more borrowers. We continue to evaluate our exposure to payment resets on the acquired negative-amortizing loans including the PCI pay option loan portfolio and have taken into consideration in the evaluation several assumptions including prepayment and default rates. Of the loans in the pay option portfolio at December 31, 2014 that have not already experienced a payment reset, two percent are expected to reset in 2015, 32 percent are expected to reset in 2016 and 11 percent are expected to reset thereafter. In addition, 18 percent are expected to prepay and approximately 37 percent are expected to default prior to being reset, most of which were severely delinquent as of December 31, 2014. We no longer originate pay option loans.


Bank of America 2014     59


Purchased Credit-impaired Home Equity Loan Portfolio
The PCI home equity portfolio represented 27 percent of the total PCI loan portfolio at December 31, 2014. Those loans with a refreshed FICO score below 620 represented 15 percent of the PCI home equity portfolio at December 31, 2014. Loans with a refreshed CLTV greater than 90 percent, after consideration of purchase accounting adjustments and the related valuation allowance, represented 64 percent of the PCI home equity portfolio and 68 percent based on the unpaid principal balance at December 31, 2014. Table 34 presents outstandings net of purchase accounting adjustments and before the related valuation allowance, by certain state concentrations.


Table 34
Outstanding Purchased Credit-impaired Loan Portfolio – Home Equity State Concentrations


December 31
(Dollars in millions)
2014
 
2013
California
$
1,646

 
$
1,921

Florida (1)
313

 
356

Virginia
265

 
310

Arizona
188

 
214

Colorado
151

 
199

Other U.S./Non-U.S.
3,054

 
3,593

Total
$
5,617

 
$
6,593

(1) 
In this state, foreclosure requires a court order following a legal proceeding (judicial state).
U.S. Credit Card
At December 31, 2014, 96 percent of the U.S. credit card portfolio was managed in Consumer Banking with the remainder managed in GWIM. Outstandings in the U.S. credit card portfolio decreased
 
$459 million in 2014 primarily due to a portfolio divestiture. Net charge-offs decreased $738 million to $2.6 billion in 2014 due to improvements in delinquencies and bankruptcies as a result of an improved economic environment and the impact of higher credit quality originations. U.S. credit card loans 30 days or more past due and still accruing interest decreased $372 million while loans 90 days or more past due and still accruing interest decreased $187 million in 2014 as a result of the factors mentioned above that contributed to lower net charge-offs.
Table 35 presents certain key credit statistics for the U.S. credit card portfolio.


Table 35
U.S. Credit Card – Key Credit Statistics


December 31
(Dollars in millions)
2014
 
2013
Outstandings
$
91,879

 
$
92,338

Accruing past due 30 days or more
1,701

 
2,073

Accruing past due 90 days or more
866

 
1,053


2014
 
2013
Net charge-offs
$
2,638

 
$
3,376

Net charge-off ratios (1)
2.96
%
 
3.74
%
(1) 
Net charge-off ratios are calculated as net charge-offs divided by average outstanding loans.
Unused lines of credit for U.S. credit card totaled $305.9 billion and $315.1 billion at December 31, 2014 and 2013. The $9.2 billion decrease was driven by the closure of inactive accounts and a portfolio divestiture.
Table 36 presents certain state concentrations for the U.S. credit card portfolio.


Table 36
U.S. Credit Card State Concentrations


December 31


Outstandings
 
Accruing Past Due
90 Days or More
 
Net Charge-offs
(Dollars in millions)
2014
 
2013
 
2014
 
2013
 
2014
 
2013
California
$
13,682

 
$
13,689

 
$
127

 
$
162

 
$
414

 
$
562

Florida
7,530

 
7,339

 
89

 
105

 
278

 
359

Texas
6,586

 
6,405

 
58

 
72

 
177

 
217

New York
5,655

 
5,624

 
59

 
70

 
174

 
219

New Jersey
3,943

 
3,868

 
40

 
48

 
116

 
150

Other U.S.
54,483

 
55,413

 
493

 
596

 
1,479

 
1,869

Total U.S. credit card portfolio
$
91,879

 
$
92,338

 
$
866

 
$
1,053

 
$
2,638

 
$
3,376


60     Bank of America 2014


Non-U.S. Credit Card
Outstandings in the non-U.S. credit card portfolio, which are recorded in All Other, decreased $1.1 billion in 2014 due to a portfolio divestiture and weakening of the British Pound against the U.S. Dollar. Net charge-offs decreased $157 million to $242 million in 2014 due to improvement in delinquencies as a result of higher credit quality originations and an improved economic environment, as well as improved recovery rates on previously charged-off loans.
Unused lines of credit for non-U.S. credit card totaled $28.2 billion and $31.1 billion at December 31, 2014 and 2013. The $2.9 billion decrease was driven by weakening of the British Pound against the U.S. Dollar and a portfolio divestiture.
Table 37 presents certain key credit statistics for the non-U.S. credit card portfolio.


Table 37
Non-U.S. Credit Card – Key Credit Statistics


December 31
(Dollars in millions)
2014
 
2013
Outstandings
$
10,465

 
$
11,541

Accruing past due 30 days or more
183

 
248

Accruing past due 90 days or more
95

 
131


2014
 
2013
Net charge-offs
$
242

 
$
399

Net charge-off ratios (1)
2.10
%
 
3.68
%
(1) 
Net charge-off ratios are calculated as net charge-offs divided by average outstanding loans.
 
Direct/Indirect Consumer
At December 31, 2014, approximately 50 percent of the direct/indirect portfolio was included in GWIM (principally securities-based lending loans and other personal loans), 49 percent was included in Consumer Banking (consumer dealer financial services – automotive, marine, aircraft, recreational vehicle loans and consumer personal loans), and the remainder was primarily in All Other (student loans and the International Wealth Management businesses).
Outstandings in the direct/indirect portfolio decreased $1.8 billion in 2014 as a transfer of the government-guaranteed portion of the student loan portfolio to LHFS and lower outstandings in the unsecured consumer lending and consumer dealer financial services portfolios were partially offset by growth in the securities-based lending portfolio.
Net charge-offs decreased $176 million to $169 million in 2014, or 0.20 percent of total average direct/indirect loans, compared to $345 million, or 0.42 percent, in 2013. This decrease in net charge-offs was primarily driven by improvements in delinquencies and bankruptcies in the unsecured consumer lending portfolio as a result of an improved economic environment as well as reduced outstandings in this portfolio.
Net charge-offs in the unsecured consumer lending portfolio decreased $143 million to $47 million in 2014, or 2.30 percent of total average unsecured consumer lending loans compared to 5.26 percent in 2013. Direct/indirect loans that were past due 30 days or more and still accruing interest declined $634 million to $379 million in 2014 due primarily to the transfer of the government-guaranteed portion of the student loan portfolio to LHFS.


Bank of America 2014     61


Table 38 presents certain state concentrations for the direct/indirect consumer loan portfolio.


Table 38
Direct/Indirect State Concentrations


December 31


Outstandings
 
Accruing Past Due
90 Days or More
 
Net Charge-offs
(Dollars in millions)
2014
 
2013
 
2014
 
2013
 
2014
 
2013
California
$
9,770

 
$
10,041

 
$
5

 
$
57

 
$
18

 
$
42

Florida
7,930

 
7,634

 
5

 
25

 
27

 
41

Texas
7,741

 
7,850

 
5

 
66

 
19

 
32

New York
4,458

 
4,611

 
2

 
33

 
9

 
20

New Jersey
2,625

 
2,526

 
2

 
8

 
5

 
12

Other U.S./Non-U.S.
47,857

 
49,530

 
45

 
219

 
91

 
198

Total direct/indirect loan portfolio
$
80,381

 
$
82,192

 
$
64

 
$
408

 
$
169

 
$
345

Other Consumer
At December 31, 2014, approximately 37 percent of the $1.8 billion other consumer portfolio was associated with certain consumer finance businesses that we previously exited. The remainder is primarily leases within the consumer dealer financial services portfolio included in Consumer Banking.
Consumer Loans Accounted for Under the Fair Value Option
Outstanding consumer loans accounted for under the fair value option totaled $2.1 billion at December 31, 2014 and were comprised of residential mortgage loans that were previously classified as held-for-sale, residential mortgage loans held in consolidated variable interest entities (VIEs) and repurchased home equity loans. The loans that were previously classified as held-for-sale were transferred to the residential mortgage portfolio in connection with the decision to retain the loans. The fair value option had been elected at the time of origination and the loans continue to be measured at fair value after the reclassification. In 2014, we recorded net losses of $13 million resulting from changes in the fair value of these loans, including losses of $45 million on loans held in consolidated VIEs that were offset by gains recorded on related long-term debt.
Nonperforming Consumer Loans, Leases and Foreclosed Properties Activity
Table 39 presents nonperforming consumer loans, leases and foreclosed properties activity during 2014 and 2013. Nonperforming LHFS are excluded from nonperforming loans as they are recorded at either fair value or the lower of cost or fair value. Nonperforming loans do not include past due consumer credit card loans, other unsecured loans and in general, consumer non-real estate-secured loans (loans discharged in Chapter 7 bankruptcy are included) as these loans are typically charged off no later than the end of the month in which the loan becomes 180 days past due. The charge-offs on these loans have no impact on nonperforming activity and, accordingly, are excluded from this table. The fully-insured loan portfolio is not reported as nonperforming as principal repayment is insured. Additionally, nonperforming loans do not include the PCI loan portfolio or loans
 
accounted for under the fair value option. For more information on nonperforming loans, see Note 1 – Summary of Significant Accounting Principles to the Consolidated Financial Statements. During 2014, nonperforming consumer loans declined $5.0 billion to $10.8 billion as outflows including the impact of loan sales, returns to performing status and charge-offs outpaced new inflows which continued to improve due to favorable delinquency trends.
The outstanding balance of a real estate-secured loan that is in excess of the estimated property value less costs to sell is charged off no later than the end of the month in which the loan becomes 180 days past due unless repayment of the loan is fully insured. At December 31, 2014, $5.9 billion, or 51 percent of nonperforming consumer real estate loans and foreclosed properties had been written down to their estimated property value less costs to sell, including $5.2 billion of nonperforming loans 180 days or more past due and $630 million of foreclosed properties. In addition, at December 31, 2014, $3.6 billion, or 33 percent of nonperforming consumer loans were modified and are now current after successful trial periods, or are current loans classified as nonperforming loans in accordance with applicable policies.
Foreclosed properties increased $97 million in 2014 as additions outpaced liquidations. PCI loans are excluded from nonperforming loans as these loans were written down to fair value at the acquisition date; however, once the underlying real estate is acquired by the Corporation upon foreclosure of the delinquent PCI loan, it is included in foreclosed properties. PCI-related foreclosed properties increased $198 million in 2014. Not included in foreclosed properties at December 31, 2014 was $1.1 billion of real estate that was acquired upon foreclosure of delinquent FHA-insured loans. We exclude these amounts from our nonperforming loans and foreclosed properties activity as we expect we will be reimbursed once the property is conveyed to the FHA for principal and, up to certain limits, costs incurred during the foreclosure process and interest incurred during the holding period. For more information on the review of our foreclosure processes, see Off-Balance Sheet Arrangements and Contractual Obligations – Servicing, Foreclosure and Other Mortgage Matters on page 33.


62     Bank of America 2014


Restructured Loans
Nonperforming loans also include certain loans that have been modified in TDRs where economic concessions have been granted to borrowers experiencing financial difficulties. These concessions typically result from the Corporation’s loss mitigation activities and could include reductions in the interest rate, payment extensions,
 
forgiveness of principal, forbearance or other actions. Certain TDRs are classified as nonperforming at the time of restructuring and may only be returned to performing status after considering the borrower’s sustained repayment performance for a reasonable period, generally six months. Nonperforming TDRs, excluding those modified loans in the PCI loan portfolio, are included in Table 39.


Table 39
Nonperforming Consumer Loans, Leases and Foreclosed Properties Activity (1)


(Dollars in millions)
2014
 
2013
Nonperforming loans and leases, January 1
$
15,840

 
$
19,431

Additions to nonperforming loans and leases:


New nonperforming loans and leases
7,077

 
9,652

Reductions to nonperforming loans and leases:


Paydowns and payoffs
(1,625
)
 
(2,782
)
Sales
(4,129
)
 
(1,528
)
Returns to performing status (2)
(3,277
)
 
(4,273
)
Charge-offs
(2,187
)
 
(3,514
)
Transfers to foreclosed properties (3)
(672
)
 
(483
)
Transfers to loans held-for-sale (4)
(208
)
 
(663
)
Total net reductions to nonperforming loans and leases
(5,021
)
 
(3,591
)
Total nonperforming loans and leases, December 31 (5)
10,819

 
15,840

Foreclosed properties, January 1
533

 
650

Additions to foreclosed properties:


New foreclosed properties (3)
1,011

 
936

Reductions to foreclosed properties:


Sales
(829
)
 
(930
)
Write-downs
(85
)
 
(123
)
Total net additions (reductions) to foreclosed properties
97

 
(117
)
Total foreclosed properties, December 31 (6)
630

 
533

Nonperforming consumer loans, leases and foreclosed properties, December 31
$
11,449

 
$
16,373

Nonperforming consumer loans and leases as a percentage of outstanding consumer loans and leases (7)
2.22
%
 
2.99
%
Nonperforming consumer loans, leases and foreclosed properties as a percentage of outstanding consumer loans, leases and foreclosed properties (7)
2.35

 
3.09

(1) 
Balances do not include nonperforming LHFS of $7 million and $376 million and nonaccruing TDRs removed from the PCI loan portfolio prior to January 1, 2010 of $102 million and $260 million at December 31, 2014 and 2013 as well as loans accruing past due 90 days or more as presented in Table 25 and Note 4 – Outstanding Loans and Leases to the Consolidated Financial Statements.
(2) 
Consumer loans may be returned to performing status when all principal and interest is current and full repayment of the remaining contractual principal and interest is expected, or when the loan otherwise becomes well-secured and is in the process of collection.
(3) 
New foreclosed properties represents transfers of nonperforming loans to foreclosed properties net of charge-offs taken during the first 90 days after transfer of a loan to foreclosed properties. New foreclosed properties also includes properties obtained upon foreclosure of delinquent PCI loans, properties repurchased due to representations and warranties exposure and properties acquired with newly consolidated subsidiaries.
(4) 
For 2014 and 2013, transfers to loans held-for-sale included $208 million and $273 million of loans that were sold prior to December 31, 2014 and 2013.
(5) 
At December 31, 2014, 48 percent of nonperforming loans were 180 days or more past due and were written down through charge-offs to 66 percent of their unpaid principal balance.
(6) 
Foreclosed property balances do not include loans that are insured by the FHA and have entered foreclosure of $1.1 billion and $1.4 billion at December 31, 2014 and 2013.
(7) 
Outstanding consumer loans and leases exclude loans accounted for under the fair value option.
Our policy is to record any losses in the value of foreclosed properties as a reduction in the allowance for loan and lease losses during the first 90 days after transfer of a loan to foreclosed properties. Thereafter, further losses in value as well as gains and losses on sale are recorded in noninterest expense. New foreclosed properties included in Table 39 are net of $191 million and $190 million of charge-offs in 2014 and 2013, recorded during the first 90 days after transfer.
 
We classify junior-lien home equity loans as nonperforming when the first-lien loan becomes 90 days past due even if the junior-lien loan is performing. At December 31, 2014 and 2013, $800 million and $1.2 billion of such junior-lien home equity loans were included in nonperforming loans and leases. This decline was driven by enhanced identification of the delinquency on first-lien loans serviced by other financial institutions.


Bank of America 2014     63


Table 40 presents TDRs for the consumer real estate portfolio. Performing TDR balances are excluded from nonperforming loans and leases in Table 39.


Table 40
Consumer Real Estate Troubled Debt Restructurings


December 31
 
 
2014
 
2013
(Dollars in millions)
Total
 
Nonperforming
 
Performing
 
Total
 
Nonperforming
 
Performing
Residential mortgage (1, 2)
$
23,270

 
$
4,529

 
$
18,741

 
$
29,312

 
$
7,555

 
$
21,757

Home equity (3)
2,358

 
1,595

 
763

 
2,146

 
1,389

 
757

Total consumer real estate troubled debt restructurings
$
25,628

 
$
6,124

 
$
19,504

 
$
31,458

 
$
8,944

 
$
22,514

(1) 
Residential mortgage TDRs deemed collateral dependent totaled $5.8 billion and $8.2 billion, and included $3.6 billion and $5.7 billion of loans classified as nonperforming and $2.2 billion and $2.5 billion of loans classified as performing at December 31, 2014 and 2013.
(2) 
Residential mortgage performing TDRs included $11.9 billion and $14.3 billion of loans that were fully-insured at December 31, 2014 and 2013.
(3) 
Home equity TDRs deemed collateral dependent totaled $1.6 billion and $1.4 billion, and included $1.4 billion and $1.2 billion of loans classified as nonperforming and $178 million and $227 million of loans classified as performing at December 31, 2014 and 2013.
In addition to modifying consumer real estate loans, we work with customers who are experiencing financial difficulty by modifying credit card and other consumer loans. Credit card and other consumer loan modifications generally involve a reduction in the customer’s interest rate on the account and placing the customer on a fixed payment plan not exceeding 60 months, all of which are considered TDRs (the renegotiated TDR portfolio). In addition, the accounts of non-U.S. credit card customers who do not qualify for a fixed payment plan may have their interest rates reduced, as required by certain local jurisdictions. These modifications, which are also TDRs, tend to experience higher payment default rates given that the borrowers may lack the ability to repay even with the interest rate reduction. In all cases, the customer’s available line of credit is canceled.
Modifications of credit card and other consumer loans are primarily made through internal renegotiation programs utilizing direct customer contact, but may also utilize external renegotiation programs. The renegotiated TDR portfolio is excluded in large part from Table 39 as substantially all of the loans remain on accrual status until either charged off or paid in full. At December 31, 2014 and 2013, our renegotiated TDR portfolio was $1.1 billion and $2.1 billion, of which $907 million and $1.6 billion were current or less than 30 days past due under the modified terms. The decline in the renegotiated TDR portfolio was primarily driven by paydowns and charge-offs as well as lower program enrollments. For more information on the renegotiated TDR portfolio, see Note 4 – Outstanding Loans and Leases to the Consolidated Financial Statements.
Commercial Portfolio Credit Risk Management
Credit risk management for the commercial portfolio begins with an assessment of the credit risk profile of the borrower or counterparty based on an analysis of its financial position. As part of the overall credit risk assessment, our commercial credit exposures are assigned a risk rating and are subject to approval based on defined credit approval standards. Subsequent to loan origination, risk ratings are monitored on an ongoing basis, and if necessary, adjusted to reflect changes in the financial condition, cash flow, risk profile or outlook of a borrower or counterparty. In making credit decisions, we consider risk rating, collateral, country, industry and single name concentration limits while also balancing this with the total borrower or counterparty relationship. Our business and risk management personnel use a variety of tools to continuously monitor the ability of a borrower or counterparty to perform under its obligations. We use risk rating aggregations to measure and evaluate concentrations within portfolios. In
 
addition, risk ratings are a factor in determining the level of allocated capital and the allowance for credit losses.
As part of our ongoing risk mitigation initiatives, we attempt to work with clients experiencing financial difficulty to modify their loans to terms that better align with their current ability to pay. In situations where an economic concession has been granted to a borrower experiencing financial difficulty, we identify these loans as TDRs. For more information on our accounting policies regarding delinquencies, nonperforming status and net charge-offs for the commercial portfolio, see Note 1 – Summary of Significant Accounting Principles to the Consolidated Financial Statements.
Management of Commercial Credit Risk Concentrations
Commercial credit risk is evaluated and managed with the goal that concentrations of credit exposure do not result in undesirable levels of risk. We review, measure and manage concentrations of credit exposure by industry, product, geography, customer relationship and loan size. We also review, measure and manage commercial real estate loans by geographic location and property type. In addition, within our non-U.S. portfolio, we evaluate exposures by region and by country. Tables 45, 50, 57 and 58 summarize our concentrations. We also utilize syndications of exposure to third parties, loan sales, hedging and other risk mitigation techniques to manage the size and risk profile of the commercial credit portfolio.
We account for certain large corporate loans and loan commitments, including issued but unfunded letters of credit which are considered utilized for credit risk management purposes, that exceed our single name credit risk concentration guidelines under the fair value option. Lending commitments, both funded and unfunded, are actively managed and monitored, and as appropriate, credit risk for these lending relationships may be mitigated through the use of credit derivatives, with the Corporation’s credit view and market perspectives determining the size and timing of the hedging activity. In addition, we purchase credit protection to cover the funded portion as well as the unfunded portion of certain other credit exposures. To lessen the cost of obtaining our desired credit protection levels, credit exposure may be added within an industry, borrower or counterparty group by selling protection. These credit derivatives do not meet the requirements for treatment as accounting hedges. They are carried at fair value with changes in fair value recorded in other income (loss).


64     Bank of America 2014


In addition, the Corporation is a member of various securities and derivative exchanges and clearinghouses, both in the U.S. and other countries. As a member, the Corporation may be required to pay a pro-rata share of the losses incurred by some of these organizations as a result of another member default and under other loss scenarios. For additional information, see Note 12 – Commitments and Contingencies to the Consolidated Financial Statements.
Commercial Credit Portfolio
During 2014, tightening of credit spreads, combined with improved commercial real estate pricing and higher equity markets, drove further improvements in commercial credit quality. Our focus on balance sheet optimization drove new originations to be weighted to higher rated investment-grade obligors.
Outstanding commercial loans and leases decreased $3.5 billion, primarily in non-U.S. commercial, partially offset by growth
 
in U.S. commercial. Credit quality continued to show improvement with declines in reservable criticized balances and nonperforming loans, leases and foreclosed property balances during 2014. Nonperforming commercial loans and leases as a percentage of outstanding commercial loans and leases decreased during 2014 to 0.28 percent from 0.33 percent (0.29 percent from 0.34 percent excluding loans accounted for under the fair value option) at December 31, 2013. The allowance for loan and lease losses for the commercial portfolio increased $432 million to $4.4 billion at December 31, 2014 compared to December 31, 2013. For more information, see Allowance for Credit Losses on page 75.
Table 41 presents our commercial loans and leases portfolio, and related credit quality information at December 31, 2014 and 2013.


Table 41
Commercial Loans and Leases


December 31
 
 
Outstandings
 
Nonperforming
 
Accruing Past Due
90 Days or More
(Dollars in millions)
2014
 
2013
 
2014
 
2013
 
2014
 
2013
U.S. commercial
$
220,293

 
$
212,557

 
$
701

 
$
819

 
$
110

 
$
47

Commercial real estate (1)
47,682

 
47,893

 
321

 
322

 
3

 
21

Commercial lease financing
24,866

 
25,199

 
3

 
16

 
41

 
41

Non-U.S. commercial
80,083

 
89,462

 
1

 
64


17


372,924

 
375,111

 
1,026

 
1,221

 
154

 
126

U.S. small business commercial (2)
13,293

 
13,294

 
87

 
88

 
67

 
78

Commercial loans excluding loans accounted for under the fair value option
386,217

 
388,405

 
1,113

 
1,309

 
221

 
204

Loans accounted for under the fair value option (3)
6,604

 
7,878


2


Total commercial loans and leases
$
392,821

 
$
396,283

 
$
1,113

 
$
1,311

 
$
221

 
$
204

(1) 
Includes U.S. commercial real estate loans of $45.2 billion and $46.3 billion and non-U.S. commercial real estate loans of $2.5 billion and $1.6 billion at December 31, 2014 and 2013.
(2) 
Includes card-related products.
(3) 
Commercial loans accounted for under the fair value option include U.S. commercial loans of $1.9 billion and $1.5 billion and non-U.S. commercial loans of $4.7 billion and $6.4 billion at December 31, 2014 and 2013. For more information on the fair value option, see Note 21 – Fair Value Option to the Consolidated Financial Statements.
Table 42 presents net charge-offs and related ratios for our commercial loans and leases for 2014 and 2013. Improving trends across the portfolio drove lower charge-offs.


Table 42
Commercial Net Charge-offs and Related Ratios


Net Charge-offs
 
Net Charge-off Ratios (1)
(Dollars in millions)
2014
 
2013
 
2014
 
2013
U.S. commercial
$
88

 
$
128

 
0.04
 %
 
0.06
 %
Commercial real estate
(83
)
 
149

 
(0.18
)
 
0.35

Commercial lease financing
(9
)
 
(25
)
 
(0.04
)
 
(0.10
)
Non-U.S. commercial
34

 
45

 
0.04

 
0.05


30

 
297

 
0.01

 
0.08

U.S. small business commercial
282

 
359

 
2.10

 
2.84

Total commercial
$
312

 
$
656

 
0.08

 
0.18

(1) 
Net charge-off ratios are calculated as net charge-offs divided by average outstanding loans and leases excluding loans accounted for under the fair value option.


Bank of America 2014     65


Table 43 presents commercial credit exposure by type for utilized, unfunded and total binding committed credit exposure. Commercial utilized credit exposure includes SBLCs and financial guarantees, bankers’ acceptances and commercial letters of credit for which we are legally bound to advance funds under prescribed conditions, during a specified time period. Although funds have not yet been advanced, these exposure types are considered utilized for credit risk management purposes.
 
Total commercial utilized credit exposure decreased $852 million in 2014 primarily driven by loans and leases, SBLCs and financial guarantees, debt securities and other investments, partially offset by an increase in derivative assets. The utilization rate for loans and leases, SBLCs and financial guarantees, commercial letters of credit and bankers acceptances, in the aggregate, was 57 percent and 58 percent at December 31, 2014 and 2013.


Table 43
Commercial Credit Exposure by Type


December 31
 
 
Commercial
Utilized (1)
 
Commercial
Unfunded (2, 3)
 
Total Commercial Committed
(Dollars in millions)
2014
 
2013
 
2014
 
2013
 
2014
 
2013
Loans and leases
$
392,821

 
$
396,283

 
$
317,258

 
$
307,478

 
$
710,079

 
$
703,761

Derivative assets (4)
52,682

 
47,495


52,682

 
47,495

Standby letters of credit and financial guarantees
33,550

 
35,893

 
745

 
1,334

 
34,295

 
37,227

Debt securities and other investments
17,301

 
18,505

 
5,315

 
6,903

 
22,616

 
25,408

Loans held-for-sale
7,036

 
6,604

 
2,315

 
101

 
9,351

 
6,705

Commercial letters of credit
2,037

 
2,054

 
126

 
515

 
2,163

 
2,569

Bankers’ acceptances
255

 
246


255

 
246

Foreclosed properties and other
960

 
414


960

 
414

Total
 
$
506,642

 
$
507,494

 
$
325,759

 
$
316,331

 
$
832,401

 
$
823,825

(1) 
Total commercial utilized exposure includes loans of $6.6 billion and $7.9 billion and issued letters of credit accounted for under the fair value option with a notional amount of $535 million and $503 million at December 31, 2014 and 2013.
(2) 
Total commercial unfunded exposure includes loan commitments accounted for under the fair value option with a notional amount of $9.4 billion and $12.5 billion at December 31, 2014 and 2013.
(3) 
Excludes unused business card lines which are not legally binding.
(4) 
Derivative assets are carried at fair value, reflect the effects of legally enforceable master netting agreements and have been reduced by cash collateral of $47.3 billion at both December 31, 2014 and 2013. Not reflected in utilized and committed exposure is additional derivative collateral held of $24.0 billion and $17.1 billion which consists primarily of other marketable securities.
Table 44 presents commercial utilized reservable criticized exposure by loan type. Criticized exposure corresponds to the Special Mention, Substandard and Doubtful asset categories as defined by regulatory authorities. Total commercial utilized reservable criticized exposure decreased $1.3 billion, or 10
 
percent, in 2014 throughout most of the commercial portfolio driven largely by paydowns, upgrades and charge-offs outpacing downgrades. Approximately 87 percent and 84 percent of commercial utilized reservable criticized exposure was secured at December 31, 2014 and 2013.


Table 44
Commercial Utilized Reservable Criticized Exposure


December 31
 
 
2014
 
2013
(Dollars in millions)
Amount (1)
 
Percent (2)
 
Amount (1)
 
Percent (2)
U.S. commercial 
$
7,597

 
3.07
%
 
$
8,362

 
3.45
%
Commercial real estate
1,108

 
2.24

 
1,452

 
2.92

Commercial lease financing
1,034

 
4.16

 
988

 
3.92

Non-U.S. commercial
887

 
1.03

 
1,424

 
1.49


10,626

 
2.60

 
12,226

 
2.96

U.S. small business commercial
944

 
7.10

 
635

 
4.77

Total commercial utilized reservable criticized exposure
$
11,570

 
2.74

 
$
12,861

 
3.02

(1) 
Total commercial utilized reservable criticized exposure includes loans and leases of $10.2 billion and $11.5 billion and commercial letters of credit of $1.3 billion and $1.4 billion at December 31, 2014 and 2013.
(2) 
Percentages are calculated as commercial utilized reservable criticized exposure divided by total commercial utilized reservable exposure for each exposure category.
U.S. Commercial
At December 31, 2014, 70 percent of the U.S. commercial loan portfolio, excluding small business, was managed in Global Banking, 16 percent in Global Markets, 10 percent in GWIM (generally business-purpose loans for high net worth clients) and the remainder primarily in Consumer Banking. U.S. commercial
 
loans, excluding loans accounted for under the fair value option, increased $7.7 billion, or four percent, during 2014 with growth primarily from middle-market and corporate clients. Nonperforming loans and leases decreased $118 million, or 14 percent, in 2014. Net charge-offs decreased $40 million to $88 million during 2014.


66     Bank of America 2014


Commercial Real Estate
Commercial real estate primarily includes commercial loans and leases secured by non-owner-occupied real estate and is dependent on the sale or lease of the real estate as the primary source of repayment. The portfolio remains diversified across property types and geographic regions. California represented the largest state concentration at 22 percent of the commercial real estate loans and leases portfolio at both December 31, 2014 and 2013. The commercial real estate portfolio is predominantly managed in Global Banking and consists of loans made primarily to public and private developers, and commercial real estate firms. Outstanding loans decreased $211 million during 2014 primarily due to portfolio sales.
During 2014, we continued to see improvements in credit quality in both the residential and non-residential portfolios. We
 
use a number of proactive risk mitigation initiatives to reduce adversely rated exposure in the commercial real estate portfolio including transfers of deteriorating exposures to management by independent special asset officers and the pursuit of loan restructurings or asset sales to achieve the best results for our customers and the Corporation.
Nonperforming commercial real estate loans and foreclosed properties decreased $24 million, or six percent, and reservable criticized balances decreased $344 million, or 24 percent, in 2014. Net charge-offs declined $232 million to a net recovery of $83 million in 2014.
Table 45 presents outstanding commercial real estate loans by geographic region, based on the geographic location of the collateral, and by property type.


Table 45
Outstanding Commercial Real Estate Loans


December 31
(Dollars in millions)
2014
 
2013
By Geographic Region 


California
$
10,352

 
$
10,358

Northeast
8,781

 
9,487

Southwest
6,570

 
6,913

Southeast
5,495

 
5,314

Midwest
2,867

 
3,109

Illinois
2,785

 
2,319

Florida
2,520

 
3,030

Northwest
2,151

 
2,037

Midsouth
1,724

 
2,013

Non-U.S. 
2,494

 
1,582

Other (1)
1,943

 
1,731

Total outstanding commercial real estate loans
$
47,682

 
$
47,893

By Property Type


Non-residential


Office
$
13,306

 
$
12,799

Multi-family rental
8,382

 
8,559

Shopping centers/retail
7,969

 
7,470

Industrial/warehouse
4,550

 
4,522

Hotels/motels
3,578

 
3,926

Multi-use
1,943

 
1,960

Land and land development
490

 
855

Other
5,754

 
6,283

Total non-residential
45,972

 
46,374

Residential
1,710

 
1,519

Total outstanding commercial real estate loans
$
47,682

 
$
47,893

(1) 
Includes unsecured loans to real estate investment trusts and national home builders whose portfolios of properties span multiple geographic regions and properties in the states of Colorado, Utah, Hawaii, Wyoming and Montana.


Bank of America 2014     67


Tables 46 and 47 present commercial real estate credit quality data by non-residential and residential property types. The residential portfolio presented in Tables 45, 46 and 47 includes condominiums and other residential real estate. Other property
 
types in Tables 45, 46 and 47 primarily include special purpose, nursing/retirement homes, medical facilities and restaurants, as well as unsecured loans to borrowers whose primary business is commercial real estate.


Table 46
Commercial Real Estate Credit Quality Data


December 31
 
 
Nonperforming Loans and
Foreclosed Properties (1)
 
Utilized Reservable
Criticized Exposure (2)
(Dollars in millions)
2014
 
2013
 
2014
 
2013
Non-residential


Office
$
177

 
$
96

 
$
235

 
$
367

Multi-family rental
21

 
15

 
125

 
234

Shopping centers/retail
46

 
57

 
350

 
144

Industrial/warehouse
42

 
22

 
67

 
119

Hotels/motels
3

 
5

 
26

 
38

Multi-use
11

 
19

 
55

 
157

Land and land development
51

 
73

 
63

 
92

Other
15

 
23

 
159

 
173

Total non-residential
366

 
310

 
1,080

 
1,324

Residential
22

 
102

 
28

 
128

Total commercial real estate
$
388

 
$
412

 
$
1,108

 
$
1,452

(1) 
Includes commercial foreclosed properties of $67 million and $90 million at December 31, 2014 and 2013.
(2) 
Includes loans, SBLCs and bankers’ acceptances and excludes loans accounted for under the fair value option.


Table 47
Commercial Real Estate Net Charge-offs and Related Ratios


Net Charge-offs
 
Net Charge-off Ratios (1)
(Dollars in millions)
2014
 
2013
 
2014
 
2013
Non-residential


Office
$
(4
)
 
$
42

 
(0.04
)%
 
0.39
 %
Multi-family rental
(22
)
 
2

 
(0.25
)
 
0.02

Shopping centers/retail
4

 
12

 
0.06

 
0.18

Industrial/warehouse
(1
)
 
23

 
(0.03
)
 
0.55

Hotels/motels
(3
)
 
18

 
(0.07
)
 
0.52

Multi-use
(9
)
 
5

 
(0.49
)
 
0.26

Land and land development
(2
)
 
23

 
(0.31
)
 
2.35

Other
(38
)
 
(23
)
 
(0.64
)
 
(0.41
)
Total non-residential
(75
)
 
102

 
(0.16
)
 
0.25

Residential
(8
)
 
47

 
(0.47
)
 
3.04

Total commercial real estate
$
(83
)
 
$
149

 
(0.18
)
 
0.35

(1) 
Net charge-off ratios are calculated as net charge-offs divided by average outstanding loans excluding loans accounted for under the fair value option.
At December 31, 2014, total committed non-residential exposure was $67.7 billion compared to $68.6 billion at December 31, 2013, of which $46.0 billion and $46.4 billion were funded secured loans. Non-residential nonperforming loans and foreclosed properties increased $56 million, or 18 percent, to $366 million at December 31, 2014 compared to December 31, 2013, which represented 0.79 percent and 0.67 percent of total non-residential loans and foreclosed properties. The increase in nonperforming loans and foreclosed properties in the non-residential portfolio was primarily in the office property type. Non-residential utilized reservable criticized exposure decreased $244 million, or 18 percent, to $1.1 billion at December 31, 2014 compared to December 31, 2013, which represented 2.27 percent and 2.75 percent of non-residential utilized reservable exposure. For the non-residential portfolio, net charge-offs decreased $177 million to a net recovery of $75 million in 2014 primarily due to lower levels of criticized and nonperforming assets as well as recoveries of prior-period charge-offs.
 
At December 31, 2014, total committed residential exposure was $3.6 billion compared to $3.1 billion at December 31, 2013, of which $1.7 billion and $1.5 billion were funded secured loans. In 2014, residential nonperforming loans and foreclosed properties decreased $80 million, or 78 percent, and residential utilized reservable criticized exposure decreased $100 million, or 78 percent, due to repayments, sales and loan restructurings. The nonperforming loans, leases and foreclosed properties and the utilized reservable criticized ratios for the residential portfolio were 1.28 percent and 1.51 percent at December 31, 2014 compared to 6.65 percent and 7.81 percent at December 31, 2013. Residential portfolio net charge-offs decreased $55 million to a net recovery of $8 million in 2014.
At December 31, 2014 and 2013, the commercial real estate loan portfolio included $6.7 billion and $7.0 billion of funded construction and land development loans that were originated to fund the construction and/or rehabilitation of commercial properties. Reservable criticized construction and land


68     Bank of America 2014


development loans totaled $164 million and $431 million, and nonperforming construction and land development loans and foreclosed properties totaled $80 million and $100 million at December 31, 2014 and 2013. During a property’s construction phase, interest income is typically paid from interest reserves that are established at the inception of the loan. As construction is completed and the property is put into service, these interest reserves are depleted and interest payments from operating cash flows begin. We do not recognize interest income on nonperforming loans regardless of the existence of an interest reserve.
Non-U.S. Commercial
At December 31, 2014, 77 percent of the non-U.S. commercial loan portfolio was managed in Global Banking and 23 percent in Global Markets. Outstanding loans, excluding loans accounted for under the fair value option, decreased $9.4 billion in 2014 primarily due to client financing activity including prime brokerage loans. Net charge-offs decreased $11 million to $34 million in 2014. For more information on the non-U.S. commercial portfolio, see Non-U.S. Portfolio on page 73.
U.S. Small Business Commercial
The U.S. small business commercial loan portfolio is comprised of small business card loans and small business loans managed in Consumer Banking. Credit card-related products were 43 percent of the U.S. small business commercial portfolio at both December 31, 2014 and 2013. Net charge-offs decreased $77 million to $282 million in 2014 driven by an improvement in credit quality, including lower delinquencies as a result of an improved economic environment, and the impact of higher credit quality originations. Of the U.S. small business commercial net charge-offs, 73 percent were credit card-related products in both 2014 and 2013.
Commercial Loans Accounted for Under the Fair Value Option
The portfolio of commercial loans accounted for under the fair value option is held primarily in Global Markets and Global Banking. Outstanding commercial loans accounted for under the fair value
 
option decreased $1.3 billion to an aggregate fair value of $6.6 billion at December 31, 2014 primarily due to decreased corporate borrowings under bank credit facilities. We recorded net losses of $11 million in 2014 compared to net gains of $88 million in 2013 from changes in the fair value of this loan portfolio. These amounts were primarily attributable to changes in instrument-specific credit risk, were recorded in other income (loss) and do not reflect the results of hedging activities.
In addition, unfunded lending commitments and letters of credit accounted for under the fair value option had an aggregate fair value of $405 million and $354 million at December 31, 2014 and 2013, which was recorded in accrued expenses and other liabilities. The associated aggregate notional amount of unfunded lending commitments and letters of credit accounted for under the fair value option was $9.9 billion and $13.0 billion at December 31, 2014 and 2013. We recorded net losses of $64 million from changes in the fair value of commitments and letters of credit during 2014 compared to net gains of $180 million in 2013. These amounts were primarily attributable to changes in instrument-specific credit risk, were recorded in other income (loss) and do not reflect the results of hedging activities.
Nonperforming Commercial Loans, Leases and Foreclosed Properties Activity
Table 48 presents the nonperforming commercial loans, leases and foreclosed properties activity during 2014 and 2013. Nonperforming loans do not include loans accounted for under the fair value option. During 2014, nonperforming commercial loans and leases decreased $196 million to $1.1 billion driven by paydowns, charge-offs and returns to performing status outpacing new nonperforming loans. Approximately 98 percent of commercial nonperforming loans, leases and foreclosed properties were secured and approximately 45 percent were contractually current. Commercial nonperforming loans were carried at approximately 79 percent of their unpaid principal balance before consideration of the allowance for loan and lease losses as the carrying value of these loans has been reduced to the estimated property value less costs to sell.


Bank of America 2014     69


Table 48
Nonperforming Commercial Loans, Leases and Foreclosed Properties Activity (1, 2)


(Dollars in millions)
2014
 
2013
Nonperforming loans and leases, January 1
$
1,309

 
$
3,224

Additions to nonperforming loans and leases:


New nonperforming loans and leases
1,228

 
1,112

Advances
48

 
30

Reductions to nonperforming loans and leases:


Paydowns
(717
)
 
(1,342
)
Sales
(149
)
 
(498
)
Returns to performing status (3)
(261
)
 
(588
)
Charge-offs
(332
)
 
(549
)
Transfers to foreclosed properties (4)
(13
)
 
(54
)
Transfers to loans held-for-sale

 
(26
)
Total net reductions to nonperforming loans and leases
(196
)
 
(1,915
)
Total nonperforming loans and leases, December 31
1,113

 
1,309

Foreclosed properties, January 1
90

 
250

Additions to foreclosed properties:


New foreclosed properties (4)
11

 
38

Reductions to foreclosed properties:


Sales
(26
)
 
(169
)
Write-downs
(8
)
 
(29
)
Total net reductions to foreclosed properties
(23
)
 
(160
)
Total foreclosed properties, December 31
67

 
90

Nonperforming commercial loans, leases and foreclosed properties, December 31
$
1,180

 
$
1,399

Nonperforming commercial loans and leases as a percentage of outstanding commercial loans and leases (5)
0.29
%
 
0.34
%
Nonperforming commercial loans, leases and foreclosed properties as a percentage of outstanding commercial loans, leases and foreclosed properties (5)
0.31

 
0.36

(1) 
Balances do not include nonperforming LHFS of $212 million and $296 million at December 31, 2014 and 2013.
(2) 
Includes U.S. small business commercial activity. Small business card loans are excluded as they are not classified as nonperforming.
(3) 
Commercial loans and leases may be returned to performing status when all principal and interest is current and full repayment of the remaining contractual principal and interest is expected, or when the loan otherwise becomes well-secured and is in the process of collection. TDRs are generally classified as performing after a sustained period of demonstrated payment performance.
(4) 
New foreclosed properties represents transfers of nonperforming loans to foreclosed properties net of charge-offs recorded during the first 90 days after transfer of a loan to foreclosed properties.
(5) 
Outstanding commercial loans exclude loans accounted for under the fair value option.
Table 49 presents our commercial TDRs by product type and performing status. U.S. small business commercial TDRs are comprised of renegotiated small business card loans and are not classified as nonperforming as they are charged off no later than
 
the end of the month in which the loan becomes 180 days past due. For more information on TDRs, see Note 4 – Outstanding Loans and Leases to the Consolidated Financial Statements.


Table 49
Commercial Troubled Debt Restructurings


December 31
 
 
2014
 
2013
(Dollars in millions)
Total
 
Nonperforming
 
Performing
 
Total
 
Nonperforming
 
Performing
U.S. commercial
$
1,096

 
$
308

 
$
788

 
$
1,318

 
$
298

 
$
1,020

Commercial real estate
456

 
234

 
222

 
835

 
198

 
637

Non-U.S. commercial
43


43

 
48

 
38

 
10

U.S. small business commercial
35


35

 
88


88

Total commercial troubled debt restructurings
$
1,630

 
$
542

 
$
1,088

 
$
2,289

 
$
534

 
$
1,755

Industry Concentrations
Table 50 presents commercial committed and utilized credit exposure by industry and the total net credit default protection purchased to cover the funded and unfunded portions of certain credit exposures. Our commercial credit exposure is diversified across a broad range of industries. Total commercial committed credit exposure increased $8.6 billion in 2014 to $832.4 billion. The increase in commercial committed exposure was concentrated in energy, food, beverage and tobacco, retailing, and health care equipment and services, partially offset by lower exposure in diversified financials and telecommunications services.
Industry limits are used internally to manage industry concentrations and are based on committed exposures and capital
 
usage that are allocated on an industry-by-industry basis. A risk management framework is in place to set and approve industry limits as well as to provide ongoing monitoring. Management oversight of industry concentrations, including industry limits, is the responsibility of a subcommittee of the MRC.
Diversified financials, our largest industry concentration with committed exposure of $103.5 billion, decreased $14.6 billion, or 12 percent, in 2014. The decrease primarily reflected lower margin loans and consumer finance exposure.
Real estate, our second largest industry concentration with committed exposure of $76.2 billion, decreased $265 million in 2014. The decrease was largely driven by portfolio sales, and a combination of prepayments and paydowns due to favorable


70     Bank of America 2014


market liquidity, and lower levels of originations. Real estate construction and land development exposure represented 13 percent and 14 percent of the total real estate industry committed exposure at December 31, 2014 and 2013. For more information on commercial real estate and related portfolios, see Commercial Portfolio Credit Risk Management – Commercial Real Estate on page 67.
The following changes in our industry concentration occurred during 2014. Committed exposure to the energy industry increased $6.5 billion, or 16 percent, driven by higher exposure in the oil and gas refining and marketing, exploration and production, and equipment and services sectors. The latter two sectors include bridge financing, a significant portion of which was subsequently distributed. Food, beverage and tobacco committed exposure increased $3.9 billion, or 13 percent, primarily reflecting bridge financing in the beverage sector. Retailing industry committed exposure increased $3.4 billion, or six percent, driven by higher exposure to internet retail and wholesale food and beverage sectors. The healthcare equipment and services industry increased $3.4 billion, or seven percent, primarily driven by bridge financing for acquisitions. Telecommunications services committed exposure decreased $2.1 billion, or 19 percent, primarily reflecting broadly distributed commitment reductions and paydowns.
 
The significant decline in oil prices since June 2014 has impacted and may continue to impact the financial performance of energy producers as well as energy equipment and service providers. While we did not experience material asset quality deterioration in our energy portfolio through December 31, 2014, the magnitude of the impact over time will depend upon the level and duration of future oil prices.
Our committed state and municipal exposure of $38.5 billion at December 31, 2014 consisted of $31.7 billion of commercial utilized exposure (including $19.1 billion of funded loans, $6.3 billion of SBLCs and $2.4 billion of derivative assets) and $6.8 billion of unfunded commercial exposure (primarily unfunded loan commitments and letters of credit) and is reported in the government and public education industry in Table 50. With the U.S. economy gradually strengthening, most state and local governments are experiencing improved fiscal conditions and continue to honor debt obligations as agreed. While historical default rates have been low, as part of our overall and ongoing risk management processes, we continually monitor these exposures through a rigorous review process. Additionally, internal communications are regularly circulated such that exposure levels are maintained in compliance with established concentration guidelines.


Table 50
Commercial Credit Exposure by Industry (1)


December 31
 
 
Commercial
Utilized
 
Total Commercial Committed
(Dollars in millions)
2014
 
2013
 
2014
 
2013
Diversified financials
$
63,306

 
$
76,673

 
$
103,528

 
$
118,092

Real estate (2)
53,834

 
54,336

 
76,153

 
76,418

Retailing
33,683

 
32,859

 
58,043

 
54,616

Capital goods
29,028

 
28,016

 
54,653

 
52,849

Healthcare equipment and services
32,923

 
30,828

 
52,450

 
49,063

Government and public education
42,095

 
40,253

 
49,937

 
48,322

Banking
42,330

 
41,399

 
48,353

 
48,078

Energy
23,830

 
19,739

 
47,667

 
41,156

Materials
23,664

 
22,384

 
45,821

 
42,699

Food, beverage and tobacco
16,131

 
14,437

 
34,465

 
30,541

Consumer services
21,657

 
21,080

 
33,269

 
34,217

Commercial services and supplies
17,997

 
19,770

 
30,451

 
32,007

Utilities
9,399

 
9,253

 
25,235

 
25,243

Transportation
17,538

 
15,280

 
24,541

 
22,595

Media
11,128

 
13,070

 
21,502

 
22,655

Individuals and trusts
16,749

 
14,864

 
21,195

 
18,681

Software and services
5,927

 
6,814

 
14,071

 
14,172

Pharmaceuticals and biotechnology
5,707

 
6,455

 
13,493

 
13,986

Technology hardware and equipment
5,489

 
6,166

 
12,350

 
12,733

Insurance, including monolines
5,204

 
5,926

 
11,252

 
12,203

Consumer durables and apparel
6,111

 
5,427

 
10,613

 
9,757

Automobiles and components
4,114

 
3,165

 
9,683

 
8,424

Telecommunication services
3,814

 
4,541

 
9,295

 
11,423

Food and staples retailing
3,848

 
3,950

 
7,418

 
7,909

Religious and social organizations
4,881

 
5,452

 
6,548

 
7,677

Other
6,255

 
5,357

 
10,415

 
8,309

Total commercial credit exposure by industry
$
506,642

 
$
507,494

 
$
832,401

 
$
823,825

Net credit default protection purchased on total commitments (3)


$
(7,302
)
 
$
(8,085
)
(1) 
Includes U.S. small business commercial exposure.
(2) 
Industries are viewed from a variety of perspectives to best isolate the perceived risks. For purposes of this table, the real estate industry is defined based on the borrowers’ or counterparties’ primary business activity using operating cash flows and primary source of repayment as key factors.
(3) 
Represents net notional credit protection purchased. For additional information, see Commercial Portfolio Credit Risk Management – Risk Mitigation on page 72.


Bank of America 2014     71


Monoline Exposure
Monoline exposure is reported in the insurance industry and managed under insurance portfolio industry limits. We have indirect exposure to monolines primarily in the form of guarantees supporting our loans, investment portfolios, securitizations and credit-enhanced securities as part of our public finance business, and other selected products. Such indirect exposure exists when we purchase credit protection from monolines to hedge all or a portion of the credit risk on certain credit exposures including loans and CDOs. We underwrite our public finance exposure by evaluating the underlying securities.
We also have indirect exposure to monolines in the form of guarantees supporting our mortgage and other loan sales. Indirect exposure may exist when credit protection was purchased from monolines to hedge all or a portion of the credit risk on certain mortgage and other loan exposures. A loss may occur when we are required to repurchase a loan due to a breach of the representations and warranties, and the market value of the loan has declined, or we are required to indemnify or provide recourse for a guarantor’s loss. For more information regarding our exposure to representations and warranties, see Off-Balance Sheet Arrangements and Contractual Obligations – Representations and Warranties on page 30 and Note 7 – Representations and Warranties Obligations and Corporate Guarantees to the Consolidated Financial Statements.
Table 51 presents the notional amount of our monoline derivative credit exposure, mark-to-market adjustment and the counterparty CVA. The notional amount of monoline exposure decreased $2.9 billion in 2014 due to terminations, paydowns and maturities of monoline contracts.


Table 51
Monoline Derivative Credit Exposures


December 31
(Dollars in millions)
2014
 
2013
Notional amount of monoline exposure
$
7,720

 
$
10,631


Mark-to-market
$
49

 
$
97

Counterparty credit valuation adjustment
(6
)
 
(15
)
Net mark-to-market
$
43

 
$
82


2014
 
2013
Gains (losses) from credit valuation changes
$
(2
)
 
$
73

Risk Mitigation
We purchase credit protection to cover the funded portion as well as the unfunded portion of certain credit exposures. To lower the cost of obtaining our desired credit protection levels, we may add credit exposure within an industry, borrower or counterparty group by selling protection.
At December 31, 2014 and 2013, net notional credit default protection purchased in our credit derivatives portfolio to hedge our funded and unfunded exposures for which we elected the fair value option, as well as certain other credit exposures, was $7.3 billion and $8.1 billion. We recorded net losses of $50 million and $356 million in 2014 and 2013 on these positions. The gains and losses on these instruments were offset by gains and losses on the related exposures. The VaR results for these exposures are included in the fair value option portfolio information in Table 61. For more information, see Trading Risk Management on page 80.
 
Tables 52 and 53 present the maturity profiles and the credit exposure debt ratings of the net credit default protection portfolio at December 31, 2014 and 2013.


Table 52
Net Credit Default Protection by Maturity


December 31
 
2014
 
2013
Less than or equal to one year
43
%
 
35
%
Greater than one year and less than or equal to five years
55

 
63

Greater than five years
2

 
2

Total net credit default protection
100
%
 
100
%


Table 53
Net Credit Default Protection by Credit Exposure Debt Rating


December 31
 
 
2014
 
2013
(Dollars in millions)
Net
Notional (1)
 
Percent of
Total
 
Net
Notional (1)
 
Percent of
Total
Ratings (2, 3)


AA
$

 
%
 
$
(7
)
 
0.1
 %
A
(1,310
)
 
17.9

 
(2,560
)
 
31.7

BBB
(4,207
)
 
57.6

 
(3,880
)
 
48.0

BB
(1,001
)
 
13.7

 
(1,137
)
 
14.1

B
(643
)
 
8.8

 
(452
)
 
5.6

CCC and below
(131
)
 
1.8

 
(115
)
 
1.4

NR (4)
(10
)
 
0.2

 
66

 
(0.9
)
Total net credit default protection
$
(7,302
)
 
100.0
%
 
$
(8,085
)
 
100.0
 %
(1) 
Represents net credit default protection (purchased) sold.
(2) 
Ratings are refreshed on a quarterly basis.
(3) 
Ratings of BBB- or higher are considered to meet the definition of investment grade.
(4) 
NR is comprised of index positions held and any names that have not been rated.
In addition to our net notional credit default protection purchased to cover the funded and unfunded portion of certain credit exposures, credit derivatives are used for market-making activities for clients and establishing positions intended to profit from directional or relative value changes. We execute the majority of our credit derivative trades in the OTC market with large, multinational financial institutions, including broker-dealers and, to a lesser degree, with a variety of other investors. Because these transactions are executed in the OTC market, we are subject to settlement risk. We are also subject to credit risk in the event that these counterparties fail to perform under the terms of these contracts. In most cases, credit derivative transactions are executed on a daily margin basis. Therefore, events such as a credit downgrade, depending on the ultimate rating level, or a breach of credit covenants would typically require an increase in the amount of collateral required by the counterparty, where applicable, and/or allow us to take additional protective measures such as early termination of all trades.
Table 54 presents the total contract/notional amount of credit derivatives outstanding and includes both purchased and written credit derivatives. The credit risk amounts are measured as net asset exposure by counterparty, taking into consideration all contracts with the counterparty. For more information on our written credit derivatives, see Note 2 – Derivatives to the Consolidated Financial Statements.


72     Bank of America 2014


The credit risk amounts discussed above and presented in Table 54 take into consideration the effects of legally enforceable master netting agreements, while amounts disclosed in Note 2 – Derivatives to the Consolidated Financial Statements are shown
 
on a gross basis. Credit risk reflects the potential benefit from offsetting exposure to non-credit derivative products with the same counterparties that may be netted upon the occurrence of certain events, thereby reducing our overall exposure.


Table 54
Credit Derivatives


December 31
 
 
2014
 
2013
(Dollars in millions)
Contract/
Notional
 
Credit Risk
 
Contract/
Notional
 
Credit Risk
Purchased credit derivatives:


Credit default swaps
$
1,094,796

 
$
3,833

 
$
1,305,090

 
$
6,042

Total return swaps/other
44,333

 
510

 
38,094

 
402

Total purchased credit derivatives
$
1,139,129

 
$
4,343

 
$
1,343,184

 
$
6,444

Written credit derivatives:


Credit default swaps
$
1,073,101

 
n/a

 
$
1,265,380

 
n/a

Total return swaps/other
61,031

 
n/a

 
63,407

 
n/a

Total written credit derivatives
$
1,134,132

 
n/a

 
$
1,328,787

 
n/a

n/a = not applicable
Counterparty Credit Risk Valuation Adjustments
We record counterparty credit risk valuation adjustments on certain derivative assets, including our credit default protection purchased, in order to properly reflect the credit risk of the counterparty, as presented in Table 55. We calculate CVA based on a modeled expected exposure that incorporates current market risk factors including changes in market spreads and non-credit related market factors that affect the value of a derivative. The exposure also takes into consideration credit mitigants such as legally enforceable master netting agreements and collateral. For additional information, see Note 2 – Derivatives to the Consolidated Financial Statements.


Table 55
Credit Valuation Gains and Losses


Gains (Losses)
2014
 
2013
(Dollars in millions)
Gross
Hedge
Net
 
Gross
Hedge
Net
Credit valuation
$
(22
)
$
213

$
191

 
$
738

$
(834
)
$
(96
)
Non-U.S. Portfolio
Our non-U.S. credit and trading portfolios are subject to country risk. We define country risk as the risk of loss from unfavorable economic and political conditions, currency fluctuations, social instability and changes in government policies. A risk management framework is in place to measure, monitor and manage non-U.S. risk and exposures. Management oversight of country risk, including cross-border risk, is the responsibility of a subcommittee of the MRC. In addition to the direct risk of doing business in a country, we also are exposed to indirect country risks (e.g., related to the collateral received on secured financing transactions or related to client clearing activities). These indirect exposures are managed in the normal course of business through credit, market and operational risk governance, rather than through country risk governance.
 
Table 56 presents our total non-U.S. exposure by region at December 31, 2014 and 2013. Non-U.S. exposure is presented on an internal risk management basis and includes sovereign and non-sovereign credit exposure, securities and other investments issued by or domiciled in countries other than the U.S. The risk assignments by country can be adjusted for external guarantees and certain collateral types. Exposures that are subject to external guarantees are reported under the country of the guarantor. Exposures with tangible collateral are reflected in the country where the collateral is held. For securities received, other than cross-border resale agreements, outstandings are assigned to the domicile of the issuer of the securities.


Table 56
Total Non-U.S. Exposure by Region


December 31
 
 
2014
 
2013
(Dollars in millions)
Amount
 
Percent of
Total
 
Amount
 
Percent of
Total
Europe
$
129,573

 
49
%
 
$
133,303

 
53
%
Asia Pacific
78,792

 
30

 
69,266

 
27

Latin America
23,403

 
9

 
21,723

 
9

Middle East and Africa
10,801

 
4

 
8,691

 
3

Other (1)
22,701

 
8

 
20,866

 
8

Total
$
265,270

 
100
%
 
$
253,849

 
100
%
(1) 
Other includes Canada exposure of $20.4 billion and $19.8 billion at December 31, 2014 and 2013.
Our total non-U.S. exposure was $265.3 billion at December 31, 2014, an increase of $11.4 billion from December 31, 2013. The increase in non-U.S. exposure was driven by growth in Asia Pacific and Latin America exposures, partially offset by a reduction in Europe. Our non-U.S. exposure remained concentrated in Europe which accounted for $129.6 billion, or 49 percent of total non-U.S. exposure. The European exposure was mostly in Western Europe and was distributed across a variety of industries.


Bank of America 2014     73


Table 57 presents our 20 largest non-U.S. country exposures. These exposures accounted for 88 percent of our total non-U.S. exposure at both December 31, 2014 and 2013. Net country exposure for these 20 countries increased $13.6 billion in 2014 driven by higher funded and unfunded loans and loan equivalents exposure in Japan and Hong Kong, increased derivatives exposure in the United Kingdom, Japan, Hong Kong and Germany, and increased trading securities exposure in the United Kingdom, Italy and India. These increases were partially offset by reductions in funded and unfunded loans and loan equivalents exposure in Russia, the United Kingdom, Australia and Italy, and decreases in securities exposure in Germany and Japan.
Funded loans and loan equivalents include loans, leases, and other extensions of credit and funds, including letters of credit and due from placements, which have not been reduced by collateral, hedges or credit default protection. Funded loans and loan equivalents are reported net of charge-offs but prior to any allowance for loan and lease losses. Unfunded commitments are the undrawn portion of legally binding commitments related to loans and loan equivalents.
Net counterparty exposure includes the fair value of derivatives, including the counterparty risk associated with credit default
 
swaps (CDS), and secured financing transactions. Derivatives exposures are presented net of collateral, which is predominantly cash, pledged under legally enforceable master netting agreements. Secured financing transaction exposures are presented net of eligible cash or securities pledged as collateral.
Securities and other investments are carried at fair value and long securities exposures are netted against short exposures with the same underlying issuer to, but not below, zero (i.e., negative issuer exposures are reported as zero). Other investments include our GPI portfolio and strategic investments.
Net country exposure represents country exposure less hedges and credit default protection purchased, net of credit default protection sold. We hedge certain of our country exposures with credit default protection primarily in the form of single-name, as well as indexed and tranched CDS. The exposures associated with these hedges represent the amount that would be realized upon the isolated default of an individual issuer in the relevant country assuming a zero recovery rate for that individual issuer, and are calculated based on the CDS notional amount adjusted for any fair value receivable or payable. Changes in the assumption of an isolated default can produce different results in a particular tranche.


Table 57
Top 20 Non-U.S. Countries Exposure


(Dollars in millions)
Funded Loans and Loan Equivalents
 
Unfunded Loan Commitments
 
Net Counterparty Exposure
 
Securities/
Other
Investments
 
Country Exposure at December 31
2014
 
Hedges and Credit Default Protection
 
Net Country Exposure at December 31
2014
 
Increase (Decrease) from December 31
2013
United Kingdom
$
23,727

 
$
11,921

 
$
6,373

 
$
7,769

 
$
49,790

 
$
(4,243
)
 
$
45,547

 
$
1,961

Canada
6,388

 
6,847

 
1,950

 
5,173

 
20,358

 
(1,818
)
 
18,540

 
129

Japan
12,518

 
506

 
3,589

 
1,453

 
18,066

 
(1,332
)
 
16,734

 
8,619

Brazil
9,923

 
727

 
511

 
4,183

 
15,344

 
(360
)
 
14,984

 
1,352

Germany
5,341

 
5,840

 
3,477

 
1,489

 
16,147

 
(3,588
)
 
12,559

 
(159
)
China
10,238

 
725

 
556

 
1,483

 
13,002

 
(710
)
 
12,292

 
(629
)
India
5,631

 
507

 
496

 
4,126

 
10,760

 
(174
)
 
10,586

 
335

France
3,246

 
5,117

 
1,495

 
5,038

 
14,896

 
(4,458
)
 
10,438

 
275

Hong Kong
6,413

 
616

 
924

 
691

 
8,644

 
(36
)
 
8,608

 
3,251

Netherlands
2,928

 
3,392

 
675

 
2,275

 
9,270

 
(1,135
)
 
8,135

 
500

Australia
3,237

 
1,908

 
826

 
2,235

 
8,206

 
(533
)
 
7,673

 
(324
)
Switzerland
2,493

 
3,663

 
1,018

 
622

 
7,796

 
(1,265
)
 
6,531

 
985

South Korea
3,559

 
707

 
534

 
2,327

 
7,127

 
(678
)
 
6,449

 
14

Italy
2,545

 
1,596

 
2,484

 
1,752

 
8,377

 
(2,978
)
 
5,399

 
197

Mexico
3,038

 
807

 
245

 
566

 
4,656

 
(385
)
 
4,271

 
272

Singapore
1,984

 
203

 
673

 
1,206

 
4,066

 
(62
)
 
4,004

 
175

Taiwan
2,248


437

 
1,180

 
3,865


3,865

 
(207
)
Spain
2,296

 
994

 
296

 
1,022

 
4,608

 
(992
)
 
3,616

 
213

Russia
4,124

 
80

 
732

 
66

 
5,002

 
(1,393
)
 
3,609

 
(3,113
)
Turkey
2,695

 
75

 
15

 
185

 
2,970

 
(482
)
 
2,488

 
(205
)
Total top 20 non-U.S. countries exposure
$
114,572

 
$
46,231

 
$
27,306

 
$
44,841

 
$
232,950

 
$
(26,622
)
 
$
206,328

 
$
13,641

Russian intervention in Ukraine during 2014 significantly increased regional geopolitical tensions. The Russian economy is slowing due to the negative impacts of weak oil prices, ongoing economic sanctions and high interest rates resulting from Russian central bank actions taken to counter ruble depreciation. Net exposure to Russia was reduced to $3.6 billion at December 31, 2014, concentrated in oil and gas companies and commercial banks. Our exposure to Ukraine at December 31, 2014 was minimal. In response to Russian actions, U.S. and European governments have imposed sanctions on a limited number of Russian individuals and business entities. Geopolitical and
 
economic conditions remain fluid with potential for further escalation of tensions, severity of sanctions against Russian interests, sustained low oil prices and rating agency downgrades.
Certain European countries, including Italy, Spain, Ireland, Greece and Portugal, have experienced varying degrees of financial stress in recent years. While market conditions have improved in Europe, policymakers continue to address fundamental challenges of competitiveness, growth, deflation and high unemployment. A return of political stress or financial instability in these countries could disrupt financial markets and have a detrimental impact on global economic conditions and sovereign and non-sovereign debt


74     Bank of America 2014


in these countries. Net exposure at December 31, 2014 to Italy and Spain was $5.4 billion and $3.6 billion as presented in Table 57. For the remaining three countries noted above, net exposure at December 31, 2014 was $2.1 billion which primarily relates to Ireland. We expect to continue to support client activities in the region and our exposures may vary over time as we monitor the situation and manage our risk profile.
Table 58 presents countries where total cross-border exposure exceeded one percent of our total assets. At December 31, 2014, the United Kingdom and France were the only countries where total cross-border exposure exceeded one percent of our total assets. At December 31, 2014, Germany had total cross-border exposure of $15.9 billion representing 0.76 percent of our total assets. No other countries had total cross-border exposure that exceeded 0.75 percent of our total assets at December 31, 2014.
 
Cross-border exposures in Table 58 are calculated using Federal Financial Institutions Examination Council (FFIEC) guidelines and not our internal risk management view; therefore, exposures are not comparable between Tables 57 and 58. Exposure includes cross-border claims by our non-U.S. offices including loans, acceptances, time deposits placed, trading account assets, securities, derivative assets, other interest-earning investments and other monetary assets. Amounts also include unfunded commitments, letters of credit and financial guarantees, and the notional amount of cash loaned under secured financing transactions. Sector definitions are consistent with FFIEC reporting requirements for preparing the Country Exposure Report.


Table 58
Total Cross-border Exposure Exceeding One Percent of Total Assets


(Dollars in millions)
December 31
 
Public Sector
 
Banks
 
Private Sector
 
Cross-border
Exposure
 
Exposure as a
Percent of
Total Assets
United Kingdom
2014
 
$
11

 
$
2,056

 
$
34,595

 
$
36,662

 
1.74
%
 
2013
 
6

 
7,027

 
32,466

 
39,499

 
1.88

France (1)
2014
 
4,479

 
2,631

 
14,368

 
21,478

 
1.02

(1) 
At December 31, 2013, total cross-border exposure for France was $17.8 billion, representing 0.85 percent of total assets.
Provision for Credit Losses
The provision for credit losses decreased $1.3 billion to $2.3 billion in 2014 compared to 2013. The provision for credit losses was $2.1 billion lower than net charge-offs for 2014, resulting in a reduction in the allowance for credit losses. This compared to a reduction of $4.3 billion in the allowance for credit losses for 2013. We expect reserve releases in 2015 to moderate when compared to 2014.
The provision for credit losses for the consumer portfolio decreased $533 million to $1.5 billion in 2014 compared to 2013. The decrease was primarily due to continued improvement in the consumer real estate portfolios as a result of increased home prices, improved delinquencies and continued loan balance run-off, as well as improvement in the credit card portfolios primarily driven by lower unemployment levels. These were partially offset by a lower provision benefit related to the PCI loan portfolio of $31 million in 2014 compared to a benefit of $707 million in 2013. Also offsetting the improvement was $400 million of additional costs associated with the consumer relief portion of the DoJ Settlement. For more information on the DoJ Settlement, see Off-Balance Sheet Arrangements and Contractual Obligations – Servicing, Foreclosure and Other Mortgage Matters on page 33.
The provision for credit losses for the commercial portfolio, including unfunded lending commitments, decreased $748 million to $793 million in 2014 compared to 2013 driven by improved asset quality in 2014.

 
Allowance for Credit Losses
Allowance for Loan and Lease Losses
The allowance for loan and lease losses is comprised of two components. The first component covers nonperforming commercial loans and TDRs. The second component covers loans and leases on which there are incurred losses that are not yet individually identifiable, as well as incurred losses that may not be represented in the loss forecast models. We evaluate the adequacy of the allowance for loan and lease losses based on the total of these two components, each of which is described in more detail below. The allowance for loan and lease losses excludes LHFS and loans accounted for under the fair value option as the fair value reflects a credit risk component.
The first component of the allowance for loan and lease losses covers both nonperforming commercial loans and all TDRs within the consumer and commercial portfolios. These loans are subject to impairment measurement based on the present value of projected future cash flows discounted at the loan’s original effective interest rate, or in certain circumstances, impairment may also be based upon the collateral value or the loan’s observable market price if available. Impairment measurement for the renegotiated consumer credit card, small business credit card and unsecured consumer TDR portfolios is based on the present value of projected cash flows discounted using the average portfolio contractual interest rate, excluding promotionally priced loans, in effect prior to restructuring. For purposes of computing this specific loss component of the allowance, larger impaired loans are evaluated individually and smaller impaired loans are evaluated as a pool using historical experience for the respective product types and risk ratings of the loans.


Bank of America 2014     75


The second component of the allowance for loan and lease losses covers the remaining consumer and commercial loans and leases that have incurred losses that are not yet individually identifiable. The allowance for consumer and certain homogeneous commercial loan and lease products is based on aggregated portfolio evaluations, generally by product type. Loss forecast models are utilized that consider a variety of factors including, but not limited to, historical loss experience, estimated defaults or foreclosures based on portfolio trends, delinquencies, economic trends and credit scores. Our consumer real estate loss forecast model estimates the portion of loans that will default based on individual loan attributes, the most significant of which are refreshed LTV or CLTV, and borrower credit score as well as vintage and geography, all of which are further broken down into current delinquency status. Additionally, we incorporate the delinquency status of underlying first-lien loans on our junior-lien home equity portfolio in our allowance process. Incorporating refreshed LTV and CLTV into our probability of default allows us to factor the impact of changes in home prices into our allowance for loan and lease losses. These loss forecast models are updated on a quarterly basis to incorporate information reflecting the current economic environment. As of December 31, 2014, the loss forecast process resulted in reductions in the allowance for all major consumer portfolios compared to December 31, 2013.
The allowance for commercial loan and lease losses is established by product type after analyzing historical loss experience, internal risk rating, current economic conditions, industry performance trends, geographic and obligor concentrations within each portfolio and any other pertinent information. The statistical models for commercial loans are generally updated annually and utilize our historical database of actual defaults and other data. The loan risk ratings and composition of the commercial portfolios used to calculate the allowance are updated quarterly to incorporate the most recent data reflecting the current economic environment. For risk-rated commercial loans, we estimate the probability of default and the LGD based on our historical experience of defaults and credit losses. Factors considered when assessing the internal risk rating include the value of the underlying collateral, if applicable, the industry in which the obligor operates, the obligor’s liquidity and other financial indicators, and other quantitative and qualitative factors relevant to the obligor’s credit risk. As of December 31, 2014, the allowance increased for all major commercial portfolios compared to December 31, 2013.
Also included within the second component of the allowance for loan and lease losses are reserves to cover losses that are incurred but, in our assessment, may not be adequately represented in the historical loss data used in the loss forecast models. For example, factors that we consider include, among others, changes in lending policies and procedures, changes in economic and business conditions, changes in the nature and size of the portfolio, changes in portfolio concentrations, changes in the volume and severity of past due loans and nonaccrual loans, the effect of external factors such as competition, and legal and regulatory requirements. We also consider factors that are applicable to unique portfolio segments. For example, we consider the risk of uncertainty in our loss forecasting models related to junior-lien home equity loans that are current, but have first-lien
 
loans that we do not service that are 30 days or more past due. In addition, we consider the increased risk of default associated with our interest-only loans that have yet to enter the amortization period. Further, we consider the inherent uncertainty in mathematical models that are built upon historical data.
During 2014, the factors that impacted the allowance for loan and lease losses included overall improvements in the credit quality of the portfolios driven by continuing improvements in the U.S. economy and housing and labor markets, continuing proactive credit risk management initiatives and the impact of recent higher credit quality originations. Additionally, the resolution of uncertainties through current recognition of net charge-offs has impacted the amount of reserve needed in certain portfolios. Evidencing the improvements in the U.S. economy and housing and labor markets are modest growth in consumer spending, improvements in unemployment levels, a decrease in the absolute level and our share of national consumer bankruptcy filings, and a rise in both residential building activity and overall home prices. In addition to these improvements, paydowns, charge-offs, sales, returns to performing status and upgrades out of criticized continued to outpace new nonaccrual loans and reservable criticized commercial loans.
We monitor differences between estimated and actual incurred loan and lease losses. This monitoring process includes periodic assessments by senior management of loan and lease portfolios and the models used to estimate incurred losses in those portfolios.
Additions to, or reductions of, the allowance for loan and lease losses generally are recorded through charges or credits to the provision for credit losses. Credit exposures deemed to be uncollectible are charged against the allowance for loan and lease losses. Recoveries of previously charged off amounts are credited to the allowance for loan and lease losses.
The allowance for loan and lease losses for the consumer portfolio, as presented in Table 60, was $10.0 billion at December 31, 2014, a decrease of $3.4 billion from December 31, 2013. The decrease was primarily in the residential mortgage and home equity portfolios due to increased home prices, as evidenced by improving LTV statistics as presented in Tables 28 and 30, improved delinquencies and a decrease in consumer loan balances. Further, the residential mortgage and home equity allowance declined due to write-offs in our PCI loan portfolio. These write-offs decreased the PCI valuation allowance included as part of the allowance for loan and lease losses.
The decrease in the allowance related to the U.S. credit card and unsecured consumer lending portfolios in Consumer Banking was primarily due to improvement in delinquencies and bankruptcies. For example, in the U.S. credit card portfolio, accruing loans 30 days or more past due decreased to $1.7 billion at December 31, 2014 from $2.1 billion (to 1.85 percent from 2.25 percent of outstanding U.S. credit card loans) at December 31, 2013, and accruing loans 90 days or more past due decreased to $866 million at December 31, 2014 from $1.1 billion (to 0.94 percent from 1.14 percent of outstanding U.S. credit card loans) at December 31, 2013. See Tables 25, 26, 35 and 37 for additional details on key credit statistics for the credit card and other unsecured consumer lending portfolios.


76     Bank of America 2014


The allowance for loan and lease losses for the commercial portfolio, as presented in Table 60, was $4.4 billion at December 31, 2014, an increase of $432 million from December 31, 2013. The commercial utilized reservable criticized exposure decreased to $11.6 billion at December 31, 2014 from $12.9 billion (to 2.74 percent from 3.02 percent of total commercial utilized reservable exposure) at December 31, 2013. Nonperforming commercial loans decreased $196 million from December 31, 2013 to $1.1 billion (to 0.29 percent from 0.34 percent of outstanding commercial loans) at December 31, 2014. See Tables 41, 42 and 44 for additional details on key commercial credit statistics.
The allowance for loan and lease losses as a percentage of total loans and leases outstanding was 1.65 percent at
 
December 31, 2014 compared to 1.90 percent at December 31, 2013. The decrease in the ratio was primarily due to improved credit quality driven by improved economic conditions and write-offs in the PCI loan portfolio. The December 31, 2014 and 2013 ratios above include the PCI loan portfolio. Excluding the PCI loan portfolio, the allowance for loan and lease losses as a percentage of total loans and leases outstanding was 1.50 percent and 1.67 percent at December 31, 2014 and 2013.
Table 59 presents a rollforward of the allowance for credit losses, which includes the allowance for loan and lease losses and the reserve for unfunded lending commitments, for 2014 and 2013.


Table 59
Allowance for Credit Losses


(Dollars in millions)
2014
 
2013
Allowance for loan and lease losses, January 1
$
17,428

 
$
24,179

Loans and leases charged off


Residential mortgage
(855
)
 
(1,508
)
Home equity
(1,364
)
 
(2,258
)
U.S. credit card
(3,068
)
 
(4,004
)
Non-U.S. credit card
(357
)
 
(508
)
Direct/Indirect consumer
(456
)
 
(710
)
Other consumer
(268
)
 
(273
)
Total consumer charge-offs
(6,368
)
 
(9,261
)
U.S. commercial (1)
(584
)
 
(774
)
Commercial real estate
(29
)
 
(251
)
Commercial lease financing
(10
)
 
(4
)
Non-U.S. commercial
(35
)
 
(79
)
Total commercial charge-offs
(658
)
 
(1,108
)
Total loans and leases charged off
(7,026
)
 
(10,369
)
Recoveries of loans and leases previously charged off


Residential mortgage
969

 
424

Home equity
457

 
455

U.S. credit card
430

 
628

Non-U.S. credit card
115

 
109

Direct/Indirect consumer
287

 
365

Other consumer
39

 
39

Total consumer recoveries
2,297

 
2,020

U.S. commercial (2)
214

 
287

Commercial real estate
112

 
102

Commercial lease financing
19

 
29

Non-U.S. commercial
1

 
34

Total commercial recoveries
346

 
452

Total recoveries of loans and leases previously charged off
2,643

 
2,472

Net charge-offs
(4,383
)
 
(7,897
)
Write-offs of PCI loans
(810
)
 
(2,336
)
Provision for loan and lease losses
2,231

 
3,574

Other (3)
(47
)
 
(92
)
Allowance for loan and lease losses, December 31
14,419

 
17,428

Reserve for unfunded lending commitments, January 1
484

 
513

Provision for unfunded lending commitments
44

 
(18
)
Other

 
(11
)
Reserve for unfunded lending commitments, December 31
528

 
484

Allowance for credit losses, December 31
$
14,947

 
$
17,912

(1) 
Includes U.S. small business commercial charge-offs of $345 million and $457 million in 2014 and 2013.
(2) 
Includes U.S. small business commercial recoveries of $63 million and $98 million in 2014 and 2013.
(3) 
Primarily represents the net impact of portfolio sales, consolidations and deconsolidations, and foreign currency translation adjustments.


Bank of America 2014     77


Table 59
Allowance for Credit Losses (continued)


(Dollars in millions)
2014
 
2013
Loan and allowance ratios:


Loans and leases outstanding at December 31 (4)
$
872,710

 
$
918,191

Allowance for loan and lease losses as a percentage of total loans and leases outstanding at December 31 (4)
1.65
%
 
1.90
%
Consumer allowance for loan and lease losses as a percentage of total consumer loans and leases outstanding at December 31 (5)
2.05

 
2.53

Commercial allowance for loan and lease losses as a percentage of total commercial loans and leases outstanding at December 31 (6)
1.15

 
1.03

Average loans and leases outstanding (4)
$
894,001

 
$
909,127

Net charge-offs as a percentage of average loans and leases outstanding (4, 7)
0.49
%
 
0.87
%
Net charge-offs and PCI write-offs as a percentage of average loans and leases outstanding (4)
0.58

 
1.13

Allowance for loan and lease losses as a percentage of total nonperforming loans and leases at December 31 (4, 8)
121

 
102

Ratio of the allowance for loan and lease losses at December 31 to net charge-offs (7)
3.29

 
2.21

Ratio of the allowance for loan and lease losses at December 31 to net charge-offs and PCI write-offs
2.78

 
1.70

Amounts included in allowance for loan and lease losses for loans and leases that are excluded from nonperforming loans and leases at December 31 (9)
$
5,944

 
$
7,680

Allowance for loan and lease losses as a percentage of total nonperforming loans and leases, excluding the allowance for loan and lease losses for loans and leases that are excluded from nonperforming loans and leases at December 31 (4, 9)
71
%
 
57
%
Loan and allowance ratios excluding PCI loans and the related valuation allowance: (10)


Allowance for loan and lease losses as a percentage of total loans and leases outstanding at December 31 (4)
1.50
%
 
1.67
%
Consumer allowance for loan and lease losses as a percentage of total consumer loans and leases outstanding at December 31 (5)
1.79

 
2.17

Net charge-offs as a percentage of average loans and leases outstanding (4)
0.50

 
0.90

Allowance for loan and lease losses as a percentage of total nonperforming loans and leases at December 31 (4, 8)
107

 
87

Ratio of the allowance for loan and lease losses at December 31 to net charge-offs
2.91

 
1.89

(4) 
Outstanding loan and lease balances and ratios do not include loans accounted for under the fair value option of $8.7 billion and $10.0 billion at December 31, 2014 and 2013. Average loans accounted for under the fair value option were $9.9 billion and $9.5 billion in 2014 and 2013.
(5) 
Excludes consumer loans accounted for under the fair value option of $2.1 billion and $2.2 billion at December 31, 2014 and 2013.
(6) 
Excludes commercial loans accounted for under the fair value option of $6.6 billion and $7.9 billion at December 31, 2014 and 2013.
(7) 
Net charge-offs exclude $810 million and $2.3 billion of write-offs in the PCI loan portfolio in 2014 and 2013. These write-offs decreased the PCI valuation allowance included as part of the allowance for loan and lease losses. For more information on PCI write-offs, see Consumer Portfolio Credit Risk Management – Purchased Credit-impaired Loan Portfolio on page 58.
(8) 
For more information on our definition of nonperforming loans, see pages 62 and 69.
(9) 
Primarily includes amounts allocated to U.S. credit card and unsecured consumer lending portfolios in Consumer Banking, PCI loans and the non-U.S. credit card portfolio in All Other.
(10) 
For more information on the PCI loan portfolio and the valuation allowance for PCI loans, see Note 4 – Outstanding Loans and Leases and Note 5 – Allowance for Credit Losses to the Consolidated Financial Statements.
For reporting purposes, we allocate the allowance for credit losses across products. However, the allowance is generally available to absorb any credit losses without restriction. Table 60 presents our allocation by product type.


Table 60
Allocation of the Allowance for Credit Losses by Product Type


December 31, 2014
 
December 31, 2013
(Dollars in millions)
Amount
 
Percent of
Total
 
Percent of
Loans and
Leases
Outstanding (1)
 
Amount
 
Percent of
Total
 
Percent of
Loans and
Leases
Outstanding (1)
Allowance for loan and lease losses


Residential mortgage
$
2,900

 
20.11
%
 
1.34
%
 
$
4,084

 
23.43
%
 
1.65
%
Home equity
3,035

 
21.05

 
3.54

 
4,434

 
25.44

 
4.73

U.S. credit card
3,320

 
23.03

 
3.61

 
3,930

 
22.55

 
4.26

Non-U.S. credit card
369

 
2.56

 
3.53

 
459

 
2.63

 
3.98

Direct/Indirect consumer
299

 
2.07

 
0.37

 
417

 
2.39

 
0.51

Other consumer
59

 
0.41

 
3.15

 
99

 
0.58

 
5.02

Total consumer
9,982

 
69.23

 
2.05

 
13,423

 
77.02

 
2.53

U.S. commercial (2)
2,619

 
18.16

 
1.12

 
2,394

 
13.74

 
1.06

Commercial real estate
1,016

 
7.05

 
2.13

 
917

 
5.26

 
1.91

Commercial lease financing
153

 
1.06

 
0.62

 
118

 
0.68

 
0.47

Non-U.S. commercial
649

 
4.50

 
0.81

 
576

 
3.30

 
0.64

Total commercial (3)
4,437

 
30.77

 
1.15

 
4,005

 
22.98

 
1.03

Allowance for loan and lease losses (4)
14,419

 
100.00
%
 
1.65

 
17,428

 
100.00
%
 
1.90

Reserve for unfunded lending commitments
528


484


Allowance for credit losses
$
14,947


$
17,912


(1) 
Ratios are calculated as allowance for loan and lease losses as a percentage of loans and leases outstanding excluding loans accounted for under the fair value option. Consumer loans accounted for under the fair value option included residential mortgage loans of $1.9 billion and $2.0 billion and home equity loans of $196 million and $147 million at December 31, 2014 and 2013. Commercial loans accounted for under the fair value option included U.S. commercial loans of $1.9 billion and $1.5 billion and non-U.S. commercial loans of $4.7 billion and $6.4 billion at December 31, 2014 and 2013.
(2) 
Includes allowance for loan and lease losses for U.S. small business commercial loans of $536 million and $462 million at December 31, 2014 and 2013.
(3) 
Includes allowance for loan and lease losses for impaired commercial loans of $159 million and $277 million at December 31, 2014 and 2013.
(4) 
Includes $1.7 billion and $2.5 billion of valuation allowance presented with the allowance for loan and lease losses related to PCI loans at December 31, 2014 and 2013.

78     Bank of America 2014


Reserve for Unfunded Lending Commitments
In addition to the allowance for loan and lease losses, we also estimate probable losses related to unfunded lending commitments such as letters of credit, financial guarantees, unfunded bankers’ acceptances and binding loan commitments, excluding commitments accounted for under the fair value option. Unfunded lending commitments are subject to the same assessment as funded loans, including estimates of probability of default and LGD. Due to the nature of unfunded commitments, the estimate of probable losses must also consider utilization. To estimate the portion of these undrawn commitments that is likely to be drawn by a borrower at the time of estimated default, analyses of the Corporation’s historical experience are applied to the unfunded commitments to estimate the funded EAD. The expected loss for unfunded lending commitments is the product of the probability of default, the LGD and the EAD, adjusted for any qualitative factors including economic uncertainty and inherent imprecision in models.
The reserve for unfunded lending commitments was $528 million at December 31, 2014, an increase of $44 million from December 31, 2013. The increase was driven by increases in expected loss.
Market Risk Management
Market risk is the risk that values of assets and liabilities or revenues will be adversely affected by changes in market conditions. This risk is inherent in the financial instruments associated with our operations, primarily within our Global Markets segment. We are also exposed to these risks in other areas of the Corporation (e.g., our ALM activities). In the event of market stress, these risks could have a material impact on the results of the Corporation. For additional information, see Interest Rate Risk Management for Non-trading Activities on page 85.
Our traditional banking loan and deposit products are non-trading positions and are generally reported at amortized cost for assets or the amount owed for liabilities (historical cost). However, these positions are still subject to changes in economic value based on varying market conditions, with one of the primary risks being changes in the levels of interest rates. The risk of adverse changes in the economic value of our non-trading positions arising from changes in interest rates is managed through our ALM activities. We have elected to account for certain assets and liabilities under the fair value option.
Our trading positions are reported at fair value with changes reflected in income. Trading positions are subject to various changes in market-based risk factors. The majority of this risk is generated by our activities in the interest rate, foreign exchange, credit, equity and commodities markets. In addition, the values of assets and liabilities could change due to market liquidity, correlations across markets and expectations of market volatility. We seek to manage these risk exposures by using a variety of techniques that encompass a broad range of financial instruments. The key risk management techniques are discussed in more detail in the Trading Risk Management section.
A subcommittee has been designated by the MRC as the primary risk governance authority for Global Markets (Global Markets, or GM subcommittee). The GM subcommittee’s focus is to take a forward-looking view of the primary credit, market and operational risks impacting Global Markets and prioritize those that need a proactive risk mitigation strategy.
 
Global Markets Risk Management is responsible for providing senior management with a clear and comprehensive understanding of the trading risks to which the Corporation is exposed. These responsibilities include ownership of market risk policy, developing and maintaining quantitative risk models, calculating aggregated risk measures, establishing and monitoring position limits consistent with risk appetite, conducting daily reviews and analysis of trading inventory, approving material risk exposures and fulfilling regulatory requirements. Market risks that impact businesses outside of Global Markets are monitored and governed by their respective governance functions.
Quantitative risk models, such as VaR, are an essential component in evaluating the market risks within a portfolio. A subcommittee of the MRC is responsible for providing management oversight and approval of model risk management and governance (Risk Management, or RM subcommittee). The RM subcommittee defines model risk standards, consistent with the Corporation’s risk framework and risk appetite, prevailing regulatory guidance and industry best practice. Models must meet certain validation criteria, including effective challenge of the model development process and a sufficient demonstration of developmental evidence incorporating a comparison of alternative theories and approaches. The RM subcommittee ensures model standards are consistent with model risk requirements and monitors the effective challenge in the model validation process across the Corporation. In addition, the relevant stakeholders must agree on any required actions or restrictions to the models and maintain a stringent monitoring process to ensure continued compliance.
For more information on the fair value of certain financial assets and liabilities, see Note 20 – Fair Value Measurements to the Consolidated Financial Statements.
Interest Rate Risk
Interest rate risk represents exposures to instruments whose values vary with the level or volatility of interest rates. These instruments include, but are not limited to, loans, debt securities, certain trading-related assets and liabilities, deposits, borrowings and derivatives. Hedging instruments used to mitigate these risks include derivatives such as options, futures, forwards and swaps.
Foreign Exchange Risk
Foreign exchange risk represents exposures to changes in the values of current holdings and future cash flows denominated in currencies other than the U.S. Dollar. The types of instruments exposed to this risk include investments in non-U.S. subsidiaries, foreign currency-denominated loans and securities, future cash flows in foreign currencies arising from foreign exchange transactions, foreign currency-denominated debt and various foreign exchange derivatives whose values fluctuate with changes in the level or volatility of currency exchange rates or non-U.S. interest rates. Hedging instruments used to mitigate this risk include foreign exchange options, currency swaps, futures, forwards, and foreign currency-denominated debt and deposits.
Mortgage Risk
Mortgage risk represents exposures to changes in the values of mortgage-related instruments. The values of these instruments are sensitive to prepayment rates, mortgage rates, agency debt ratings, default, market liquidity, government participation and interest rate volatility. Our exposure to these instruments takes


Bank of America 2014     79


several forms. First, we trade and engage in market-making activities in a variety of mortgage securities including whole loans, pass-through certificates, commercial mortgages and collateralized mortgage obligations including CDOs using mortgages as underlying collateral. Second, we originate a variety of MBS which involves the accumulation of mortgage-related loans in anticipation of eventual securitization. Third, we may hold positions in mortgage securities and residential mortgage loans as part of the ALM portfolio. Fourth, we create MSRs as part of our mortgage origination activities. For more information on MSRs, see Note 1 – Summary of Significant Accounting Principles and Note 23 – Mortgage Servicing Rights to the Consolidated Financial Statements. Hedging instruments used to mitigate this risk include derivatives such as options, swaps, futures and forwards. For additional information, see Mortgage Banking Risk Management on page 88.
Equity Market Risk
Equity market risk represents exposures to securities that represent an ownership interest in a corporation in the form of domestic and foreign common stock or other equity-linked instruments. Instruments that would lead to this exposure include, but are not limited to, the following: common stock, exchange-traded funds, American Depositary Receipts, convertible bonds, listed equity options (puts and calls), OTC equity options, equity total return swaps, equity index futures and other equity derivative products. Hedging instruments used to mitigate this risk include options, futures, swaps, convertible bonds and cash positions.
Commodity Risk
Commodity risk represents exposures to instruments traded in the petroleum, natural gas, power and metals markets. These instruments consist primarily of futures, forwards, swaps and options. Hedging instruments used to mitigate this risk include options, futures and swaps in the same or similar commodity product, as well as cash positions.
Issuer Credit Risk
Issuer credit risk represents exposures to changes in the creditworthiness of individual issuers or groups of issuers. Our portfolio is exposed to issuer credit risk where the value of an asset may be adversely impacted by changes in the levels of credit spreads, by credit migration or by defaults. Hedging instruments used to mitigate this risk include bonds, CDS and other credit fixed-income instruments.
Market Liquidity Risk
Market liquidity risk represents the risk that the level of expected market activity changes dramatically and, in certain cases, may even cease. This exposes us to the risk that we will not be able to transact business and execute trades in an orderly manner which may impact our results. This impact could be further exacerbated if expected hedging or pricing correlations are compromised by disproportionate demand or lack of demand for certain instruments. We utilize various risk mitigating techniques as discussed in more detail in Trading Risk Management.

 
Trading Risk Management
To evaluate risk in our trading activities, we focus on the actual and potential volatility of revenues generated by individual positions as well as portfolios of positions. Various techniques and procedures are utilized to enable the most complete understanding of these risks. Quantitative measures of market risk are evaluated on a daily basis from a single position to the portfolio of the Corporation. These measures include sensitivities of positions to various market risk factors, such as the potential impact on revenue from a one basis point change in interest rates, and statistical measures utilizing both actual and hypothetical market moves, such as VaR and stress testing. Periods of extreme market stress influence the reliability of these techniques to varying degrees. Qualitative evaluations of market risk utilize the suite of quantitative risk measures while understanding each of their respective limitations. Additionally, risk managers independently evaluate the risk of the portfolios under the current market environment and potential future environments.
VaR is a common statistic used to measure market risk as it allows the aggregation of market risk factors, including the effects of portfolio diversification. A VaR model simulates the value of a portfolio under a range of scenarios in order to generate a distribution of potential gains and losses. VaR represents the loss a portfolio is not expected to exceed more than a certain number of times per period, based on a specified holding period, confidence level and window of historical data. We use one VaR model consistently across the trading portfolios and it uses a historical simulation approach based on a three-year window of historical data. Our primary VaR statistic is equivalent to a 99 percent confidence level. This means that for a VaR with a one-day holding period, there should not be losses in excess of VaR, on average, 99 out of 100 trading days.
Within any VaR model, there are significant and numerous assumptions that will differ from company to company. The accuracy of a VaR model depends on the availability and quality of historical data for each of the risk factors in the portfolio. A VaR model may require additional modeling assumptions for new products that do not have the necessary historical market data or for less liquid positions for which accurate daily prices are not consistently available. For positions with insufficient historical data for the VaR calculation, the process for establishing an appropriate proxy is based on fundamental and statistical analysis of the new product or less liquid position. This analysis identifies reasonable alternatives that replicate both the expected volatility and correlation to other market risk factors that the missing data would be expected to experience.
VaR may not be indicative of realized revenue volatility as changes in market conditions or in the composition of the portfolio can have a material impact on the results. In particular, the historical data used for the VaR calculation might indicate higher or lower levels of portfolio diversification than will be experienced. In order for the VaR model to reflect current market conditions, we update the historical data underlying our VaR model on a weekly basis, or more frequently during periods of market stress, and regularly review the assumptions underlying the model. A relatively minor portion of risks related to our trading positions are not included in VaR. These risks are reviewed as part of our ICAAP.


80     Bank of America 2014


Global Markets Risk Management continually reviews, evaluates and enhances our VaR model so that it reflects the material risks in our trading portfolio. Changes to the VaR model are reviewed and approved prior to implementation and any material changes are reported to management through the appropriate management committees.
Trading limits on quantitative risk measures, including VaR, are monitored on a daily basis. These trading limits are independently set by Global Markets Risk Management and reviewed on a regular basis to ensure they remain relevant and within our overall risk appetite for market risks. Trading limits are reviewed in the context of market liquidity, volatility and strategic business priorities. Trading limits are set at both a granular level to ensure extensive coverage of risks as well as at aggregated portfolios to account for correlations among risk factors. All trading limits are approved at least annually and the MRC has given authority to the GM subcommittee to approve changes to trading limits throughout the year. Approved trading limits are stored and tracked in a centralized limits management system. Trading limit excesses are communicated to management for review. Certain quantitative market risk measures and corresponding limits have been identified as critical in the Corporation’s Risk Appetite Statement. These risk appetite limits are monitored on a daily basis and are approved at least annually by the ERC and the Board.
In periods of market stress, the GM subcommittee members communicate daily to discuss losses, key risk positions and any limit excesses. As a result of this process, the businesses may selectively reduce risk.
Market risk VaR for trading activities as presented in Table 61 differs from VaR used for regulatory capital calculations (regulatory VaR). The VaR disclosed in Table 61 excludes both CVA, which are adjustments to the mark-to-market value of our derivative exposures to reflect the impact of the credit quality of counterparties on our derivative assets, and the corresponding hedges. Current regulatory standards require that regulatory VaR
 
only exclude CVA but include the corresponding hedges. The holding period for regulatory VaR for capital calculations is 10 days, while for the market risk VaR presented below, it is one day. Except for the differences between regulatory and market risk VaR regarding the inclusion of CVA hedges and the holding period, both measures utilize the same process and methodology.
To provide visibility of market risks to which the Corporation is exposed, Table 61 presents the total market-based trading portfolio VaR which includes our total covered positions trading portfolio and the impact from less liquid trading exposures. Covered positions are defined by regulatory standards as trading assets and liabilities, both on- and off-balance sheet, that meet a defined set of specifications. These specifications identify the most liquid trading positions which are intended to be held for a short-term horizon and where the Corporation is able to hedge the material risk elements in a two-way market. Positions in less liquid markets, or where there are restrictions on the ability to trade the positions, typically do not qualify as covered positions. Foreign exchange and commodity positions are always considered covered positions, except for structural foreign currency positions that we choose to exclude with prior regulatory approval. Certain positions related to our CVA and corresponding hedges are considered covered positions; however, these are excluded from the VaR results presented in Table 61. In addition, Table 61 presents our fair value option portfolio, which includes the funded and unfunded exposures for which we elect the fair value option, and their corresponding hedges. The fair value option portfolio combined with the total market-based trading portfolio VaR represents the Corporation’s total market-based portfolio VaR. This population is consistent with the risk appetite limits set by the ERC and the Board.
The market risk across all business segments to which the Corporation is exposed is included in the total market-based portfolio VaR results. The majority of this portfolio is within the Global Markets segment.


Bank of America 2014     81


Table 61 presents year-end, average, high and low daily trading VaR for 2014 and 2013 using a 99 percent confidence level.


Table 61
Market Risk VaR for Trading Activities


2014
 
2013
(Dollars in millions)
Year End
 
Average
 
High (1)
 
Low (1)
 
Year End
 
Average
 
High (1)
 
Low (1)
Foreign exchange
$
13

 
$
16

 
$
24

 
$
8

 
$
15

 
$
19

 
$
41

 
$
11

Interest rate
24

 
34

 
60

 
19

 
34

 
32

 
61

 
20

Credit
43

 
52

 
82

 
32

 
61

 
58

 
86

 
41

Equities
16

 
17

 
32

 
11

 
23

 
28

 
57

 
16

Commodities
8

 
8

 
10

 
6

 
6

 
13

 
20

 
6

Portfolio diversification
(56
)
 
(78
)


(68
)
 
(85
)


Total covered positions trading portfolio
48

 
49

 
86

 
33

 
71

 
65

 
117

 
39

Impact from less liquid exposures
7

 
7


20

 
4


Total market-based trading portfolio
55

 
56

 
101

 
38

 
91

 
69

 
115

 
44

Fair value option loans
35

 
31

 
40

 
21

 
33

 
42

 
55

 
29

Fair value option hedges
21

 
14

 
23

 
8

 
15

 
19

 
31

 
12

Fair value option portfolio diversification
(37
)
 
(24
)


(25
)
 
(32
)


Total fair value option portfolio
19

 
21

 
28

 
15

 
23

 
29

 
39

 
21

Portfolio diversification
(7
)
 
(12
)


(1
)
 
(13
)


Total market-based portfolio
$
67

 
$
65

 
$
120

 
$
44

 
$
113

 
$
85

 
$
127

 
$
60

(1) 
The high and low for each portfolio may have occurred on different trading days than the high and low for the components. Therefore the impact from less liquid exposures and the amount of portfolio diversification, which is the difference between the total portfolio and the sum of the individual components, are not relevant.
The year-end and the average total market-based trading portfolio VaR decreased during 2014 due to elevated market volatility experienced during the 2011 roll-out of the three-year window of historical data used in the VaR calculation. Additionally, a smaller impact to the reduction in total market-based trading
 
portfolio VaR was due to an overall reduction from portfolio changes.
The graph below presents the daily total market-based trading portfolio VaR for 2014, corresponding to the data in Table 61.


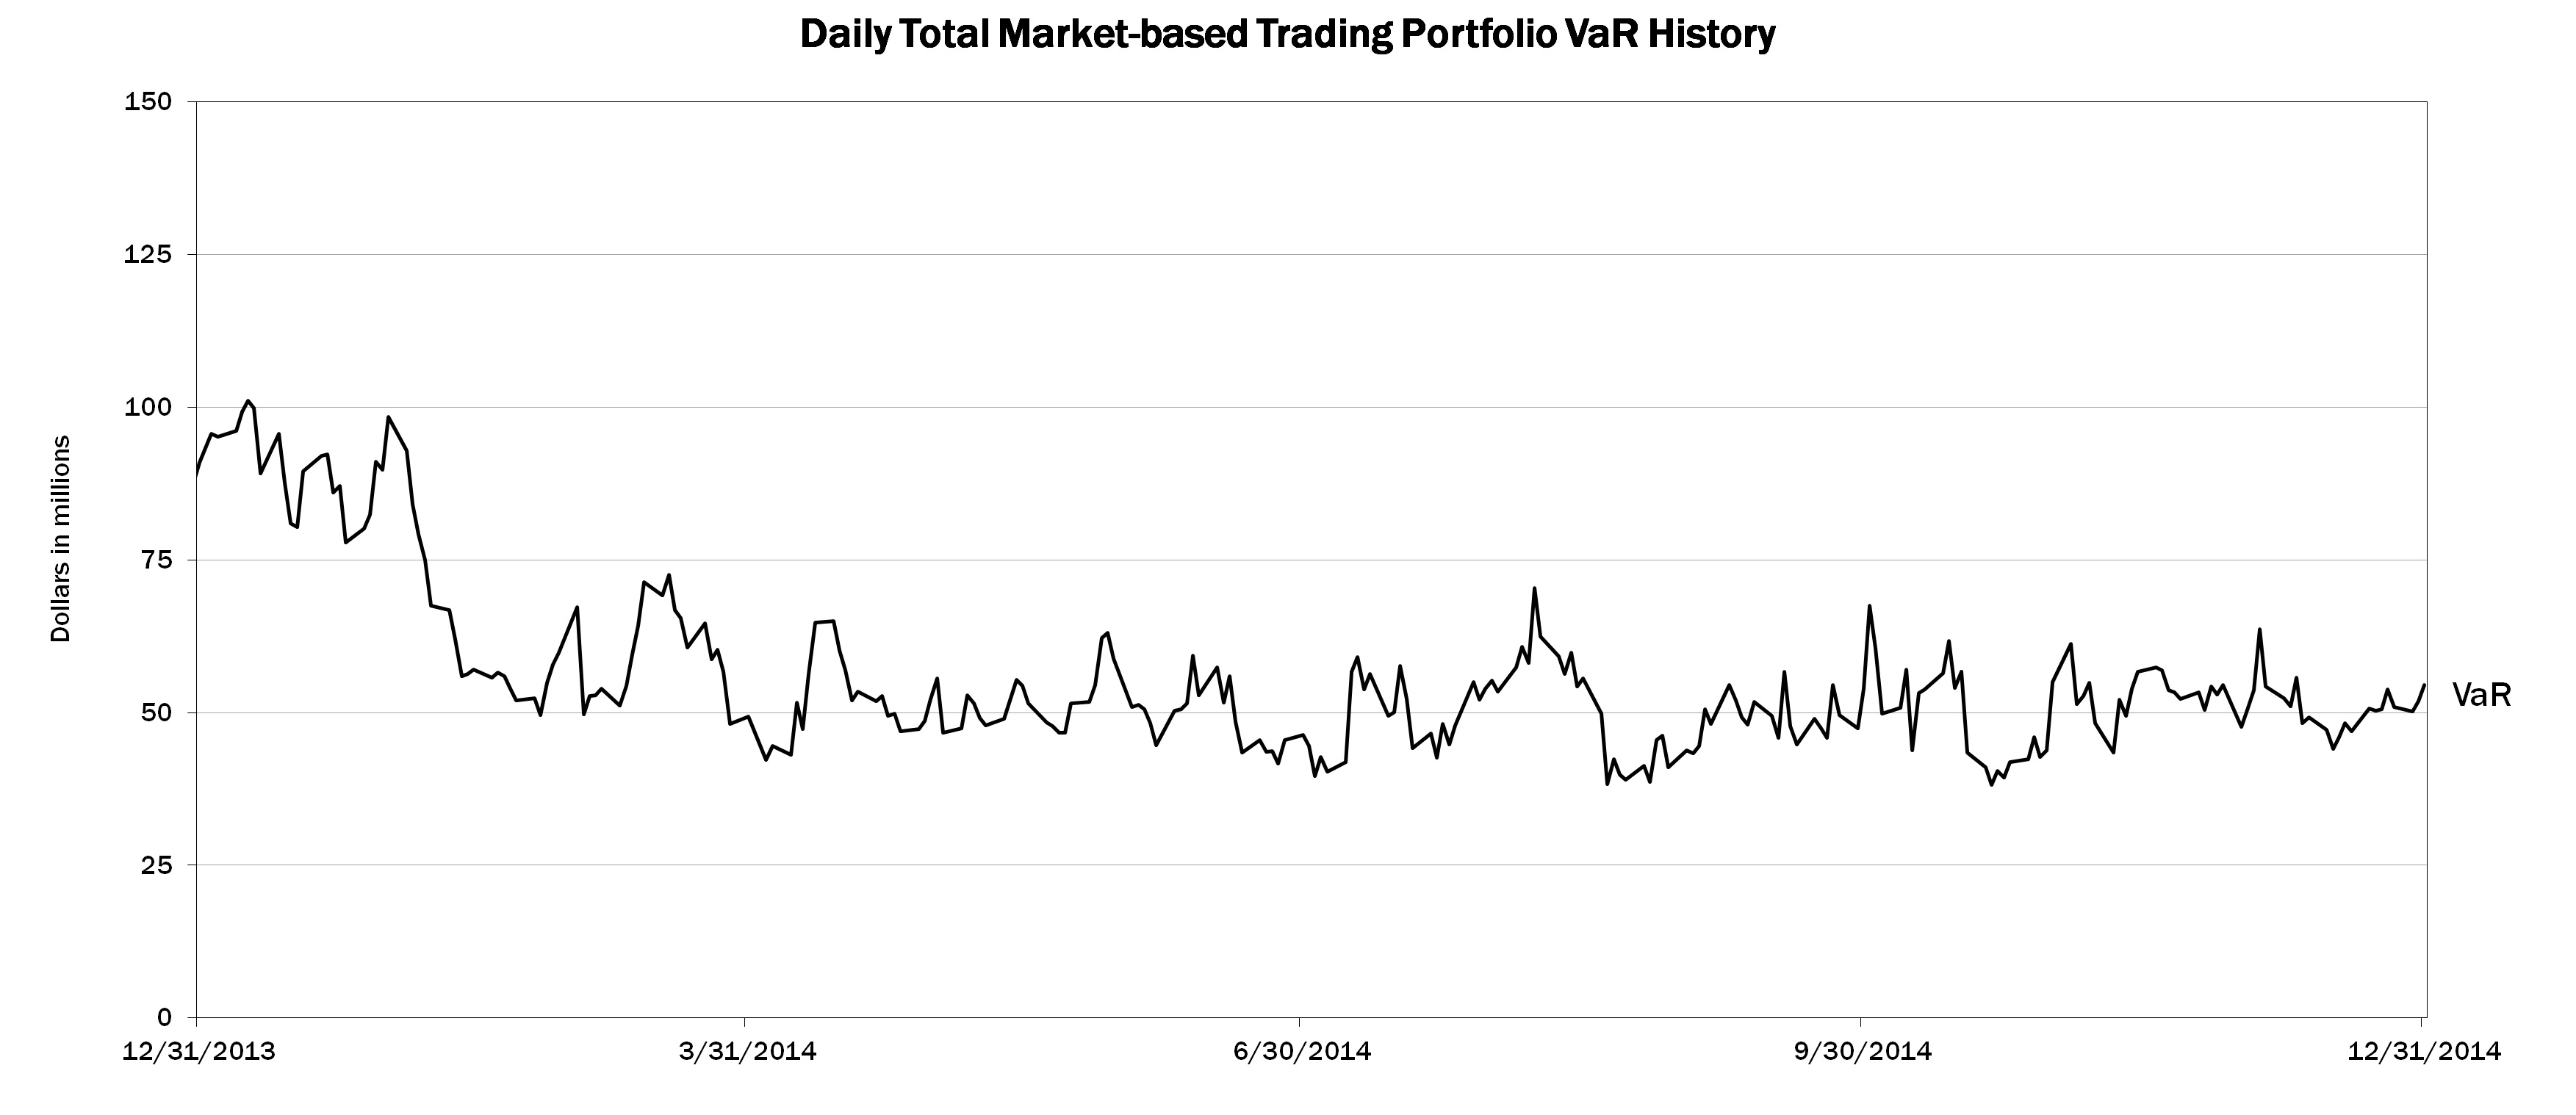
82     Bank of America 2014


Additional VaR statistics produced within the Corporation’s single VaR model are provided in Table 62 at the same level of detail as in Table 61. Evaluating VaR with additional statistics allows for an increased understanding of the risks in the portfolio
 
as the historical market data used in the VaR calculation does not necessarily follow a predefined statistical distribution. Table 62 presents average trading VaR statistics for 99 percent and 95 percent confidence levels for 2014 and 2013.


Table 62
Average Market Risk VaR for Trading Activities – 99 percent and 95 percent VaR Statistics


2014
 
2013
(Dollars in millions)
 
99 percent
 
95 percent
 
99 percent
 
95 percent
Foreign exchange
 
$
16

 
$
9

 
$
19

 
$
12

Interest rate
 
34

 
21

 
32

 
19

Credit
 
52

 
26

 
58

 
33

Equities
 
17

 
9

 
28

 
15

Commodities
 
8

 
4

 
13

 
8

Portfolio diversification
 
(78
)
 
(43
)
 
(85
)
 
(51
)
Total covered positions trading portfolio
 
49

 
26

 
65

 
36

Impact from less liquid exposures
 
7

 
3

 
4

 
3

Total market-based trading portfolio
 
56

 
29

 
69

 
39

Fair value option loans
 
31

 
15

 
42

 
21

Fair value option hedges
 
14

 
9

 
19

 
13

Fair value option portfolio diversification
 
(24
)
 
(14
)
 
(32
)
 
(19
)
Total fair value option portfolio
 
21

 
10

 
29

 
15

Portfolio diversification
 
(12
)
 
(8
)
 
(13
)
 
(9
)
Total market-based portfolio
 
$
65

 
$
31

 
$
85

 
$
45

Backtesting
The accuracy of the VaR methodology is evaluated by backtesting, which compares the daily VaR results, utilizing a one-day holding period, against a comparable subset of trading revenue. A backtesting excess occurs when a trading loss exceeds the VaR for the corresponding day. These excesses are evaluated to understand the positions and market moves that produced the trading loss and to ensure that the VaR methodology accurately represents those losses. As our primary VaR statistic used for backtesting is based on a 99 percent confidence level and a one-day holding period, we expect one trading loss in excess of VaR every 100 days, or between two to three trading losses in excess of VaR over the course of a year. The number of backtesting excesses observed can differ from the statistically expected number of excesses if the current level of market volatility is materially different than the level of market volatility that existed during the three years of historical data used in the VaR calculation.
We conduct daily backtesting on our portfolios, ranging from the total market-based portfolio to individual trading areas. Additionally, we conduct daily backtesting on our regulatory VaR results as well as the VaR results for key legal entities, regions and risk factors. These results are reported to senior market risk management. Senior management regularly reviews and evaluates the results of these tests.
The trading revenue used for backtesting is defined by regulatory agencies in order to most closely align with the VaR component of the regulatory capital calculation. This revenue differs from total trading-related revenue in that it excludes revenue from trading activities that either do not generate market risk or the market risk cannot be included in VaR. Some examples of the
 
types of revenue excluded for backtesting are fees, commissions, reserves, net interest income and intraday trading revenues. In addition, CVA is not included in the VaR component of the regulatory capital calculation and is therefore not included in the revenue used for backtesting of the regulatory VaR results.
During 2014, there were no days in which there was a backtesting excess for our total market-based portfolio, utilizing a one-day holding period. There were three backtesting excesses for our regulatory VaR results, utilizing a one-day holding period, due to increased volatility during the three months ended December 31, 2014.
Total Trading Revenue
Total trading-related revenue, excluding brokerage fees, represents the total amount earned from trading positions, including market-based net interest income, which are taken in a diverse range of financial instruments and markets. Trading account assets and liabilities are reported at fair value. For more information on fair value, see Note 20 – Fair Value Measurements to the Consolidated Financial Statements. Trading-related revenues can be volatile and are largely driven by general market conditions and customer demand. Also, trading-related revenues are dependent on the volume and type of transactions, the level of risk assumed, and the volatility of price and rate movements at any given time within the ever-changing market environment. Significant daily revenues by business are monitored and the primary drivers of these are reviewed. When it is deemed material, an explanation of these revenues is provided to the GM subcommittee.


Bank of America 2014     83


The histogram below is a graphic depiction of trading volatility and illustrates the daily level of trading-related revenue for 2014 and 2013. During 2014, positive trading-related revenue was recorded for 95 percent of the trading days, of which 72 percent were daily trading gains of over $25 million and the largest loss
 
was $17 million. This compares to 2013 where positive trading-related revenue was recorded for 96 percent of the trading days, of which 74 percent were daily trading gains of over $25 million and the largest loss was $54 million.

Trading Portfolio Stress Testing
Because the very nature of a VaR model suggests results can exceed our estimates and it is dependent on a limited historical window, we also stress test our portfolio using scenario analysis. This analysis estimates the change in value of our trading portfolio that may result from abnormal market movements.
A set of scenarios, categorized as either historical or hypothetical, are computed daily for the overall trading portfolio and individual businesses. These scenarios include shocks to underlying market risk factors that may be well beyond the shocks found in the historical data used to calculate VaR. Historical scenarios simulate the impact of the market moves that occurred during a period of extended historical market stress. Generally, a 10-business day window or longer representing the most severe point during a crisis is selected for each historical scenario. Hypothetical scenarios provide simulations of the estimated portfolio impact from potential future market stress events. Scenarios are reviewed and updated in response to changing
 
positions and new economic or political information. In addition, new or adhoc scenarios are developed to address specific potential market events. For example, a stress test was conducted to estimate the impact of a significant increase in global interest rates and the corresponding impact across other asset classes. The stress tests are reviewed on a regular basis and the results are presented to senior management.
Stress testing for the trading portfolio is integrated with enterprise-wide stress testing and incorporated into the limits framework. A process is in place to promote consistency between the scenarios used for the trading portfolio and those used for enterprise-wide stress testing. The scenarios used for enterprise-wide stress testing purposes differ from the typical trading portfolio scenarios in that they have a longer time horizon and the results are forecasted over multiple periods for use in consolidated capital and liquidity planning. For additional information, see Managing Risk – Corporation-wide Stress Testing on page 38.


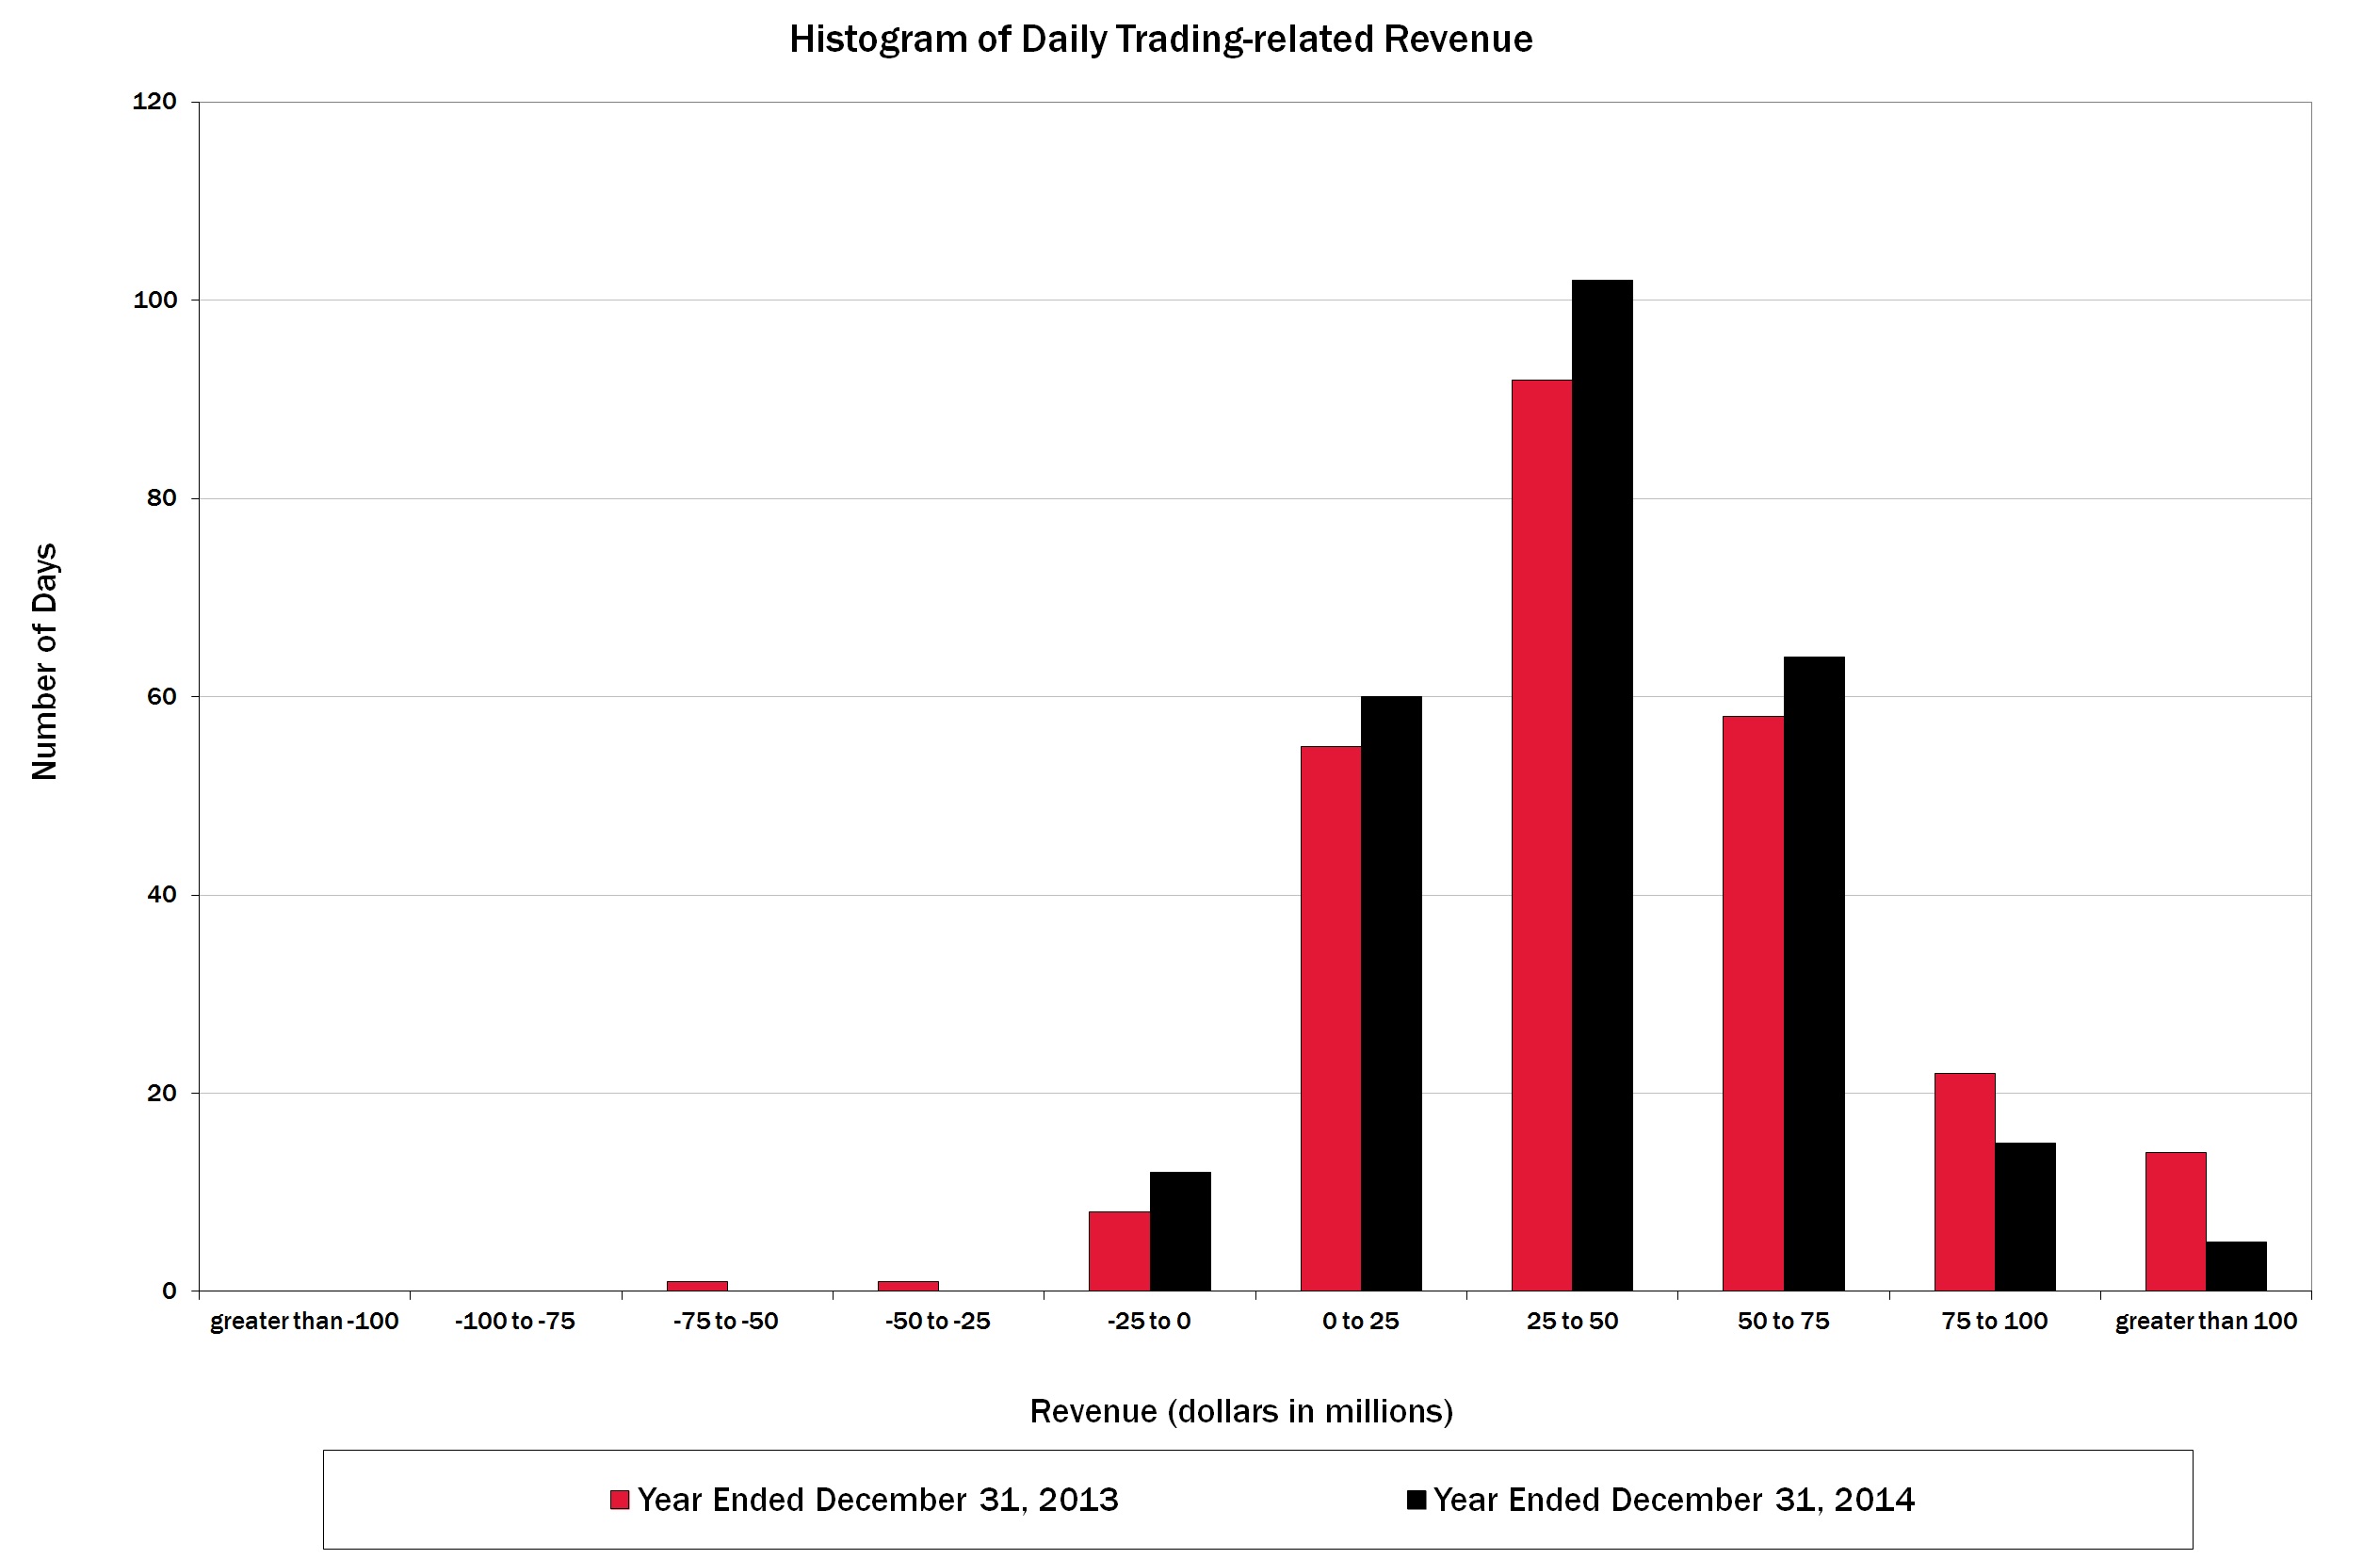
84     Bank of America 2014


Interest Rate Risk Management for Nontrading Activities
The following discussion presents net interest income excluding the impact of trading-related activities.
Interest rate risk represents the most significant market risk exposure to our non-trading balance sheet. Interest rate risk is measured as the potential change in net interest income caused by movements in market interest rates. Client-facing activities, primarily lending and deposit-taking, create interest rate sensitive positions on our balance sheet.
We prepare forward-looking forecasts of net interest income. The baseline forecast takes into consideration expected future business growth, ALM positioning and the direction of interest rate movements as implied by the market-based forward curve. We then measure and evaluate the impact that alternative interest rate scenarios have on the baseline forecast in order to assess interest rate sensitivity under varied conditions. The net interest income forecast is frequently updated for changing assumptions and differing outlooks based on economic trends, market conditions and business strategies. Thus, we continually monitor our balance sheet position in order to maintain an acceptable level of exposure to interest rate changes.
The interest rate scenarios that we analyze incorporate balance sheet assumptions such as loan and deposit growth and pricing, changes in funding mix, product repricing and maturity characteristics. Our overall goal is to manage interest rate risk so that movements in interest rates do not significantly adversely affect earnings and capital.
Table 63 presents the spot and 12-month forward rates used in our baseline forecasts at December 31, 2014 and 2013.


Table 63
Forward Rates


December 31, 2014
 
 
Federal
Funds
 
Three-Month
LIBOR
 
10-Year
Swap
Spot rates
0.25
%
 
0.26
%
 
2.28
%
12-month forward rates
0.75

 
0.91

 
2.55


December 31, 2013
Spot rates
0.25
%
 
0.25
%
 
3.09
%
12-month forward rates
0.25

 
0.43

 
3.52

Table 64 shows the pretax dollar impact to forecasted net interest income over the next 12 months from December 31, 2014 and 2013, resulting from instantaneous parallel and non-parallel shocks to the market-based forward curve. Periodically, we evaluate the scenarios presented to ensure that they are meaningful in the context of the current rate environment. For more
 
information on net interest income excluding the impact of trading-related activities, see page 13.
We continue to be asset-sensitive to both a parallel move in interest rates and a long-end led steepening of the yield curve. Additionally, rising interest rates impact the fair value of debt securities and, accordingly, for debt securities classified as AFS, may adversely affect accumulated OCI and thus capital levels under the Basel 3 capital rules. Under instantaneous upward parallel shifts, the near term adverse impact to accumulated OCI and Basel 3 capital is reduced over time by offsetting positive impacts to net interest income. For more information on the phase-in provisions of Basel 3 including accumulated OCI, see Capital Management – Regulatory Capital on page 39.


Table 64
Estimated Net Interest Income Excluding Trading-related Net Interest Income


(Dollars in millions)
Short
Rate (bps)
 
Long
Rate (bps)
 
December 31
Curve Change
 
 
2014
 
2013
Parallel Shifts


+100 bps
instantaneous shift
+100
 
+100
 
$
3,685

 
$
3,229

-50 bps
instantaneous shift
-50

 
-50

 
(3,043
)
 
(1,616
)
Flatteners


Short-end
instantaneous change
+100


1,966

 
2,210

Long-end
instantaneous change

 
-50

 
(1,772
)
 
(641
)
Steepeners


Short-end
instantaneous change
-50


(1,261
)
 
(937
)
Long-end
instantaneous change

 
+100
 
1,782

 
1,066

The sensitivity analysis in Table 64 assumes that we take no action in response to these rate shocks and does not assume any change in other macroeconomic variables normally correlated with changes in interest rates. As part of our ALM activities, we use securities, residential mortgages, and interest rate and foreign exchange derivatives in managing interest rate sensitivity.
The behavior of our deposit portfolio in the baseline forecast and in alternate interest rate scenarios is a key assumption in our projected estimates of net interest income. The sensitivity analysis in Table 64 assumes no change in deposit portfolio size or mix from the baseline forecast in alternate rate environments. In higher rate scenarios, any customer activity resulting in the replacement of low-cost or noninterest-bearing deposits with higher-yielding deposits or market-based funding would reduce the Corporation’s benefit in those scenarios.


Bank of America 2014     85


Securities
The securities portfolio is an integral part of our interest rate risk management, which includes our ALM positioning, and is primarily comprised of debt securities including MBS and U.S. Treasury securities. As part of the ALM positioning, we use derivatives to hedge interest rate and duration risk. At December 31, 2014 and 2013, our debt securities portfolio had a carrying value of $380.5 billion and $323.9 billion.
During 2014 and 2013, we purchased debt securities of $293.8 billion and $190.4 billion, sold $157.7 billion and $117.7 billion, and had maturities and received paydowns of $87.6 billion and $94.0 billion, respectively. We realized $1.4 billion and $1.3 billion in net gains on sales of AFS debt securities.
At December 31, 2014, accumulated OCI included after-tax net unrealized gains of $1.3 billion on AFS debt securities and after-tax net unrealized gains of $17 million on AFS marketable equity securities compared to after-tax net unrealized losses of $3.3 billion and after-tax net unrealized losses of $4 million at December 31, 2013. For more information on accumulated OCI, see Note 14 – Accumulated Other Comprehensive Income (Loss) to the Consolidated Financial Statements. The pretax net amounts in accumulated OCI related to AFS debt securities increased $7.4 billion during 2014 to a $2.2 billion net unrealized gain primarily due to the impact of interest rates. For more information on our securities portfolio, see Note 3 – Securities to the Consolidated Financial Statements.
We recognized $16 million of other-than-temporary impairment (OTTI) losses in earnings on AFS debt securities in 2014 compared to losses of $20 million in 2013. OTTI losses during 2014 and 2013 were on non-agency RMBS and were recorded in other income on the Consolidated Statement of Income. The recognition of OTTI losses is based on a variety of factors, including the length of time and extent to which the market value has been less than amortized cost, the financial condition of the issuer of the security including credit ratings and any specific events affecting the operations of the issuer, underlying assets that collateralize the debt security, other industry and macroeconomic conditions, and our intent and ability to hold the security to recovery.
Residential Mortgage Portfolio
At December 31, 2014 and 2013, our residential mortgage portfolio was $216.2 billion and $248.1 billion excluding $1.9 billion and $2.0 billion of consumer residential mortgage loans accounted for under the fair value option at each period end. For more information on consumer fair value option loans, see Consumer Portfolio Credit Risk Management – Consumer Loans
 
Accounted for Under the Fair Value Option on page 62. The $31.9 billion decrease in 2014 was primarily due to paydowns, sales, charge-offs and transfers to foreclosed properties. Of the decline, more than 50 percent was due to the sale of $10.7 billion of loans with standby insurance agreements and $6.7 billion of nonperforming and other delinquent loan sales. These were partially offset by new origination volume retained on our balance sheet, as well as repurchases of delinquent loans pursuant to our servicing agreements with GNMA, which are part of our mortgage banking activities.
During 2014, Consumer Banking and GWIM originated $23.2 billion of first-lien mortgages that we retained compared to $44.5 billion in 2013. We received paydowns of $37.8 billion in 2014 compared to $53.0 billion in 2013. We repurchased $5.0 billion of loans pursuant to our servicing agreements with GNMA and redelivered $3.6 billion, primarily FHA-insured loans, compared to repurchases of $10.4 billion and redeliveries of $5.0 billion in 2013. Sales of loans, excluding redelivered FHA-insured loans, during 2014 were $17.4 billion compared to $4.0 billion in 2013. Gains recognized on the sales of residential mortgage loans during 2014 were $668 million compared to $75 million in 2013.
Interest Rate and Foreign Exchange Derivative Contracts
Interest rate and foreign exchange derivative contracts are utilized in our ALM activities and serve as an efficient tool to manage our interest rate and foreign exchange risk. We use derivatives to hedge the variability in cash flows or changes in fair value on our balance sheet due to interest rate and foreign exchange components. For more information on our hedging activities, see Note 2 – Derivatives to the Consolidated Financial Statements.
Our interest rate contracts are generally non-leveraged generic interest rate and foreign exchange basis swaps, options, futures and forwards. In addition, we use foreign exchange contracts, including cross-currency interest rate swaps, foreign currency futures contracts, foreign currency forward contracts and options to mitigate the foreign exchange risk associated with foreign currency-denominated assets and liabilities.
Changes to the composition of our derivatives portfolio during 2014 reflect actions taken for interest rate and foreign exchange rate risk management. The decisions to reposition our derivatives portfolio are based on the current assessment of economic and financial conditions including the interest rate and foreign currency environments, balance sheet composition and trends, and the relative mix of our cash and derivative positions.


86     Bank of America 2014


Table 65 presents derivatives utilized in our ALM activities including those designated as accounting and economic hedging instruments and shows the notional amount, fair value, weighted-average receive-fixed and pay-fixed rates, expected maturity and average estimated durations of our open ALM derivatives at December 31, 2014 and 2013. These amounts do not include derivative hedges on our MSRs.


Table 65
Asset and Liability Management Interest Rate and Foreign Exchange Contracts


December 31, 2014


Expected Maturity
 
 
(Dollars in millions, average estimated duration in years)
Fair
Value
 
Total
 
2015
 
2016
 
2017
 
2018
 
2019
 
Thereafter
 
Average
Estimated
Duration
Receive-fixed interest rate swaps (1, 2)
$
7,626


4.34

Notional amount


$
113,766

 
$
11,785

 
$
15,339

 
$
21,453

 
$
15,299

 
$
10,233

 
$
39,657


Weighted-average fixed-rate


2.98
%
 
3.56
%
 
3.12
%
 
3.64
%
 
4.07
%
 
0.49
%
 
2.63
%


Pay-fixed interest rate swaps (1, 2)
(829
)


8.05

Notional amount


$
14,668

 
$
520

 
$
1,025

 
$
1,527

 
$
2,908

 
$
425

 
$
8,263


Weighted-average fixed-rate


2.27
%
 
2.30
%
 
1.65
%
 
1.84
%
 
1.62
%
 
0.09
%
 
2.77
%


Same-currency basis swaps (3)
(74
)


Notional amount


$
94,413

 
$
18,881

 
$
15,691

 
$
21,068

 
$
11,026

 
$
6,787

 
$
20,960


Foreign exchange basis swaps (2, 4, 5, 6)
(2,352
)


Notional amount


161,196

 
27,629

 
26,118

 
27,026

 
14,255

 
12,359

 
53,809


Option products (7)
11


Notional amount (8)


980

 
964


16


Foreign exchange contracts (2, 6, 9)
3,700


Notional amount (8)
 
 
(22,572
)
 
(29,931
)
 
(2,036
)
 
6,134

 
(2,335
)
 
2,359

 
3,237


Futures and forward rate contracts
(129
)


Notional amount (8)


(14,949
)
 
(14,949
)


Net ALM contracts
$
7,953


December 31, 2013


Expected Maturity
 
 
(Dollars in millions, average estimated duration in years)
Fair
Value
 
Total
 
2014
 
2015
 
2016
 
2017
 
2018
 
Thereafter
 
Average
Estimated
Duration
Receive-fixed interest rate swaps (1, 2)
$
5,074


4.67

Notional amount


$
109,539

 
$
7,604

 
$
12,873

 
$
15,339

 
$
19,803

 
$
20,733

 
$
33,187


Weighted-average fixed-rate


3.42
%
 
3.79
%
 
3.32
%
 
3.12
%
 
3.87
%
 
3.34
%
 
3.29
%


Pay-fixed interest rate swaps (1, 2)
427


5.92

Notional amount


$
28,418

 
$
4,645

 
$
520

 
$
1,025

 
$
1,527

 
$
8,529

 
$
12,172


Weighted-average fixed-rate


1.87
%
 
0.54
%
 
2.30
%
 
1.65
%
 
1.84
%
 
1.52
%
 
2.62
%


Same-currency basis swaps (3)
6


Notional amount


$
145,184

 
$
47,529

 
$
25,171

 
$
28,157

 
$
15,283

 
$
9,156

 
$
19,888


Foreign exchange basis swaps (2, 4, 5, 6)
1,208


Notional amount


205,560

 
39,151

 
37,298

 
27,293

 
24,304

 
14,517

 
62,997


Option products (7)
21


Notional amount (8)


(641
)
 
(649
)
 
(11
)


19


Foreign exchange contracts (2, 6, 9)
1,619


Notional amount (8)


(19,515
)
 
(35,991
)
 
1,873

 
(669
)
 
7,224

 
2,026

 
6,022


Futures and forward rate contracts
147


Notional amount (8)


(19,427
)
 
(19,427
)


Net ALM contracts
$
8,502


(1) 
The receive-fixed interest rate swap notional amounts that represent forward starting swaps and which will not be effective until their respective contractual start dates totaled $600 million at December 31, 2013. There were no forward starting receive-fixed interest rate swap positions at December 31, 2014. There were no forward starting pay-fixed swap positions at December 31, 2014 compared to $1.1 billion at December 31, 2013.
(2) 
Does not include basis adjustments on either fixed-rate debt issued by the Corporation or AFS debt securities, which are hedged using derivatives designated as fair value hedging instruments, that substantially offset the fair values of these derivatives.
(3) 
At December 31, 2014 and 2013, the notional amount of same-currency basis swaps was comprised of $94.4 billion and $145.2 billion in both foreign currency and U.S. Dollar-denominated basis swaps in which both sides of the swap are in the same currency.
(4) 
The change in the fair value for foreign exchange basis swaps was primarily driven by the weakening of foreign currencies against the U.S. Dollar throughout 2014 compared to 2013.
(5) 
Foreign exchange basis swaps consisted of cross-currency variable interest rate swaps used separately or in conjunction with receive-fixed interest rate swaps.
(6) 
Does not include foreign currency translation adjustments on certain non-U.S. debt issued by the Corporation that substantially offset the fair values of these derivatives.
(7) 
The notional amount of option products of $980 million at December 31, 2014 was comprised of $974 million in foreign exchange options, $16 million in purchased caps/floors and $(10) million in swaptions. Option products of $(641) million at December 31, 2013 were comprised of $(2.0) billion in swaptions, $1.4 billion in foreign exchange options and $19 million in purchased caps/floors.
(8) 
Reflects the net of long and short positions. Amounts shown as negative reflect a net short position.
(9) 
The notional amount of foreign exchange contracts of $(22.6) billion at December 31, 2014 was comprised of $21.0 billion in foreign currency-denominated and cross-currency receive-fixed swaps, $(36.4) billion in net foreign currency forward rate contracts, $(8.3) billion in foreign currency-denominated pay-fixed swaps and $1.1 billion in net foreign currency futures contracts. Foreign exchange contracts of $(19.5) billion at December 31, 2013 were comprised of $36.1 billion in foreign currency-denominated and cross-currency receive-fixed swaps, $(49.3) billion in net foreign currency forward rate contracts, $(10.3) billion in foreign currency-denominated pay-fixed swaps and $4.0 billion in foreign currency futures contracts.


Bank of America 2014     87


We use interest rate derivative instruments to hedge the variability in the cash flows of our assets and liabilities and other forecasted transactions (collectively referred to as cash flow hedges). The net losses on both open and terminated cash flow hedge derivative instruments recorded in accumulated OCI were $2.7 billion and $3.6 billion, on a pretax basis, at December 31, 2014 and 2013. These net losses are expected to be reclassified into earnings in the same period as the hedged cash flows affect earnings and will decrease income or increase expense on the respective hedged cash flows. Assuming no change in open cash flow derivative hedge positions and no changes in prices or interest rates beyond what is implied in forward yield curves at December 31, 2014, the pretax net losses are expected to be reclassified into earnings as follows: $803 million, or 30 percent within the next year, 46 percent in years two through five, and 16 percent in years six through ten, with the remaining eight percent thereafter. For more information on derivatives designated as cash flow hedges, see Note 2 – Derivatives to the Consolidated Financial Statements.
We hedge our net investment in non-U.S. operations determined to have functional currencies other than the U.S. Dollar using forward foreign exchange contracts that typically settle in less than 180 days, cross-currency basis swaps and foreign exchange options. We recorded net after-tax losses on derivatives in accumulated OCI associated with net investment hedges which were offset by gains on our net investments in consolidated non-U.S. entities at December 31, 2014.
Mortgage Banking Risk Management
We originate, fund and service mortgage loans, which subject us to credit, liquidity and interest rate risks, among others. We determine whether loans will be HFI or held-for-sale at the time of commitment and manage credit and liquidity risks by selling or securitizing a portion of the loans we originate.
Interest rate risk and market risk can be substantial in the mortgage business. Fluctuations in interest rates drive consumer demand for new mortgages and the level of refinancing activity, which in turn affects total origination and servicing income. Hedging the various sources of interest rate risk in mortgage banking is a complex process that requires complex modeling and ongoing monitoring. Typically, an increase in mortgage interest rates will lead to a decrease in mortgage originations and related fees. IRLCs and the related residential first mortgage LHFS are subject to interest rate risk between the date of the IRLC and the date the loans are sold to the secondary market, as an increase in mortgage interest rates will typically lead to a decrease in the value of these instruments.
MSRs are nonfinancial assets created when the underlying mortgage loan is sold to investors and we retain the right to service the loan. Typically, an increase in mortgage rates will lead to an increase in the value of the MSRs driven by lower prepayment expectations. This increase in value from increases in mortgage rates is opposite of, and therefore offsets, the risk described for IRLCs and LHFS. Previously we hedged MSRs separately from the IRLCs and first mortgage LHFS assets. Because the interest rate risks of these two hedged items offset, we decided to combine them into one overall hedged item with one combined economic hedge portfolio.
 
Beginning in the fourth quarter of 2014, interest rate and certain market risks of IRLCs and residential mortgage LHFS were economically hedged in combination with MSRs. To hedge these combined assets, we use certain derivatives such as interest rate options, interest rate swaps, forward sale commitments, eurodollar and U.S. Treasury futures, and mortgage TBAs, as well as other securities including agency MBS, principal-only and interest-only MBS and U.S. Treasury securities. The fair value and notional amounts of the derivative contracts and the fair value of securities hedging the combined MSRs, IRLCs and residential first mortgage LHFS were $(3.6) billion, $1.1 trillion and $558 million at December 31, 2014. The fair value and notional amounts of the derivative contracts and the fair value of securities hedging the MSRs at December 31, 2013 were $(2.9) billion, $1.8 trillion and $2.5 billion. The notional amount of derivatives economically hedging only the IRLCs and residential first mortgage LHFS at December 31, 2013 were $7.9 billion. In 2014, we recorded in mortgage banking income gains of $1.6 billion related to the change in fair value of the derivative contracts and other securities used to hedge the market risks of the MSRs compared to losses of $1.1 billion for 2013. For more information on MSRs, see Note 23 – Mortgage Servicing Rights to the Consolidated Financial Statements and for more information on mortgage banking income, see Consumer Banking on page 16.
Compliance Risk Management
Compliance risk is the risk of legal or regulatory sanctions, material financial loss or damage to the reputation of the Corporation in the event of the failure of the Corporation to comply with the requirements of applicable laws, rules, regulations, related self-regulatory organization standards and codes of conduct (collectively, applicable laws, rules and regulations). Global Compliance independently assesses compliance risk, and evaluates adherence to applicable laws, rules and regulations, including identifying compliance issues and risks, performing monitoring and testing, and reporting on the state of compliance activities across the Corporation. Additionally, Global Compliance works with FLUs and control functions so that day-to-day activities operate in a compliant manner. For more information on FLUs and control functions, see Managing Risk on page 35.
The Corporation’s approach to the management of compliance risk is further described in the Global Compliance Policy, which outlines the requirements of the Corporation’s global compliance program, and defines roles and responsibilities related to the implementation, execution and management of the compliance program by Global Compliance. The requirements work together to drive a comprehensive risk-based approach for the proactive identification, management and escalation of compliance risks throughout the Corporation.
The Global Compliance Policy sets the requirements for reporting compliance risk information to executive management as well as the Board or appropriate Board-level committees with an outline for conducting objective oversight of the Corporation’s compliance risk management activities. The Board provides oversight of compliance risks through its Audit Committee and ERC.


88     Bank of America 2014


Operational Risk Management
The Corporation defines operational risk as the risk of loss resulting from inadequate or failed internal processes, people and systems or from external events. Operational risk may occur anywhere in the Corporation, including outsourced business processes, and is not limited to operations functions. Its effects may extend beyond financial losses. Operational risk includes legal risk. Successful operational risk management is particularly important to diversified financial services companies because of the nature, volume and complexity of the financial services business. Operational risk is a significant component in the calculation of total risk-weighted assets used in the Basel 3 capital estimate under the Advanced approaches. For more information on Basel 3 Advanced approaches, see Capital Management – Advanced Approaches on page 41.
We approach operational risk management from two perspectives within the structure of the Corporation: (1) at the enterprise level to provide independent, integrated management of operational risk across the organization, and (2) at the business and control function levels to address operational risk in revenue producing and non-revenue producing units. The Operational Risk Management Program addresses the overarching processes for identifying, measuring, monitoring and controlling operational risk, and reporting operational risk information to management and the Board. A sound internal governance structure enhances the effectiveness of the Corporation’s Operational Risk Management Program and is accomplished at the enterprise level through formal oversight by the Board, the ERC, the CRO and a variety of management committees and risk oversight groups aligned to the Corporation’s overall risk governance framework and practices. Of these, the MRC oversees the Corporation’s policies and processes for sound operational risk management. The MRC also serves as an escalation point for critical operational risk matters within the Corporation. The MRC reports operational risk activities to the ERC. The independent operational risk management teams oversee the businesses and control functions to monitor adherence to the Operational Risk Management Program and advise and challenge operational risk exposures.
Within the Global Risk Management organization, the Corporate Operational Risk team develops and guides the strategies, enterprise-wide policies, practices, controls and monitoring tools for assessing and managing operational risks across the organization and reports results to businesses, control functions, senior management, governance committees and the ERC and the Board.
The businesses and control functions are responsible for assessing, monitoring and managing all the risks within their units, including operational risks. In addition to enterprise risk management tools such as loss reporting, scenario analysis and RCSAs, operational risk executives, working in conjunction with senior business executives, have developed key tools to help identify, measure, monitor and control risk in each business and control function. Examples of these include personnel management practices; data reconciliation processes; fraud management units; cybersecurity controls, processes and systems; transaction processing, monitoring and analysis; business recovery planning; and new product introduction processes. The business and control functions are also responsible for consistently implementing and monitoring adherence to corporate practices.
Business and control function management uses the enterprise RCSA process to capture the identification and
 
assessment of operational risk exposures and evaluate the status of risk and control issues including mitigation plans, as appropriate. The goals of this process are to assess changing market and business conditions, evaluate key risks impacting each business and control function, and assess the controls in place to mitigate the risks. Key operational risk indicators for these risks have been developed and are used to assist in identifying trends and issues on an enterprise, business and control function level. Independent review and challenge to the Corporation’s overall operational risk management framework is performed by the Corporate Operational Risk Program Adherence Team and reported through the operational risk governance committees and management routines.
Where appropriate, insurance policies are purchased to mitigate the impact of operational losses. These insurance policies are explicitly incorporated in the structural features of operational risk evaluation. As insurance recoveries, especially given recent market events, are subject to legal and financial uncertainty, the inclusion of these insurance policies is subject to reductions in their expected mitigating benefits.
Complex Accounting Estimates
Our significant accounting principles, as described in Note 1 – Summary of Significant Accounting Principles to the Consolidated Financial Statements, are essential in understanding the MD&A. Many of our significant accounting principles require complex judgments to estimate the values of assets and liabilities. We have procedures and processes in place to facilitate making these judgments.
The more judgmental estimates are summarized in the following discussion. We have identified and described the development of the variables most important in the estimation processes that involve mathematical models to derive the estimates. In many cases, there are numerous alternative judgments that could be used in the process of determining the inputs to the models. Where alternatives exist, we have used the factors that we believe represent the most reasonable value in developing the inputs. Actual performance that differs from our estimates of the key variables could impact our results of operations. Separate from the possible future impact to our results of operations from input and model variables, the value of our lending portfolio and market-sensitive assets and liabilities may change subsequent to the balance sheet date, often significantly, due to the nature and magnitude of future credit and market conditions. Such credit and market conditions may change quickly and in unforeseen ways and the resulting volatility could have a significant, negative effect on future operating results. These fluctuations would not be indicative of deficiencies in our models or inputs.
Allowance for Credit Losses
The allowance for credit losses, which includes the allowance for loan and lease losses and the reserve for unfunded lending commitments, represents management’s estimate of probable losses inherent in the Corporation’s loan portfolio excluding those loans accounted for under the fair value option. Our process for determining the allowance for credit losses is discussed in Note 1 – Summary of Significant Accounting Principles to the Consolidated Financial Statements. We evaluate our allowance at the portfolio segment level and our portfolio segments are Consumer Real Estate, Credit Card and Other Consumer, and Commercial. Due to the variability in the drivers of the assumptions


Bank of America 2014     89


used in this process, estimates of the portfolio’s inherent risks and overall collectability change with changes in the economy, individual industries, countries, and borrowers’ ability and willingness to repay their obligations. The degree to which any particular assumption affects the allowance for credit losses depends on the severity of the change and its relationship to the other assumptions.
Key judgments used in determining the allowance for credit losses include risk ratings for pools of commercial loans and leases, market and collateral values and discount rates for individually evaluated loans, product type classifications for consumer and commercial loans and leases, loss rates used for consumer and commercial loans and leases, adjustments made to address current events and conditions, considerations regarding domestic and global economic uncertainty, and overall credit conditions.
Our estimate for the allowance for loan and lease losses is sensitive to the loss rates and expected cash flows from our Consumer Real Estate and Credit Card and Other Consumer portfolio segments, as well as our U.S. small business commercial card portfolio within the Commercial portfolio segment. For each one percent increase in the loss rates on loans collectively evaluated for impairment in our Consumer Real Estate portfolio segment, excluding PCI loans, coupled with a one percent decrease in the discounted cash flows on those loans individually evaluated for impairment within this portfolio segment, the allowance for loan and lease losses at December 31, 2014 would have increased by $84 million. PCI loans within our Consumer Real Estate portfolio segment are initially recorded at fair value. Applicable accounting guidance prohibits carry-over or creation of valuation allowances in the initial accounting. However, subsequent decreases in the expected cash flows from the date of acquisition result in a charge to the provision for credit losses and a corresponding increase to the allowance for loan and lease losses. We subject our PCI portfolio to stress scenarios to evaluate the potential impact given certain events. A one percent decrease in the expected cash flows could result in a $169 million impairment of the portfolio. For each one percent increase in the loss rates on loans collectively evaluated for impairment within our Credit Card and Other Consumer portfolio segment and U.S. small business commercial card portfolio, coupled with a one percent decrease in the expected cash flows on those loans individually evaluated for impairment within the Credit Card and Other Consumer portfolio segment and the U.S. small business commercial card portfolio, the allowance for loan and lease losses at December 31, 2014 would have increased by $45 million.
Our allowance for loan and lease losses is sensitive to the risk ratings assigned to loans and leases within the Commercial portfolio segment (excluding the U.S. small business commercial card portfolio). Assuming a downgrade of one level in the internal risk ratings for commercial loans and leases, except loans and leases already risk-rated Doubtful as defined by regulatory authorities, the allowance for loan and lease losses would have increased by $2.0 billion at December 31, 2014.
The allowance for loan and lease losses as a percentage of total loans and leases at December 31, 2014 was 1.65 percent and these hypothetical increases in the allowance would raise the ratio to 1.90 percent.
These sensitivity analyses do not represent management’s expectations of the deterioration in risk ratings or the increases in loss rates but are provided as hypothetical scenarios to assess the sensitivity of the allowance for loan and lease losses to
 
changes in key inputs. We believe the risk ratings and loss severities currently in use are appropriate and that the probability of the alternative scenarios outlined above occurring within a short period of time is remote.
The process of determining the level of the allowance for credit losses requires a high degree of judgment. It is possible that others, given the same information, may at any point in time reach different reasonable conclusions.
For more information on the Financial Accounting Standards Board’s proposed standard on accounting for credit losses, see Note 1 – Summary of Significant Accounting Principles to the Consolidated Financial Statements.
Mortgage Servicing Rights
MSRs are nonfinancial assets that are created when a mortgage loan is sold and we retain the right to service the loan. We account for consumer MSRs, including residential mortgage and home equity MSRs, at fair value with changes in fair value recorded in mortgage banking income in the Consolidated Statement of Income.
We determine the fair value of our consumer MSRs using a valuation model that calculates the present value of estimated future net servicing income. The model incorporates key economic assumptions including estimates of prepayment rates and resultant weighted-average lives of the MSRs, and the option-adjusted spread levels. These variables can, and generally do, change from quarter to quarter as market conditions and projected interest rates change. These assumptions are subjective in nature and changes in these assumptions could materially affect our operating results. For example, increasing the prepayment rate assumption used in the valuation of our consumer MSRs by 10 percent while keeping all other assumptions unchanged could have resulted in an estimated decrease of $208 million in both MSRs and mortgage banking income for 2014. This impact does not reflect any hedge strategies that may be undertaken to mitigate such risk.
We manage potential changes in the fair value of MSRs through a comprehensive risk management program. The intent is to mitigate the effects of changes in the fair value of MSRs through the use of risk management instruments. To reduce the sensitivity of earnings to interest rate and market value fluctuations, securities including MBS and U.S. Treasury securities, as well as certain derivatives such as options and interest rate swaps, may be used to hedge certain market risks of the MSRs, but are not designated as accounting hedges. These instruments are carried at fair value with changes in fair value recognized in mortgage banking income. For additional information, see Mortgage Banking Risk Management on page 88.
For more information on MSRs, including the sensitivity of weighted-average lives and the fair value of MSRs to changes in modeled assumptions, see Note 23 – Mortgage Servicing Rights to the Consolidated Financial Statements.
Fair Value of Financial Instruments
We classify the fair values of financial instruments based on the fair value hierarchy established under applicable accounting guidance which requires an entity to maximize the use of observable inputs and minimize the use of unobservable inputs when measuring fair value. Applicable accounting guidance establishes three levels of inputs used to measure fair value. We carry trading account assets and liabilities, derivative assets and


90     Bank of America 2014


liabilities, AFS debt and equity securities, other debt securities, consumer MSRs and certain other assets at fair value. Also, we account for certain loans and loan commitments, LHFS, short-term borrowings, securities financing agreements, asset-backed secured financings, long-term deposits and long-term debt under the fair value option.
The fair values of assets and liabilities may include adjustments, such as market liquidity and credit quality, where appropriate. Valuations of products using models or other techniques are sensitive to assumptions used for the significant inputs. Where market data is available, the inputs used for valuation reflect that information as of our valuation date. Inputs to valuation models are considered unobservable if they are supported by little or no market activity. In periods of extreme volatility, lessened liquidity or in illiquid markets, there may be more variability in market pricing or a lack of market data to use in the valuation process. In keeping with the prudent application of estimates and management judgment in determining the fair value of assets and liabilities, we have in place various processes and controls that include: a model validation policy that requires review and approval of quantitative models used for deal pricing, financial statement fair value determination and risk quantification; a trading product valuation policy that requires verification of all traded product valuations; and a periodic review and substantiation of daily profit and loss reporting for all traded products. Primarily through validation controls, we utilize both broker and pricing service inputs which can and do include both market-observable and internally-modeled values and/or valuation inputs. Our reliance on this information is affected by our understanding of how the broker and/or pricing service develops its data with a higher degree of reliance applied to those that are
 
more directly observable and lesser reliance applied to those developed through their own internal modeling. Similarly, broker quotes that are executable are given a higher level of reliance than indicative broker quotes, which are not executable. These processes and controls are performed independently of the business. For additional information, see Note 20 – Fair Value Measurements and Note 21 – Fair Value Option to the Consolidated Financial Statements.
In 2014, we adopted an FVA into valuation estimates primarily to include funding costs on uncollateralized derivatives and derivatives where we are not permitted to use the collateral received. This change resulted in a pretax net FVA charge of $497 million. Significant judgment is required in modeling expected exposure profiles and in discounting for the funding risk premium inherent in these derivatives.
Level 3 Assets and Liabilities
Financial assets and liabilities where values are based on valuation techniques that require inputs that are both unobservable and are significant to the overall fair value measurement are classified as Level 3 under the fair value hierarchy established in applicable accounting guidance. The Level 3 financial assets and liabilities include certain loans, MBS, ABS, CDOs, CLOs and structured liabilities, as well as highly structured, complex or long-dated derivative contracts, private equity investments and consumer MSRs. The fair value of these Level 3 financial assets and liabilities is determined using pricing models, discounted cash flow methodologies or similar techniques for which the determination of fair value requires significant management judgment or estimation.


Table 66
Recurring Level 3 Asset and Liability Summary


December 31
 
 
2014
 
2013
(Dollars in millions)
Level 3
Fair Value
 
As a %
of Total
Level 3
Assets
 
As a %
of Total
Assets
 
Level 3
Fair Value
 
As a %
of Total
Level 3
Assets
 
As a %
of Total
Assets
Trading account assets
$
6,259

 
28.12
%
 
0.30
%
 
$
9,044

 
28.46
%
 
0.43
%
Derivative assets
6,851

 
30.77

 
0.33

 
7,277

 
22.90

 
0.35

AFS debt securities
2,555

 
11.48

 
0.12

 
4,760

 
14.98

 
0.23

All other Level 3 assets at fair value
6,597

 
29.63

 
0.31

 
10,697

 
33.66

 
0.50

Total Level 3 assets at fair value (1)
$
22,262

 
100.00
%
 
1.06
%
 
$
31,778

 
100.00
%
 
1.51
%


Level 3
Fair Value
 
As a %
of Total
Level 3
Liabilities
 
As a %
of Total
Liabilities
 
Level 3
Fair Value
 
As a %
of Total
Level 3
Liabilities
 
As a %
of Total
Liabilities
Derivative liabilities
$
7,771

 
76.34
%
 
0.42
%
 
$
7,501

 
78.66
%
 
0.40
%
Long-term debt
2,362

 
23.20

 
0.13

 
1,990

 
20.87

 
0.11

All other Level 3 liabilities at fair value
46

 
0.46


45

 
0.47


Total Level 3 liabilities at fair value (1)
$
10,179

 
100.00
%
 
0.55
%
 
$
9,536

 
100.00
%
 
0.51
%
(1) 
Level 3 total assets and liabilities are shown before the impact of cash collateral and counterparty netting related to our derivative positions.
Level 3 financial instruments may be hedged with derivatives classified as Level 1 or 2; therefore, gains or losses associated with Level 3 financial instruments may be offset by gains or losses associated with financial instruments classified in other levels of the fair value hierarchy. The Level 3 gains and losses recorded in earnings did not have a significant impact on our liquidity or capital resources. We conduct a review of our fair value hierarchy
 
classifications on a quarterly basis. Transfers into or out of Level 3 are made if the significant inputs used in the financial models measuring the fair values of the assets and liabilities became unobservable or observable, respectively, in the current marketplace. These transfers are considered to be effective as of the beginning of the quarter in which they occur. For more information on the significant transfers into and out of Level 3


Bank of America 2014     91


during 2014, see Note 20 – Fair Value Measurements to the Consolidated Financial Statements.
Accrued Income Taxes and Deferred Tax Assets
Accrued income taxes, reported as a component of either other assets or accrued expenses and other liabilities on the Consolidated Balance Sheet, represent the net amount of current income taxes we expect to pay to or receive from various taxing jurisdictions attributable to our operations to date. We currently file income tax returns in more than 100 jurisdictions and consider many factors, including statutory, judicial and regulatory guidance, in estimating the appropriate accrued income taxes for each jurisdiction.
Consistent with the applicable accounting guidance, we monitor relevant tax authorities and change our estimate of accrued income taxes due to changes in income tax laws and their interpretation by the courts and regulatory authorities. These revisions of our estimate of accrued income taxes, which also may result from our income tax planning and from the resolution of income tax controversies, may be material to our operating results for any given period.
Net deferred tax assets, reported as a component of other assets on the Consolidated Balance Sheet, represent the net decrease in taxes expected to be paid in the future because of net operating loss (NOL) and tax credit carryforwards and because of future reversals of temporary differences in the bases of assets and liabilities as measured by tax laws and their bases as reported in the financial statements. NOL and tax credit carryforwards result in reductions to future tax liabilities, and many of these attributes can expire if not utilized within certain periods. We consider the need for valuation allowances to reduce net deferred tax assets to the amounts that we estimate are more-likely-than-not to be realized.
While we have established valuation allowances for certain state and non-U.S. deferred tax assets, we have concluded that no valuation allowance was necessary with respect to all U.S. federal and U.K. deferred tax assets, including NOL and tax credit carryforwards, that are not subject to any special limitations (such as change-in-control limitations) prior to any expiration. Management’s conclusion is supported by financial results and forecasts, the reorganization of certain business activities and the indefinite period to carry forward NOLs. The majority of U.K. net deferred tax assets, which consist primarily of NOLs, are expected to be realized by certain subsidiaries over an extended number of years. However, significant changes to our estimates, such as changes that would be caused by substantial and prolonged worsening of the condition of Europe’s capital markets, or to applicable tax laws, such as laws affecting the realizability of NOLs or other deferred tax assets, could lead management to reassess its U.K. valuation allowance conclusions. See Note 19 – Income Taxes to the Consolidated Financial Statements for a table of significant tax attributes and additional information. For more information, see Item 1A. Risk Factors of the Corporation's 2014 Annual Report on Form 10-K.
 
Goodwill and Intangible Assets
Background
The nature of and accounting for goodwill and intangible assets are discussed in Note 1 – Summary of Significant Accounting Principles and Note 8 – Goodwill and Intangible Assets to the Consolidated Financial Statements. Goodwill is reviewed for potential impairment at the reporting unit level on an annual basis, which for the Corporation is as of June 30, and in interim periods if events or circumstances indicate a potential impairment. A reporting unit is an operating segment or one level below. As reporting units are determined after an acquisition or evolve with changes in business strategy, goodwill is assigned to reporting units and it no longer retains its association with a particular acquisition. All of the revenue streams and related activities of a reporting unit, whether acquired or organic, are available to support the value of the goodwill.
For purposes of goodwill impairment testing, the Corporation utilizes allocated equity as a proxy for the carrying value of its reporting units. Allocated equity in the reporting units is comprised of allocated capital plus capital for the portion of goodwill and intangibles specifically assigned to the reporting unit. The goodwill impairment test involves comparing the fair value of each reporting unit with its carrying value, including goodwill, as measured by allocated equity. During 2014, the Corporation made refinements to the amount of capital allocated to each of its businesses based on multiple considerations that included, but were not limited to, risk-weighted assets measured under the Basel 3 Standardized and Advanced approaches, business segment exposures and risk profile, and strategic plans. As a result of this process, in 2014, the Corporation adjusted the amount of capital being allocated to its business segments. This change resulted in a reduction of the unallocated capital, which is reflected in All Other, and an aggregate increase to the amount of capital being allocated to the business segments. An increase in allocated capital in the business segments generally results in a reduction of the excess of the fair value over the carrying value and a reduction to the estimated fair value as a percentage of allocated carrying value for an individual reporting unit. Also, certain changes were made to allocated capital to reflect the segment realignment described above. Prior periods have been reclassified to conform to the current period presentation. For more information on this realignment, see Note 1 – Summary of Significant Accounting Principles to the Consolidated Financial Statements.
The Corporation’s common stock price improved during 2014; however, its market capitalization remained below its recorded book value. We estimate that the fair value of all reporting units with assigned goodwill in aggregate as of the June 30, 2014 annual goodwill impairment test was $307.1 billion and the aggregate carrying value of all reporting units with assigned goodwill, as measured by allocated equity, was $175.7 billion. The common stock capitalization of the Corporation as of June 30, 2014 was $161.6 billion ($188.1 billion at December 31, 2014). As none of our reporting units are publicly traded, individual reporting unit fair value determinations do not directly correlate to the Corporation’s stock price. Although we believe it is reasonable to conclude that market capitalization could be an indicator of fair value over time, we do not believe that our current market capitalization reflects the aggregate fair value of our individual reporting units.


92     Bank of America 2014


Estimating the fair value of reporting units is a subjective process that involves the use of estimates and judgments, particularly related to cash flows, the appropriate discount rates and an applicable control premium. We determined the fair values of the reporting units using a combination of valuation techniques consistent with the market approach and the income approach and also utilized independent valuation specialists.
The market approach we used estimates the fair value of the individual reporting units by incorporating any combination of the tangible capital, book capital and earnings multiples from comparable publicly-traded companies in industries similar to that of the reporting unit. The relative weight assigned to these multiples varies among the reporting units based on qualitative and quantitative characteristics, primarily the size and relative profitability of the reporting unit as compared to the comparable publicly-traded companies. Since the fair values determined under the market approach are representative of a noncontrolling interest, we added a control premium to arrive at the reporting units’ estimated fair values on a controlling basis.
For purposes of the income approach, we calculated discounted cash flows by taking the net present value of estimated future cash flows and an appropriate terminal value. Our discounted cash flow analysis employs a capital asset pricing model in estimating the discount rate (i.e., cost of equity financing) for each reporting unit. The inputs to this model include the risk-free rate of return, beta, which is a measure of the level of non-diversifiable risk associated with comparable companies for each specific reporting unit, size premium to reflect the historical incremental return on stocks, market equity risk premium and in certain cases an unsystematic (company-specific) risk factor. The unsystematic risk factor is the input that specifically addresses uncertainty related to our projections of earnings and growth, including the uncertainty related to loss expectations. We utilized discount rates that we believe adequately reflect the risk and uncertainty in the financial markets generally and specifically in our internally developed forecasts. We estimated expected rates of equity returns based on historical market returns and risk/return rates for similar industries of each reporting unit. We use our internal forecasts to estimate future cash flows and actual results may differ from forecasted results.
2014 Annual Impairment Test
During the three months ended September 30, 2014, we completed our annual goodwill impairment test as of June 30, 2014 for all of our reporting units that had goodwill. In performing the first step of the annual goodwill impairment analysis, we compared the fair value of each reporting unit to its estimated carrying value as measured by allocated equity, which includes goodwill. During our 2014 annual goodwill impairment test, we also evaluated the U.K. Card business within All Other, as the U.K. Card business comprises the majority of the goodwill included in All Other. To determine fair value, we utilized a combination of the market approach and the income approach. Under the market approach, we compared earnings and equity multiples of the individual reporting units to multiples of public companies comparable to the individual reporting units. The control premium used in the June 30, 2014 annual goodwill impairment test was 30 percent for all reporting units. Under the income approach, we updated our assumptions to reflect the current market environment. The discount rates used in the June 30, 2014 annual goodwill impairment test ranged from 10.5 percent to 13 percent depending on the relative risk of a reporting unit. Growth rates
 
developed by management for individual revenue and expense items in each reporting unit ranged from (2.9) percent to 8.5 percent.
Based on the results of step one of the annual goodwill impairment test, we determined that step two was not required for any of the reporting units as their fair value exceeded their carrying value indicating there was no impairment.
The fair value for Card Services as of June 30, 2014 no longer considers the negative impact of a July 31, 2013 court ruling regarding the Federal Reserve’s rules on debit card interchange fees, which would have required the Federal Reserve to reconsider the cap on debit card interchange fees. The fair value as of June 30, 2013 considered that potential negative impact contributing to an estimated fair value as a percent of allocated carrying value of 120.3 percent. The U.S. Supreme Court indicated in January 2015 that it would not hear the challenge to the Federal Reserve’s debit card interchange fee rules.
Effective January 1, 2015, the Corporation changed its basis of presentation related to its business segments. The realignment triggered a test for goodwill impairment, which was performed both immediately before and after the realignment. In performing the goodwill impairment test, the Corporation compared the fair value of the affected reporting units with their carrying value as measured by allocated equity. The fair value of the affected reporting units exceeded their carrying value and, accordingly, no goodwill impairment resulted from the realignment.
2013 Annual Impairment Tests
During the three months ended September 30, 2013, we completed our annual goodwill impairment test as of June 30, 2013 for all of our reporting units which had goodwill. Additionally, we also evaluated the U.K. Card business within All Other as the U.K. Card business comprises the majority of the goodwill included in All Other.
Based on the results of step one of the annual goodwill impairment test, we determined that step two was not required for any of the reporting units as their respective fair values exceeded their carrying values indicating there was no impairment.
Representations and Warranties Liability
The methodology used to estimate the liability for obligations under representations and warranties related to transfers of residential mortgage loans is a function of the representations and warranties given and considers a variety of factors. Depending upon the counterparty, these factors include actual defaults, estimated future defaults, historical loss experience, estimated home prices, other economic conditions, estimated probability that we will receive a repurchase request, number of payments made by the borrower prior to default and estimated probability that we will be required to repurchase a loan. It also considers other relevant facts and circumstances, such as bulk settlements and identity of the counterparty or type of counterparty, as appropriate. The estimate of the liability for obligations under representations and warranties is based upon currently available information, significant judgment, and a number of factors, including those set forth above, that are subject to change. Changes to any one of these factors could significantly impact the estimate of our liability.
The representations and warranties provision may vary significantly each period as the methodology used to estimate the expense continues to be refined based on the level and type of repurchase requests presented, defects identified, the latest


Bank of America 2014     93


experience gained on repurchase requests and other relevant facts and circumstances. The estimate of the liability for representations and warranties is sensitive to future defaults, loss severity and the net repurchase rate. An assumed simultaneous increase or decrease of 10 percent in estimated future defaults, loss severity and the net repurchase rate would result in an increase or decrease of approximately $400 million in the representations and warranties liability as of December 31, 2014. These sensitivities are hypothetical and are intended to provide an indication of the impact of a significant change in these key assumptions on the representations and warranties liability. In reality, changes in one assumption may result in changes in other assumptions, which may or may not counteract the sensitivity.
For more information on representations and warranties exposure and the corresponding estimated range of possible loss, see Off-Balance Sheet Arrangements and Contractual Obligations – Representations and Warranties on page 30, as well as Note 7 – Representations and Warranties Obligations and Corporate Guarantees and Note 12 – Commitments and Contingencies to the Consolidated Financial Statements.
Litigation Reserve
For a limited number of the matters disclosed in Note 12 – Commitments and Contingencies to the Consolidated Financial Statements for which a loss is probable or reasonably possible in future periods, whether in excess of a related accrued liability or where there is no accrued liability, we are able to estimate a range of possible loss. In determining whether it is possible to provide an estimate of loss or range of possible loss, the Corporation reviews and evaluates its material litigation and regulatory matters on an ongoing basis, in conjunction with any outside counsel handling the matter, in light of potentially relevant factual and legal developments. These may include information learned through the discovery process, rulings on dispositive motions, settlement discussions, and other rulings by courts, arbitrators or others. In cases in which the Corporation possesses sufficient information to develop an estimate of loss or range of possible loss, that estimate is aggregated and disclosed in Note 12 – Commitments and Contingencies to the Consolidated Financial Statements. For other disclosed matters for which a loss is probable or reasonably possible, such an estimate is not possible. Those matters for which an estimate is not possible are not included within this estimated range. Therefore, the estimated range of possible loss represents what we believe to be an estimate of possible loss only for certain matters meeting these criteria. It does not represent the Corporation’s maximum loss exposure. Information is provided in Note 12 – Commitments and Contingencies to the Consolidated Financial Statements regarding the nature of all of these contingencies and, where specified, the amount of the claim associated with these loss contingencies.
Consolidation and Accounting for Variable Interest Entities
In accordance with applicable accounting guidance, an entity that has a controlling financial interest in a VIE is referred to as the primary beneficiary and consolidates the VIE. The Corporation is deemed to have a controlling financial interest and is the primary beneficiary of a VIE if it has both the power to direct the activities of the VIE that most significantly impact the VIE’s economic performance and an obligation to absorb losses or the right to receive benefits that could potentially be significant to the VIE.
 
Determining whether an entity has a controlling financial interest in a VIE requires significant judgment. An entity must assess the purpose and design of the VIE, including explicit and implicit contractual arrangements, and the entity’s involvement in both the design of the VIE and its ongoing activities. The entity must then determine which activities have the most significant impact on the economic performance of the VIE and whether the entity has the power to direct such activities. For VIEs that hold financial assets, the party that services the assets or makes investment management decisions may have the power to direct the most significant activities of a VIE. Alternatively, a third party that has the unilateral right to replace the servicer or investment manager or to liquidate the VIE may be deemed to be the party with power. If there are no significant ongoing activities, the party that was responsible for the design of the VIE may be deemed to have power. If the entity determines that it has the power to direct the most significant activities of the VIE, then the entity must determine if it has either an obligation to absorb losses or the right to receive benefits that could potentially be significant to the VIE. Such economic interests may include investments in debt or equity instruments issued by the VIE, liquidity commitments, and explicit and implicit guarantees.
On a quarterly basis, we reassess whether we have a controlling financial interest and are the primary beneficiary of a VIE. The quarterly reassessment process considers whether we have acquired or divested the power to direct the activities of the VIE through changes in governing documents or other circumstances. The reassessment also considers whether we have acquired or disposed of a financial interest that could be significant to the VIE, or whether an interest in the VIE has become significant or is no longer significant. The consolidation status of the VIEs with which we are involved may change as a result of such reassessments. Changes in consolidation status are applied prospectively, with assets and liabilities of a newly consolidated VIE initially recorded at fair value. A gain or loss may be recognized upon deconsolidation of a VIE depending on the carrying values of deconsolidated assets and liabilities compared to the fair value of retained interests and ongoing contractual arrangements.

2013 Compared to 2012
The following discussion and analysis provide a comparison of our results of operations for 2013 and 2012. This discussion should be read in conjunction with the Consolidated Financial Statements and related Notes. Tables 7 and 8 contain financial data to supplement this discussion.
Overview
Net Income
Net income was $11.4 billion in 2013 compared to $4.2 billion in 2012. Including preferred stock dividends, net income applicable to common shareholders was $10.1 billion, or $0.90 per diluted share for 2013 and $2.8 billion, or $0.25 per diluted share for 2012.
Net Interest Income
Net interest income on an FTE basis was $43.1 billion for 2013, an increase of $1.6 billion compared to 2012. The increase was primarily due to reductions in long-term debt balances, higher yields on debt securities including the impact of market-related premium amortization expense, lower rates paid on deposits,


94     Bank of America 2014


higher commercial loan balances and increased trading-related net interest income, partially offset by lower consumer loan balances as well as lower asset yields and the low rate environment. The net interest yield on an FTE basis was 2.37 percent for 2013, an increase of 13 bps compared to 2012 due to the same factors as described above.
Noninterest Income
Noninterest income was $46.7 billion in 2013, an increase of $4.0 billion compared to 2012.
Ÿ
Card income decreased $295 million primarily driven by lower revenue from consumer protection products.
Ÿ
Investment and brokerage services income increased $889 million primarily driven by the impact of long-term AUM inflows and higher market levels.
Ÿ
Investment banking income increased $827 million primarily due to strong equity issuance fees attributable to a significant increase in global equity capital markets volume and higher debt issuance fees, primarily within leveraged finance and investment-grade underwriting.
Ÿ
Equity investment income increased $831 million. The results for 2013 included $753 million of gains related to the sale of our remaining investment in CCB and gains of $1.4 billion on the sales of a portion of an equity investment. The results for 2012 included $1.6 billion of gains related to sales of certain equity and strategic investments.
Ÿ
Trading account profits increased $1.2 billion. Net debit valuation adjustment (DVA) losses on derivatives were $509 million in 2013 compared to losses of $2.5 billion in 2012. Excluding net DVA, trading account profits decreased $782 million due to decreases in our FICC businesses driven by a challenging trading environment, partially offset by an increase in our equities businesses.
Ÿ
Mortgage banking income decreased $876 million primarily driven by lower servicing income and lower core production revenue, partially offset by lower representations and warranties provision.
Ÿ
Other income (loss) improved $2.0 billion due to lower negative fair value adjustments on our structured liabilities of $649 million compared to negative fair value adjustments of $5.1 billion in 2012. The prior year included gains of $1.6 billion related to debt repurchases and exchanges of trust preferred securities.
Provision for Credit Losses
The provision for credit losses was $3.6 billion for 2013, a decrease of $4.6 billion compared to 2012. The provision for credit losses was $4.3 billion lower than net charge-offs for 2013, resulting in a reduction in the allowance for credit losses due to continued improvement in the consumer real estate and credit card portfolios. This compared to a $6.7 billion reduction in the allowance for credit losses in 2012.
Net charge-offs totaled $7.9 billion, or 0.87 percent of average loans and leases for 2013 compared to $14.9 billion, or 1.67 percent for 2012. The decrease in net charge-offs was primarily driven by credit quality improvement across all major portfolios. Also, included in 2012 were charge-offs associated with the National Mortgage Settlement and loans discharged in Chapter 7 bankruptcy due to the implementation of regulatory guidance.
 
Noninterest Expense
Noninterest expense was $69.2 billion for 2013, a decrease of $2.9 billion compared to 2012. The decrease was primarily driven by a $967 million decline in other general operating expense largely due to a provision of $1.1 billion in 2012 for the 2013 Independent Foreclosure Review (IFR) Acceleration Agreement, lower FDIC expense, and lower default-related servicing expenses in LAS and mortgage-related assessments, waivers and similar costs related to foreclosure delays. Partially offsetting these declines was a $1.9 billion increase in litigation expense to $6.1 billion in 2013. Personnel expense decreased $929 million in 2013 as we continued to streamline processes and achieve cost savings. Professional fees decreased $690 million due in part to reduced default-related management activities in LAS.
Income Tax Expense
The income tax expense was $4.7 billion on pretax income of $16.2 billion for 2013 compared to an income tax benefit of $1.1 billion on the pretax income of $3.1 billion for 2012. The effective tax rate for 2013 was driven by our recurring tax preference items and by tax benefits related to non-U.S. restructurings. These benefits were partially offset by the $1.1 billion charge to reduce the carrying value of certain U.K deferred tax assets due to the U.K corporate income tax rate reduction in 2013. The negative effective tax rate for 2012 included a $1.7 billion tax benefit attributable to the excess of foreign tax credits recognized in the U.S. upon repatriation of the earnings of certain subsidiaries over the related U.S. tax liability. Partially offsetting the benefit was a $788 million charge to reduce the carrying value of certain U.K. deferred tax assets due to the U.K. corporate income tax rate reduction enacted in 2012.

Business Segment Operations
Consumer Banking
Consumer Banking recorded net income of $6.2 billion in both 2013 and 2012 as a decrease in noninterest income was offset by lower provision for credit losses and noninterest expense. Net interest income remained relatively unchanged as the impact of higher deposit balances was offset by the impact of lower average loan balances. Noninterest income decreased $1.5 billion to $11.3 billion in 2013 due to a decline in mortgage banking income, the allocation of certain card revenue to GWIM for clients with a credit card, and lower deposit service charges, partially offset by the net impact of consumer protection products primarily due to charges in 2012. Mortgage banking income decreased $1.4 billion to $1.9 billion in 2013 due to lower core production revenue driven by industry-wide margin compression combined with lower loan application volumes. The provision for credit losses decreased $1.0 billion to $3.2 billion in 2013 primarily as a result of improvements in credit quality. Noninterest expense decreased $529 million to $18.9 billion primarily due to lower operating and FDIC expenses.


Bank of America 2014     95


Global Wealth & Investment Management
GWIM recorded net income of $3.0 billion in 2013 compared to $2.2 billion in 2012 with the increase driven by higher revenue and lower provision for credit losses, partially offset by higher noninterest expense. Revenue increased $1.3 billion primarily driven by higher asset management fees. The provision for credit losses decreased $210 million to $56 million driven by continued improvement in the home equity portfolio. Noninterest expense increased $311 million to $13.0 billion due to higher volume-driven expenses and higher support costs, partially offset by lower other personnel costs.
Global Banking
Global Banking recorded net income of $5.2 billion in 2013 compared to $5.6 billion in 2012 with the decrease primarily driven by an increase in the provision for credit losses, partially offset by higher revenue. Revenue increased $844 million to $17.5 billion in 2013 as higher net interest income due to the impact of loan growth, and higher investment banking fees were partially offset by lower other income due to gains on the liquidation of certain portfolios in 2012. The provision for credit losses increased $1.5 billion to $1.1 billion compared to a benefit of $321 million in 2012 primarily due to increased reserves as a result of commercial loan growth. Noninterest expense remained relatively unchanged in 2013 primarily due to lower personnel expense largely offset by higher litigation expense.
Global Markets
Global Markets recorded net income of $1.2 billion in 2013 compared to a net loss of $2.0 billion in 2012. Excluding net DVA and charges of $1.1 billion related to the U.K. corporate income tax rate reduction in 2013 and $781 million in 2012, net income decreased $547 million to $3.0 billion primarily driven by lower FICC revenue due to a challenging trading environment, and higher noninterest expense, partially offset by an increase in equities revenue. Net DVA losses were $1.2 billion compared to losses of $7.6 billion in 2012. Noninterest expense increased $710 million to $12.0 billion due to an increase in litigation expense. Income
 
tax expense for both years included a charge for remeasurement of certain deferred tax assets due to the decreases in the U.K. corporate tax rate.
Legacy Assets & Servicing
LAS recorded a net loss of $4.9 billion in 2013 compared to a net loss of $7.2 billion in 2012 with the decrease in the net loss primarily driven by lower provision for credit losses, lower noninterest expense and higher mortgage banking income. Mortgage banking income increased $402 million due to a $3.1 billion decrease in representations and warranties provision as 2012 included provision related to the January 2013 settlement with FNMA, largely offset by lower servicing income. The provision for credit losses improved $1.7 billion to a benefit of $283 million due to improved delinquencies, increased home prices and continued loan balance run-off. Noninterest expense decreased $1.3 billion to $12.5 billion due to lower operating expenses, partially offset by higher litigation expense.
All Other
All Other recorded net income of $762 million in 2013 compared to a net loss of $661 million in 2012 with the increase driven by improvement in the provision for credit losses, higher equity investment income and lower noninterest expense, partially offset by a lower income tax benefit and lower gains on sales of debt securities. The provision for credit losses improved $3.3 billion to a benefit of $665 million in 2013 primarily driven by continued improvement in portfolio trends including increased home prices in the residential mortgage portfolio. Noninterest expense decreased $2.0 billion to $4.6 billion primarily due to lower litigation expense. The income tax benefit was $2.0 billion in 2013 compared to a benefit of $4.1 billion in 2012. The decrease was driven by the decline in the pretax loss in All Other and lower tax benefits as 2012 included a $1.7 billion tax benefit attributable to the excess of foreign tax credits recognized in the U.S. upon repatriation of the earnings of certain subsidiaries over the related U.S. tax liability.


96     Bank of America 2014


Statistical Tables


Table of Contents


Page


Bank of America 2014     97


Table I  Average Balances and Interest Rates – FTE Basis


2014
 
2013
 
2012
(Dollars in millions)
Average
Balance
 
Interest
Income/
Expense
 
Yield/
Rate
 
Average
Balance
 
Interest
Income/
Expense
 
Yield/
Rate
 
Average
Balance
 
Interest
Income/
Expense
 
Yield/
Rate
Earning assets


Interest-bearing deposits with the Federal Reserve and non-U.S. central banks (1)
$
113,999

 
$
308

 
0.27
%
 
$
72,574

 
$
182

 
0.25
%
 
$
81,741

 
$
190

 
0.23
%
Time deposits placed and other short-term investments
11,032

 
170

 
1.54

 
16,066

 
187

 
1.16

 
22,888

 
236

 
1.03

Federal funds sold and securities borrowed or purchased under agreements to resell
222,483

 
1,039

 
0.47

 
224,331

 
1,229

 
0.55

 
236,042

 
1,502

 
0.64

Trading account assets
145,686

 
4,716

 
3.24

 
168,998

 
4,879

 
2.89

 
170,647

 
5,306

 
3.11

Debt securities (2)
351,702

 
8,062

 
2.28

 
337,953

 
9,779

 
2.89

 
353,577

 
8,931

 
2.53

Loans and leases (3):


Residential mortgage (4)
237,270

 
8,462

 
3.57

 
256,535

 
9,317

 
3.63

 
264,164

 
9,845

 
3.73

Home equity
89,705

 
3,340

 
3.72

 
100,263

 
3,835

 
3.82

 
117,339

 
4,426

 
3.77

U.S. credit card
88,962

 
8,313

 
9.34

 
90,369

 
8,792

 
9.73

 
94,863

 
9,504

 
10.02

Non-U.S. credit card
11,511

 
1,200

 
10.42

 
10,861

 
1,271

 
11.70

 
13,549

 
1,572

 
11.60

Direct/Indirect consumer (5)
82,410

 
2,099

 
2.55

 
82,907

 
2,370

 
2.86

 
84,424

 
2,900

 
3.44

Other consumer (6)
2,028

 
139

 
6.86

 
1,807

 
72

 
4.02

 
2,359

 
140

 
5.95

Total consumer
511,886

 
23,553

 
4.60

 
542,742

 
25,657

 
4.73

 
576,698

 
28,387

 
4.92

U.S. commercial
230,175

 
6,630

 
2.88

 
218,874

 
6,809

 
3.11

 
201,352

 
6,979

 
3.47

Commercial real estate (7)
47,524

 
1,411

 
2.97

 
42,346

 
1,391

 
3.29

 
37,982

 
1,332

 
3.51

Commercial lease financing
24,423

 
837

 
3.43

 
23,863

 
851

 
3.56

 
21,879

 
874

 
4.00

Non-U.S. commercial
89,893

 
2,218

 
2.47

 
90,816

 
2,083

 
2.29

 
60,857

 
1,594

 
2.62

Total commercial
392,015

 
11,096

 
2.83

 
375,899

 
11,134

 
2.96

 
322,070

 
10,779

 
3.35

Total loans and leases
903,901

 
34,649

 
3.83

 
918,641

 
36,791

 
4.00

 
898,768

 
39,166

 
4.36

Other earning assets
66,127

 
2,811

 
4.25

 
80,985

 
2,832

 
3.50

 
88,047

 
2,970

 
3.36

Total earning assets (8)
1,814,930

 
51,755

 
2.85

 
1,819,548

 
55,879

 
3.07

 
1,851,710

 
58,301

 
3.15

Cash and due from banks (1)
27,079


36,440


33,998


Other assets, less allowance for loan and lease losses
303,581


307,525


305,648


Total assets
$
2,145,590


$
2,163,513


$
2,191,356


Interest-bearing liabilities


U.S. interest-bearing deposits:


Savings
$
46,270

 
$
3

 
0.01
%
 
$
43,868

 
$
22

 
0.05
%
 
$
41,453

 
$
45

 
0.11
%
NOW and money market deposit accounts
518,894

 
316

 
0.06

 
506,082

 
413

 
0.08

 
466,096

 
693

 
0.15

Consumer CDs and IRAs
66,798

 
264

 
0.40

 
79,914

 
471

 
0.59

 
95,559

 
693

 
0.73

Negotiable CDs, public funds and other deposits
31,502

 
106

 
0.33

 
26,553

 
116

 
0.43

 
20,928

 
128

 
0.61

Total U.S. interest-bearing deposits
663,464

 
689

 
0.10

 
656,417

 
1,022

 
0.16

 
624,036

 
1,559

 
0.25

Non-U.S. interest-bearing deposits:


Banks located in non-U.S. countries
8,744

 
74

 
0.84

 
12,432

 
80

 
0.64

 
14,737

 
94

 
0.64

Governments and official institutions
1,740

 
3

 
0.15

 
1,584

 
3

 
0.18

 
1,019

 
4

 
0.35

Time, savings and other
60,732

 
314

 
0.52

 
55,628

 
291

 
0.52

 
53,318

 
333

 
0.63

Total non-U.S. interest-bearing deposits
71,216

 
391

 
0.55

 
69,644

 
374

 
0.54

 
69,074

 
431

 
0.62

Total interest-bearing deposits
734,680

 
1,080

 
0.15

 
726,061

 
1,396

 
0.19

 
693,110

 
1,990

 
0.29

Federal funds purchased, securities loaned or sold under agreements to repurchase and short-term borrowings
257,678

 
2,578

 
1.00

 
301,416

 
2,923

 
0.97

 
318,400

 
3,572

 
1.12

Trading account liabilities
87,151

 
1,576

 
1.81

 
88,323

 
1,638

 
1.85

 
78,554

 
1,763

 
2.24

Long-term debt
253,607

 
5,700

 
2.25

 
263,417

 
6,798

 
2.58

 
316,393

 
9,419

 
2.98

Total interest-bearing liabilities (8)
1,333,116

 
10,934

 
0.82

 
1,379,217

 
12,755

 
0.92

 
1,406,457

 
16,744

 
1.19

Noninterest-bearing sources:


Noninterest-bearing deposits
389,527


363,674


354,672


Other liabilities
184,471


186,675


194,550


Shareholders’ equity
238,476


233,947


235,677


Total liabilities and shareholders’ equity
$
2,145,590


$
2,163,513


$
2,191,356


Net interest spread


2.03
%


2.15
%


1.96
%
Impact of noninterest-bearing sources


0.22


0.22


0.28

Net interest income/yield on earning assets


$
40,821

 
2.25
%


$
43,124

 
2.37
%


$
41,557

 
2.24
%
(1) 
Beginning in 2014, interest-bearing deposits placed with the Federal Reserve and certain non-U.S. central banks are included in earning assets. In prior periods, these balances were included with cash and due from banks in the cash and cash equivalents line, consistent with the Consolidated Balance Sheet presentation. Prior periods have been reclassified to conform to current period presentation.
(2) 
Beginning in 2014, yields on debt securities carried at fair value are calculated on the cost basis. Prior to 2014, yields on debt securities carried at fair value were calculated based on fair value rather than the cost basis. The use of fair value does not have a material impact on net interest yield.
(3) 
Nonperforming loans are included in the respective average loan balances. Income on these nonperforming loans is generally recognized on a cost recovery basis. PCI loans were recorded at fair value upon acquisition and accrete interest income over the remaining life of the loan.
(4) 
Includes non-U.S. residential mortgage loans of $2 million, $79 million and $90 million in 2014, 2013 and 2012, respectively.
(5) 
Includes non-U.S. consumer loans of $4.4 billion, $6.7 billion and $7.8 billion in 2014, 2013 and 2012, respectively.
(6) 
Includes consumer finance loans of $1.1 billion, $1.3 billion and $1.5 billion; consumer leases of $818 million, $351 million and $0; consumer overdrafts of $148 million, $153 million and $128 million; and other non-U.S. consumer loans of $3 million, $5 million and $699 million; and in 2014, 2013 and 2012, respectively.
(7) 
Includes U.S. commercial real estate loans of $46.0 billion, $40.7 billion and $36.4 billion, and non-U.S. commercial real estate loans of $1.6 billion, $1.6 billion and $1.6 billion in 2014, 2013 and 2012, respectively.
(8) 
Interest income includes the impact of interest rate risk management contracts, which decreased interest income on the underlying assets by $58 million, $205 million and $754 million in 2014, 2013 and 2012, respectively. Interest expense includes the impact of interest rate risk management contracts, which decreased interest expense on the underlying liabilities by $2.5 billion, $2.4 billion and $2.3 billion in 2014, 2013 and 2012, respectively. For more information on interest rate contracts, see Interest Rate Risk Management for Non-trading Activities on page 85.

98     Bank of America 2014


Table II  Analysis of Changes in Net Interest Income – FTE Basis


From 2013 to 2014
 
From 2012 to 2013
 
Due to Change in (1)


Due to Change in (1)
 
 
(Dollars in millions)
Volume
 
Rate
 
Net Change
 
Volume
 
Rate
 
Net Change
Increase (decrease) in interest income


Interest-bearing deposits with the Federal Reserve and non-U.S. central banks (2)
$
103

 
$
23

 
$
126

 
$
(23
)
 
$
15

 
$
(8
)
Time deposits placed and other short-term investments
(59
)
 
42

 
(17
)
 
(71
)
 
22

 
(49
)
Federal funds sold and securities borrowed or purchased under agreements to resell
(5
)
 
(185
)
 
(190
)
 
(66
)
 
(207
)
 
(273
)
Trading account assets
(669
)
 
506

 
(163
)
 
(50
)
 
(377
)
 
(427
)
Debt securities
385

 
(2,102
)
 
(1,717
)
 
(381
)
 
1,229

 
848

Loans and leases:


Residential mortgage
(704
)
 
(151
)
 
(855
)
 
(276
)
 
(252
)
 
(528
)
Home equity
(408
)
 
(87
)
 
(495
)
 
(646
)
 
55

 
(591
)
U.S. credit card
(136
)
 
(343
)
 
(479
)
 
(449
)
 
(263
)
 
(712
)
Non-U.S. credit card
76

 
(147
)
 
(71
)
 
(312
)
 
11

 
(301
)
Direct/Indirect consumer
(13
)
 
(258
)
 
(271
)
 
(48
)
 
(482
)
 
(530
)
Other consumer
10

 
57

 
67

 
(32
)
 
(36
)
 
(68
)
Total consumer


(2,104
)


(2,730
)
U.S. commercial
349

 
(528
)
 
(179
)
 
616

 
(786
)
 
(170
)
Commercial real estate
173

 
(153
)
 
20

 
154

 
(95
)
 
59

Commercial lease financing
18

 
(32
)
 
(14
)
 
81

 
(104
)
 
(23
)
Non-U.S. commercial
(24
)
 
159

 
135

 
785

 
(296
)
 
489

Total commercial


(38
)


355

Total loans and leases


(2,142
)


(2,375
)
Other earning assets
(518
)
 
497

 
(21
)
 
(249
)
 
111

 
(138
)
Total interest income


$
(4,124
)


$
(2,422
)
Increase (decrease) in interest expense


U.S. interest-bearing deposits:


Savings
$
1

 
$
(20
)
 
$
(19
)
 
$
3

 
$
(26
)
 
$
(23
)
NOW and money market deposit accounts
2

 
(99
)
 
(97
)
 
66

 
(346
)
 
(280
)
Consumer CDs and IRAs
(77
)
 
(130
)
 
(207
)
 
(110
)
 
(112
)
 
(222
)
Negotiable CDs, public funds and other deposits
19

 
(29
)
 
(10
)
 
34

 
(46
)
 
(12
)
Total U.S. interest-bearing deposits


(333
)


(537
)
Non-U.S. interest-bearing deposits:


Banks located in non-U.S. countries
(24
)
 
18

 
(6
)
 
(14
)


(14
)
Governments and official institutions


2

 
(3
)
 
(1
)
Time, savings and other
25

 
(2
)
 
23

 
17

 
(59
)
 
(42
)
Total non-U.S. interest-bearing deposits


17


(57
)
Total interest-bearing deposits


(316
)


(594
)
Federal funds purchased, securities loaned or sold under agreements to repurchase and short-term borrowings
(424
)
 
79

 
(345
)
 
(196
)
 
(453
)
 
(649
)
Trading account liabilities
(26
)
 
(36
)
 
(62
)
 
215

 
(340
)
 
(125
)
Long-term debt
(255
)
 
(843
)
 
(1,098
)
 
(1,569
)
 
(1,052
)
 
(2,621
)
Total interest expense


(1,821
)


(3,989
)
Net increase (decrease) in net interest income


$
(2,303
)


$
1,567

(1) 
The changes for each category of interest income and expense are divided between the portion of change attributable to the variance in volume and the portion of change attributable to the variance in rate for that category. The unallocated change in rate or volume variance is allocated between the rate and volume variances.
(2) 
Beginning in 2014, interest-bearing deposits placed with the Federal Reserve and certain non-U.S. central banks are included in earning assets. In prior periods, these balances were included with cash and due from banks in the cash and cash equivalents line, consistent with the Consolidated Balance Sheet presentation. Prior periods have been reclassified to conform to current period presentation.


Bank of America 2014     99


Table III  Preferred Stock Cash Dividend Summary (1)


December 31, 2014


Preferred Stock
 
Outstanding
Notional
Amount
(in millions)
 
 
Declaration Date
 
Record Date
 
Payment Date
 
Per Annum
Dividend Rate
 
Dividend Per
Share
Series B (2)
 
$
1


February 10, 2015
 
April 10, 2015
 
April 24, 2015
 
7.00
%
 
$
1.75


October 23, 2014
 
January 9, 2015
 
January 23, 2015
 
7.00

 
1.75


August 6, 2014
 
October 10, 2014
 
October 24, 2014
 
7.00

 
1.75


June 18, 2014
 
July 11, 2014
 
July 25, 2014
 
7.00

 
1.75


February 11, 2014
 
April 11, 2014
 
April 25, 2014
 
7.00

 
1.75

Series D (3)
 
$
654


January 9, 2015
 
February 27, 2015
 
March 16, 2015
 
6.204
%
 
$
0.38775


October 9, 2014
 
November 28, 2014
 
December 15, 2014
 
6.204

 
0.38775


July 9, 2014
 
August 29, 2014
 
September 15, 2014
 
6.204

 
0.38775


April 2, 2014
 
May 30, 2014
 
June 16, 2014
 
6.204

 
0.38775


January 13, 2014
 
February 28, 2014
 
March 14, 2014
 
6.204

 
0.38775

Series E (3)
 
$
317


January 9, 2015
 
January 30, 2015
 
February 17, 2015
 
Floating

 
$
0.25556


October 9, 2014
 
October 31, 2014
 
November 17, 2014
 
Floating

 
0.25556


July 9, 2014
 
July 31, 2014
 
August 15, 2014
 
Floating

 
0.25556


April 2, 2014
 
April 30, 2014
 
May 15, 2014
 
Floating

 
0.24722


January 13, 2014
 
January 31, 2014
 
February 18, 2014
 
Floating

 
0.25556

Series F
 
$
141


January 9, 2015
 
February 27, 2015
 
March 16, 2015
 
Floating

 
$
1,000.00


October 9, 2014
 
November 28, 2014
 
December 15, 2014
 
Floating

 
1,011.11111


July 9, 2014
 
August 29, 2014
 
September 15, 2014
 
Floating

 
1,022.22222


April 2, 2014
 
May 30, 2014
 
June 16, 2014
 
Floating

 
1,022.22222


January 13, 2014
 
February 28, 2014
 
March 17, 2014
 
Floating

 
1,000.00

Series G
 
$
493


January 9, 2015
 
February 27, 2015
 
March 16, 2015
 
Adjustable

 
$
1,000.00


October 9, 2014
 
November 28, 2014
 
December 15, 2014
 
Adjustable

 
1,011.11111


July 9, 2014
 
August 29, 2014
 
September 15, 2014
 
Adjustable

 
1,022.22222


April 2, 2014
 
May 30, 2014
 
June 16, 2014
 
Adjustable

 
1,022.22222


January 13, 2014
 
February 28, 2014
 
March 17, 2014
 
Adjustable

 
1,000.00

Series I (3)
 
$
365


January 9, 2015
 
March 15, 2015
 
April 1, 2015
 
6.625
%
 
$
0.4140625


October 9, 2014
 
December 15, 2014
 
January 2, 2015
 
6.625

 
0.4140625


July 9, 2014
 
September 15, 2014
 
October 1, 2014
 
6.625

 
0.4140625


April 2, 2014
 
June 15, 2014
 
July 1, 2014
 
6.625

 
0.4140625


January 13, 2014
 
March 15, 2014
 
April 1, 2014
 
6.625

 
0.4140625

Series K (4, 5)
 
$
1,544


January 9, 2015
 
January 15, 2015
 
January 30, 2015
 
Fixed-to-floating

 
$
40.00


July 9, 2014
 
July 15, 2014
 
July 30, 2014
 
Fixed-to-floating

 
40.00


January 13, 2014
 
January 15, 2014
 
January 30, 2014
 
Fixed-to-floating

 
40.00

Series L
 
$
3,080


December 17, 2014
 
January 1, 2015
 
January 30, 2015
 
7.25
%
 
$
18.125


September 16, 2014
 
October 1, 2014
 
October 30, 2014
 
7.25

 
18.125


June 18, 2014
 
July 1, 2014
 
July 30, 2014
 
7.25

 
18.125


March 6, 2014
 
April 1, 2014
 
April 30, 2014
 
7.25

 
18.125

Series M (4, 5)
 
$
1,310


October 9, 2014
 
October 31, 2014
 
November 17, 2014
 
Fixed-to-floating

 
$
40.625


April 2, 2014
 
April 30, 2014
 
May 15, 2014
 
Fixed-to-floating

 
40.625

Series T (6)
 
$
5,000


February 10, 2015
 
March 26, 2015
 
April 10, 2015
 
6.00
%
 
$
1,500.00


October 23, 2014
 
December 25, 2014
 
January 10, 2015
 
6.00

 
1,500.00


August 6, 2014
 
September 25, 2014
 
October 10, 2014
 
6.00

 
1,500.00


June 18, 2014
 
June 25, 2014
 
July 10, 2014
 
6.00

 
1,500.00


March 6, 2014
 
March 26, 2014
 
April 10, 2014
 
6.00

 
1,500.00

Series U (4, 5)
 
$
1,000


October 9, 2014
 
November 15, 2014
 
December 1, 2014
 
Fixed-to-floating

 
$
26.00


April 2, 2014
 
May 15, 2014
 
June 2, 2014
 
Fixed-to-floating

 
26.00

Series V (4, 5)
 
$
1,500


October 9, 2014
 
December 1, 2014
 
December 17, 2014
 
Fixed-to-floating

 
$
25.625

Series W (3)
 
$
1,100


January 9, 2015
 
February 15, 2015
 
March 9, 2015
 
Fixed

 
$
0.4140625


October 9, 2014
 
November 15, 2014
 
December 9, 2014
 
Fixed

 
0.4140625

Series X (4, 5)
 
$
2,000


January 9, 2015
 
February 15, 2015
 
March 5, 2015
 
Fixed-to-floating

 
$
31.25

(1) 
Preferred stock cash dividend summary is as of February 25, 2015.
(2) 
Dividends are cumulative.
(3) 
Dividends per depositary share, each representing a 1/1,000th interest in a share of preferred stock.
(4) 
Initially pays dividends semi-annually.
(5) 
Dividends per depositary share, each representing a 1/25th interest in a share of preferred stock.
(6) 
For information on the amendment of the Series T Preferred Stock, see Note 13 – Shareholders’ Equity to the Consolidated Financial Statements.


100     Bank of America 2014


Table III  Preferred Stock Cash Dividend Summary (1) (continued)


December 31, 2014


Preferred Stock
 
Outstanding
Notional
Amount
(in millions)
 
 
Declaration Date
 
Record Date
 
Payment Date
 
Per Annum
Dividend Rate
 
Dividend Per
Share
Series 1 (7)
 
$
98


January 9, 2015
 
February 15, 2015
 
February 27, 2015
 
Floating

 
$
0.18750


October 9, 2014
 
November 15, 2014
 
November 28, 2014
 
Floating

 
0.18750


July 9, 2014
 
August 15, 2014
 
August 28, 2014
 
Floating

 
0.18750


April 2, 2014
 
May 15, 2014
 
May 28, 2014
 
Floating

 
0.18750


January 13, 2014
 
February 15, 2014
 
February 28, 2014
 
Floating

 
0.18750

Series 2 (7)
 
$
299


January 9, 2015
 
February 15, 2015
 
February 27, 2015
 
Floating

 
$
0.19167


October 9, 2014
 
November 15, 2014
 
November 28, 2014
 
Floating

 
0.19167


July 9, 2014
 
August 15, 2014
 
August 28, 2014
 
Floating

 
0.19167


April 2, 2014
 
May 15, 2014
 
May 28, 2014
 
Floating

 
0.18542


January 13, 2014
 
February 15, 2014
 
February 28, 2014
 
Floating

 
0.19167

Series 3 (7)
 
$
653


January 9, 2015
 
February 15, 2015
 
March 2, 2015
 
6.375
%
 
$
0.3984375


October 9, 2014
 
November 15, 2014
 
November 28, 2014
 
6.375

 
0.3984375


July 9, 2014
 
August 15, 2014
 
August 28, 2014
 
6.375

 
0.3984375


April 2, 2014
 
May 15, 2014
 
May 28, 2014
 
6.375

 
0.3984375


January 13, 2014
 
February 15, 2014
 
February 28, 2014
 
6.375

 
0.3984375

Series 4 (7)
 
$
210


January 9, 2015
 
February 15, 2015
 
February 27, 2015
 
Floating

 
$
0.25556


October 9, 2014
 
November 15, 2014
 
November 28, 2014
 
Floating

 
0.25556


July 9, 2014
 
August 15, 2014
 
August 28, 2014
 
Floating

 
0.25556


April 2, 2014
 
May 15, 2014
 
May 28, 2014
 
Floating

 
0.24722


January 13, 2014
 
February 15, 2014
 
February 28, 2014
 
Floating

 
0.25556

Series 5 (7)
 
$
422


January 9, 2015
 
February 1, 2015
 
February 23, 2015
 
Floating

 
$
0.25556


October 9, 2014
 
November 1, 2014
 
November 21, 2014
 
Floating

 
0.25556


July 9, 2014
 
August 1, 2014
 
August 21, 2014
 
Floating

 
0.25556


April 2, 2014
 
May 1, 2014
 
May 21, 2014
 
Floating

 
0.24722


January 13, 2014
 
February 1, 2014
 
February 21, 2014
 
Floating

 
0.25556

(7) 
Dividends per depositary share, each representing a 1/1,200th interest in a share of preferred stock.


Bank of America 2014     101


Table IV  Outstanding Loans and Leases


December 31
(Dollars in millions)
2014
 
2013
 
2012
 
2011
 
2010
Consumer


Residential mortgage (1)
$
216,197

 
$
248,066

 
$
252,929

 
$
273,228

 
$
270,901

Home equity
85,725

 
93,672

 
108,140

 
124,856

 
138,161

U.S. credit card
91,879

 
92,338

 
94,835

 
102,291

 
113,785

Non-U.S. credit card
10,465

 
11,541

 
11,697

 
14,418

 
27,465

Direct/Indirect consumer (2)
80,381

 
82,192

 
83,205

 
89,713

 
90,308

Other consumer (3)
1,846

 
1,977

 
1,628

 
2,688

 
2,830

Total consumer loans excluding loans accounted for under the fair value option
486,493

 
529,786

 
552,434

 
607,194

 
643,450

Consumer loans accounted for under the fair value option (4)
2,077

 
2,164

 
1,005

 
2,190


Total consumer
488,570

 
531,950

 
553,439

 
609,384

 
643,450

Commercial


U.S. commercial (5)
233,586

 
225,851

 
209,719

 
193,199

 
190,305

Commercial real estate (6)
47,682

 
47,893

 
38,637

 
39,596

 
49,393

Commercial lease financing
24,866

 
25,199

 
23,843

 
21,989

 
21,942

Non-U.S. commercial
80,083

 
89,462

 
74,184

 
55,418

 
32,029

Total commercial loans excluding loans accounted for under the fair value option
386,217

 
388,405

 
346,383

 
310,202

 
293,669

Commercial loans accounted for under the fair value option (4)
6,604

 
7,878

 
7,997

 
6,614

 
3,321

Total commercial
392,821

 
396,283

 
354,380

 
316,816

 
296,990

Total loans and leases
$
881,391

 
$
928,233

 
$
907,819

 
$
926,200

 
$
940,440

(1) 
Includes pay option loans of $3.2 billion, $4.4 billion, $6.7 billion, $9.9 billion and $11.8 billion and non-U.S. residential mortgage loans of $2 million, $0, $93 million, $85 million and $90 million at December 31, 2014, 2013, 2012, 2011 and 2010, respectively. The Corporation no longer originates pay option loans.
(2) 
Includes dealer financial services loans of $37.7 billion, $38.5 billion, $35.9 billion, $43.0 billion and $43.3 billion, unsecured consumer lending loans of $1.5 billion, $2.7 billion, $4.7 billion, $8.0 billion and $12.4 billion, U.S. securities-based lending loans of $35.8 billion, $31.2 billion, $28.3 billion, $23.6 billion and $16.6 billion, non-U.S. consumer loans of $4.0 billion, $4.7 billion, $8.3 billion, $7.6 billion and $8.0 billion, student loans of $632 million, $4.1 billion, $4.8 billion, $6.0 billion and $6.8 billion, and other consumer loans of $761 million, $1.0 billion, $1.2 billion, $1.5 billion and $3.2 billion at December 31, 2014, 2013, 2012, 2011 and 2010, respectively.
(3) 
Includes consumer finance loans of $676 million, $1.2 billion, $1.4 billion, $1.7 billion and $1.9 billion, consumer leases of $1.0 billion, $606 million, $34 million, $0 and $0, consumer overdrafts of $162 million, $176 million, $177 million, $103 million and $88 million, and other non-U.S. consumer loans of $3 million, $5 million, $5 million, $929 million and $803 million at December 31, 2014, 2013, 2012, 2011 and 2010, respectively.
(4) 
Consumer loans accounted for under the fair value option were residential mortgage loans of $1.9 billion, $2.0 billion, $1.0 billion and $2.2 billion, and home equity loans of $196 million, $147 million, $0 and $0 at December 31, 2014, 2013, 2012 and 2011, respectively. There were no consumer loans accounted for under the fair value option prior to 2011. Commercial loans accounted for under the fair value option were U.S. commercial loans of $1.9 billion, $1.5 billion, $2.3 billion, $2.2 billion and $1.6 billion, commercial real estate loans of $0, $0, $0, $0 and $79 million, and non-U.S. commercial loans of $4.7 billion, $6.4 billion, $5.7 billion, $4.4 billion and $1.7 billion at December 31, 2014, 2013, 2012, 2011 and 2010, respectively.
(5) 
Includes U.S. small business commercial loans, including card-related products, of $13.3 billion, $13.3 billion, $12.6 billion, $13.3 billion and $14.7 billion at December 31, 2014, 2013, 2012, 2011 and 2010, respectively.
(6) 
Includes U.S. commercial real estate loans of $45.2 billion, $46.3 billion, $37.2 billion, $37.8 billion and $46.9 billion, and non-U.S. commercial real estate loans of $2.5 billion, $1.6 billion, $1.5 billion, $1.8 billion and $2.5 billion at December 31, 2014, 2013, 2012, 2011 and 2010, respectively.


102     Bank of America 2014


Table V  Nonperforming Loans, Leases and Foreclosed Properties (1)


December 31
(Dollars in millions)
2014
 
2013
 
2012
 
2011
 
2010
Consumer


Residential mortgage
$
6,889

 
$
11,712

 
$
15,055

 
$
16,259

 
$
18,020

Home equity
3,901

 
4,075

 
4,282

 
2,454

 
2,696

Direct/Indirect consumer
28

 
35

 
92

 
40

 
90

Other consumer
1

 
18

 
2

 
15

 
48

Total consumer (2)
10,819

 
15,840

 
19,431

 
18,768

 
20,854

Commercial


U.S. commercial
701

 
819

 
1,484

 
2,174

 
3,453

Commercial real estate
321

 
322

 
1,513

 
3,880

 
5,829

Commercial lease financing
3

 
16

 
44

 
26

 
117

Non-U.S. commercial
1

 
64

 
68

 
143

 
233

 
1,026

 
1,221

 
3,109

 
6,223

 
9,632

U.S. small business commercial
87

 
88

 
115

 
114

 
204

Total commercial (3)
1,113

 
1,309

 
3,224

 
6,337

 
9,836

Total nonperforming loans and leases
11,932

 
17,149

 
22,655

 
25,105

 
30,690

Foreclosed properties
697

 
623

 
900

 
2,603

 
1,974

Total nonperforming loans, leases and foreclosed properties
$
12,629

 
$
17,772

 
$
23,555

 
$
27,708

 
$
32,664

(1) 
Balances do not include PCI loans even though the customer may be contractually past due. PCI loans were recorded at fair value upon acquisition and accrete interest income over the remaining life of the loan. In addition, balances do not include foreclosed properties that are insured by the FHA and have entered foreclosure of $1.1 billion, $1.4 billion, $2.5 billion and $1.4 billion at December 31, 2014, 2013, 2012 and 2011, respectively.
(2) 
In 2014, $1.8 billion in interest income was estimated to be contractually due on $10.8 billion of consumer loans and leases classified as nonperforming, at December 31, 2104, as presented in the table above, plus $20.6 billion of TDRs classified as performing at December 31, 2014. Approximately $960 million of the estimated $1.8 billion in contractual interest was received and included in interest income for 2014.
(3) 
In 2014, $110 million in interest income was estimated to be contractually due on $1.1 billion of commercial loans and leases classified as nonperforming, at December 31, 2014, as presented in the table above, plus $1.1 billion of TDRs classified as performing at December 31, 2014. Approximately $66 million of the estimated $110 million in contractual interest was received and included in interest income for 2014.


Table VI  Accruing Loans and Leases Past Due 90 Days or More (1)


December 31
(Dollars in millions)
2014
 
2013
 
2012
 
2011
 
2010
Consumer


Residential mortgage (2)
$
11,407

 
$
16,961

 
$
22,157

 
$
21,164

 
$
16,768

U.S. credit card
866

 
1,053

 
1,437

 
2,070

 
3,320

Non-U.S. credit card
95

 
131

 
212

 
342

 
599

Direct/Indirect consumer
64

 
408

 
545

 
746

 
1,058

Other consumer
1

 
2

 
2

 
2

 
2

Total consumer
12,433

 
18,555

 
24,353

 
24,324

 
21,747

Commercial


U.S. commercial 
110

 
47

 
65

 
75

 
236

Commercial real estate
3

 
21

 
29

 
7

 
47

Commercial lease financing
41

 
41

 
15

 
14

 
18

Non-U.S. commercial

 
17


6

 
154

 
126

 
109

 
96

 
307

U.S. small business commercial
67

 
78

 
120

 
216

 
325

Total commercial
221

 
204

 
229

 
312

 
632

Total accruing loans and leases past due 90 days or more (3)
$
12,654

 
$
18,759

 
$
24,582

 
$
24,636

 
$
22,379

(1) 
Our policy is to classify consumer real estate-secured loans as nonperforming at 90 days past due, except the PCI loan portfolio, the fully-insured loan portfolio and loans accounted for under the fair value option as referenced in footnote 3.
(2) 
Balances are fully-insured loans.
(3) 
Balances exclude loans accounted for under the fair value option. At December 31, 2014 and 2013, $5 million and $8 million of loans accounted for under the fair value option were past due 90 days or more and still accruing interest. At December 31, 2012, 2011 and 2010, there were no loans accounted for under the fair value option that were past due 90 days or more and still accruing interest.


Bank of America 2014     103


Table VII  Allowance for Credit Losses


(Dollars in millions)
2014
 
2013
 
2012
 
2011
 
2010
Allowance for loan and lease losses, January 1 (1)
$
17,428

 
$
24,179

 
$
33,783

 
$
41,885

 
$
47,988

Loans and leases charged off


Residential mortgage
(855
)
 
(1,508
)
 
(3,276
)
 
(4,294
)
 
(3,843
)
Home equity
(1,364
)
 
(2,258
)
 
(4,573
)
 
(4,997
)
 
(7,072
)
U.S. credit card
(3,068
)
 
(4,004
)
 
(5,360
)
 
(8,114
)
 
(13,818
)
Non-U.S. credit card
(357
)
 
(508
)
 
(835
)
 
(1,691
)
 
(2,424
)
Direct/Indirect consumer
(456
)
 
(710
)
 
(1,258
)
 
(2,190
)
 
(4,303
)
Other consumer
(268
)
 
(273
)
 
(274
)
 
(252
)
 
(320
)
Total consumer charge-offs
(6,368
)
 
(9,261
)
 
(15,576
)
 
(21,538
)
 
(31,780
)
U.S. commercial (2)
(584
)
 
(774
)
 
(1,309
)
 
(1,690
)
 
(3,190
)
Commercial real estate
(29
)
 
(251
)
 
(719
)
 
(1,298
)
 
(2,185
)
Commercial lease financing
(10
)
 
(4
)
 
(32
)
 
(61
)
 
(96
)
Non-U.S. commercial
(35
)
 
(79
)
 
(36
)
 
(155
)
 
(139
)
Total commercial charge-offs
(658
)
 
(1,108
)
 
(2,096
)
 
(3,204
)
 
(5,610
)
Total loans and leases charged off
(7,026
)
 
(10,369
)
 
(17,672
)
 
(24,742
)
 
(37,390
)
Recoveries of loans and leases previously charged off


Residential mortgage
969

 
424

 
165

 
377

 
117

Home equity
457

 
455

 
331

 
517

 
279

U.S. credit card
430

 
628

 
728

 
838

 
791

Non-U.S. credit card
115

 
109

 
254

 
522

 
217

Direct/Indirect consumer
287

 
365

 
495

 
714

 
967

Other consumer
39

 
39

 
42

 
50

 
59

Total consumer recoveries
2,297

 
2,020

 
2,015

 
3,018

 
2,430

U.S. commercial (3)
214

 
287

 
368

 
500

 
391

Commercial real estate
112

 
102

 
335

 
351

 
168

Commercial lease financing
19

 
29

 
38

 
37

 
39

Non-U.S. commercial
1

 
34

 
8

 
3

 
28

Total commercial recoveries
346

 
452

 
749

 
891

 
626

Total recoveries of loans and leases previously charged off
2,643

 
2,472

 
2,764

 
3,909

 
3,056

Net charge-offs
(4,383
)
 
(7,897
)
 
(14,908
)
 
(20,833
)
 
(34,334
)
Write-offs of PCI loans
(810
)
 
(2,336
)
 
(2,820
)


Provision for loan and lease losses
2,231

 
3,574

 
8,310

 
13,629

 
28,195

Other (4)
(47
)
 
(92
)
 
(186
)
 
(898
)
 
36

Allowance for loan and lease losses, December 31
14,419

 
17,428

 
24,179

 
33,783

 
41,885

Reserve for unfunded lending commitments, January 1
484

 
513

 
714

 
1,188

 
1,487

Provision for unfunded lending commitments
44

 
(18
)
 
(141
)
 
(219
)
 
240

Other (5)

 
(11
)
 
(60
)
 
(255
)
 
(539
)
Reserve for unfunded lending commitments, December 31
528

 
484

 
513

 
714

 
1,188

Allowance for credit losses, December 31
$
14,947

 
$
17,912

 
$
24,692

 
$
34,497

 
$
43,073

(1) 
The 2010 balance includes $10.8 billion of allowance for loan and lease losses related to the adoption of consolidation guidance that was effective January 1, 2010.
(2) 
Includes U.S. small business commercial charge-offs of $345 million, $457 million, $799 million, $1.1 billion and $2.0 billion in 2014, 2013, 2012, 2011 and 2010, respectively.
(3) 
Includes U.S. small business commercial recoveries of $63 million, $98 million, $100 million, $106 million and $107 million in 2014, 2013, 2012, 2011 and 2010, respectively.
(4) 
The 2014, 2013, 2012 and 2011 amounts primarily represent the net impact of portfolio sales, consolidations and deconsolidations, and foreign currency translation adjustments. In addition, the 2011 amount includes a $449 million reduction in the allowance for loan and lease losses related to Canadian consumer card loans that were transferred to LHFS.
(5) 
Primarily represents accretion of the Merrill Lynch purchase accounting adjustment and the impact of funding previously unfunded positions.


104     Bank of America 2014


Table VII  Allowance for Credit Losses (continued)


(Dollars in millions)
2014
 
2013
 
2012
 
2011
 
2010
Loan and allowance ratios:


Loans and leases outstanding at December 31 (6)
$
872,710

 
$
918,191

 
$
898,817

 
$
917,396

 
$
937,119

Allowance for loan and lease losses as a percentage of total loans and leases outstanding at December 31 (6)
1.65
%
 
1.90
%
 
2.69
%
 
3.68
%
 
4.47
%
Consumer allowance for loan and lease losses as a percentage of total consumer loans and leases outstanding at December 31 (7)
2.05

 
2.53

 
3.81

 
4.88

 
5.40

Commercial allowance for loan and lease losses as a percentage of total commercial loans and leases outstanding at December 31 (8)
1.15

 
1.03

 
0.90

 
1.33

 
2.44

Average loans and leases outstanding (6)
$
894,001

 
$
909,127

 
$
890,337

 
$
929,661

 
$
954,278

Net charge-offs as a percentage of average loans and leases outstanding (6, 9)
0.49
%
 
0.87
%
 
1.67
%
 
2.24
%
 
3.60
%
Net charge-offs and PCI write-offs as a percentage of average loans and leases outstanding (6, 10)
0.58

 
1.13

 
1.99

 
2.24

 
3.60

Allowance for loan and lease losses as a percentage of total nonperforming loans and leases at December 31 (6, 11)
121

 
102

 
107

 
135

 
136

Ratio of the allowance for loan and lease losses at December 31 to net charge-offs (9)
3.29

 
2.21

 
1.62

 
1.62

 
1.22

Ratio of the allowance for loan and lease losses at December 31 to net charge-offs and PCI write-offs (10)
2.78

 
1.70

 
1.36

 
1.62

 
1.22

Amounts included in allowance for loan and lease losses for loans and leases that are excluded from nonperforming loans and leases at December 31 (12)
$
5,944

 
$
7,680

 
$
12,021

 
$
17,490

 
$
22,908

Allowance for loan and lease losses as a percentage of total nonperforming loans and leases, excluding the allowance for loan and lease losses for loans and leases that are excluded from nonperforming loans and leases at December 31 (6, 12)
71
%
 
57
%
 
54
%
 
65
%
 
62
%
Loan and allowance ratios excluding PCI loans and the related valuation allowance: (13)


Allowance for loan and lease losses as a percentage of total loans and leases outstanding at December 31 (6)
1.50
%
 
1.67
%
 
2.14
%
 
2.86
%
 
3.94
%
Consumer allowance for loan and lease losses as a percentage of total consumer loans and leases outstanding at December 31 (7)
1.79

 
2.17

 
2.95

 
3.68

 
4.66

Net charge-offs as a percentage of average loans and leases outstanding (6)
0.50

 
0.90

 
1.73

 
2.32

 
3.73

Allowance for loan and lease losses as a percentage of total nonperforming loans and leases at December 31 (6, 11)
107

 
87

 
82

 
101

 
116

Ratio of the allowance for loan and lease losses at December 31 to net charge-offs
2.91

 
1.89

 
1.25

 
1.22

 
1.04

(6) 
Outstanding loan and lease balances and ratios do not include loans accounted for under the fair value option of $8.7 billion, $10.0 billion, $9.0 billion, $8.8 billion and $3.3 billion at December 31, 2014, 2013, 2012, 2011 and 2010, respectively. Average loans accounted for under the fair value option were $9.9 billion, $9.5 billion, $8.4 billion, $8.4 billion and $4.1 billion in 2014, 2013, 2012, 2011 and 2010, respectively.
(7) 
Excludes consumer loans accounted for under the fair value option of $2.1 billion, $2.2 billion, $1.0 billion and $2.2 billion at December 31, 2014, 2013, 2012 and 2011. There were no consumer loans accounted for under the fair value option prior to 2011.
(8) 
Excludes commercial loans accounted for under the fair value option of $6.6 billion, $7.9 billion, $8.0 billion, $6.6 billion and $3.3 billion at December 31, 2014, 2013, 2012, 2011 and 2010, respectively.
(9) 
Net charge-offs exclude $810 million, $2.3 billion and $2.8 billion of write-offs in the PCI loan portfolio in 2014, 2013 and 2012. These write-offs decreased the PCI valuation allowance included as part of the allowance for loan and lease losses. For more information on PCI write-offs, see Consumer Portfolio Credit Risk Management – Purchased Credit-impaired Loan Portfolio on page 58.
(10) 
There were no write-offs of PCI loans in 2011 and 2010.
(11) 
For more information on our definition of nonperforming loans, see pages 62 and 69.
(12) 
Primarily includes amounts allocated to U.S. credit card and unsecured lending portfolios in Consumer Banking, PCI loans and the non-U.S. credit portfolio in All Other.
(13) 
For more information on the PCI loan portfolio and the valuation allowance for PCI loans, see Note 4 – Outstanding Loans and Leases and Note 5 – Allowance for Credit Losses to the Consolidated Financial Statements.


Bank of America 2014     105


Table VIII  Allocation of the Allowance for Credit Losses by Product Type


December 31
 
2014
 
2013
 
2012
 
2011
 
2010
(Dollars in millions)
Amount
 
Percent
of Total
 
Amount
 
Percent
of Total
 
Amount
 
Percent
of Total
 
Amount
 
Percent
of Total
 
Amount
 
Percent
of Total
Allowance for loan and lease losses


Residential mortgage
$
2,900

 
20.11
%
 
$
4,084

 
23.43
%
 
$
7,088

 
29.31
%
 
$
7,985

 
23.64
%
 
$
6,365

 
15.20
%
Home equity
3,035

 
21.05

 
4,434

 
25.44

 
7,845

 
32.45

 
13,094

 
38.76

 
12,887

 
30.77

U.S. credit card
3,320

 
23.03

 
3,930

 
22.55

 
4,718

 
19.51

 
6,322

 
18.71

 
10,876

 
25.97

Non-U.S. credit card
369

 
2.56

 
459

 
2.63

 
600

 
2.48

 
946

 
2.80

 
2,045

 
4.88

Direct/Indirect consumer
299

 
2.07

 
417

 
2.39

 
718

 
2.97

 
1,153

 
3.41

 
2,381

 
5.68

Other consumer
59

 
0.41

 
99

 
0.58

 
104

 
0.43

 
148

 
0.44

 
161

 
0.38

Total consumer
9,982

 
69.23

 
13,423

 
77.02

 
21,073

 
87.15

 
29,648

 
87.76

 
34,715

 
82.88

U.S. commercial (1)
2,619

 
18.16

 
2,394

 
13.74

 
1,885

 
7.80

 
2,441

 
7.23

 
3,576

 
8.54

Commercial real estate
1,016

 
7.05

 
917

 
5.26

 
846

 
3.50

 
1,349

 
3.99

 
3,137

 
7.49

Commercial lease financing
153

 
1.06

 
118

 
0.68

 
78

 
0.32

 
92

 
0.27

 
126

 
0.30

Non-U.S. commercial
649

 
4.50

 
576

 
3.30

 
297

 
1.23

 
253

 
0.75

 
331

 
0.79

Total commercial (2)
4,437

 
30.77

 
4,005

 
22.98

 
3,106

 
12.85

 
4,135

 
12.24

 
7,170

 
17.12

Allowance for loan and lease losses (3)
14,419

 
100.00
%
 
17,428

 
100.00
%
 
24,179

 
100.00
%
 
33,783

 
100.00
%
 
41,885

 
100.00
%
Reserve for unfunded lending commitments
528


484


513


714


1,188


Allowance for credit losses
$
14,947


$
17,912


$
24,692


$
34,497


$
43,073


(1) 
Includes allowance for loan and lease losses for U.S. small business commercial loans of $536 million, $462 million, $642 million, $893 million and $1.5 billion at December 31, 2014, 2013, 2012, 2011 and 2010, respectively.
(2) 
Includes allowance for loan and lease losses for impaired commercial loans of $159 million, $277 million, $475 million, $545 million and $1.1 billion at December 31, 2014, 2013, 2012, 2011 and 2010, respectively.
(3) 
Includes $1.7 billion, $2.5 billion, $5.5 billion, $8.5 billion and $6.4 billion of valuation allowance presented with the allowance for loan and lease losses related to PCI loans at December 31, 2014, 2013, 2012, 2011 and 2010, respectively.


106     Bank of America 2014


Table IX  Selected Loan Maturity Data (1, 2)


December 31, 2014
(Dollars in millions)
Due in One
Year or Less
 
Due After
One Year
Through
Five Years
 
Due After
Five Years
 
Total
U.S. commercial
$
66,039

 
$
126,522

 
$
42,916

 
$
235,477

U.S. commercial real estate
8,714

 
31,825

 
4,648

 
45,187

Non-U.S. and other (3)
61,524

 
21,015

 
4,752

 
87,291

Total selected loans
$
136,277

 
$
179,362

 
$
52,316

 
$
367,955

Percent of total
37
%
 
49
%
 
14
%
 
100
%
Sensitivity of selected loans to changes in interest rates for loans due after one year:


Fixed interest rates


$
14,070

 
$
27,379


Floating or adjustable interest rates


165,292

 
24,937


Total


$
179,362

 
$
52,316


(1) 
Loan maturities are based on the remaining maturities under contractual terms.
(2) 
Includes loans accounted for under the fair value option.
(3) 
Loan maturities include non-U.S. commercial and commercial real estate loans.


Table X  Non-exchange Traded Commodity Contracts


2014
(Dollars in millions)
Asset
Positions
 
Liability
Positions
Net fair value of contracts outstanding, January 1, 2014
$
4,376

 
$
4,240

Effect of legally enforceable master netting agreements
4,625

 
4,625

Gross fair value of contracts outstanding, January 1, 2014
9,001

 
8,865

Contracts realized or otherwise settled
(4,738
)
 
(4,581
)
Fair value of new contracts
8,281

 
7,833

Other changes in fair value
1,014

 
1,982

Gross fair value of contracts outstanding, December 31, 2014
13,558

 
14,099

Less: Legally enforceable master netting agreements
(5,506
)
 
(5,506
)
Net fair value of contracts outstanding, December 31, 2014
$
8,052

 
$
8,593


Table XI  Non-exchange Traded Commodity Contract Maturities


2014
(Dollars in millions)
Asset
Positions
 
Liability
Positions
Less than one year
$
8,262

 
$
9,114

Greater than or equal to one year and less than three years
2,598

 
2,798

Greater than or equal to three years and less than five years
599

 
533

Greater than or equal to five years
2,099

 
1,654

Gross fair value of contracts outstanding
13,558

 
14,099

Less: Legally enforceable master netting agreements
(5,506
)
 
(5,506
)
Net fair value of contracts outstanding
$
8,052

 
$
8,593


Bank of America 2014     107


Table XII  Selected Quarterly Financial Data


2014 Quarters
 
2013 Quarters
(In millions, except per share information)
Fourth
 
Third
 
Second
 
First
 
Fourth
 
Third
 
Second
 
First
Income statement


Net interest income
$
9,635

 
$
10,219

 
$
10,013

 
$
10,085

 
$
10,786

 
$
10,266

 
$
10,549

 
$
10,664

Noninterest income
9,090

 
10,990

 
11,734

 
12,481

 
10,702

 
11,264

 
12,178

 
12,533

Total revenue, net of interest expense
18,725

 
21,209

 
21,747

 
22,566

 
21,488

 
21,530

 
22,727

 
23,197

Provision for credit losses
219

 
636

 
411

 
1,009

 
336

 
296

 
1,211

 
1,713

Noninterest expense
14,196

 
20,142

 
18,541

 
22,238

 
17,307

 
16,389

 
16,018

 
19,500

Income (loss) before income taxes
4,310

 
431

 
2,795

 
(681
)
 
3,845

 
4,845

 
5,498

 
1,984

Income tax expense (benefit)
1,260

 
663

 
504

 
(405
)
 
406

 
2,348

 
1,486

 
501

Net income (loss)
3,050

 
(232
)
 
2,291

 
(276
)
 
3,439

 
2,497

 
4,012

 
1,483

Net income (loss) applicable to common shareholders
2,738

 
(470
)
 
2,035

 
(514
)
 
3,183

 
2,218

 
3,571

 
1,110

Average common shares issued and outstanding
10,516

 
10,516

 
10,519

 
10,561

 
10,633

 
10,719

 
10,776

 
10,799

Average diluted common shares issued and outstanding (1)
11,274

 
10,516

 
11,265

 
10,561

 
11,404

 
11,482

 
11,525

 
11,155

Performance ratios


Return on average assets
0.57
%
 
n/m

 
0.42
%
 
n/m

 
0.64
%
 
0.47
%
 
0.74
%
 
0.27
%
Four quarter trailing return on average assets (2)
0.23

 
0.24
%
 
0.37

 
0.45
%
 
0.53

 
0.40

 
0.30

 
0.23

Return on average common shareholders’ equity
4.84

 
n/m

 
3.68

 
n/m

 
5.74

 
4.06

 
6.55

 
2.06

Return on average tangible common shareholders’ equity (3)
7.15

 
n/m

 
5.47

 
n/m

 
8.61

 
6.15

 
9.88

 
3.12

Return on average tangible shareholders’ equity (3)
7.08

 
n/m

 
5.64

 
n/m

 
8.53

 
6.32

 
9.98

 
3.69

Total ending equity to total ending assets
11.57

 
11.24

 
10.94

 
10.79

 
11.07

 
10.92

 
10.88

 
10.91

Total average equity to total average assets
11.39

 
11.14

 
10.87

 
11.06

 
10.93

 
10.85

 
10.76

 
10.71

Dividend payout
19.21

 
n/m

 
5.16

 
n/m

 
3.33

 
4.82

 
3.01

 
9.75

Per common share data


Earnings (loss)
$
0.26

 
$
(0.04
)
 
$
0.19

 
$
(0.05
)
 
$
0.30

 
$
0.21

 
$
0.33

 
$
0.10

Diluted earnings (loss) (1)
0.25

 
(0.04
)
 
0.19

 
(0.05
)
 
0.29

 
0.20

 
0.32

 
0.10

Dividends paid
0.05

 
0.05

 
0.01

 
0.01

 
0.01

 
0.01

 
0.01

 
0.01

Book value
21.32

 
20.99

 
21.16

 
20.75

 
20.71

 
20.50

 
20.18

 
20.19

Tangible book value (3)
14.43

 
14.09

 
14.24

 
13.81

 
13.79

 
13.62

 
13.32

 
13.36

Market price per share of common stock


Closing
$
17.89

 
$
17.05

 
$
15.37

 
$
17.20

 
$
15.57

 
$
13.80

 
$
12.86

 
$
12.18

High closing
18.13

 
17.18

 
17.34

 
17.92

 
15.88

 
14.95

 
13.83

 
12.78

Low closing
15.76

 
14.98

 
14.51

 
16.10

 
13.69

 
12.83

 
11.44

 
11.03

Market capitalization
$
188,141

 
$
179,296

 
$
161,628

 
$
181,117

 
$
164,914

 
$
147,429

 
$
138,156

 
$
131,817

(1) 
The diluted earnings (loss) per common share excluded the effect of any equity instruments that are antidilutive to earnings per share. There were no potential common shares that were dilutive in the third and first quarters of 2014 because of the net loss applicable to common shareholders.
(2) 
Calculated as total net income (loss) for four consecutive quarters divided by annualized average assets for four consecutive quarters.
(3) 
Tangible equity ratios and tangible book value per share of common stock are non-GAAP financial measures. Other companies may define or calculate these measures differently. For more information on these ratios, see Supplemental Financial Data on page 12, and for corresponding reconciliations to GAAP financial measures, see Statistical Table XVII.
(4) 
For more information on the impact of the purchased credit-impaired loan portfolio on asset quality, see Consumer Portfolio Credit Risk Management on page 50.
(5) 
Includes the allowance for loan and lease losses and the reserve for unfunded lending commitments.
(6) 
Balances and ratios do not include loans accounted for under the fair value option. For additional exclusions from nonperforming loans, leases and foreclosed properties, see Consumer Portfolio Credit Risk Management – Nonperforming Consumer Loans, Leases and Foreclosed Properties Activity on page 62 and corresponding Table 39, and Commercial Portfolio Credit Risk Management – Nonperforming Commercial Loans, Leases and Foreclosed Properties Activity on page 69 and corresponding Table 48.
(7) 
Primarily includes amounts allocated to the U.S. credit card and unsecured consumer lending portfolios in Consumer Banking, purchased credit-impaired loans and the non-U.S. credit card portfolio in All Other.
(8) 
Net charge-offs exclude $13 million, $246 million, $160 million and $391 million of write-offs in the purchased credit-impaired loan portfolio in the fourth, third, second and first quarters of 2014, respectively, and $741 million, $443 million, $313 million and $839 million in the fourth, third, second and first quarters of 2013, respectively. These write-offs decreased the purchased credit-impaired valuation allowance included as part of the allowance for loan and lease losses. For more information on purchased credit-impaired write-offs, see Consumer Portfolio Credit Risk Management – Purchased Credit-impaired Loan Portfolio on page 58.
(9) 
On January 1, 2014, the Basel 3 rules became effective, subject to transition provisions primarily related to regulatory deductions and adjustments impacting Common equity tier 1 capital and Tier 1 capital. We reported under Basel 1 (which included the Market Risk Final Rules) for 2013.
n/a = not applicable
n/m = not meaningful


108     Bank of America 2014


Table XII  Selected Quarterly Financial Data (continued)


2014 Quarters
 
2013 Quarters
(Dollars in millions)
Fourth
 
Third
 
Second
 
First
 
Fourth
 
Third
 
Second
 
First
Average balance sheet


Total loans and leases
$
884,733

 
$
899,241

 
$
912,580

 
$
919,482

 
$
929,777

 
$
923,978

 
$
914,234

 
$
906,259

Total assets
2,137,551

 
2,136,109

 
2,169,555

 
2,139,266

 
2,134,875

 
2,123,430

 
2,184,610

 
2,212,430

Total deposits
1,122,514

 
1,127,488

 
1,128,563

 
1,118,178

 
1,112,674

 
1,090,611

 
1,079,956

 
1,075,280

Long-term debt
249,221

 
251,772

 
259,825

 
253,678

 
251,055

 
258,717

 
270,198

 
273,999

Common shareholders’ equity
224,473

 
222,368

 
222,215

 
223,201

 
220,088

 
216,766

 
218,790

 
218,225

Total shareholders’ equity
243,448

 
238,034

 
235,797

 
236,553

 
233,415

 
230,392

 
235,063

 
236,995

Asset quality (4)


Allowance for credit losses (5)
$
14,947

 
$
15,635

 
$
16,314

 
$
17,127

 
$
17,912

 
$
19,912

 
$
21,709

 
$
22,927

Nonperforming loans, leases and foreclosed properties (6)
12,629

 
14,232

 
15,300

 
17,732

 
17,772

 
20,028

 
21,280

 
22,842

Allowance for loan and lease losses as a percentage of total loans and leases outstanding (6)
1.65
%
 
1.71
%
 
1.75
%
 
1.84
%
 
1.90
%
 
2.10
%
 
2.33
%
 
2.49
%
Allowance for loan and lease losses as a percentage of total nonperforming loans and leases (6)
121

 
112

 
108

 
97

 
102

 
100

 
103

 
102

Allowance for loan and lease losses as a percentage of total nonperforming loans and leases, excluding the PCI loan portfolio (6)
107

 
100

 
95

 
85

 
87

 
84

 
84

 
82

Amounts included in allowance for loan and lease losses for loans and leases that are excluded from nonperforming loans and leases (7)
$
5,944

 
$
6,013

 
$
6,488

 
$
7,143

 
$
7,680

 
$
8,972

 
$
9,919

 
$
10,690

Allowance for loan and lease losses as a percentage of total nonperforming loans and leases, excluding the allowance for loan and lease losses for loans and leases that are excluded from nonperforming loans and leases (6, 7)
71
%
 
67
%
 
64
%
 
55
%
 
57
%
 
54
%
 
55
%
 
53
%
Net charge-offs (8)
$
879

 
$
1,043

 
$
1,073

 
$
1,388

 
$
1,582

 
$
1,687

 
$
2,111

 
$
2,517

Annualized net charge-offs as a percentage of average loans and leases outstanding (6, 8)
0.40
%
 
0.46
%
 
0.48
%
 
0.62
%
 
0.68
%
 
0.73
%
 
0.94
%
 
1.14
%
Annualized net charge-offs as a percentage of average loans and leases outstanding, excluding the PCI loan portfolio (6)
0.41

 
0.48

 
0.49

 
0.64

 
0.70

 
0.75

 
0.97

 
1.18

Annualized net charge-offs and PCI write-offs as a percentage of average loans and leases outstanding (6)
0.40

 
0.57

 
0.55

 
0.79

 
1.00

 
0.92

 
1.07

 
1.52

Nonperforming loans and leases as a percentage of total loans and leases outstanding (6)
1.37

 
1.53

 
1.63

 
1.89

 
1.87

 
2.10

 
2.26

 
2.44

Nonperforming loans, leases and foreclosed properties as a percentage of total loans, leases and foreclosed properties (6)
1.45

 
1.61

 
1.70

 
1.96

 
1.93

 
2.17

 
2.33

 
2.53

Ratio of the allowance for loan and lease losses at period end to annualized net charge-offs (8)
4.14

 
3.65

 
3.67

 
2.95

 
2.78

 
2.90

 
2.51

 
2.20

Ratio of the allowance for loan and lease losses at period end to annualized net charge-offs, excluding the PCI loan portfolio
3.66

 
3.27

 
3.25

 
2.58

 
2.38

 
2.42

 
2.04

 
1.76

Ratio of the allowance for loan and lease losses at period end to annualized net charge-offs and PCI write-offs
4.08

 
2.95

 
3.20

 
2.30

 
1.89

 
2.30

 
2.18

 
1.65

Capital ratios at period end (9)


Risk-based capital:


Common equity tier 1 capital
12.3
%
 
12.0
%
 
12.0
%
 
11.8
%
 
n/a

 
n/a

 
n/a

 
n/a

Tier 1 common capital
n/a

 
n/a

 
n/a

 
n/a

 
10.9
%
 
10.8
%
 
10.6
%
 
10.3
%
Tier 1 capital
13.4

 
12.8

 
12.5

 
11.9

 
12.2

 
12.1

 
11.9

 
12.0

Total capital
16.5

 
15.8

 
15.3

 
14.8

 
15.1

 
15.1

 
15.1

 
15.3

Tier 1 leverage
8.2

 
7.9

 
7.7

 
7.4

 
7.7

 
7.6

 
7.4

 
7.4

Tangible equity (3)
8.4

 
8.1

 
7.9

 
7.7

 
7.9

 
7.7

 
7.7

 
7.8

Tangible common equity (3)
7.5

 
7.2

 
7.1

 
7.0

 
7.2

 
7.1

 
7.0

 
6.9

For footnotes see page 108.


Bank of America 2014     109


Table XIII  Quarterly Average Balances and Interest Rates – FTE Basis


Fourth Quarter 2014
 
Third Quarter 2014
(Dollars in millions)
Average
Balance
 
Interest
Income/
Expense
 
Yield/
Rate
 
Average
Balance
 
Interest
Income/
Expense
 
Yield/
Rate
Earning assets


Interest-bearing deposits with the Federal Reserve and non-U.S. central banks (1)
$
109,042

 
$
74

 
0.27
%
 
$
110,876

 
$
77

 
0.28
%
Time deposits placed and other short-term investments
9,339

 
41

 
1.73

 
10,457

 
41

 
1.54

Federal funds sold and securities borrowed or purchased under agreements to resell
217,982

 
238

 
0.43

 
223,978

 
239

 
0.42

Trading account assets
144,147

 
1,141

 
3.15

 
143,282

 
1,148

 
3.18

Debt securities (2)
371,014

 
1,687

 
1.82

 
359,653

 
2,236

 
2.48

Loans and leases (3):


Residential mortgage (4)
223,132

 
1,946

 
3.49

 
235,271

 
2,083

 
3.54

Home equity
86,825

 
809

 
3.70

 
88,590

 
836

 
3.76

U.S. credit card
89,381

 
2,086

 
9.26

 
88,866

 
2,093

 
9.34

Non-U.S. credit card
10,950

 
280

 
10.14

 
11,784

 
304

 
10.25

Direct/Indirect consumer (5)
83,121

 
522

 
2.49

 
82,669

 
523

 
2.51

Other consumer (6)
2,031

 
85

 
16.75

 
2,111

 
19

 
3.44

Total consumer
495,440

 
5,728

 
4.60

 
509,291

 
5,858

 
4.58

U.S. commercial
231,217

 
1,648

 
2.83

 
230,891

 
1,658

 
2.85

Commercial real estate (7)
46,993

 
342

 
2.89

 
46,071

 
344

 
2.96

Commercial lease financing
24,238

 
198

 
3.28

 
24,325

 
212

 
3.48

Non-U.S. commercial
86,845

 
546

 
2.49

 
88,663

 
560

 
2.51

Total commercial
389,293

 
2,734

 
2.79

 
389,950

 
2,774

 
2.83

Total loans and leases
884,733

 
8,462

 
3.80

 
899,241

 
8,632

 
3.82

Other earning assets
65,864

 
739

 
4.46

 
65,995

 
710

 
4.27

Total earning assets (8)
1,802,121

 
12,382

 
2.74

 
1,813,482

 
13,083

 
2.87

Cash and due from banks (1)
27,590


25,120


Other assets, less allowance for loan and lease losses
307,840


297,507


Total assets
$
2,137,551


$
2,136,109


Interest-bearing liabilities


U.S. interest-bearing deposits:


Savings
$
45,621

 
$
1

 
0.01
%
 
$
46,803

 
$
1

 
0.01
%
NOW and money market deposit accounts
515,995

 
76

 
0.06

 
517,043

 
78

 
0.06

Consumer CDs and IRAs
61,880

 
51

 
0.33

 
65,579

 
59

 
0.35

Negotiable CDs, public funds and other deposits
30,951

 
23

 
0.29

 
31,806

 
27

 
0.34

Total U.S. interest-bearing deposits
654,447

 
151

 
0.09

 
661,231

 
165

 
0.10

Non-U.S. interest-bearing deposits:


Banks located in non-U.S. countries
5,413

 
12

 
0.88

 
8,022

 
22

 
1.10

Governments and official institutions
1,647

 
1

 
0.15

 
1,706

 
1

 
0.15

Time, savings and other
57,030

 
73

 
0.51

 
61,331

 
82

 
0.54

Total non-U.S. interest-bearing deposits
64,090

 
86

 
0.53

 
71,059

 
105

 
0.59

Total interest-bearing deposits
718,537

 
237

 
0.13

 
732,290

 
270

 
0.15

Federal funds purchased, securities loaned or sold under agreements to repurchase and short-term borrowings
251,432

 
615

 
0.97

 
255,111

 
591

 
0.92

Trading account liabilities
78,173

 
351

 
1.78

 
84,988

 
392

 
1.83

Long-term debt
249,221

 
1,314

 
2.10

 
251,772

 
1,386

 
2.19

Total interest-bearing liabilities (8)
1,297,363

 
2,517

 
0.77

 
1,324,161

 
2,639

 
0.79

Noninterest-bearing sources:


Noninterest-bearing deposits
403,977


395,198


Other liabilities
192,763


178,716


Shareholders’ equity
243,448


238,034


Total liabilities and shareholders’ equity
$
2,137,551


$
2,136,109


Net interest spread


1.97
%


2.08
%
Impact of noninterest-bearing sources


0.21


0.21

Net interest income/yield on earning assets
 
 
$
9,865

 
2.18
%


$
10,444

 
2.29
%
(1) 
Beginning in 2014, interest-bearing deposits placed with the Federal Reserve and certain non-U.S. central banks are included in earning assets. In prior periods, these balances were included with cash and due from banks in the cash and cash equivalents line, consistent with the Consolidated Balance Sheet presentation. Prior periods have been reclassified to conform to current period presentation.
(2) 
Beginning in 2014, yields on debt securities carried at fair value are calculated on the cost basis. Prior to 2014, yields on debt securities carried at fair value were calculated based on fair value rather than the cost basis. The use of fair value did not have a material impact on net interest yield.
(3) 
Nonperforming loans are included in the respective average loan balances. Income on these nonperforming loans is generally recognized on a cost recovery basis. Purchased credit-impaired loans were recorded at fair value upon acquisition and accrete interest income over the remaining life of the loan.
(4) 
Includes non-U.S. residential mortgage loans of $3 million, $3 million, $2 million and $0 million in the fourth, third, second and first quarters of 2014, and $56 million in the fourth quarter of 2013, respectively.
(5) 
Includes non-U.S. consumer loans of $4.2 billion, $4.3 billion, $4.4 billion and $4.6 billion in the fourth, third, second and first quarters of 2014, and $5.1 billion in the fourth quarter of 2013, respectively.
(6) 
Includes consumer finance loans of $907 million, $1.1 billion, $1.1 billion and $1.2 billion in the fourth, third, second and first quarters of 2014, and $1.2 billion in the fourth quarter of 2013, respectively; consumer leases of $965 million, $887 million, $762 million and $656 million in the fourth, third, second and first quarters of 2014, and $549 million in the fourth quarter of 2013, respectively; consumer overdrafts of $156 million, $161 million, $137 million and $140 million in the fourth, third, second and first quarters of 2014, and $163 million in the fourth quarter of 2013, respectively; and other non-U.S. consumer loans of $3 million for each of the quarters of 2014, and $2 million in the fourth quarter of 2013.
(7) 
Includes U.S. commercial real estate loans of $45.1 billion, $45.0 billion, $46.7 billion and $47.0 billion in the fourth, third, second and first quarters of 2014, and $44.5 billion in the fourth quarter of 2013, respectively; and non-U.S. commercial real estate loans of $1.9 billion, $1.0 billion, $1.6 billion and $1.8 billion in the fourth, third, second and first quarters of 2014, and $1.8 billion in the fourth quarter of 2013, respectively.
(8) 
Interest income includes the impact of interest rate risk management contracts, which decreased interest income on the underlying assets by $10 million, $30 million, $13 million and $5 million in the fourth, third, second and first quarters of 2014, and $0 million in the fourth quarter of 2013, respectively. Interest expense includes the impact of interest rate risk management contracts, which decreased interest expense on the underlying liabilities by $659 million, $602 million, $621 million and $592 million in the fourth, third, second and first quarters of 2014, and $588 million in the fourth quarter of 2013, respectively. For more information on interest rate contracts, see Interest Rate Risk Management for Non-trading Activities on page 85.

110     Bank of America 2014


Table XIII  Quarterly Average Balances and Interest Rates – FTE Basis (continued)


Second Quarter 2014
 
First Quarter 2014
 
Fourth Quarter 2013
(Dollars in millions)
Average
Balance
 
Interest
Income/
Expense
 
Yield/
Rate
 
Average
Balance
 
Interest
Income/
Expense
 
Yield/
Rate
 
Average
Balance
 
Interest
Income/
Expense
 
Yield/
Rate
Earning assets


Interest-bearing deposits with the Federal Reserve and non-U.S. central banks (1)
$
123,582

 
$
85

 
0.28
%
 
$
112,570

 
$
72

 
0.26
%
 
$
90,196

 
$
59

 
0.26
%
Time deposits placed and other short-term investments 
10,509

 
39

 
1.51

 
13,880

 
49

 
1.43

 
15,782

 
48

 
1.21

Federal funds sold and securities borrowed or purchased under agreements to resell
235,393

 
297

 
0.51

 
212,504

 
265

 
0.51

 
203,415

 
304

 
0.59

Trading account assets
147,798

 
1,214

 
3.29

 
147,583

 
1,213

 
3.32

 
156,194

 
1,182

 
3.01

Debt securities (2)
345,889

 
2,134

 
2.46

 
329,711

 
2,005

 
2.41

 
325,119

 
2,454

 
3.02

Loans and leases (3):


Residential mortgage (4)
243,405

 
2,195

 
3.61

 
247,561

 
2,238

 
3.62

 
253,988

 
2,373

 
3.74

Home equity
90,729

 
842

 
3.72

 
92,754

 
853

 
3.71

 
95,374

 
954

 
3.98

U.S. credit card
88,058

 
2,042

 
9.30

 
89,545

 
2,092

 
9.48

 
90,057

 
2,125

 
9.36

Non-U.S. credit card
11,759

 
308

 
10.51

 
11,554

 
308

 
10.79

 
11,171

 
310

 
11.01

Direct/Indirect consumer (5)
82,102

 
524

 
2.56

 
81,728

 
530

 
2.63

 
82,990

 
565

 
2.70

Other consumer (6)
2,012

 
17

 
3.60

 
1,962

 
18

 
3.66

 
1,929

 
17

 
3.73

Total consumer
518,065

 
5,928

 
4.58

 
525,104

 
6,039

 
4.64

 
535,509

 
6,344

 
4.72

U.S. commercial
230,486

 
1,673

 
2.91

 
228,058

 
1,651

 
2.93

 
225,596

 
1,700

 
2.99

Commercial real estate (7)
48,315

 
357

 
2.97

 
48,753

 
368

 
3.06

 
46,341

 
373

 
3.20

Commercial lease financing
24,409

 
193

 
3.16

 
24,727

 
234

 
3.78

 
24,468

 
206

 
3.37

Non-U.S. commercial
91,305

 
569

 
2.50

 
92,840

 
543

 
2.37

 
97,863

 
544

 
2.21

Total commercial
394,515

 
2,792

 
2.84

 
394,378

 
2,796

 
2.87

 
394,268

 
2,823

 
2.84

Total loans and leases
912,580

 
8,720

 
3.83

 
919,482

 
8,835

 
3.88

 
929,777

 
9,167

 
3.92

Other earning assets
65,099

 
665

 
4.09

 
67,568

 
697

 
4.18

 
78,214

 
711

 
3.61

Total earning assets (8)
1,840,850

 
13,154

 
2.86

 
1,803,298

 
13,136

 
2.93

 
1,798,697

 
13,925

 
3.08

Cash and cash equivalents (1)
27,377


28,258


35,063


Other assets, less allowance for loan and lease losses
301,328


307,710


301,115


Total assets
$
2,169,555


$
2,139,266


$
2,134,875


Interest-bearing liabilities


U.S. interest-bearing deposits:


Savings
$
47,450

 
$

 
%
 
$
45,196

 
$
1

 
0.01
%
 
$
43,665

 
$
5

 
0.05
%
NOW and money market deposit accounts
519,399

 
79

 
0.06

 
523,237

 
83

 
0.06

 
514,220

 
89

 
0.07

Consumer CDs and IRAs
68,706

 
70

 
0.41

 
71,141

 
84

 
0.48

 
74,635

 
96

 
0.51

Negotiable CDs, public funds and other deposits
33,412

 
29

 
0.35

 
29,826

 
27

 
0.37

 
29,060

 
29

 
0.39

Total U.S. interest-bearing deposits
668,967

 
178

 
0.11

 
669,400

 
195

 
0.12

 
661,580

 
219

 
0.13

Non-U.S. interest-bearing deposits:


Banks located in non-U.S. countries
10,538

 
19

 
0.72

 
11,071

 
21

 
0.75

 
13,902

 
22

 
0.62

Governments and official institutions
1,754


0.14

 
1,857

 
1

 
0.14

 
1,734

 
1

 
0.18

Time, savings and other
64,091

 
85

 
0.53

 
60,506

 
74

 
0.50

 
58,529

 
72

 
0.49

Total non-U.S. interest-bearing deposits
76,383

 
104

 
0.55

 
73,434

 
96

 
0.53

 
74,165

 
95

 
0.51

Total interest-bearing deposits
745,350

 
282

 
0.15

 
742,834

 
291

 
0.16

 
735,745

 
314

 
0.17

Federal funds purchased, securities loaned or sold under agreements to repurchase and short-term borrowings
271,247

 
763

 
1.13

 
252,971

 
609

 
0.98

 
271,538

 
682

 
1.00

Trading account liabilities
95,153

 
398

 
1.68

 
90,448

 
435

 
1.95

 
82,393

 
364

 
1.75

Long-term debt
259,825

 
1,485

 
2.29

 
253,678

 
1,515

 
2.41

 
251,055

 
1,566

 
2.48

Total interest-bearing liabilities (8)
1,371,575

 
2,928

 
0.86

 
1,339,931

 
2,850

 
0.86

 
1,340,731

 
2,926

 
0.87

Noninterest-bearing sources:


Noninterest-bearing deposits
383,213


375,344


376,929


Other liabilities
178,970


187,438


183,800


Shareholders’ equity
235,797


236,553


233,415


Total liabilities and shareholders’ equity
$
2,169,555


$
2,139,266


$
2,134,875


Net interest spread


2.00
%


2.07
%


2.21
%
Impact of noninterest-bearing sources


0.22


0.22


0.23

Net interest income/yield on earning assets 


$
10,226

 
2.22
%


$
10,286

 
2.29
%


$
10,999

 
2.44
%
For footnotes see page 110.


Bank of America 2014     111


Table XIV  Quarterly Supplemental Financial Data


2014 Quarters
 
2013 Quarters
(Dollars in millions, except per share information)
Fourth
 
Third
 
Second
 
First
 
Fourth
 
Third
 
Second
 
First
Fully taxable-equivalent basis data (1)


Net interest income (2)
$
9,865

 
$
10,444

 
$
10,226

 
$
10,286

 
$
10,999

 
$
10,479

 
$
10,771

 
$
10,875

Total revenue, net of interest expense
18,955

 
21,434

 
21,960

 
22,767

 
21,701

 
21,743

 
22,949

 
23,408

Net interest yield (2)
2.18
%
 
2.29
%
 
2.22
%
 
2.29
%
 
2.44
%
 
2.33
%
 
2.35
%
 
2.36
%
Efficiency ratio
74.90

 
93.97

 
84.43

 
97.68

 
79.75

 
75.38

 
69.80

 
83.31

(1) 
FTE basis is a non-GAAP financial measure. FTE basis is a performance measure used by management in operating the business that management believes provides investors with a more accurate picture of the interest margin for comparative purposes. For more information on these performance measures and ratios, see Supplemental Financial Data on page 12 and for corresponding reconciliations to GAAP financial measures, see Statistical Table XVII.
(2) 
Beginning in 2014, interest-bearing deposits placed with the Federal Reserve and certain non-U.S. central banks are included in earning assets. Prior period yields have been reclassified to conform to current period presentation.

112     Bank of America 2014


Table XV  Five-year Reconciliations to GAAP Financial Measures (1)


(Dollars in millions, shares in thousands)
2014
 
2013
 
2012
 
2011
 
2010
Reconciliation of net interest income to net interest income on a fully taxable-equivalent basis


Net interest income
$
39,952

 
$
42,265

 
$
40,656

 
$
44,616

 
$
51,523

Fully taxable-equivalent adjustment
869

 
859

 
901

 
972

 
1,170

Net interest income on a fully taxable-equivalent basis
$
40,821

 
$
43,124

 
$
41,557

 
$
45,588

 
$
52,693

Reconciliation of total revenue, net of interest expense to total revenue, net of interest expense on a fully taxable-equivalent basis


Total revenue, net of interest expense
$
84,247

 
$
88,942

 
$
83,334

 
$
93,454

 
$
110,220

Fully taxable-equivalent adjustment
869

 
859

 
901

 
972

 
1,170

Total revenue, net of interest expense on a fully taxable-equivalent basis
$
85,116

 
$
89,801

 
$
84,235

 
$
94,426

 
$
111,390

Reconciliation of total noninterest expense to total noninterest expense, excluding goodwill impairment charges


Total noninterest expense
$
75,117

 
$
69,214

 
$
72,093

 
$
80,274

 
$
83,108

Goodwill impairment charges


(3,184
)
 
(12,400
)
Total noninterest expense, excluding goodwill impairment charges
$
75,117

 
$
69,214

 
$
72,093

 
$
77,090

 
$
70,708

Reconciliation of income tax expense (benefit) to income tax expense (benefit) on a fully taxable-equivalent basis


Income tax expense (benefit)
$
2,022

 
$
4,741

 
$
(1,116
)
 
$
(1,676
)
 
$
915

Fully taxable-equivalent adjustment
869

 
859

 
901

 
972

 
1,170

Income tax expense (benefit) on a fully taxable-equivalent basis
$
2,891

 
$
5,600

 
$
(215
)
 
$
(704
)
 
$
2,085

Reconciliation of net income (loss) to net income, excluding goodwill impairment charges


Net income (loss)
$
4,833

 
$
11,431

 
$
4,188

 
$
1,446

 
$
(2,238
)
Goodwill impairment charges


3,184

 
12,400

Net income, excluding goodwill impairment charges
$
4,833

 
$
11,431

 
$
4,188

 
$
4,630

 
$
10,162

Reconciliation of net income (loss) applicable to common shareholders to net income applicable to common shareholders, excluding goodwill impairment charges


Net income (loss) applicable to common shareholders
$
3,789

 
$
10,082

 
$
2,760

 
$
85

 
$
(3,595
)
Goodwill impairment charges


3,184

 
12,400

Net income applicable to common shareholders, excluding goodwill impairment charges
$
3,789

 
$
10,082

 
$
2,760

 
$
3,269

 
$
8,805

Reconciliation of average common shareholders’ equity to average tangible common shareholders’ equity


Common shareholders’ equity
$
223,066

 
$
218,468

 
$
216,996

 
$
211,709

 
$
212,686

Common Equivalent Securities


2,900

Goodwill
(69,809
)
 
(69,910
)
 
(69,974
)
 
(72,334
)
 
(82,600
)
Intangible assets (excluding MSRs)
(5,109
)
 
(6,132
)
 
(7,366
)
 
(9,180
)
 
(10,985
)
Related deferred tax liabilities
2,090

 
2,328

 
2,593

 
2,898

 
3,306

Tangible common shareholders’ equity
$
150,238

 
$
144,754

 
$
142,249

 
$
133,093

 
$
125,307

Reconciliation of average shareholders’ equity to average tangible shareholders’ equity


Shareholders’ equity
$
238,476

 
$
233,947

 
$
235,677

 
$
229,095

 
$
233,235

Goodwill
(69,809
)
 
(69,910
)
 
(69,974
)
 
(72,334
)
 
(82,600
)
Intangible assets (excluding MSRs)
(5,109
)
 
(6,132
)
 
(7,366
)
 
(9,180
)
 
(10,985
)
Related deferred tax liabilities
2,090

 
2,328

 
2,593

 
2,898

 
3,306

Tangible shareholders’ equity
$
165,648

 
$
160,233

 
$
160,930

 
$
150,479

 
$
142,956

Reconciliation of year-end common shareholders’ equity to year-end tangible common shareholders’ equity


Common shareholders’ equity
$
224,162

 
$
219,333

 
$
218,188

 
$
211,704

 
$
211,686

Goodwill
(69,777
)
 
(69,844
)
 
(69,976
)
 
(69,967
)
 
(73,861
)
Intangible assets (excluding MSRs)
(4,612
)
 
(5,574
)
 
(6,684
)
 
(8,021
)
 
(9,923
)
Related deferred tax liabilities
1,960

 
2,166

 
2,428

 
2,702

 
3,036

Tangible common shareholders’ equity
$
151,733

 
$
146,081

 
$
143,956

 
$
136,418

 
$
130,938

Reconciliation of year-end shareholders’ equity to year-end tangible shareholders’ equity


Shareholders’ equity
$
243,471

 
$
232,685

 
$
236,956

 
$
230,101

 
$
228,248

Goodwill
(69,777
)
 
(69,844
)
 
(69,976
)
 
(69,967
)
 
(73,861
)
Intangible assets (excluding MSRs)
(4,612
)
 
(5,574
)
 
(6,684
)
 
(8,021
)
 
(9,923
)
Related deferred tax liabilities
1,960

 
2,166

 
2,428

 
2,702

 
3,036

Tangible shareholders’ equity
$
171,042

 
$
159,433

 
$
162,724

 
$
154,815

 
$
147,500

Reconciliation of year-end assets to year-end tangible assets


Assets
$
2,104,534

 
$
2,102,273

 
$
2,209,974

 
$
2,129,046

 
$
2,264,909

Goodwill
(69,777
)
 
(69,844
)
 
(69,976
)
 
(69,967
)
 
(73,861
)
Intangible assets (excluding MSRs)
(4,612
)
 
(5,574
)
 
(6,684
)
 
(8,021
)
 
(9,923
)
Related deferred tax liabilities
1,960

 
2,166

 
2,428

 
2,702

 
3,036

Tangible assets
$
2,032,105

 
$
2,029,021

 
$
2,135,742

 
$
2,053,760

 
$
2,184,161

(1) 
Presents reconciliations of non-GAAP financial measures to GAAP financial measures. We believe the use of these non-GAAP financial measures provides additional clarity in assessing the results of the Corporation. Other companies may define or calculate these measures differently. For more information on non-GAAP financial measures and ratios we use in assessing the results of the Corporation, see Supplemental Financial Data on page 12.


Bank of America 2014     113


Table XVI  Two-year Reconciliations to GAAP Financial Measures (1, 2)


(Dollars in millions)
2014
 
2013
Consumer Banking


Reported net income
$
6,441

 
$
6,243

Adjustment related to intangibles (3)
4

 
7

Adjusted net income
$
6,445

 
$
6,250


Average allocated equity (4)
$
60,393

 
$
61,179

Adjustment related to goodwill and a percentage of intangibles
(30,393
)
 
(30,479
)
Average allocated capital
$
30,000

 
$
30,700


Deposits


Reported net income
$
2,449

 
$
1,846

Adjustment related to intangibles (3)

 
1

Adjusted net income
$
2,449

 
$
1,847


Average allocated equity (4)
$
29,427

 
$
28,535

Adjustment related to goodwill and a percentage of intangibles
(18,427
)
 
(18,435
)
Average allocated capital
$
11,000

 
$
10,100


Consumer Lending


Reported net income
$
3,992

 
$
4,397

Adjustment related to intangibles (3)
4

 
7

Adjusted net income
$
3,996

 
$
4,404


Average allocated equity (4)
$
30,966

 
$
32,644

Adjustment related to goodwill and a percentage of intangibles
(11,966
)
 
(12,044
)
Average allocated capital
$
19,000

 
$
20,600


Global Wealth & Investment Management


Reported net income
$
2,974

 
$
2,977

Adjustment related to intangibles (3)
13

 
16

Adjusted net income
$
2,987

 
$
2,993


Average allocated equity (4)
$
22,214

 
$
20,292

Adjustment related to goodwill and a percentage of intangibles
(10,214
)
 
(10,292
)
Average allocated capital
$
12,000

 
$
10,000


Global Banking


Reported net income
$
5,755

 
$
5,200

Adjustment related to intangibles (3)
2

 
3

Adjusted net income
$
5,757

 
$
5,203


Average allocated equity (4)
$
57,450

 
$
49,358

Adjustment related to goodwill and a percentage of intangibles
(23,950
)
 
(23,958
)
Average allocated capital
$
33,500

 
$
25,400


Global Markets


Reported net income
$
2,719

 
$
1,154

Adjustment related to intangibles (3)
9

 
9

Adjusted net income
$
2,728

 
$
1,163


Average allocated equity (4)
$
39,374

 
$
35,370

Adjustment related to goodwill and a percentage of intangibles
(5,374
)
 
(5,370
)
Average allocated capital
$
34,000

 
$
30,000

(1) 
Presents reconciliations of non-GAAP financial measures to GAAP financial measures. We believe the use of these non-GAAP financial measures provides additional clarity in assessing the results of the Corporation and our segments. Other companies may define or calculate these measures differently. For more information on non-GAAP financial measures and ratios we use in assessing the results of the Corporation, see Supplemental Financial Data on page 12.
(2) 
There are no adjustments to reported net income (loss) or average allocated equity for LAS.
(3) 
Represents cost of funds, earnings credits and certain expenses related to intangibles.
(4) 
Average allocated equity is comprised of average allocated capital plus capital for the portion of goodwill and intangibles specifically assigned to the business segment. For more information on allocated capital, see Business Segment Operations on page 14 and Note 8 – Goodwill and Intangible Assets to the Consolidated Financial Statements.

114     Bank of America 2014


Table XVII  Quarterly Reconciliations to GAAP Financial Measures (1)


2014 Quarters
 
2013 Quarters
(Dollars in millions)
Fourth
 
Third
 
Second
 
First
 
Fourth
 
Third
 
Second
 
First
Reconciliation of net interest income to net interest income on a fully taxable-equivalent basis


Net interest income
$
9,635

 
$
10,219

 
$
10,013

 
$
10,085

 
$
10,786

 
$
10,266

 
$
10,549

 
$
10,664

Fully taxable-equivalent adjustment
230

 
225

 
213

 
201

 
213

 
213

 
222

 
211

Net interest income on a fully taxable-equivalent basis
$
9,865

 
$
10,444

 
$
10,226

 
$
10,286

 
$
10,999

 
$
10,479

 
$
10,771

 
$
10,875

Reconciliation of total revenue, net of interest expense to total revenue, net of interest expense on a fully taxable-equivalent basis


Total revenue, net of interest expense
$
18,725

 
$
21,209

 
$
21,747

 
$
22,566

 
$
21,488

 
$
21,530

 
$
22,727

 
$
23,197

Fully taxable-equivalent adjustment
230

 
225

 
213

 
201

 
213

 
213

 
222

 
211

Total revenue, net of interest expense on a fully taxable-equivalent basis
$
18,955

 
$
21,434

 
$
21,960

 
$
22,767

 
$
21,701

 
$
21,743

 
$
22,949

 
$
23,408

Reconciliation of income tax expense (benefit) to income tax expense (benefit) on a fully taxable-equivalent basis


Income tax expense (benefit)
$
1,260

 
$
663

 
$
504

 
$
(405
)
 
$
406

 
$
2,348

 
$
1,486

 
$
501

Fully taxable-equivalent adjustment
230

 
225

 
213

 
201

 
213

 
213

 
222

 
211

Income tax expense (benefit) on a fully taxable-equivalent basis
$
1,490

 
$
888

 
$
717

 
$
(204
)
 
$
619

 
$
2,561

 
$
1,708

 
$
712

Reconciliation of average common shareholders’ equity to average tangible common shareholders’ equity


Common shareholders’ equity
$
224,473

 
$
222,368

 
$
222,215

 
$
223,201

 
$
220,088

 
$
216,766

 
$
218,790

 
$
218,225

Goodwill
(69,782
)
 
(69,792
)
 
(69,822
)
 
(69,842
)
 
(69,864
)
 
(69,903
)
 
(69,930
)
 
(69,945
)
Intangible assets (excluding MSRs)
(4,747
)
 
(4,992
)
 
(5,235
)
 
(5,474
)
 
(5,725
)
 
(5,993
)
 
(6,270
)
 
(6,549
)
Related deferred tax liabilities
2,019

 
2,077

 
2,100

 
2,165

 
2,231

 
2,296

 
2,360

 
2,425

Tangible common shareholders’ equity
$
151,963

 
$
149,661

 
$
149,258

 
$
150,050

 
$
146,730

 
$
143,166

 
$
144,950

 
$
144,156

Reconciliation of average shareholders’ equity to average tangible shareholders’ equity


Shareholders’ equity
$
243,448

 
$
238,034

 
$
235,797

 
$
236,553

 
$
233,415

 
$
230,392

 
$
235,063

 
$
236,995

Goodwill
(69,782
)
 
(69,792
)
 
(69,822
)
 
(69,842
)
 
(69,864
)
 
(69,903
)
 
(69,930
)
 
(69,945
)
Intangible assets (excluding MSRs)
(4,747
)
 
(4,992
)
 
(5,235
)
 
(5,474
)
 
(5,725
)
 
(5,993
)
 
(6,270
)
 
(6,549
)
Related deferred tax liabilities
2,019

 
2,077

 
2,100

 
2,165

 
2,231

 
2,296

 
2,360

 
2,425

Tangible shareholders’ equity
$
170,938

 
$
165,327

 
$
162,840

 
$
163,402

 
$
160,057

 
$
156,792

 
$
161,223

 
$
162,926

Reconciliation of period-end common shareholders’ equity to period-end tangible common shareholders’ equity


Common shareholders’ equity
$
224,162

 
$
220,768

 
$
222,565

 
$
218,536

 
$
219,333

 
$
218,967

 
$
216,791

 
$
218,513

Goodwill
(69,777
)
 
(69,784
)
 
(69,810
)
 
(69,842
)
 
(69,844
)
 
(69,891
)
 
(69,930
)
 
(69,930
)
Intangible assets (excluding MSRs)
(4,612
)
 
(4,849
)
 
(5,099
)
 
(5,337
)
 
(5,574
)
 
(5,843
)
 
(6,104
)
 
(6,379
)
Related deferred tax liabilities
1,960

 
2,019

 
2,078

 
2,100

 
2,166

 
2,231

 
2,297

 
2,363

Tangible common shareholders’ equity
$
151,733

 
$
148,154

 
$
149,734

 
$
145,457

 
$
146,081

 
$
145,464

 
$
143,054

 
$
144,567

Reconciliation of period-end shareholders’ equity to period-end tangible shareholders’ equity


Shareholders’ equity
$
243,471

 
$
238,681

 
$
237,411

 
$
231,888

 
$
232,685

 
$
232,282

 
$
231,032

 
$
237,293

Goodwill
(69,777
)
 
(69,784
)
 
(69,810
)
 
(69,842
)
 
(69,844
)
 
(69,891
)
 
(69,930
)
 
(69,930
)
Intangible assets (excluding MSRs)
(4,612
)
 
(4,849
)
 
(5,099
)
 
(5,337
)
 
(5,574
)
 
(5,843
)
 
(6,104
)
 
(6,379
)
Related deferred tax liabilities
1,960

 
2,019

 
2,078

 
2,100

 
2,166

 
2,231

 
2,297

 
2,363

Tangible shareholders’ equity
$
171,042

 
$
166,067

 
$
164,580

 
$
158,809

 
$
159,433

 
$
158,779

 
$
157,295

 
$
163,347

Reconciliation of period-end assets to period-end tangible assets


Assets
$
2,104,534

 
$
2,123,613

 
$
2,170,557

 
$
2,149,851

 
$
2,102,273

 
$
2,126,653

 
$
2,123,320

 
$
2,174,819

Goodwill
(69,777
)
 
(69,784
)
 
(69,810
)
 
(69,842
)
 
(69,844
)
 
(69,891
)
 
(69,930
)
 
(69,930
)
Intangible assets (excluding MSRs)
(4,612
)
 
(4,849
)
 
(5,099
)
 
(5,337
)
 
(5,574
)
 
(5,843
)
 
(6,104
)
 
(6,379
)
Related deferred tax liabilities
1,960

 
2,019

 
2,078

 
2,100

 
2,166

 
2,231

 
2,297

 
2,363

Tangible assets
$
2,032,105

 
$
2,050,999

 
$
2,097,726

 
$
2,076,772

 
$
2,029,021

 
$
2,053,150

 
$
2,049,583

 
$
2,100,873

(1) 
Presents reconciliations of non-GAAP financial measures to GAAP financial measures. We believe the use of these non-GAAP financial measures provides additional clarity in assessing the results of the Corporation. Other companies may define or calculate these measures differently. For more information on non-GAAP financial measures and ratios we use in assessing the results of the Corporation, see Supplemental Financial Data on page 12.


Bank of America 2014     115


Glossary
Alt-A Mortgage – A type of U.S. mortgage that, for various reasons, is considered riskier than A-paper, or “prime,” and less risky than “subprime,” the riskiest category. Alt-A interest rates, which are determined by credit risk, therefore tend to be between those of prime and subprime consumer real estate loans. Typically, Alt-A mortgages are characterized by borrowers with less than full documentation, lower credit scores and higher LTVs.
Assets in Custody – Consist largely of custodial and non-discretionary trust assets excluding brokerage assets administered for clients. Trust assets encompass a broad range of asset types including real estate, private company ownership interest, personal property and investments.
Assets Under Management (AUM) – The total market value of assets under the investment advisory and discretion of GWIM which generate asset management fees based on a percentage of the assets’ market values. AUM reflects assets that are generally managed for institutional, high net worth and retail clients, and are distributed through various investment products including mutual funds, other commingled vehicles and separate accounts. AUM is classified in two categories, Liquidity AUM and Long-term AUM. Liquidity AUM are assets under advisory and discretion of GWIM in which the investment strategy seeks to maximize income while maintaining liquidity and capital preservation. The duration of these strategies is primarily less than one year. Long-term AUM are assets under advisory and discretion of GWIM in which the duration of investment strategy is longer than one year.
Carrying Value (with respect to loans) – The amount at which a loan is recorded on the balance sheet. For loans recorded at amortized cost, carrying value is the unpaid principal balance net of unamortized deferred loan origination fees and costs, and unamortized purchase premium or discount. For loans that are or have been on nonaccrual status, the carrying value is also reduced by any net charge-offs that have been recorded and the amount of interest payments applied as a reduction of principal under the cost recovery method. For PCI loans, the carrying value equals fair value upon acquisition adjusted for subsequent cash collections and yield accreted to date. For credit card loans, the carrying value also includes interest that has been billed to the customer. For loans classified as held-for-sale, carrying value is the lower of carrying value as described in the sentences above, or fair value. For loans for which we have elected the fair value option, the carrying value is fair value.
Client Brokerage Assets – Include client assets which are held in brokerage accounts. This includes non-discretionary brokerage and fee-based assets which generate brokerage income and asset management fee revenue.
Committed Credit Exposure – Includes any funded portion of a facility plus the unfunded portion of a facility on which the lender is legally bound to advance funds during a specified period under prescribed conditions.
Credit Derivatives – Contractual agreements that provide protection against a credit event on one or more referenced
 
obligations. The nature of a credit event is established by the protection purchaser and protection seller at the inception of the transaction, and such events generally include bankruptcy or insolvency of the referenced credit entity, failure to meet payment obligations when due, as well as acceleration of indebtedness and payment repudiation or moratorium. The purchaser of the credit derivative pays a periodic fee in return for a payment by the protection seller upon the occurrence, if any, of such a credit event. A credit default swap is a type of a credit derivative.
Credit Valuation Adjustment (CVA) – A portfolio adjustment required to properly reflect the counterparty credit risk exposure as part of the fair value of derivative instruments.
Debit Valuation Adjustment (DVA) – A portfolio adjustment required to properly reflect the Corporation’s own credit risk exposure as part of the fair value of derivative instruments and/or structured liabilities.
Funding Valuation Adjustment (FVA) – A portfolio adjustment required to include funding costs on uncollateralized derivatives and derivatives where the Corporation is not permitted to use the collateral it receives.
Interest Rate Lock Commitment (IRLC) – Commitment with a loan applicant in which the loan terms, including interest rate and price, are guaranteed for a designated period of time subject to credit approval.
Letter of Credit – A document issued on behalf of a customer to a third party promising to pay the third party upon presentation of specified documents. A letter of credit effectively substitutes the issuer’s credit for that of the customer.
Loan-to-value (LTV) – A commonly used credit quality metric that is reported in terms of ending and average LTV. Ending LTV is calculated as the outstanding carrying value of the loan at the end of the period divided by the estimated value of the property securing the loan. An additional metric related to LTV is combined loan-to-value (CLTV) which is similar to the LTV metric, yet combines the outstanding balance on the residential mortgage loan and the outstanding carrying value on the home equity loan or available line of credit, both of which are secured by the same property, divided by the estimated value of the property. A LTV of 100 percent reflects a loan that is currently secured by a property valued at an amount exactly equal to the carrying value or available line of the loan. Estimated property values are generally determined through the use of automated valuation models (AVMs) or the CoreLogic Case-Shiller Index. An AVM is a tool that estimates the value of a property by reference to large volumes of market data including sales of comparable properties and price trends specific to the MSA in which the property being valued is located. CoreLogic Case-Shiller is a widely used index based on data from repeat sales of single family homes. CoreLogic Case-Shiller indexed-based values are reported on a three-month or one-quarter lag.
Margin Receivable An extension of credit secured by eligible securities in certain brokerage accounts.


116     Bank of America 2014


Matched Book – Repurchase and resale agreements and securities borrowed and loaned transactions entered into to accommodate customers and earn interest rate spreads.
Mortgage Servicing Right (MSR) – The right to service a mortgage loan when the underlying loan is sold or securitized. Servicing includes collections for principal, interest and escrow payments from borrowers and accounting for and remitting principal and interest payments to investors.
Net Interest Yield – Net interest income divided by average total interest-earning assets.
Nonperforming Loans and Leases – Includes loans and leases that have been placed on nonaccrual status, including nonaccruing loans whose contractual terms have been restructured in a manner that grants a concession to a borrower experiencing financial difficulties (TDRs). Loans accounted for under the fair value option, PCI loans and LHFS are not reported as nonperforming loans and leases. Consumer credit card loans, business card loans, consumer loans secured by personal property (except for certain secured consumer loans, including those that have been modified in a TDR), and consumer loans secured by real estate that are insured by the FHA or through long-term credit protection agreements with FNMA and FHLMC (fully-insured loan portfolio) are not placed on nonaccrual status and are, therefore, not reported as nonperforming loans and leases.
Purchased Credit-impaired (PCI) Loan – A loan purchased as an individual loan, in a portfolio of loans or in a business combination with evidence of deterioration in credit quality since origination for which it is probable, upon acquisition, that the investor will be unable to collect all contractually required payments. These loans are recorded at fair value upon acquisition.
Subprime Loans – Although a standard industry definition for subprime loans (including subprime mortgage loans) does not exist, the Corporation defines subprime loans as specific product offerings for higher risk borrowers, including individuals with one or a combination of high credit risk factors, such as low FICO scores, high debt to income ratios and inferior payment history.
 
Troubled Debt Restructurings (TDRs) – Loans whose contractual terms have been restructured in a manner that grants a concession to a borrower experiencing financial difficulties. Certain consumer loans for which a binding offer to restructure has been extended are also classified as TDRs. Concessions could include a reduction in the interest rate to a rate that is below market on the loan, payment extensions, forgiveness of principal, forbearance, loans discharged in bankruptcy or other actions intended to maximize collection. Secured consumer loans that have been discharged in Chapter 7 bankruptcy and have not been reaffirmed by the borrower are classified as TDRs at the time of discharge from bankruptcy. TDRs are generally reported as nonperforming loans and leases while on nonaccrual status. Nonperforming TDRs may be returned to accrual status when, among other criteria, payment in full of all amounts due under the restructured terms is expected and the borrower has demonstrated a sustained period of repayment performance, generally six months. TDRs that are on accrual status are reported as performing TDRs through the end of the calendar year in which the restructuring occurred or the year in which they are returned to accrual status. In addition, if accruing TDRs bear less than a market rate of interest at the time of modification, they are reported as performing TDRs throughout their remaining lives unless and until they cease to perform in accordance with their modified contractual terms, at which time they would be placed on nonaccrual status and reported as nonperforming TDRs.
Value-at-Risk (VaR) – VaR is a model that simulates the value of a portfolio under a range of hypothetical scenarios in order to generate a distribution of potential gains and losses. VaR represents the loss the portfolio is expected to experience with a given confidence level based on historical data. A VaR model is an effective tool in estimating ranges of potential gains and losses on our trading portfolios.


Bank of America 2014     117


Acronyms
ABS
Asset-backed securities
AFS
Available-for-sale
ALM
Asset and liability management
ARM
Adjustable-rate mortgage
AUM
Assets under management
BHC
Bank holding company
CCAR
Comprehensive Capital Analysis and Review
CDO
Collateralized debt obligation
CGA
Corporate General Auditor
CLO
Collateralized loan obligation
CRA
Community Reinvestment Act
CVA
Credit valuation adjustment
DVA
Debit valuation adjustment
EAD
Exposure at default
ERC
Enterprise Risk Committee
FDIC
Federal Deposit Insurance Corporation
FHA
Federal Housing Administration
FHFA
Federal Housing Finance Agency
FHLB
Federal Home Loan Bank
FHLMC
Freddie Mac
FICC
Fixed-income, currencies and commodities
FICO
Fair Isaac Corporation (credit score)
FLUs
Front line units
FNMA
Fannie Mae
FTE
Fully taxable-equivalent
FVA
Funding valuation adjustment
GAAP
Accounting principles generally accepted in the United States of America
GM&CA
Global Marketing and Corporate Affairs
GNMA
Government National Mortgage Association
GSE
Government-sponsored enterprise
 
HELOC
Home equity lines of credit
HFI
Held-for-investment
HUD
U.S. Department of Housing and Urban Development
IRM
Independent risk management
LCR
Liquidity Coverage Ratio
LGD
Loss-given default
LHFS
Loans held-for-sale
LIBOR
London InterBank Offered Rate
LTV
Loan-to-value
MD&A
Management’s Discussion and Analysis of Financial Condition and Results of Operations
MI
Mortgage insurance
MRC
Management Risk Committee
MSA
Metropolitan statistical area
MSR
Mortgage servicing right
NSFR
Net Stable Funding Ratio
OCC
Office of the Comptroller of the Currency
OCI
Other comprehensive income
OTC
Over-the-counter
OTTI
Other-than-temporary impairment
PCI
Purchased credit-impaired
PPI
Payment protection insurance
RCSAs
Risk and Control Self Assessments
RMBS
Residential mortgage-backed securities
SBLCs
Standby letters of credit
SEC
Securities and Exchange Commission
SLR
Supplementary leverage ratio
TDR
Troubled debt restructurings
VIE
Variable interest entity


118     Bank of America 2014