| Page | ||||
| Item 1. |
Financial Statements: |
|||
| 2 | ||||
| 3 | ||||
| 4 | ||||
| 5 | ||||
| 6 | ||||
| Management’s Discussion and Analysis of Results of Operations and Financial Condition |
17 | |||
| Quantitative and Qualitative Disclosures about Market Risk |
65 | |||
| Controls and Procedures |
65 | |||
| Part II Other Information | ||||
| Legal Proceedings |
65 | |||
| Changes in Securities and Use of Proceeds |
66 | |||
| Exhibits and Reports on Form 8-K |
67 | |||
| 68 | ||||
| 69 | ||||
| 70 | ||||
| 71 | ||||
| Three Months Ended September 30 |
Nine Months Ended September 30 | |||||||||||||
| (Dollars in millions, except per share information) |
2002 |
2001 |
2002 |
2001 | ||||||||||
| Interest income |
||||||||||||||
| Interest and fees on loans and leases |
$ |
5,553 |
|
$ |
6,543 |
$ |
16,528 |
|
$ |
21,455 | ||||
| Interest and dividends on securities |
|
1,104 |
|
|
892 |
|
2,974 |
|
|
2,631 | ||||
| Federal funds sold and securities purchased under agreements to resell |
|
177 |
|
|
321 |
|
662 |
|
|
1,161 | ||||
| Trading account assets |
|
1,006 |
|
|
930 |
|
2,832 |
|
|
2,712 | ||||
| Other interest income |
|
345 |
|
|
636 |
|
1,044 |
|
|
1,529 | ||||
| |
|
|
|
|
|
|
|
|
| |||||
| Total interest income |
|
8,185 |
|
|
9,322 |
|
24,040 |
|
|
29,488 | ||||
| |
|
|
|
|
|
|
|
|
| |||||
| Interest expense |
||||||||||||||
| Deposits |
|
1,414 |
|
|
2,097 |
|
4,142 |
|
|
7,173 | ||||
| Short-term borrowings |
|
526 |
|
|
869 |
|
1,532 |
|
|
3,467 | ||||
| Trading account liabilities |
|
342 |
|
|
285 |
|
971 |
|
|
887 | ||||
| Long-term debt |
|
601 |
|
|
867 |
|
1,846 |
|
|
3,088 | ||||
| |
|
|
|
|
|
|
|
|
| |||||
| Total interest expense |
|
2,883 |
|
|
4,118 |
|
8,491 |
|
|
14,615 | ||||
| |
|
|
|
|
|
|
|
|
| |||||
| Net interest income |
|
5,302 |
|
|
5,204 |
|
15,549 |
|
|
14,873 | ||||
| Noninterest income |
||||||||||||||
| Consumer service charges |
|
763 |
|
|
712 |
|
2,189 |
|
|
2,120 | ||||
| Corporate service charges |
|
585 |
|
|
528 |
|
1,717 |
|
|
1,538 | ||||
| |
|
|
|
|
|
|
|
|
| |||||
| Total service charges |
|
1,348 |
|
|
1,240 |
|
3,906 |
|
|
3,658 | ||||
| |
|
|
|
|
|
|
|
|
| |||||
| Consumer investment and brokerage services |
|
373 |
|
|
386 |
|
1,174 |
|
|
1,164 | ||||
| Corporate investment and brokerage services |
|
174 |
|
|
142 |
|
522 |
|
|
415 | ||||
| |
|
|
|
|
|
|
|
|
| |||||
| Total investment and brokerage services |
|
547 |
|
|
528 |
|
1,696 |
|
|
1,579 | ||||
| |
|
|
|
|
|
|
|
|
| |||||
| Mortgage banking income |
|
218 |
|
|
109 |
|
545 |
|
|
426 | ||||
| Investment banking income |
|
318 |
|
|
305 |
|
1,123 |
|
|
1,106 | ||||
| Equity investment gains (losses) |
|
(216 |
) |
|
22 |
|
(226 |
) |
|
340 | ||||
| Card income |
|
685 |
|
|
618 |
|
1,881 |
|
|
1,792 | ||||
| Trading account profits(1) |
|
71 |
|
|
433 |
|
679 |
|
|
1,508 | ||||
| Other income |
|
249 |
|
|
174 |
|
537 |
|
|
541 | ||||
| |
|
|
|
|
|
|
|
|
| |||||
| Total noninterest income |
|
3,220 |
|
|
3,429 |
|
10,141 |
|
|
10,950 | ||||
| |
|
|
|
|
|
|
|
|
| |||||
| Total revenue |
|
8,522 |
|
|
8,633 |
|
25,690 |
|
|
25,823 | ||||
| Provision for credit losses |
|
804 |
|
|
1,251 |
|
2,532 |
|
|
2,886 | ||||
| Gains on sales of securities |
|
189 |
|
|
97 |
|
326 |
|
|
82 | ||||
| Noninterest expense |
||||||||||||||
| Personnel |
|
2,368 |
|
|
2,304 |
|
7,200 |
|
|
7,239 | ||||
| Occupancy |
|
457 |
|
|
448 |
|
1,330 |
|
|
1,309 | ||||
| Equipment |
|
291 |
|
|
273 |
|
832 |
|
|
835 | ||||
| Marketing |
|
210 |
|
|
165 |
|
550 |
|
|
516 | ||||
| Professional fees |
|
126 |
|
|
144 |
|
339 |
|
|
411 | ||||
| Amortization of intangibles |
|
54 |
|
|
219 |
|
164 |
|
|
665 | ||||
| Data processing |
|
295 |
|
|
175 |
|
726 |
|
|
552 | ||||
| Telecommunications |
|
119 |
|
|
121 |
|
361 |
|
|
368 | ||||
| Other general operating |
|
700 |
|
|
757 |
|
2,102 |
|
|
2,186 | ||||
| Business exit costs |
|
— |
|
|
1,305 |
|
— |
|
|
1,305 | ||||
| |
|
|
|
|
|
|
|
|
| |||||
| Total noninterest expense |
|
4,620 |
|
|
5,911 |
|
13,604 |
|
|
15,386 | ||||
| |
|
|
|
|
|
|
|
|
| |||||
| Income before income taxes |
|
3,287 |
|
|
1,568 |
|
9,880 |
|
|
7,633 | ||||
| Income tax expense |
|
1,052 |
|
|
727 |
|
3,245 |
|
|
2,899 | ||||
| |
|
|
|
|
|
|
|
|
| |||||
| Net income |
$ |
2,235 |
|
$ |
841 |
$ |
6,635 |
|
$ |
4,734 | ||||
| |
|
|
|
|
|
|
|
|
| |||||
| Net income available to common shareholders |
$ |
2,233 |
|
$ |
839 |
$ |
6,631 |
|
$ |
4,730 | ||||
| |
|
|
|
|
|
|
|
|
| |||||
| Per common share information |
||||||||||||||
| Earnings |
$ |
1.49 |
|
$ |
0.52 |
$ |
4.34 |
|
$ |
2.95 | ||||
| |
|
|
|
|
|
|
|
|
| |||||
| Diluted earnings |
$ |
1.45 |
|
$ |
0.51 |
$ |
4.22 |
|
$ |
2.90 | ||||
| |
|
|
|
|
|
|
|
|
| |||||
| Dividends |
$ |
0.60 |
|
$ |
0.56 |
$ |
1.80 |
|
$ |
1.68 | ||||
| |
|
|
|
|
|
|
|
|
| |||||
| Average common shares issued and outstanding (in thousands) |
|
1,504,017 |
|
|
1,599,692 |
|
1,526,946 |
|
|
1,603,340 | ||||
| |
|
|
|
|
|
|
|
|
| |||||
(1) |
Trading account profits for the nine months ended September 30, 2001 included the $83 million, or $0.03 per share, transition adjustment loss resulting from
the adoption of Statement of Financial Accounting Standards No. 133, "Accounting for Derivative Instruments and Hedging Activities," (SFAS 133) on January 1, 2001. |
| (Dollars in millions) |
September 30 2002 |
December 31 2001 |
||||||
| Assets |
||||||||
| Cash and cash equivalents |
$ |
24,469 |
|
$ |
26,837 |
| ||
| Time deposits placed and other short-term investments |
|
6,397 |
|
|
5,932 |
| ||
| Federal funds sold and securities purchased under agreements to resell (includes $40,353 and $27,910 pledged as
collateral) |
|
40,371 |
|
|
28,108 |
| ||
| Trading account assets (includes $21,758 and $22,550 pledged as collateral) |
|
56,907 |
|
|
47,344 |
| ||
| Derivative assets |
|
32,838 |
|
|
22,147 |
| ||
| Securities: |
||||||||
| Available-for-sale (includes $49,610 and $37,422 pledged as collateral) |
|
88,571 |
|
|
84,450 |
| ||
| Held-to-maturity, at cost (market value — $975 and $1,009) |
|
1,010 |
|
|
1,049 |
| ||
| |
|
|
|
|
| |||
| Total securities |
|
89,581 |
|
|
85,499 |
| ||
| |
|
|
|
|
| |||
| Loans and leases |
|
341,091 |
|
|
329,153 |
| ||
| Allowance for credit losses |
|
(6,861 |
) |
|
(6,875 |
) | ||
| |
|
|
|
|
| |||
| Loans and leases, net of allowance for credit losses |
|
334,230 |
|
|
322,278 |
| ||
| |
|
|
|
|
| |||
| Premises and equipment, net |
|
6,758 |
|
|
6,414 |
| ||
| Mortgage banking assets |
|
2,129 |
|
|
3,886 |
| ||
| Goodwill |
|
11,389 |
|
|
10,854 |
| ||
| Core deposits and other intangibles |
|
1,127 |
|
|
1,294 |
| ||
| Other assets |
|
53,812 |
|
|
61,171 |
| ||
| |
|
|
|
|
| |||
| Total assets |
$ |
660,008 |
|
$ |
621,764 |
| ||
| |
|
|
|
|
| |||
| Liabilities |
||||||||
| Deposits in domestic offices: |
||||||||
| Noninterest-bearing |
$ |
116,847 |
|
$ |
112,064 |
| ||
| Interest-bearing |
|
228,174 |
|
|
220,703 |
| ||
| Deposits in foreign offices: |
||||||||
| Noninterest-bearing |
|
1,928 |
|
|
1,870 |
| ||
| Interest-bearing |
|
30,466 |
|
|
38,858 |
| ||
| |
|
|
|
|
| |||
| Total deposits |
|
377,415 |
|
|
373,495 |
| ||
| |
|
|
|
|
| |||
| Federal funds purchased and securities sold under agreements to repurchase |
|
61,823 |
|
|
47,727 |
| ||
| Trading account liabilities |
|
26,031 |
|
|
19,452 |
| ||
| Derivative liabilities |
|
23,701 |
|
|
14,868 |
| ||
| Commercial paper |
|
149 |
|
|
1,558 |
| ||
| Other short-term borrowings |
|
34,272 |
|
|
20,659 |
| ||
| Accrued expenses and other liabilities |
|
22,393 |
|
|
27,459 |
| ||
| Long-term debt |
|
59,954 |
|
|
62,496 |
| ||
| Trust preferred securities |
|
6,031 |
|
|
5,530 |
| ||
| |
|
|
|
|
| |||
| Total liabilities |
|
611,769 |
|
|
573,244 |
| ||
| |
|
|
|
|
| |||
| Commitments and contingencies (Note Seven) |
||||||||
| Shareholders’ equity |
||||||||
| Preferred stock, $0.01 par value; authorized — 100,000,000 shares; issued and
outstanding — 1,391,749 and 1,514,478 shares |
|
60 |
|
|
65 |
| ||
| Common stock, $0.01 par value; authorized — 5,000,000,000 shares; issued and
outstanding — 1,502,161,891 and 1,559,297,220 shares |
|
674 |
|
|
5,076 |
| ||
| Retained earnings |
|
46,870 |
|
|
42,980 |
| ||
| Accumulated other comprehensive income |
|
613 |
|
|
437 |
| ||
| Other |
|
22 |
|
|
(38 |
) | ||
| |
|
|
|
|
| |||
| Total shareholders’ equity |
|
48,239 |
|
|
48,520 |
| ||
| |
|
|
|
|
| |||
| Total liabilities and shareholders’ equity |
$ |
660,008 |
|
$ |
621,764 |
| ||
| |
|
|
|
|
| |||
| (Dollars in millions, shares in thousands) |
Preferred Stock |
Common Stock |
Retained Earnings |
Accumulated Other Comprehensive Income (Loss)(1) |
Other |
Total Shareholders' Equity |
Comprehensive Income |
||||||||||||||||||||||||
| Shares |
Amount |
||||||||||||||||||||||||||||||
| Balance, December 31, 2000 |
$ |
72 |
|
1,613,632 |
|
$ |
8,613 |
|
$ |
39,815 |
|
$ |
(746 |
) |
$ |
(126 |
) |
$ |
47,628 |
|
|||||||||||
| Net income |
|
4,734 |
|
|
4,734 |
|
$ |
4,734 |
| ||||||||||||||||||||||
| Other comprehensive income, net of tax: |
|||||||||||||||||||||||||||||||
| Net unrealized gains on available-for-sale and marketable equity securities |
|
1,029 |
|
|
1,029 |
|
|
1,029 |
| ||||||||||||||||||||||
| Net unrealized losses on foreign currency translation adjustments |
|
(4 |
) |
|
(4 |
) |
|
(4 |
) | ||||||||||||||||||||||
| Net gains on derivatives |
|
1,452 |
|
|
1,452 |
|
|
1,452 |
| ||||||||||||||||||||||
| |
|
| |||||||||||||||||||||||||||||
| Comprehensive income |
$ |
7,211 |
| ||||||||||||||||||||||||||||
| |
|
| |||||||||||||||||||||||||||||
| Cash dividends: |
|||||||||||||||||||||||||||||||
| Common |
|
(2,691 |
) |
|
(2,691 |
) |
|||||||||||||||||||||||||
| Preferred |
|
(4 |
) |
|
(4 |
) |
|||||||||||||||||||||||||
| Common stock issued under employee plans |
22,096 |
|
|
830 |
|
|
73 |
|
|
903 |
|
||||||||||||||||||||
| Common stock repurchased |
(53,826 |
) |
|
(3,016 |
) |
|
(3,016 |
) |
|||||||||||||||||||||||
| Conversion of preferred stock |
|
(5 |
) |
226 |
|
|
5 |
|
|||||||||||||||||||||||
| Other |
1 |
|
|
59 |
|
|
3 |
|
|
58 |
|
|
120 |
|
|||||||||||||||||
| |
|
|
|
|
|
|
|
|
|
|
|
|
|
|
|
|
|
|
|
||||||||||||
| Balance, September 30, 2001 |
$ |
67 |
|
1,582,129 |
|
$ |
6,491 |
|
$ |
41,857 |
|
$ |
1,731 |
|
$ |
5 |
|
$ |
50,151 |
|
|||||||||||
| |
|
|
|
|
|
|
|
|
|
|
|
|
|
|
|
|
|
|
|
||||||||||||
| Balance, December 31, 2001 |
$ |
65 |
|
1,559,297 |
|
$ |
5,076 |
|
$ |
42,980 |
|
$ |
437 |
|
$ |
(38 |
) |
$ |
48,520 |
|
|||||||||||
| Net income |
|
6,635 |
|
|
6,635 |
|
$ |
6,635 |
| ||||||||||||||||||||||
| Other comprehensive income, net of tax: |
|||||||||||||||||||||||||||||||
| Net unrealized gains on available-for-sale and marketable equity securities |
|
1,256 |
|
|
1,256 |
|
|
1,256 |
| ||||||||||||||||||||||
| Net unrealized gains on foreign currency translation adjustments |
|
2 |
|
|
2 |
|
|
2 |
| ||||||||||||||||||||||
| Net losses on derivatives |
|
(1,082 |
) |
|
(1,082 |
) |
|
(1,082 |
) | ||||||||||||||||||||||
| |
|
| |||||||||||||||||||||||||||||
| Comprehensive income |
$ |
6,811 |
| ||||||||||||||||||||||||||||
| |
|
| |||||||||||||||||||||||||||||
| Cash dividends: |
|||||||||||||||||||||||||||||||
| Common |
|
(2,744 |
) |
|
(2,744 |
) |
|||||||||||||||||||||||||
| Preferred |
|
(4 |
) |
|
(4 |
) |
|||||||||||||||||||||||||
| Common stock issued under employee plans |
41,834 |
|
|
2,143 |
|
|
14 |
|
|
2,157 |
|
||||||||||||||||||||
| Common stock repurchased |
(99,200 |
) |
|
(6,798 |
) |
|
(6,798 |
) |
|||||||||||||||||||||||
| Conversion of preferred stock |
|
(5 |
) |
206 |
|
|
5 |
|
|||||||||||||||||||||||
| Other |
25 |
|
|
248 |
|
|
3 |
|
|
46 |
|
|
297 |
|
|||||||||||||||||
| |
|
|
|
|
|
|
|
|
|
|
|
|
|
|
|
|
|
|
|
||||||||||||
| Balance, September 30, 2002 |
$ |
60 |
|
1,502,162 |
|
$ |
674 |
|
$ |
46,870 |
|
$ |
613 |
|
$ |
22 |
|
$ |
48,239 |
|
|||||||||||
| |
|
|
|
|
|
|
|
|
|
|
|
|
|
|
|
|
|
|
|
||||||||||||
(1) |
At September 30, 2002 and December 31, 2001, Accumulated Other Comprehensive Income (Loss) consisted of net unrealized gains (losses) on available-for-sale
and marketable equity securities of $776 and $(480), respectively; foreign currency translation adjustments of $(169) and $(171), respectively; and net gains on derivatives of $6 and $1,088, respectively. |
| Nine Months Ended September 30 |
||||||||
| (Dollars in millions) |
2002 |
2001 |
||||||
| Operating activities |
||||||||
| Net income |
$ |
6,635 |
|
$ |
4,734 |
| ||
| Reconciliation of net income to net cash used in operating activities: |
||||||||
| Provision for credit losses |
|
2,532 |
|
|
2,886 |
| ||
| Gains on sales of securities |
|
(326 |
) |
|
(82 |
) | ||
| Business exit costs |
|
— |
|
|
1,305 |
| ||
| Depreciation and premises improvements amortization |
|
663 |
|
|
641 |
| ||
| Amortization of intangibles |
|
164 |
|
|
665 |
| ||
| Deferred income tax expense |
|
278 |
|
|
272 |
| ||
| Net increase in trading and hedging instruments |
|
(5,049 |
) |
|
(19,788 |
) | ||
| Net increase in other assets |
|
(4,153 |
) |
|
(11,412 |
) | ||
| Net increase (decrease) in accrued expenses and other liabilities |
|
(6,188 |
) |
|
16,135 |
| ||
| Other operating activities, net |
|
5,105 |
|
|
2,628 |
| ||
| |
|
|
|
|
| |||
| Net cash used in operating activities |
|
(339 |
) |
|
(2,016 |
) | ||
| |
|
|
|
|
| |||
| Investing activities |
||||||||
| Net (increase) decrease in time deposits placed and other short-term investments |
|
(465 |
) |
|
819 |
| ||
| Net (increase) decrease in federal funds sold and securities purchased under |
||||||||
| agreements to resell |
|
(12,263 |
) |
|
1,605 |
| ||
| Proceeds from sales of available-for-sale securities |
|
104,085 |
|
|
95,361 |
| ||
| Proceeds from maturities of available-for-sale securities |
|
17,191 |
|
|
5,632 |
| ||
| Purchases of available-for-sale securities |
|
(123,058 |
) |
|
(99,971 |
) | ||
| Proceeds from maturities of held-to-maturity securities |
|
39 |
|
|
40 |
| ||
| Proceeds from sales and securitizations of loans and leases |
|
20,904 |
|
|
9,874 |
| ||
| Other changes in loans and leases, net |
|
(24,581 |
) |
|
11,565 |
| ||
| Purchases and originations of mortgage banking assets |
|
(648 |
) |
|
(932 |
) | ||
| Net purchases of premises and equipment |
|
(757 |
) |
|
(580 |
) | ||
| Proceeds from sales of foreclosed properties |
|
117 |
|
|
230 |
| ||
| Acquisition of business activities |
|
(110 |
) |
|
(417 |
) | ||
| |
|
|
|
|
| |||
| Net cash provided by (used in) investing activities |
|
(19,546 |
) |
|
23,226 |
| ||
| |
|
|
|
|
| |||
| Financing activities |
||||||||
| Net increase (decrease) in deposits |
|
3,920 |
|
|
(4,374 |
) | ||
| Net increase in federal funds purchased and securities sold under |
||||||||
| agreements to repurchase |
|
14,096 |
|
|
10,428 |
| ||
| Net increase (decrease) in commercial paper and other short-term borrowings |
|
12,204 |
|
|
(19,258 |
) | ||
| Proceeds from issuance of long-term debt and trust preferred securities |
|
8,556 |
|
|
10,905 |
| ||
| Retirement of long-term debt and trust preferred securities |
|
(13,824 |
) |
|
(18,239 |
) | ||
| Proceeds from issuance of common stock |
|
2,157 |
|
|
903 |
| ||
| Common stock repurchased |
|
(6,798 |
) |
|
(3,016 |
) | ||
| Cash dividends paid |
|
(2,748 |
) |
|
(2,695 |
) | ||
| Other financing activities, net |
|
(29 |
) |
|
(77 |
) | ||
| |
|
|
|
|
| |||
| Net cash provided by (used in) financing activities |
|
17,534 |
|
|
(25,423 |
) | ||
| |
|
|
|
|
| |||
| Effect of exchange rate changes on cash and cash equivalents |
|
(17 |
) |
|
(20 |
) | ||
| |
|
|
|
|
| |||
| Net decrease in cash and cash equivalents |
|
(2,368 |
) |
|
(4,233 |
) | ||
| Cash and cash equivalents at January 1 |
|
26,837 |
|
|
27,513 |
| ||
| |
|
|
|
|
| |||
| Cash and cash equivalents at September 30 |
$ |
24,469 |
|
$ |
23,280 |
| ||
| |
|
|
|
|
| |||
| Three Months Ended September 30 |
Nine Months Ended September 30 | |||||||||||
| (Dollars in millions) |
2002 |
2001 |
2002 |
2001 | ||||||||
| Trading account profits — as reported |
$ |
71 |
$ |
433 |
$ |
679 |
$ |
1,508 | ||||
| Trading-related net interest income (1) |
|
485 |
|
417 |
|
1,387 |
|
1,182 | ||||
| |
|
|
|
|
|
|
| |||||
| Total trading-related revenue |
$ |
556 |
$ |
850 |
$ |
2,066 |
$ |
2,690 | ||||
| |
|
|
|
|
|
|
| |||||
| Trading-related revenue by product |
||||||||||||
| Foreign exchange |
$ |
126 |
$ |
138 |
$ |
389 |
$ |
419 | ||||
| Interest rate |
|
96 |
|
229 |
|
585 |
|
608 | ||||
| Credit (2) |
|
255 |
|
267 |
|
717 |
|
768 | ||||
| Equities |
|
77 |
|
190 |
|
318 |
|
743 | ||||
| Commodities |
|
2 |
|
26 |
|
57 |
|
152 | ||||
| |
|
|
|
|
|
|
| |||||
| Total trading-related revenue |
$ |
556 |
$ |
850 |
$ |
2,066 |
$ |
2,690 | ||||
| |
|
|
|
|
|
|
| |||||
| (1) Presented on a taxable-equivalent basis.
| ||||||||||||
| (2) Credit includes fixed income and credit default swaps and hedges of credit
exposure. | ||||||||||||
| (Dollars in millions) |
September 30 2002 |
December 31 2001 | ||||
| Trading account assets |
||||||
| U.S. Government & Agency securities |
$ |
17,705 |
$ |
15,009 | ||
| Foreign sovereign debt |
|
8,613 |
|
6,809 | ||
| Corporate & other debt securities |
|
11,366 |
|
11,596 | ||
| Equity securities |
|
4,725 |
|
2,976 | ||
| Mortgage-backed securities |
|
4,991 |
|
3,070 | ||
| Other |
|
9,507 |
|
7,884 | ||
| |
|
|
| |||
| Total |
$ |
56,907 |
$ |
47,344 | ||
| |
|
|
| |||
| Trading account liabilities |
||||||
| U.S. Government & Agency securities |
$ |
12,940 |
$ |
4,121 | ||
| Foreign sovereign debt |
|
2,255 |
|
3,096 | ||
| Corporate & other debt securities |
|
2,683 |
|
1,501 | ||
| Equity securities |
|
3,151 |
|
6,151 | ||
| Other |
|
5,002 |
|
4,583 | ||
| |
|
|
| |||
| Total |
$ |
26,031 |
$ |
19,452 | ||
| |
|
|
| |||
| Derivatives(1) |
||||||||||||
| September 30, 2002 |
December 31, 2001 | |||||||||||
| (Dollars in millions) |
Contract/ Notional |
Credit Risk |
Contract/ Notional |
Credit Risk | ||||||||
| Interest rate contracts |
||||||||||||
| Swaps |
$ |
6,219,606 |
$ |
18,249 |
$ |
5,267,608 |
$ |
9,550 | ||||
| Futures and forwards |
|
2,517,913 |
|
416 |
|
1,663,109 |
|
67 | ||||
| Written options |
|
985,494 |
|
— |
|
678,242 |
|
— | ||||
| Purchased options |
|
855,444 |
|
3,406 |
|
704,159 |
|
2,165 | ||||
| Foreign exchange contracts |
||||||||||||
| Swaps |
|
166,708 |
|
2,342 |
|
140,778 |
|
2,274 | ||||
| Spot, futures and forwards |
|
689,154 |
|
1,676 |
|
654,026 |
|
2,496 | ||||
| Written options |
|
74,184 |
|
— |
|
57,963 |
|
— | ||||
| Purchased options |
|
72,608 |
|
392 |
|
55,050 |
|
496 | ||||
| Equity contracts |
||||||||||||
| Swaps |
|
14,905 |
|
999 |
|
14,504 |
|
562 | ||||
| Futures and forwards |
|
81,379 |
|
— |
|
46,970 |
|
44 | ||||
| Written options |
|
22,481 |
|
— |
|
21,009 |
|
— | ||||
| Purchased options |
|
26,670 |
|
2,673 |
|
28,902 |
|
2,511 | ||||
| Commodity contracts |
||||||||||||
| Swaps |
|
11,515 |
|
1,029 |
|
6,600 |
|
1,152 | ||||
| Futures and forwards |
|
4,393 |
|
— |
|
2,176 |
|
— | ||||
| Written options |
|
18,390 |
|
— |
|
8,231 |
|
— | ||||
| Purchased options |
|
23,907 |
|
351 |
|
8,219 |
|
199 | ||||
| Credit derivatives |
|
82,399 |
|
1,305 |
|
57,182 |
|
631 | ||||
| |
|
|
|
|
|
|
| |||||
| Net replacement cost |
$ |
32,838 |
$ |
22,147 | ||||||||
| |
|
|
| |||||||||
| (1) Includes both long and short derivative positions. |
||||||||||||
| Outstanding loans and leases at September 30, 2002 and December 31, 2001 were: | ||||||||||||
| September 30, 2002 |
December 31, 2001 |
|||||||||||
| (Dollars in millions) |
Amount |
Percent |
Amount |
Percent |
||||||||
| Commercial — domestic |
$ |
105,240 |
30.8 |
% |
$ |
118,205 |
35.9 |
% | ||||
| Commercial — foreign |
|
20,677 |
6.1 |
|
|
23,039 |
7.0 |
| ||||
| Commercial real estate — domestic |
|
20,707 |
6.1 |
|
|
22,271 |
6.8 |
| ||||
| Commercial real estate — foreign |
|
447 |
0.1 |
|
|
383 |
0.1 |
| ||||
| |
|
|
|
|
|
|
| |||||
| Total commercial |
|
147,071 |
43.1 |
|
|
163,898 |
49.8 |
| ||||
| |
|
|
|
|
|
|
| |||||
| Residential mortgage |
|
105,617 |
31.0 |
|
|
78,203 |
23.8 |
| ||||
| Home equity lines |
|
23,464 |
6.9 |
|
|
22,107 |
6.7 |
| ||||
| Direct/Indirect consumer |
|
30,417 |
8.9 |
|
|
30,317 |
9.2 |
| ||||
| Consumer finance |
|
9,495 |
2.8 |
|
|
12,652 |
3.9 |
| ||||
| Bankcard |
|
23,062 |
6.8 |
|
|
19,884 |
6.0 |
| ||||
| Foreign consumer |
|
1,965 |
0.5 |
|
|
2,092 |
0.6 |
| ||||
| |
|
|
|
|
|
|
| |||||
| Total consumer |
|
194,020 |
56.9 |
|
|
165,255 |
50.2 |
| ||||
| |
|
|
|
|
|
|
| |||||
| Total outstanding loans and leases |
$ |
341,091 |
100.0 |
% |
$ |
329,153 |
100.0 |
% | ||||
| |
|
|
|
|
|
|
| |||||
| Three Moths Ended September 30 |
Nine Months Ended September 30 |
|||||||||||||||
| (Dollars in millions) |
2002 |
2001 |
2002 |
2001 |
||||||||||||
| Balance, beginning of period |
$ |
6,873 |
|
$ |
6,911 |
|
$ |
6,875 |
|
$ |
6,838 |
| ||||
| |
|
|
|
|
|
|
|
|
|
|
| |||||
| Loans and leases charged off |
|
(1,002 |
) |
|
(1,654 |
) |
|
(3,147 |
) |
|
(3,523 |
) | ||||
| Recoveries of loans and leases previously charged off |
|
198 |
|
|
163 |
|
|
615 |
|
|
473 |
| ||||
| |
|
|
|
|
|
|
|
|
|
|
| |||||
| Net charge-offs |
|
(804 |
) |
|
(1,491 |
) |
|
(2,532 |
) |
|
(3,050 |
) | ||||
| |
|
|
|
|
|
|
|
|
|
|
| |||||
| Provision for credit losses |
|
804 |
|
|
1,251 |
|
|
2,532 |
|
|
2,886 |
| ||||
| Other, net |
|
(12 |
) |
|
(6 |
) |
|
(14 |
) |
|
(9 |
) | ||||
| |
|
|
|
|
|
|
|
|
|
|
| |||||
| Balance, September 30 |
$ |
6,861 |
|
$ |
6,665 |
|
$ |
6,861 |
|
$ |
6,665 |
| ||||
| |
|
|
|
|
|
|
|
|
|
|
| |||||
| (Dollars in millions) |
September 30, 2002 |
December 31, 2001 | ||||
| Commercial — domestic |
$ |
2,991 |
$ |
3,138 | ||
| Commercial — foreign |
|
882 |
|
501 | ||
| Commercial real estate — domestic |
|
214 |
|
240 | ||
| Commercial real estate — foreign |
|
2 |
|
— | ||
| |
|
|
| |||
| Total impaired loans |
$ |
4,089 |
$ |
3,879 | ||
| |
|
|
| |||
| (Dollars in millions) |
Total Corporation |
Consumer and Commercial Banking |
Asset Management |
Global Corporate and Investment Banking |
Equity Investments | |||||||||||||
| Balance, January 1, 2002 |
$ |
10,854 |
|
$ |
7,726 |
$ |
943 |
|
$ |
2,051 |
|
$ |
134 | |||||
| |
|
|
|
|
|
|
|
|
|
|
|
| ||||||
| Goodwill additions |
|
550 |
|
|
— |
|
550 |
|
|
— |
|
|
— | |||||
| Other(1) |
|
(15 |
) |
|
— |
|
(1 |
) |
|
(14 |
) |
|
— | |||||
| |
|
|
|
|
|
|
|
|
|
|
|
| ||||||
| Balance, September 30, 2002 |
$ |
11,389 |
|
$ |
7,726 |
$ |
1,492 |
|
$ |
2,037 |
|
$ |
134 | |||||
| |
|
|
|
|
|
|
|
|
|
|
|
| ||||||
(1) |
Includes certain other reclassifications. |
| September 30, 2002 |
December 31, 2001 | |||||||||||
| (Dollars in millions) |
Gross Carrying Value |
Accumulated Amortization |
Gross Carrying Value
|
Accumulated Amortization
| ||||||||
| Core deposits |
$ |
1,495 |
$ |
686 |
$ |
1,495 |
$ |
566 | ||||
| Other intangibles |
|
735 |
|
417 |
|
730 |
|
365 | ||||
| |
|
|
|
|
|
|
| |||||
| Total core deposits and other intangibles |
$ |
2,230 |
$ |
1,103 |
$ |
2,225 |
$ |
931 | ||||
| |
|
|
|
|
|
|
| |||||
| (Dollars in millions) |
September 30 2002 |
December 31 2001 | ||||
| Loan commitments |
$ |
220,477 |
$ |
221,529 | ||
| Standby letters of credit and financial guarantees |
|
31,179 |
|
32,416 | ||
| Commercial letters of credit |
|
3,970 |
|
3,581 | ||
| |
|
|
| |||
| Legally binding commitments |
$ |
255,626 |
$ |
257,526 | ||
| |
|
|
| |||
| Credit card lines |
$ |
73,120 |
$ |
73,644 | ||
| |
|
|
| |||
| Total commitments |
$ |
328,746 |
$ |
331,170 | ||
| |
|
|
| |||
| Three Months Ended September 30 |
Nine Months Ended September 30 |
|||||||||||||||
| (Dollars in millions, except per share information; shares in thousands) |
2002 |
2001 |
2002 |
2001 |
||||||||||||
| Earnings per common share |
||||||||||||||||
| Net income |
$ |
2,235 |
|
$ |
841 |
|
$ |
6,635 |
|
$ |
4,734 |
| ||||
| Preferred stock dividends |
|
(2 |
) |
|
(2 |
) |
|
(4 |
) |
|
(4 |
) | ||||
| |
|
|
|
|
|
|
|
|
|
|
| |||||
| Net income available to common shareholders |
$ |
2,233 |
|
$ |
839 |
|
$ |
6,631 |
|
$ |
4,730 |
| ||||
| |
|
|
|
|
|
|
|
|
|
|
| |||||
| Average common shares issued and outstanding |
|
1,504,017 |
|
|
1,599,692 |
|
|
1,526,946 |
|
|
1,603,340 |
| ||||
| |
|
|
|
|
|
|
|
|
|
|
| |||||
| Earnings per common share |
$ |
1.49 |
|
$ |
0.52 |
|
$ |
4.34 |
|
$ |
2.95 |
| ||||
| |
|
|
|
|
|
|
|
|
|
|
| |||||
| Diluted earnings per common share |
||||||||||||||||
| Net income available to common shareholders |
$ |
2,233 |
|
$ |
839 |
|
$ |
6,631 |
|
$ |
4,730 |
| ||||
| Preferred stock dividends |
|
2 |
|
|
2 |
|
|
4 |
|
|
4 |
| ||||
| |
|
|
|
|
|
|
|
|
|
|
| |||||
| Net income available to common shareholders and assumed conversions |
$ |
2,235 |
|
$ |
841 |
|
$ |
6,635 |
|
$ |
4,734 |
| ||||
| |
|
|
|
|
|
|
|
|
|
|
| |||||
| Average common shares issued and outstanding |
|
1,504,017 |
|
|
1,599,692 |
|
|
1,526,946 |
|
|
1,603,340 |
| ||||
| |
|
|
|
|
|
|
|
|
|
|
| |||||
| Incremental shares from assumed conversions: |
||||||||||||||||
| Convertible preferred stock |
|
2,346 |
|
|
2,633 |
|
|
2,415 |
|
|
2,705 |
| ||||
| Stock options |
|
39,984 |
|
|
31,738 |
|
|
43,842 |
|
|
26,883 |
| ||||
| |
|
|
|
|
|
|
|
|
|
|
| |||||
| Dilutive potential common shares(1) |
|
42,330 |
|
|
34,371 |
|
|
46,257 |
|
|
29,588 |
| ||||
| |
|
|
|
|
|
|
|
|
|
|
| |||||
| Total diluted average common shares issued and outstanding |
|
1,546,347 |
|
|
1,634,063 |
|
|
1,573,203 |
|
|
1,632,928 |
| ||||
| |
|
|
|
|
|
|
|
|
|
|
| |||||
| Diluted earnings per common share |
$ |
1.45 |
|
$ |
0.51 |
|
$ |
4.22 |
|
$ |
2.90 |
| ||||
| |
|
|
|
|
|
|
|
|
|
|
| |||||
(1) |
For the three months and nine months ended September 30, 2002, average options to purchase 23 million and 22 million shares, respectively, were outstanding
but not included in the computation of earnings per share because they were antidilutive. For the three months and nine months ended September 30, 2001, average options to purchase 43 million and 87 million shares, respectively, were outstanding but
not included in the computation of earnings per share because they were antidilutive. |
| Three Months Ended September 30 |
Nine Months Ended September 30 |
|||||||||||||||
| (Dollars in millions) |
2002 |
2001 |
2002 |
2001 |
||||||||||||
| Segments’ net income |
$ |
1,920 |
|
$ |
1,841 |
|
$ |
5,970 |
|
$ |
5,589 |
| ||||
| Adjustments, net of taxes: |
||||||||||||||||
| Earnings associated with unassigned capital |
|
94 |
|
|
38 |
|
|
300 |
|
|
151 |
| ||||
| Asset/liability management mortgage portfolio |
|
165 |
|
|
89 |
|
|
273 |
|
|
224 |
| ||||
| Liquidating businesses |
|
(1 |
) |
|
48 |
|
|
20 |
|
|
82 |
| ||||
| SFAS 133 transition adjustment net loss |
|
— |
|
|
— |
|
|
— |
|
|
(68 |
) | ||||
| Provision for credit losses in excess of net charge-offs |
|
— |
|
|
— |
|
|
— |
|
|
(49 |
) | ||||
| Gains on sales of securities |
|
137 |
|
|
67 |
|
|
234 |
|
|
70 |
| ||||
| Exit charges |
|
— |
|
|
(1,250 |
) |
|
— |
|
|
(1,250 |
) | ||||
| Other |
|
(80 |
) |
|
8 |
|
|
(162 |
) |
|
(15 |
) | ||||
| |
|
|
|
|
|
|
|
|
|
|
| |||||
| Consolidated net income |
$ |
2,235 |
|
$ |
841 |
|
$ |
6,635 |
|
$ |
4,734 |
| ||||
| |
|
|
|
|
|
|
|
|
|
|
| |||||
• |
Net income totaled $6.6 billion, or $4.22 per common share (diluted), compared to $4.7 billion, or $2.90 per common share (diluted). The return on average
common shareholders’ equity was 18.71 percent. Net income for the three months ended September 30, 2002 totaled $2.2 billion, or $1.45 per common share (diluted), compared to $841 million, or $0.51 per common share (diluted) for the three
months ended September 30, 2001. The return on average common shareholders’ equity was 19.02 percent. As a result of the adoption of Statement of Financial Accounting Standards No. 142, “Goodwill and Other Intangible Assets” on
January 1, 2002, the Corporation no longer amortizes goodwill. The impact of goodwill amortization on net income was $467 million or $0.29 per share (diluted) for the nine months ended September 30, 2001 and $153 million or $0.09 per share (diluted)
for the three months ended September 30, 2001. Prior year results also included $1.25 billion of after-tax business exit charges in the third quarter of 2001, which impacted diluted earnings per share by $0.77 and $0.76 for the three months and nine
months ended September 30, 2001, respectively. |
• |
Total revenue includes net interest income and noninterest income. Total revenue was $25.7 billion, a decrease of $133 million. |
• |
Net interest income increased $676 million to $15.5 billion. The increase was driven by the net impact of higher discretionary portfolio levels and interest
rate changes, higher levels of core deposit funding, consumer loan growth, losses associated with auto lease financing in 2001 and the margin impact of higher trading-related activities, partially offset by the securitization of subprime real estate
loans and reduced commercial loan levels. |
• |
Noninterest income was $10.1 billion, an $809 million decrease. This decrease was primarily due to a sharp decline in trading account profits and higher equity
investment impairment charges, partially offset by increases in service charges, investment and brokerage services, mortgage banking income and card income. |
• |
The provision for credit losses decreased $354 million to $2.5 billion, primarily due to $395 million in 2001 associated with exiting the subprime real estate
lending business. Net charge-offs were $2.5 billion, or 1.01 percent of average loans and leases, a decrease of seven basis points. The decrease in net charge-offs of $518 million was primarily due to $635 million of charge-offs in 2001 related to
exiting the subprime real estate lending business and decreases in commercial — domestic and consumer finance net charge-offs, partially offset by increases in bankcard and commercial — foreign net charge-offs.
|
• |
Nonperforming assets were $5.1 billion, or 1.50 percent of loans, leases and foreclosed properties at September 30, 2002, a $223 million increase from December
31, 2001. Nonperforming assets continued to be affected by the weakened economic environment. The allowance for credit losses totaled $6.9 billion, or 2.01 percent of total loans and leases, at September 30, 2002 compared to 2.09 percent at December
31, 2001. |
• |
Noninterest expense was $13.6 billion, a decrease of $1.8 billion. Excluding goodwill amortization of $502 million in 2001, noninterest expense declined $1.3
billion, or nine percent, in 2002 compared to the prior year, primarily due to $1.30 billion of business exit costs in 2001 and reductions in professional fees, partially offset by increased data processing expense. |
| Three Months Ended September 30 |
Nine Months Ended September 30 |
|||||||||||||||
| (Dollars in millions, except per share information) |
2002 |
2001 |
2002 |
2001 |
||||||||||||
| Income statement |
||||||||||||||||
| Net interest income |
$ |
5,302 |
|
$ |
5,204 |
|
$ |
15,549 |
|
$ |
14,873 |
| ||||
| Noninterest income |
|
3,220 |
|
|
3,429 |
|
|
10,141 |
|
|
10,950 |
| ||||
| Total revenue |
|
8,522 |
|
|
8,633 |
|
|
25,690 |
|
|
25,823 |
| ||||
| Provision for credit losses |
|
804 |
|
|
1,251 |
|
|
2,532 |
|
|
2,886 |
| ||||
| Gains on sales of securities |
|
189 |
|
|
97 |
|
|
326 |
|
|
82 |
| ||||
| Noninterest expense |
|
4,620 |
|
|
5,911 |
|
|
13,604 |
|
|
15,386 |
| ||||
| Income before income taxes |
|
3,287 |
|
|
1,568 |
|
|
9,880 |
|
|
7,633 |
| ||||
| Income tax expense |
|
1,052 |
|
|
727 |
|
|
3,245 |
|
|
2,899 |
| ||||
| Net income |
|
2,235 |
|
|
841 |
|
|
6,635 |
|
|
4,734 |
| ||||
| Average common shares issued and outstanding (in thousands) |
|
1,504,017 |
|
|
1,599,692 |
|
|
1,526,946 |
|
|
1,603,340 |
| ||||
| Average diluted common shares issued and outstanding (in thousands) |
|
1,546,347 |
|
|
1,634,063 |
|
|
1,573,203 |
|
|
1,632,928 |
| ||||
| |
|
|
|
|
|
|
|
|
|
|
| |||||
| Performance ratios |
||||||||||||||||
| Return on average assets |
|
1.33 |
% |
|
0.52 |
% |
|
1.36 |
% |
|
0.98 |
% | ||||
| Return on average common shareholders' equity |
|
19.02 |
|
|
6.78 |
|
|
18.71 |
|
|
13.03 |
| ||||
| Efficiency ratio (taxable-equivalent basis) |
|
53.19 |
|
|
67.79 |
|
|
52.09 |
|
|
59.00 |
| ||||
| Total equity to total assets (period end) |
|
7.31 |
|
|
7.83 |
|
|
7.31 |
|
|
7.83 |
| ||||
| Total average equity to total average assets |
|
6.97 |
|
|
7.66 |
|
|
7.29 |
|
|
7.49 |
| ||||
| Dividend payout ratio |
|
40.25 |
|
|
106.49 |
|
|
41.37 |
|
|
56.88 |
| ||||
| |
|
|
|
|
|
|
|
|
|
|
| |||||
| Per common share data |
||||||||||||||||
| Earnings |
$ |
1.49 |
|
$ |
0.52 |
|
$ |
4.34 |
|
$ |
2.95 |
| ||||
| Diluted earnings |
|
1.45 |
|
|
0.51 |
|
|
4.22 |
|
|
2.90 |
| ||||
| Cash dividends paid |
|
0.60 |
|
|
0.56 |
|
|
1.80 |
|
|
1.68 |
| ||||
| Book value |
|
32.07 |
|
|
31.66 |
|
|
32.07 |
|
|
31.66 |
| ||||
| |
|
|
|
|
|
|
|
|
|
|
| |||||
| Average balance sheet |
||||||||||||||||
| Total loans and leases |
$ |
340,484 |
|
$ |
357,726 |
|
$ |
334,703 |
|
$ |
376,261 |
| ||||
| Total assets |
|
669,149 |
|
|
642,184 |
|
|
651,257 |
|
|
648,789 |
| ||||
| Core deposits |
|
331,761 |
|
|
306,766 |
|
|
326,535 |
|
|
303,303 |
| ||||
| Total deposits |
|
373,933 |
|
|
363,328 |
|
|
368,142 |
|
|
360,793 |
| ||||
| Common shareholders' equity |
|
46,592 |
|
|
49,134 |
|
|
47,396 |
|
|
48,528 |
| ||||
| Total shareholders' equity |
|
46,652 |
|
|
49,202 |
|
|
47,457 |
|
|
48,597 |
| ||||
| |
|
|
|
|
|
|
|
|
|
|
| |||||
| Risk-based capital ratios (period end) |
||||||||||||||||
| Tier 1 capital |
|
8.13 |
% |
|
7.95 |
% |
|
8.13 |
% |
|
7.95 |
% | ||||
| Total capital |
|
12.38 |
|
|
12.12 |
|
|
12.38 |
|
|
12.12 |
| ||||
| Leverage ratio |
|
6.35 |
|
|
6.59 |
|
|
6.35 |
|
|
6.59 |
| ||||
| |
|
|
|
|
|
|
|
|
|
|
| |||||
| Market price per share of common stock |
||||||||||||||||
| Closing |
$ |
63.80 |
|
$ |
58.40 |
|
$ |
63.80 |
|
$ |
58.40 |
| ||||
| High |
|
71.94 |
|
|
65.54 |
|
|
77.08 |
|
|
65.54 |
| ||||
| Low |
|
57.90 |
|
|
50.25 |
|
|
57.51 |
|
|
45.00 |
| ||||
| |
|
|
|
|
|
|
|
|
|
|
| |||||
(1) |
As a result of the adoption of SFAS 142 on January 1, 2002, the Corporation no longer amortizes goodwill. Goodwill amortization expense for the three months
and nine months ended September 30, 2001 was $165 million and $502 million, respectively. The impact on net income was $153 million or $0.09 per share (diluted) for the three months ended September 30, 2001. The impact on net income was $467 million
or $0.29 per share (diluted) for the nine months ended September 30, 2001. |
| Three Months Ended September 30 |
Nine Months Ended September 30 |
|||||||||||||||
| (Dollars in millions, except per share information) |
2002 |
2001 |
2002 |
2001 |
||||||||||||
| Performance metrics—excludes nonrecurring charges(1,2) |
||||||||||||||||
| Earnings excluding nonrecurring charges |
$ |
2,235 |
|
$ |
2,091 |
|
$ |
6,635 |
|
$ |
5,984 |
| ||||
| Earnings excluding nonrecurring charges per common share |
|
1.49 |
|
|
1.31 |
|
|
4.34 |
|
|
3.73 |
| ||||
| Diluted earnings excluding nonrecurring charges per common share |
|
1.45 |
|
|
1.28 |
|
|
4.22 |
|
|
3.66 |
| ||||
| Shareholder value added |
|
880 |
|
|
824 |
|
|
2,546 |
|
|
2,293 |
| ||||
| Return on average assets |
|
1.33 |
% |
|
1.29 |
% |
|
1.36 |
% |
|
1.23 |
% | ||||
| Return on average common shareholders' equity |
|
19.02 |
|
|
16.87 |
|
|
18.71 |
|
|
16.48 |
| ||||
| Efficiency ratio (taxable-equivalent basis) |
|
53.19 |
|
|
52.82 |
|
|
52.09 |
|
|
53.99 |
| ||||
| Dividend payout ratio |
|
40.25 |
|
|
42.79 |
|
|
41.37 |
|
|
44.99 |
| ||||
| |
|
|
|
|
|
|
|
|
|
|
| |||||
| Taxable-equivalent basis data |
||||||||||||||||
| Net interest income |
$ |
5,465 |
|
$ |
5,290 |
|
$ |
15,974 |
|
$ |
15,128 |
| ||||
| Total revenue |
|
8,685 |
|
|
8,719 |
|
|
26,115 |
|
|
26,078 |
| ||||
| Net interest yield |
|
3.75 |
% |
|
3.78 |
% |
|
3.78 |
% |
|
3.59 |
% | ||||
| |
|
|
|
|
|
|
|
|
|
|
| |||||
(1) |
Nonrecurring charges represent provision for credit losses of $395 million and noninterest expense of $1.3 billion, both of which are related to the exit of
certain consumer finance businesses in the third quarter of 2001. Noninterest expense charges consisted of goodwill write-offs, auto lease residual charges, real estate servicing asset charges and other transaction costs. The impact of business exit
charges on net income was $1.25 billion. The impact on diluted earnings per share was $0.77 and $0.76 for the three months and nine months ended September 30, 2001, respectively. The Corporation defines nonrecurring charges as charges associated
with events that are not reasonably expected to recur in the foreseeable future. |
(2) |
The three months ended September 30, 2001 included goodwill amortization of $165 million. The impact on net income was $153 million, or $0.09 per share
(diluted). The nine months ended September 30, 2001 included goodwill amortization of $502 million. The impact on net income was $467 million, or $0.29 per share (diluted). |
| Three Months Ended September
30 |
Increase/ (Decrease) |
Nine Months Ended September
30 |
Increase/ (Decrease) |
|||||||||||||||||||
| (Dollars in millions) |
2002 |
2001 |
2002 |
2001 |
||||||||||||||||||
| Net interest income |
||||||||||||||||||||||
| As reported(1) |
$ |
5,465 |
|
$ |
5,290 |
|
3.3 |
% |
$ |
15,974 |
|
$ |
15,128 |
|
5.6 |
% | ||||||
| Less: Trading-related net interest income |
|
(485 |
) |
|
(417 |
) |
|
(1,387 |
) |
|
(1,182 |
) |
||||||||||
| Add: Impact of revolving securitizations |
|
112 |
|
|
172 |
|
|
412 |
|
|
529 |
|
||||||||||
| |
|
|
|
|
|
|
|
|
|
|
|
|
|
|
| |||||||
| Core net interest income |
$ |
5,092 |
|
$ |
5,045 |
|
0.9 |
% |
$ |
14,999 |
|
$ |
14,475 |
|
3.6 |
% | ||||||
| |
|
|
|
|
|
|
|
|
|
|
|
|
|
|
| |||||||
| Average earning assets |
||||||||||||||||||||||
| As reported |
$ |
580,248 |
|
$ |
557,108 |
|
4.2 |
% |
$ |
563,964 |
|
$ |
562,038 |
|
0.3 |
% | ||||||
| Less: Trading-related earning assets |
|
(126,280 |
) |
|
(105,953 |
) |
|
(121,307 |
) |
|
(101,305 |
) |
||||||||||
| Add: Impact of revolving securitizations |
|
5,276 |
|
|
9,809 |
|
|
6,743 |
|
|
10,335 |
|
||||||||||
| |
|
|
|
|
|
|
|
|
|
|
|
|
|
|
| |||||||
| Core average earning assets |
$ |
459,244 |
|
$ |
460,964 |
|
(0.4 |
)% |
$ |
449,400 |
|
$ |
471,068 |
|
(4.6 |
)% | ||||||
| |
|
|
|
|
|
|
|
|
|
|
|
|
|
|
| |||||||
| Net interest yield on earning assets(1,2) |
||||||||||||||||||||||
| As reported |
|
3.75 |
% |
|
3.78 |
% |
(3 |
)bps |
|
3.78 |
% |
|
3.59 |
% |
19 |
bps | ||||||
| Add: Impact of trading-related activities |
|
0.62 |
|
|
0.52 |
|
10 |
|
|
0.62 |
|
|
0.45 |
|
17 |
| ||||||
| Add: Impact of revolving securitizations |
|
0.04 |
|
|
0.06 |
|
(2 |
) |
|
0.05 |
|
|
0.06 |
|
(1 |
) | ||||||
| |
|
|
|
|
|
|
|
|
|
|
|
|
|
|
| |||||||
| Core net interest yield on earning assets |
|
4.41 |
% |
|
4.36 |
% |
5 |
bps |
|
4.45 |
% |
|
4.10 |
% |
35 |
bps | ||||||
| |
|
|
|
|
|
|
|
|
|
|
|
|
|
|
| |||||||
(1) |
Net interest income is presented on a taxable-equivalent basis. |
(2) |
Bps denotes basis points; 100 bps equals 1%. |
| Third Quarter 2002 |
Second Quarter 2002 |
|||||||||||||||||
| (Dollars in millions) |
Average Balance |
Interest Income/ Expense |
Yield/ Rate |
Average Balance |
Interest Income/ Expense |
Yield/ Rate |
||||||||||||
| Earning assets |
||||||||||||||||||
| Time deposits placed and other short-term investments |
$ |
10,396 |
$ |
63 |
2.41 |
% |
$ |
10,673 |
$ |
63 |
2.37 |
% | ||||||
| Federal funds sold and securities purchased under agreements to resell |
|
40,294 |
|
178 |
1.76 |
|
|
48,426 |
|
270 |
2.23 |
| ||||||
| Trading account assets |
|
85,129 |
|
1,017 |
4.76 |
|
|
78,113 |
|
961 |
4.93 |
| ||||||
| Securities(1) |
|
76,484 |
|
1,120 |
5.85 |
|
|
67,291 |
|
939 |
5.59 |
| ||||||
| Loans and leases(2): |
||||||||||||||||||
| Commercial — domestic |
|
106,039 |
|
1,728 |
6.47 |
|
|
111,522 |
|
1,887 |
6.78 |
| ||||||
| Commercial — foreign |
|
21,256 |
|
206 |
3.85 |
|
|
21,454 |
|
212 |
3.97 |
| ||||||
| Commercial real estate — domestic |
|
20,576 |
|
265 |
5.10 |
|
|
21,486 |
|
258 |
4.83 |
| ||||||
| Commercial real estate — foreign |
|
425 |
|
4 |
3.92 |
|
|
393 |
|
5 |
5.14 |
| ||||||
| |
|
|
|
|
|
|
|
|
|
|
| |||||||
| Total commercial |
|
148,296 |
|
2,203 |
5.90 |
|
|
154,855 |
|
2,362 |
6.12 |
| ||||||
| |
|
|
|
|
|
|
|
|
|
|
| |||||||
| Residential mortgage |
|
104,590 |
|
1,733 |
6.61 |
|
|
94,726 |
|
1,602 |
6.77 |
| ||||||
| Home equity lines |
|
23,275 |
|
314 |
5.35 |
|
|
22,579 |
|
305 |
5.41 |
| ||||||
| Direct/Indirect consumer |
|
30,029 |
|
530 |
7.01 |
|
|
30,021 |
|
542 |
7.25 |
| ||||||
| Consumer finance |
|
10,043 |
|
201 |
7.97 |
|
|
11,053 |
|
226 |
8.20 |
| ||||||
| Bankcard |
|
22,263 |
|
583 |
10.38 |
|
|
20,402 |
|
510 |
10.01 |
| ||||||
| Foreign consumer |
|
1,988 |
|
19 |
3.83 |
|
|
2,048 |
|
19 |
3.71 |
| ||||||
| |
|
|
|
|
|
|
|
|
|
|
| |||||||
| Total consumer |
|
192,188 |
|
3,380 |
7.00 |
|
|
180,829 |
|
3,204 |
7.10 |
| ||||||
| |
|
|
|
|
|
|
|
|
|
|
| |||||||
| Total loans and leases |
|
340,484 |
|
5,583 |
6.52 |
|
|
335,684 |
|
5,566 |
6.65 |
| ||||||
| |
|
|
|
|
|
|
|
|
|
|
| |||||||
| Other earning assets |
|
27,461 |
|
387 |
5.61 |
|
|
22,005 |
|
353 |
6.42 |
| ||||||
| |
|
|
|
|
|
|
|
|
|
|
| |||||||
| Total earning assets(3) |
|
580,248 |
|
8,348 |
5.73 |
|
|
562,192 |
|
8,152 |
5.81 |
| ||||||
| |
|
|
|
|
|
|
|
|
|
|
| |||||||
| Cash and cash equivalents |
|
20,202 |
|
21,200 |
||||||||||||||
| Other assets, less allowance for credit losses |
|
68,699 |
|
63,207 |
||||||||||||||
| |
|
|
|
|
|
|
|
|
|
|
| |||||||
| Total assets |
$ |
669,149 |
$ |
646,599 |
||||||||||||||
| |
|
|
|
|
|
|
|
|
|
|
| |||||||
| Interest-bearing liabilities |
||||||||||||||||||
| Domestic interest-bearing deposits: |
||||||||||||||||||
| Savings |
$ |
22,047 |
$ |
36 |
0.64 |
% |
$ |
21,841 |
$ |
34 |
0.64 |
% | ||||||
| NOW and money market deposit accounts |
|
132,939 |
|
362 |
1.08 |
|
|
129,856 |
|
346 |
1.07 |
| ||||||
| Consumer CDs and IRAs |
|
67,179 |
|
746 |
4.40 |
|
|
68,015 |
|
764 |
4.51 |
| ||||||
| Negotiable CDs, public funds and other time deposits |
|
4,254 |
|
51 |
4.73 |
|
|
4,635 |
|
30 |
2.43 |
| ||||||
| |
|
|
|
|
|
|
|
|
|
|
| |||||||
| Total domestic interest-bearing deposits |
|
226,419 |
|
1,195 |
2.09 |
|
|
224,347 |
|
1,174 |
2.10 |
| ||||||
| |
|
|
|
|
|
|
|
|
|
|
| |||||||
| Foreign interest-bearing deposits(4): |
||||||||||||||||||
| Banks located in foreign countries |
|
17,044 |
|
123 |
2.85 |
|
|
14,048 |
|
108 |
3.10 |
| ||||||
| Governments and official institutions |
|
2,188 |
|
10 |
1.85 |
|
|
2,449 |
|
12 |
1.89 |
| ||||||
| Time, savings and other |
|
18,686 |
|
86 |
1.83 |
|
|
18,860 |
|
90 |
1.91 |
| ||||||
| |
|
|
|
|
|
|
|
|
|
|
| |||||||
| Total foreign interest-bearing deposits |
|
37,918 |
|
219 |
2.29 |
|
|
35,357 |
|
210 |
2.38 |
| ||||||
| |
|
|
|
|
|
|
|
|
|
|
| |||||||
| Total interest-bearing deposits |
|
264,337 |
|
1,414 |
2.12 |
|
|
259,704 |
|
1,384 |
2.14 |
| ||||||
| |
|
|
|
|
|
|
|
|
|
|
| |||||||
| Federal funds purchased, securities sold under agreements to repurchase and other short-term borrowings
|
|
108,281 |
|
526 |
1.93 |
|
|
97,579 |
|
529 |
2.17 |
| ||||||
| Trading account liabilities |
|
33,038 |
|
342 |
4.11 |
|
|
31,841 |
|
344 |
4.34 |
| ||||||
| Long-term debt and trust preferred securities |
|
64,880 |
|
601 |
3.71 |
|
|
65,940 |
|
633 |
3.84 |
| ||||||
| |
|
|
|
|
|
|
|
|
|
|
| |||||||
| Total interest-bearing liabilities(3) |
|
470,536 |
|
2,883 |
2.44 |
|
|
455,064 |
|
2,890 |
2.55 |
| ||||||
| |
|
|
|
|
|
|
|
|
|
|
| |||||||
| Noninterest-bearing sources: |
||||||||||||||||||
| Noninterest-bearing deposits |
|
109,596 |
|
106,282 |
||||||||||||||
| Other liabilities |
|
42,365 |
|
36,979 |
||||||||||||||
| Shareholders’ equity |
|
46,652 |
|
48,274 |
||||||||||||||
| |
|
|
|
|
|
|
|
|
|
|
| |||||||
| Total liabilities and shareholders’ equity |
$ |
669,149 |
$ |
646,599 |
||||||||||||||
| |
|
|
|
|
|
|
|
|
|
|
| |||||||
| Net interest spread |
3.29 |
|
3.26 |
| ||||||||||||||
| Impact of noninterest-bearing sources |
0.46 |
|
0.49 |
| ||||||||||||||
| |
|
|
|
|
|
|
|
|
|
|
| |||||||
| Net interest income/yield on earning assets |
$ |
5,465 |
3.75 |
% |
$ |
5,262 |
3.75 |
% | ||||||||||
| |
|
|
|
|
|
|
|
|
|
|
| |||||||
(1) |
The average balance and yield on securities are based on the average of historical amortized cost balances.
|
(2) |
Nonperforming loans are included in the respective average loan balances. Income on such nonperforming loans is recognized on a cash basis.
|
(3) |
Interest income includes the impact of interest rate risk management contracts, which increased interest income on the underlying assets $397, $509 and $560
in the third, second and first quarters of 2002 and $473 and $284 in the fourth and third quarters of 2001, respectively. These amounts were substantially offset by corresponding decreases in the income earned on the underlying assets. Interest
expense includes the impact of interest rate risk management contracts, which (increased) decreased interest expense on the underlying liabilities $(69), $(65) and $55 in the third, second and first quarters of 2002 and $(40) and $31 in the fourth
and third quarters of 2001, respectively. These amounts were substantially offset by corresponding decreases or increases in the interest paid on the underlying liabilities. For further information on interest rate contracts, see “Asset and
Liability Management Activities” beginning on page 60. |
(4) |
Primarily consists of time deposits in denominations of $100,000 or more. |
| First Quarter 2002 |
Fourth Quarter 2001 |
Third Quarter 2001 |
|||||||||||||||||||||||||
| (Dollars in millions) |
Average Balance |
Interest Income/ Expense |
Yield/ Rate |
Average Balance |
Interest Income/ Expense |
Yield/ Rate |
Average Balance |
Interest Income/ Expense |
Yield/ Rate |
||||||||||||||||||
| Earning assets |
|||||||||||||||||||||||||||
| Time deposits placed and other short-term investments |
$ |
10,242 |
$ |
61 |
2.43 |
% |
$ |
7,255 |
$ |
64 |
3.47 |
% |
$ |
5,881 |
$ |
71 |
4.84 |
% | |||||||||
| Federal funds sold and securities purchased under agreements to resell |
|
44,682 |
|
215 |
1.94 |
|
|
38,825 |
|
253 |
2.60 |
|
|
36,133 |
|
321 |
3.54 |
| |||||||||
| Trading account assets |
|
70,613 |
|
888 |
5.06 |
|
|
67,535 |
|
920 |
5.43 |
|
|
68,258 |
|
937 |
5.46 |
| |||||||||
| Securities(1) |
|
73,542 |
|
963 |
5.24 |
|
|
71,454 |
|
1,090 |
6.10 |
|
|
58,930 |
|
902 |
6.12 |
| |||||||||
| Loans and leases(2): |
|||||||||||||||||||||||||||
| Commercial — domestic |
|
116,160 |
|
1,978 |
6.90 |
|
|
121,399 |
|
2,138 |
6.99 |
|
|
129,673 |
|
2,343 |
7.17 |
| |||||||||
| Commercial — foreign |
|
21,917 |
|
226 |
4.17 |
|
|
23,789 |
|
278 |
4.63 |
|
|
25,267 |
|
353 |
5.54 |
| |||||||||
| Commercial real estate — domestic |
|
22,251 |
|
275 |
5.01 |
|
|
23,051 |
|
316 |
5.45 |
|
|
24,132 |
|
395 |
6.50 |
| |||||||||
| Commercial real estate — foreign |
|
389 |
|
4 |
4.00 |
|
|
375 |
|
4 |
4.49 |
|
|
366 |
|
5 |
5.78 |
| |||||||||
| |
|
|
|
|
|
|
|
|
|
|
|
|
|
|
|
|
| ||||||||||
| Total commercial |
|
160,717 |
|
2,483 |
6.26 |
|
|
168,614 |
|
2,736 |
6.44 |
|
|
179,438 |
|
3,096 |
6.85 |
| |||||||||
| |
|
|
|
|
|
|
|
|
|
|
|
|
|
|
|
|
| ||||||||||
| Residential mortgage |
|
81,104 |
|
1,389 |
6.88 |
|
|
78,366 |
|
1,385 |
7.05 |
|
|
80,526 |
|
1,457 |
7.22 |
| |||||||||
| Home equity lines |
|
22,010 |
|
294 |
5.42 |
|
|
22,227 |
|
340 |
6.07 |
|
|
22,115 |
|
394 |
7.06 |
| |||||||||
| Direct/Indirect consumer |
|
30,360 |
|
550 |
7.34 |
|
|
30,363 |
|
583 |
7.61 |
|
|
30,670 |
|
607 |
7.85 |
| |||||||||
| Consumer finance |
|
12,134 |
|
255 |
8.46 |
|
|
13,035 |
|
296 |
9.04 |
|
|
25,169 |
|
505 |
8.00 |
| |||||||||
| Bankcard |
|
19,383 |
|
490 |
10.26 |
|
|
18,656 |
|
498 |
10.58 |
|
|
17,632 |
|
493 |
11.11 |
| |||||||||
| Foreign consumer |
|
2,093 |
|
19 |
3.71 |
|
|
2,093 |
|
21 |
4.02 |
|
|
2,176 |
|
28 |
5.28 |
| |||||||||
| |
|
|
|
|
|
|
|
|
|
|
|
|
|
|
|
|
| ||||||||||
| Total consumer |
|
167,084 |
|
2,997 |
7.24 |
|
|
164,740 |
|
3,123 |
7.54 |
|
|
178,288 |
|
3,484 |
7.78 |
| |||||||||
| |
|
|
|
|
|
|
|
|
|
|
|
|
|
|
|
|
| ||||||||||
| Total loans and leases |
|
327,801 |
|
5,480 |
6.76 |
|
|
333,354 |
|
5,859 |
6.99 |
|
|
357,726 |
|
6,580 |
7.31 |
| |||||||||
| |
|
|
|
|
|
|
|
|
|
|
|
|
|
|
|
|
| ||||||||||
| Other earning assets |
|
22,231 |
|
358 |
6.52 |
|
|
36,782 |
|
707 |
7.67 |
|
|
30,180 |
|
597 |
7.89 |
| |||||||||
| |
|
|
|
|
|
|
|
|
|
|
|
|
|
|
|
|
| ||||||||||
| Total earning assets(3) |
|
549,111 |
|
7,965 |
5.86 |
|
|
555,205 |
|
8,893 |
6.37 |
|
|
557,108 |
|
9,408 |
6.72 |
| |||||||||
| |
|
|
|
|
|
|
|
|
|
|
|
|
|
|
|
|
| ||||||||||
| Cash and cash equivalents |
|
22,037 |
|
23,182 |
|
20,753 |
|||||||||||||||||||||
| Other assets, less allowance for credit losses |
|
66,530 |
|
73,410 |
|
64,323 |
|||||||||||||||||||||
| |
|
|
|
|
|
||||||||||||||||||||||
| Total assets |
$ |
637,678 |
$ |
651,797 |
$ |
642,184 |
|||||||||||||||||||||
| |
|
|
|
|
|
||||||||||||||||||||||
| Interest-bearing liabilities |
|||||||||||||||||||||||||||
| Domestic interest-bearing deposits: |
|||||||||||||||||||||||||||
| Savings |
$ |
20,716 |
$ |
33 |
0.64 |
% |
$ |
20,132 |
$ |
42 |
0.83 |
% |
$ |
20,076 |
$ |
53 |
1.04 |
% | |||||||||
| NOW and money market deposit accounts |
|
127,218 |
|
335 |
1.07 |
|
|
121,758 |
|
426 |
1.39 |
|
|
116,638 |
|
588 |
2.00 |
| |||||||||
| Consumer CDs and IRAs |
|
69,359 |
|
730 |
4.27 |
|
|
71,895 |
|
898 |
4.96 |
|
|
73,465 |
|
918 |
4.95 |
| |||||||||
| Negotiable CDs, public funds and other time deposits |
|
4,671 |
|
32 |
2.82 |
|
|
5,196 |
|
44 |
3.39 |
|
|
5,085 |
|
57 |
4.44 |
| |||||||||
| |
|
|
|
|
|
|
|
|
|
|
|
|
|
|
|
|
| ||||||||||
| Total domestic interest-bearing deposits |
|
221,964 |
|
1,130 |
2.06 |
|
|
218,981 |
|
1,410 |
2.56 |
|
|
215,264 |
|
1,616 |
2.98 |
| |||||||||
| |
|
|
|
|
|
|
|
|
|
|
|
|
|
|
|
|
| ||||||||||
| Foreign interest-bearing deposits(4): |
|||||||||||||||||||||||||||
| Banks located in foreign countries |
|
15,464 |
|
107 |
2.79 |
|
|
20,771 |
|
170 |
3.22 |
|
|
24,097 |
|
257 |
4.22 |
| |||||||||
| Governments and official institutions |
|
2,904 |
|
14 |
1.96 |
|
|
2,965 |
|
20 |
2.74 |
|
|
3,533 |
|
35 |
3.90 |
| |||||||||
| Time, savings and other |
|
19,620 |
|
93 |
1.93 |
|
|
21,858 |
|
113 |
2.06 |
|
|
23,847 |
|
189 |
3.16 |
| |||||||||
| |
|
|
|
|
|
|
|
|
|
|
|
|
|
|
|
|
| ||||||||||
| Total foreign interest-bearing deposits |
|
37,988 |
|
214 |
2.29 |
|
|
45,594 |
|
303 |
2.63 |
|
|
51,477 |
|
481 |
3.71 |
| |||||||||
| |
|
|
|
|
|
|
|
|
|
|
|
|
|
|
|
|
| ||||||||||
| Total interest-bearing deposits |
|
259,952 |
|
1,344 |
2.10 |
|
|
264,575 |
|
1,713 |
2.57 |
|
|
266,741 |
|
2,097 |
3.12 |
| |||||||||
| |
|
|
|
|
|
|
|
|
|
|
|
|
|
|
|
|
| ||||||||||
| Federal funds purchased, securities sold under agreements to repurchase and other short-term borrowings
|
|
86,870 |
|
477 |
2.23 |
|
|
87,291 |
|
700 |
3.18 |
|
|
89,042 |
|
869 |
3.87 |
| |||||||||
| Trading account liabilities |
|
31,066 |
|
285 |
3.72 |
|
|
29,921 |
|
268 |
3.55 |
|
|
30,913 |
|
285 |
3.66 |
| |||||||||
| Long-term debt and trust preferred securities |
|
67,694 |
|
612 |
3.62 |
|
|
68,141 |
|
707 |
4.15 |
|
|
67,267 |
|
867 |
5.15 |
| |||||||||
| |
|
|
|
|
|
|
|
|
|
|
|
|
|
|
|
|
| ||||||||||
| Total interest-bearing liabilities(3) |
|
445,582 |
|
2,718 |
2.47 |
|
|
449,928 |
|
3,388 |
2.99 |
|
|
453,963 |
|
4,118 |
3.61 |
| |||||||||
| |
|
|
|
|
|
|
|
|
|
|
|
|
|
|
|
|
| ||||||||||
| Noninterest-bearing sources: |
|||||||||||||||||||||||||||
| Noninterest-bearing deposits |
|
104,451 |
|
103,596 |
|
96,587 |
|||||||||||||||||||||
| Other liabilities |
|
40,189 |
|
49,357 |
|
42,432 |
|||||||||||||||||||||
| Shareholders’ equity |
|
47,456 |
|
48,916 |
|
49,202 |
|||||||||||||||||||||
| |
|
|
|
|
|
||||||||||||||||||||||
| Total liabilities and shareholders’ equity |
$ |
637,678 |
$ |
651,797 |
$ |
642,184 |
|||||||||||||||||||||
| |
|
|
|
|
|
||||||||||||||||||||||
| Net interest spread |
3.39 |
|
3.38 |
|
3.11 |
| |||||||||||||||||||||
| Impact of noninterest-bearing sources |
0.46 |
|
0.57 |
|
0.67 |
| |||||||||||||||||||||
| |
|
|
|
|
| ||||||||||||||||||||||
| Net interest income/yield on earning assets |
$ |
5,247 |
3.85 |
% |
$ |
5,505 |
3.95 |
% |
$ |
5,290 |
3.78 |
% | |||||||||||||||
| |
|
|
|
|
|
|
|
|
|
|
| ||||||||||||||||
(1) |
The average balance and yield on securities are based on the average of historical amortized cost balances.
|
(2) |
Nonperforming loans are included in the respective average loan balances. Income on such nonperforming loans is recognized on a cash basis.
|
(3) |
Interest income includes the impact of interest rate risk management contracts, which increased interest income on the underlying assets $397, $509 and $560
in the third, second and first quarters of 2002 and $473 and $284 in the fourth and third quarters of 2001, respectively. These amounts were substantially offset by corresponding decreases in the income earned on the underlying assets. Interest
expense includes the impact of interest rate risk management contracts, which (increased) decreased interest expense on the underlying liabilities $(69), $(65) and $55 in the third, second and first quarters of 2002 and $(40) and $31 in the fourth
and third quarters of 2001, respectively. These amounts were substantially offset by corresponding decreases or increases in the interest paid on the underlying liabilities. For further information on interest rate contracts, see “Asset and
Liability Management Activities” beginning on page 60. |
(4) |
Primarily consists of time deposits in denominations of $100,000 or more. |
| Nine Months Ended September 30 |
||||||||||||||||||
| 2002 |
2001 |
|||||||||||||||||
| (Dollars in millions) |
Average Balance |
Interest Income/ Expense |
Yield/ Rate |
Average Balance |
Interest Income/ Expense |
Yield/ Rate |
||||||||||||
| Earning assets |
||||||||||||||||||
| Time deposits placed and other short-term investments |
$ |
10,437 |
$ |
187 |
2.40 |
% |
$ |
6,544 |
$ |
254 |
5.20 |
% | ||||||
| Federal funds sold and securities purchased under agreements to resell |
|
44,451 |
|
662 |
1.99 |
|
|
33,980 |
|
1,161 |
4.56 |
| ||||||
| Trading account assets |
|
78,005 |
|
2,866 |
4.91 |
|
|
66,041 |
|
2,733 |
5.52 |
| ||||||
| Securities(1) |
|
72,450 |
|
3,022 |
5.56 |
|
|
56,637 |
|
2,671 |
6.29 |
| ||||||
| Loans and leases(2): |
||||||||||||||||||
| Commercial — domestic |
|
111,204 |
|
5,592 |
6.72 |
|
|
137,670 |
|
7,741 |
7.52 |
| ||||||
| Commercial — foreign |
|
21,540 |
|
644 |
3.99 |
|
|
27,403 |
|
1,287 |
6.28 |
| ||||||
| Commercial real estate — domestic |
|
21,431 |
|
798 |
4.98 |
|
|
25,131 |
|
1,384 |
7.36 |
| ||||||
| Commercial real estate — foreign |
|
402 |
|
13 |
4.34 |
|
|
339 |
|
17 |
6.67 |
| ||||||
| |
|
|
|
|
|
|
|
|
|
|
| |||||||
| Total commercial |
|
154,577 |
|
7,047 |
6.09 |
|
|
190,543 |
|
10,429 |
7.32 |
| ||||||
| |
|
|
|
|
|
|
|
|
|
|
| |||||||
| Residential mortgage |
|
93,559 |
|
4,724 |
6.74 |
|
|
82,519 |
|
4,535 |
7.33 |
| ||||||
| Home equity lines |
|
22,626 |
|
913 |
5.40 |
|
|
21,940 |
|
1,285 |
7.83 |
| ||||||
| Direct/Indirect consumer |
|
30,136 |
|
1,623 |
7.20 |
|
|
30,377 |
|
1,883 |
8.29 |
| ||||||
| Consumer finance |
|
11,069 |
|
682 |
8.22 |
|
|
32,654 |
|
1,945 |
7.94 |
| ||||||
| Bankcard |
|
20,693 |
|
1,582 |
10.22 |
|
|
15,962 |
|
1,381 |
11.57 |
| ||||||
| Foreign consumer |
|
2,043 |
|
57 |
3.75 |
|
|
2,266 |
|
108 |
6.36 |
| ||||||
| |
|
|
|
|
|
|
|
|
|
|
| |||||||
| Total consumer |
|
180,126 |
|
9,581 |
7.10 |
|
|
185,718 |
|
11,137 |
8.01 |
| ||||||
| |
|
|
|
|
|
|
|
|
|
|
| |||||||
| Total loans and leases |
|
334,703 |
|
16,628 |
6.64 |
|
|
376,261 |
|
21,566 |
7.66 |
| ||||||
| |
|
|
|
|
|
|
|
|
|
|
| |||||||
| Other earning assets |
|
23,918 |
|
1,100 |
6.14 |
|
|
22,575 |
|
1,358 |
8.04 |
| ||||||
| |
|
|
|
|
|
|
|
|
|
|
| |||||||
| Total earning assets(3) |
|
563,964 |
|
24,465 |
5.79 |
|
|
562,038 |
|
29,743 |
7.07 |
| ||||||
| |
|
|
|
|
|
|
|
|
|
|
| |||||||
| Cash and cash equivalents |
|
21,140 |
|
22,327 |
||||||||||||||
| Other assets, less allowance for credit losses |
|
66,153 |
|
64,424 |
||||||||||||||
| |
|
|
|
|||||||||||||||
| Total assets |
$ |
651,257 |
$ |
648,789 |
||||||||||||||
| |
|
|
|
|||||||||||||||
| Interest-bearing liabilities |
||||||||||||||||||
| Domestic interest-bearing deposits: |
||||||||||||||||||
| Savings |
$ |
21,539 |
|
103 |
0.64 |
|
$ |
20,233 |
|
171 |
1.13 |
| ||||||
| NOW and money market deposit accounts |
|
130,025 |
|
1,044 |
1.07 |
|
|
112,263 |
|
2,072 |
2.47 |
| ||||||
| Consumer CDs and IRAs |
|
68,176 |
|
2,240 |
4.39 |
|
|
75,322 |
|
2,955 |
5.24 |
| ||||||
| Negotiated CDs, public funds and other time deposits |
|
4,520 |
|
112 |
3.29 |
|
|
6,068 |
|
246 |
5.42 |
| ||||||
| |
|
|
|
|
|
|
|
|
|
|
| |||||||
| Total domestic interest-bearing deposits |
|
224,260 |
|
3,499 |
2.09 |
|
|
213,886 |
|
5,444 |
3.40 |
| ||||||
| |
|
|
|
|
|
|
|
|
|
|
| |||||||
| Foreign interest-bearing deposits(4): |
||||||||||||||||||
| Banks located in foreign countries |
|
15,525 |
|
338 |
2.91 |
|
|
24,283 |
|
882 |
4.86 |
| ||||||
| Governments and official institutions |
|
2,511 |
|
36 |
1.90 |
|
|
3,835 |
|
132 |
4.59 |
| ||||||
| Time, savings and other |
|
19,051 |
|
269 |
1.89 |
|
|
23,304 |
|
715 |
4.11 |
| ||||||
| |
|
|
|
|
|
|
|
|
|
|
| |||||||
| Total foreign interest-bearing deposits |
|
37,087 |
|
643 |
2.32 |
|
|
51,422 |
|
1,729 |
4.50 |
| ||||||
| |
|
|
|
|
|
|
|
|
|
|
| |||||||
| Total interest-bearing deposits |
|
261,347 |
|
4,142 |
2.12 |
|
|
265,308 |
|
7,173 |
3.61 |
| ||||||
| |
|
|
|
|
|
|
|
|
|
|
| |||||||
| Federal funds purchased, securities sold under agreements to repurchase and other short-term borrowings
|
|
97,655 |
|
1,532 |
2.10 |
|
|
94,223 |
|
3,467 |
4.92 |
| ||||||
| Trading account liabilities |
|
31,989 |
|
971 |
4.06 |
|
|
30,019 |
|
887 |
3.95 |
| ||||||
| Long-term debt and trust preferred securities |
|
66,161 |
|
1,846 |
3.72 |
|
|
70,121 |
|
3,088 |
5.87 |
| ||||||
| |
|
|
|
|
|
|
|
|
|
|
| |||||||
| Total interest-bearing liabilities(3) |
|
457,152 |
|
8,491 |
2.48 |
|
|
459,671 |
|
14,615 |
4.25 |
| ||||||
| |
|
|
|
|
|
|
|
|
|
|
| |||||||
| Noninterest-bearing sources: |
||||||||||||||||||
| Noninterest-bearing deposits |
|
106,795 |
|
95,485 |
||||||||||||||
| Other liabilities |
|
39,853 |
|
45,036 |
||||||||||||||
| Shareholders' equity |
|
47,457 |
|
48,597 |
||||||||||||||
| |
|
|
|
|||||||||||||||
| Total liabilities and shareholders' equity |
$ |
651,257 |
$ |
648,789 |
||||||||||||||
| |
|
|
|
|||||||||||||||
| Net interest spread |
3.31 |
|
2.82 |
| ||||||||||||||
| Impact of noninterest-bearing sources |
0.47 |
|
0.77 |
| ||||||||||||||
| |
|
|
| |||||||||||||||
| Net interest income/yield on earning assets |
$ |
15,974 |
3.78 |
% |
$ |
15,128 |
3.59 |
% | ||||||||||
| |
|
|
|
|
|
|
| |||||||||||
(1) |
The average balance and yield on securities are based on the average of historical amortized cost balances. |
(2) |
Nonperforming loans are included in the respective average loan balances. Income on such nonperforming loans is recognized on a cash basis.
|
(3) |
Interest income includes the impact of interest rate risk management contracts, which increased interest income on the underlying assets $1,466 and $505 in
the nine months ended September 30, 2002 and 2001, respectively. These amounts were substantially offset by corresponding decreases in the income earned on the underlying assets. Interest expense includes the impact of interest rate risk management
contracts, which (increased) decreased interest expense on the underlying liabilities $(79) and $103 in the nine months ended September 30, 2002 and 2001, respectively. These amounts were substantially offset by corresponding decreases or increases
in the interest paid on the underlying liabilities. For further information on interest rate contracts, see "Asset and Liability Management Activities" beginning on page 60. |
(4) |
Primarily consists of time deposits in denominations of $100,000 or more. |
| Three Months Ended September 30 |
Increase/(Decrease) |
Nine Months Ended September 30 |
Increase/(Decrease) |
|||||||||||||||||||||||||
| (Dollars in millions) |
2002 |
2001 |
Amount |
Percent |
2002 |
2001 |
Amount |
Percent |
||||||||||||||||||||
| Consumer service charges |
$ |
763 |
|
$ |
712 |
$ |
51 |
|
7.2 % |
|
$ |
2,189 |
|
$ |
2,120 |
$ |
69 |
|
3.3 % |
| ||||||||
| Corporate service charges |
|
585 |
|
|
528 |
|
57 |
|
10.8 |
|
|
1,717 |
|
|
1,538 |
|
179 |
|
11.6 |
| ||||||||
| |
|
|
|
|
|
|
|
|
|
|
|
|
|
|
|
|
|
|
| |||||||||
| Total service charges |
|
1,348 |
|
|
1,240 |
|
108 |
|
8.7 |
|
|
3,906 |
|
|
3,658 |
|
248 |
|
6.8 |
| ||||||||
| |
|
|
|
|
|
|
|
|
|
|
|
|
|
|
|
|
|
|
| |||||||||
| Consumer investment and brokerage services |
|
373 |
|
|
386 |
|
(13 |
) |
(3.4 |
) |
|
1,174 |
|
|
1,164 |
|
10 |
|
0.9 |
| ||||||||
| Corporate investment and brokerage services |
|
174 |
|
|
142 |
|
32 |
|
22.5 |
|
|
522 |
|
|
415 |
|
107 |
|
25.8 |
| ||||||||
| |
|
|
|
|
|
|
|
|
|
|
|
|
|
|
|
|
|
|
| |||||||||
| Total investment and brokerage services |
|
547 |
|
|
528 |
|
19 |
|
3.6 |
|
|
1,696 |
|
|
1,579 |
|
117 |
|
7.4 |
| ||||||||
| |
|
|
|
|
|
|
|
|
|
|
|
|
|
|
|
|
|
|
| |||||||||
| Mortgage banking income |
|
218 |
|
|
109 |
|
109 |
|
100.0 |
|
|
545 |
|
|
426 |
|
119 |
|
27.9 |
| ||||||||
| Investment banking income |
|
318 |
|
|
305 |
|
13 |
|
4.3 |
|
|
1,123 |
|
|
1,106 |
|
17 |
|
1.5 |
| ||||||||
| Equity investment gains (losses) |
|
(216 |
) |
|
22 |
|
(238 |
) |
n/m |
|
|
(226 |
) |
|
340 |
|
(566 |
) |
n/m |
| ||||||||
| Card income |
|
685 |
|
|
618 |
|
67 |
|
10.8 |
|
|
1,881 |
|
|
1,792 |
|
89 |
|
5.0 |
| ||||||||
| Trading account profits(1) |
|
71 |
|
|
433 |
|
(362 |
) |
(83.6 |
) |
|
679 |
|
|
1,508 |
|
(829 |
) |
(55.0 |
) | ||||||||
| Other income |
|
249 |
|
|
174 |
|
75 |
|
43.1 |
|
|
537 |
|
|
541 |
|
(4 |
) |
(0.7 |
) | ||||||||
| |
|
|
|
|
|
|
|
|
|
|
|
|
|
|
|
|
|
|
| |||||||||
| Total |
$ |
3,220 |
|
$ |
3,429 |
$ |
(209 |
) |
(6.1 |
)% |
$ |
10,141 |
|
$ |
10,950 |
$ |
(809 |
) |
(7.4 |
)% | ||||||||
| |
|
|
|
|
|
|
|
|
|
|
|
|
|
|
|
|
|
|
| |||||||||
(1) |
Trading account profits for the nine months ended September 30, 2001 included the $83 million SFAS 133 transition adjustment net loss.
|
• |
Service charges increased for the nine months ended September 30, 2002, primarily due to increases in both corporate and consumer service charges. Corporate
service charges increased as corporate customers chose to pay higher fees rather than maintain excess deposit balances in the lower rate environment. Consumer service charges increased as higher customer account charges and improved waiver
discipline were partially offset by the impact of new and existing customers choosing accounts with lower or no service charges. |
• |
Investment and brokerage services increased primarily due to an increase in corporate investment and brokerage services, which was attributable to higher
brokerage commissions in Global Corporate and Investment Banking due to higher customer volume. Consumer investment and brokerage services also increased slightly due to higher brokerage income offset by a decrease in asset management fees.
|
• |
The increase in mortgage banking income for the nine months ended September 30, 2002 was primarily due to an increase in net production income driven by higher
sales volumes, partially offset by a decline in servicing income due to portfolio run-off. Mortgage banking income for the three months ended September 30, 2002 increased $109 million compared to the three months ended September 30, 2001 primarily
as a result of higher production volumes. |
• |
Investment banking income for the nine months ended September 30, 2002 remained relatively flat, reflecting increases in advisory services and syndications that
were offset by a decline in securities underwriting. For additional discussion of investment banking income, see the Global Corporate and Investment Banking business segment discussion beginning on page 36. |
• |
Equity investment results decreased as a result of higher equity investment impairment charges of $535 million in Principal Investing as well as a $140 million
gain in the strategic investments portfolio in the first quarter of 2001 related to the sale of an interest in the Star Systems ATM network. |
• |
Card income increased as a result of an increase in debit card income. The increase in debit card income was driven by a higher number of active debit cards and
increased purchase volume. Credit card income remained relatively flat as higher late, cash advance, overlimit and interchange fees were offset by the impact of reduced
|
servicing and residual income on reduced credit card securitizations. The Corporation expects the residual and servicing income to continue to decline as new advances under previously securitized
balances will be recorded on the Corporation’s balance sheet after the revolving period of the securitization, which has the effect of increasing loans on the Corporation’s balance sheet and increasing net interest income and charge-offs,
with a corresponding reduction in noninterest income. |
• |
The decline in trading account profits for the nine months ended September 30, 2002 was primarily due to a decline in revenue from equities and the favorable
net mark-to-market adjustments in 2001 on mortgage banking certificates and the related derivative instruments. Gains on certain credit default swaps and other hedges of credit exposure in 2002 offset these declines. For additional discussion of
trading results, see the Global Corporate and Investment Banking business segment discussion beginning on page 36. |
• |
Other income increased 43 percent for the three months ended September 30, 2002 compared to the same period in 2001, primarily due to $190 million in gains on
whole mortgage loan sales. Gains on whole mortgage loan sales for the nine months ended September 30, 2002 were $328 million. |
| Three Months Ended September 30 |
Increase/ (Decrease) |
Nine Months Ended September 30 |
Increase/ (Decrease) |
|||||||||||||||||||||||
| (Dollars in millions) |
2002 |
2001 |
Amount |
Percent |
2002 |
2001 |
Amount |
Percent |
||||||||||||||||||
| Personnel |
$ |
2,368 |
$ |
2,304 |
$ |
64 |
|
2.8 |
% |
$ |
7,200 |
$ |
7,239 |
$ |
(39 |
) |
(0.5 |
)% | ||||||||
| Occupancy |
|
457 |
|
448 |
|
9 |
|
2.0 |
|
|
1,330 |
|
1,309 |
|
21 |
|
1.6 |
| ||||||||
| Equipment |
|
291 |
|
273 |
|
18 |
|
6.6 |
|
|
832 |
|
835 |
|
(3 |
) |
(0.4 |
) | ||||||||
| Marketing |
|
210 |
|
165 |
|
45 |
|
27.3 |
|
|
550 |
|
516 |
|
34 |
|
6.6 |
| ||||||||
| Professional fees |
|
126 |
|
144 |
|
(18 |
) |
(12.5 |
) |
|
339 |
|
411 |
|
(72 |
) |
(17.5 |
) | ||||||||
| Amortization of intangibles |
|
54 |
|
219 |
|
(165 |
) |
(75.3 |
) |
|
164 |
|
665 |
|
(501 |
) |
(75.3 |
) | ||||||||
| Data processing |
|
295 |
|
175 |
|
120 |
|
68.6 |
|
|
726 |
|
552 |
|
174 |
|
31.5 |
| ||||||||
| Telecommunications |
|
119 |
|
121 |
|
(2 |
) |
(1.7 |
) |
|
361 |
|
368 |
|
(7 |
) |
(1.9 |
) | ||||||||
| Other general operating |
|
700 |
|
757 |
|
(57 |
) |
(7.5 |
) |
|
2,102 |
|
2,186 |
|
(84 |
) |
(3.8 |
) | ||||||||
| Business exit costs |
|
— |
|
1,305 |
|
(1,305 |
) |
n/m |
|
|
— |
|
1,305 |
|
(1,305 |
) |
n/m |
| ||||||||
| |
|
|
|
|
|
|
|
|
|
|
|
|
|
|
|
|
| |||||||||
| Total |
$ |
4,620 |
$ |
5,911 |
$ |
(1,291 |
) |
(21.8 |
)% |
$ |
13,604 |
$ |
15,386 |
$ |
(1,782 |
) |
(11.6 |
)% | ||||||||
| |
|
|
|
|
|
|
|
|
|
|
|
|
|
|
|
|
| |||||||||
• |
Personnel expense decreased slightly for the nine months ended September 30, 2002, reflecting lower incentive compensation costs and salaries expense, partially
offset by higher employee benefit costs. Employee benefit costs increased due in part to a $55 million expense in the third quarter of 2002 related to a change in the expected return on plan assets for the Bank of America Pension Plan from 9.5
percent to 8.5 percent. At September 30, 2002, the Corporation had approximately 134,000 full-time equivalent employees compared to approximately 144,000 at September 30, 2001. |
• |
Marketing expense increased for the nine months ended September 30, 2002, primarily due to expenses related to marketing programs aimed at increasing online
bill pay, card and mortgage customers. |
• |
Professional fees decreased for the nine months ended September 30, 2002, primarily due to reduced consulting and other professional fees reflecting the
increased use of in-house personnel for our customer satisfaction and productivity initiatives. |
• |
Amortization of intangibles decreased for the nine months ended September 30, 2002, due to the adoption of SFAS 142, which eliminated the amortization of
goodwill. The amortization expense of $164 million for the nine months ended September 30, 2002 is related to core deposits and other intangibles. |
• |
Data processing expense increased for the nine months ended September 30, 2002, primarily due to $45 million in costs associated with terminated contracts on
discontinued software licenses in the third quarter of 2002, an increase in expenses resulting from higher volumes of online bill pay activity as well as higher item processing and check clearing expenses. |
• |
On August 15, 2001, the Corporation announced that it was exiting its auto leasing and subprime real estate lending businesses. As a result of exiting these
consumer finance businesses, the Corporation recorded pre-tax business exit costs in the third quarter of 2001 of $1.3 billion in noninterest expense. Business exit costs consisted of goodwill write-offs of $685 million, auto lease residual charges
of $400 million, real estate servicing asset revaluation charges of $145 million and other transaction costs of $75 million. |
| Total Corporation |
Consumer and Commercial Banking(1) |
Asset Management(1) |
||||||||||||||||||||||
| (Dollars in millions) |
2002 |
2001 |
2002 |
2001 |
2002 |
2001 |
||||||||||||||||||
| Net interest income(2) |
$ |
5,465 |
|
$ |
5,290 |
|
$ |
3,728 |
|
$ |
3,362 |
|
$ |
200 |
|
$ |
192 |
| ||||||
| Noninterest income |
|
3,220 |
|
|
3,429 |
|
|
2,174 |
|
|
1,949 |
|
|
381 |
|
|
418 |
| ||||||
| |
|
|
|
|
|
|
|
|
|
|
|
|
|
|
|
|
| |||||||
| Total revenue |
|
8,685 |
|
|
8,719 |
|
|
5,902 |
|
|
5,311 |
|
|
581 |
|
|
610 |
| ||||||
| Provision for credit losses |
|
804 |
|
|
1,251 |
|
|
420 |
|
|
389 |
|
|
118 |
|
|
16 |
| ||||||
| Gains (losses) on sale of securities |
|
189 |
|
|
97 |
|
|
13 |
|
|
1 |
|
|
— |
|
|
— |
| ||||||
| Amortization of intangibles(3) |
|
54 |
|
|
219 |
|
|
43 |
|
|
158 |
|
|
1 |
|
|
14 |
| ||||||
| Other noninterest expense |
|
4,566 |
|
|
5,692 |
|
|
2,968 |
|
|
2,658 |
|
|
359 |
|
|
349 |
| ||||||
| |
|
|
|
|
|
|
|
|
|
|
|
|
|
|
|
|
| |||||||
| Income before income taxes |
|
3,450 |
|
|
1,654 |
|
|
2,484 |
|
|
2,107 |
|
|
103 |
|
|
231 |
| ||||||
| Income tax expense |
|
1,215 |
|
|
813 |
|
|
904 |
|
|
820 |
|
|
31 |
|
|
83 |
| ||||||
| |
|
|
|
|
|
|
|
|
|
|
|
|
|
|
|
|
| |||||||
| Net income |
$ |
2,235 |
|
$ |
841 |
|
$ |
1,580 |
|
$ |
1,287 |
|
$ |
72 |
|
$ |
148 |
| ||||||
| |
|
|
|
|
|
|
|
|
|
|
|
|
|
|
|
|
| |||||||
| Shareholder value added |
$ |
880 |
|
$ |
824 |
|
$ |
1,075 |
|
$ |
867 |
|
$ |
(4 |
) |
$ |
95 |
| ||||||
| Net interest yield (taxable-equivalent basis) |
|
3.75 |
% |
|
3.78 |
% |
|
5.18 |
% |
|
5.03 |
% |
|
3.37 |
% |
|
2.95 |
% | ||||||
| Return on average equity |
|
19.0 |
|
|
6.8 |
|
|
34.6 |
|
|
26.7 |
|
|
11.3 |
|
|
26.4 |
| ||||||
| Efficiency ratio (taxable-equivalent basis) |
|
53.2 |
|
|
67.8 |
|
|
51.0 |
|
|
53.0 |
|
|
61.8 |
|
|
59.5 |
| ||||||
| Average: |
||||||||||||||||||||||||
| Total loans and leases |
$ |
340,484 |
|
$ |
357,726 |
|
$ |
183,035 |
|
$ |
179,194 |
|
$ |
22,964 |
|
$ |
24,631 |
| ||||||
| Total assets |
|
669,149 |
|
|
642,184 |
|
|
308,985 |
|
|
290,699 |
|
|
25,289 |
|
|
27,071 |
| ||||||
| Total deposits |
|
373,933 |
|
|
363,328 |
|
|
283,772 |
|
|
266,339 |
|
|
11,967 |
|
|
11,837 |
| ||||||
| Common equity/Allocated equity |
|
46,592 |
|
|
49,134 |
|
|
18,106 |
|
|
19,139 |
|
|
2,549 |
|
|
2,228 |
| ||||||
| |
|
|
|
|
|
|
|
|
|
|
|
|
|
|
|
|
| |||||||
| For the three months ended September 30 |
||||||||||||||||||||||||
| Global Corporate and Investment Banking(1) |
Equity Investments(1) |
Corporate Other |
||||||||||||||||||||||
| (Dollars in millions) |
2002 |
2001 |
2002 |
2001 |
2002 |
2001 |
||||||||||||||||||
| Net interest income(2) |
$ |
1,254 |
|
$ |
1,193 |
|
$ |
(37 |
) |
$ |
(35 |
) |
$ |
320 |
|
$ |
578 |
| ||||||
| Noninterest income |
|
785 |
|
|
1,093 |
|
|
(193 |
) |
|
(25 |
) |
|
73 |
|
|
(6 |
) | ||||||
| |
|
|
|
|
|
|
|
|
|
|
|
|
|
|
|
|
| |||||||
| Total revenue |
|
2,039 |
|
|
2,286 |
|
|
(230 |
) |
|
(60 |
) |
|
393 |
|
|
572 |
| ||||||
| Provision for credit losses(4) |
|
203 |
|
|
292 |
|
|
— |
|
|
— |
|
|
63 |
|
|
554 |
| ||||||
| Gains (losses) on sale of securities |
|
(25 |
) |
|
(9 |
) |
|
— |
|
|
— |
|
|
201 |
|
|
105 |
| ||||||
| Amortization of intangibles(3) |
|
8 |
|
|
36 |
|
|
1 |
|
|
3 |
|
|
1 |
|
|
8 |
| ||||||
| Other noninterest expense(4) |
|
1,180 |
|
|
1,196 |
|
|
27 |
|
|
76 |
|
|
32 |
|
|
1,413 |
| ||||||
| |
|
|
|
|
|
|
|
|
|
|
|
|
|
|
|
|
| |||||||
| Income before income taxes |
|
623 |
|
|
753 |
|
|
(258 |
) |
|
(139 |
) |
|
498 |
|
|
(1,298 |
) | ||||||
| Income tax expense |
|
195 |
|
|
262 |
|
|
(98 |
) |
|
(54 |
) |
|
183 |
|
|
(298 |
) | ||||||
| |
|
|
|
|
|
|
|
|
|
|
|
|
|
|
|
|
| |||||||
| Net income |
$ |
428 |
|
$ |
491 |
|
$ |
(160 |
) |
$ |
(85 |
) |
$ |
315 |
|
$ |
(1,000 |
) | ||||||
| |
|
|
|
|
|
|
|
|
|
|
|
|
|
|
|
|
| |||||||
| Shareholder value added |
$ |
107 |
|
$ |
136 |
|
$ |
(222 |
) |
$ |
(156 |
) |
$ |
(76 |
) |
$ |
(118 |
) | ||||||
| Net interest yield (taxable-equivalent basis) |
|
2.46 |
% |
|
2.48 |
% |
|
n/m |
|
|
n/m |
|
|
n/m |
|
|
n/m |
| ||||||
| Return on average equity |
|
15.6 |
|
|
15.1 |
|
|
(30.5 |
)% |
|
(13.7 |
)% |
|
n/m |
|
|
n/m |
| ||||||
| Efficiency ratio (taxable-equivalent basis) |
|
58.3 |
|
|
53.9 |
|
|
n/m |
|
|
n/m |
|
|
n/m |
|
|
n/m |
| ||||||
| Average: |
||||||||||||||||||||||||
| Total loans and leases |
$ |
60,821 |
|
$ |
78,219 |
|
$ |
446 |
|
$ |
468 |
|
$ |
73,218 |
|
$ |
75,214 |
| ||||||
| Total assets |
|
243,811 |
|
|
228,897 |
|
|
6,093 |
|
|
6,511 |
|
|
84,971 |
|
|
89,006 |
| ||||||
| Total deposits |
|
66,166 |
|
|
68,472 |
|
|
— |
|
|
— |
|
|
12,028 |
|
|
16,680 |
| ||||||
| Common equity/Allocated equity |
|
10,845 |
|
|
12,921 |
|
|
2,077 |
|
|
2,440 |
|
|
13,015 |
|
|
12,406 |
| ||||||
| |
|
|
|
|
|
|
|
|
|
|
|
|
|
|
|
|
| |||||||
(1) |
There were no material intersegment revenues among the segments. |
(2) |
Net interest income is presented on a taxable-equivalent basis. |
(3) |
The Corporation adopted SFAS 142 on January 1, 2002. Accordingly, no goodwill amortization was recorded in 2002. |
(4) |
Corporate Other includes exit charges consisting of provision for credit losses of $395 million and noninterest expense of $1,305 million related to the exit
of certain consumer finance businesses in the third quarter of 2001. |
(5) |
Noninterest income for the nine months ended September 30, 2001 included the $83 million SFAS 133 transition adjustment net loss which was included in
trading account profits. The components of the transition adjustment by segment were a gain of $4 million for Consumer and Commercial Banking, a gain of $19 million for Global Corporate and Investment Banking and a loss of $106 million for Corporate
Other. |
| Total Corporation |
Consumer and Commercial Banking(1) |
Asset Management(1) |
||||||||||||||||||||||
| (Dollars in millions) |
2002 |
2001 |
2002 |
2001 |
2002 |
2001 |
||||||||||||||||||
| Net interest income(2) |
$ |
15,974 |
|
$ |
15,128 |
|
$ |
10,741 |
|
$ |
9,751 |
|
$ |
571 |
|
$ |
544 |
| ||||||
| Noninterest income(5) |
|
10,141 |
|
|
10,950 |
|
|
6,169 |
|
|
5,758 |
|
|
1,228 |
|
|
1,306 |
| ||||||
| |
|
|
|
|
|
|
|
|
|
|
|
|
|
|
|
|
| |||||||
| Total revenue |
|
26,115 |
|
|
26,078 |
|
|
16,910 |
|
|
15,509 |
|
|
1,799 |
|
|
1,850 |
| ||||||
| Provision for credit losses |
|
2,532 |
|
|
2,886 |
|
|
1,296 |
|
|
1,046 |
|
|
287 |
|
|
87 |
| ||||||
| Gains (losses) on sale of securities |
|
326 |
|
|
82 |
|
|
44 |
|
|
3 |
|
|
— |
|
|
— |
| ||||||
| Amortization of intangibles(3) |
|
164 |
|
|
665 |
|
|
132 |
|
|
476 |
|
|
4 |
|
|
43 |
| ||||||
| Other noninterest expense |
|
13,440 |
|
|
14,721 |
|
|
8,467 |
|
|
7,925 |
|
|
1,079 |
|
|
1,108 |
| ||||||
| |
|
|
|
|
|
|
|
|
|
|
|
|
|
|
|
|
| |||||||
| Income before income taxes |
|
10,305 |
|
|
7,888 |
|
|
7,059 |
|
|
6,065 |
|
|
429 |
|
|
612 |
| ||||||
| Income tax expense |
|
3,670 |
|
|
3,154 |
|
|
2,619 |
|
|
2,370 |
|
|
144 |
|
|
222 |
| ||||||
| |
|
|
|
|
|
|
|
|
|
|
|
|
|
|
|
|
| |||||||
| Net income |
$ |
6,635 |
|
$ |
4,734 |
|
$ |
4,440 |
|
$ |
3,695 |
|
$ |
285 |
|
$ |
390 |
| ||||||
| |
|
|
|
|
|
|
|
|
|
|
|
|
|
|
|
|
| |||||||
| Shareholder value added |
$ |
2,546 |
|
$ |
2,293 |
|
$ |
2,920 |
|
$ |
2,447 |
|
$ |
74 |
|
$ |
233 |
| ||||||
| Net interest yield (taxable-equivalent basis) |
|
3.78 |
% |
|
3.59 |
% |
|
5.14 |
% |
|
4.98 |
% |
|
3.15 |
% |
|
2.85 |
% | ||||||
| Return on average equity |
|
18.7 |
|
|
13.0 |
|
|
32.3 |
|
|
25.7 |
|
|
15.9 |
|
|
23.4 |
| ||||||
| Efficiency ratio (taxable-equivalent basis) |
|
52.1 |
|
|
59.0 |
|
|
50.9 |
|
|
54.3 |
|
|
60.2 |
|
|
62.2 |
| ||||||
| Average: |
||||||||||||||||||||||||
| Total loans and leases |
$ |
334,703 |
|
$ |
376,261 |
|
$ |
182,715 |
|
$ |
177,633 |
|
$ |
23,596 |
|
$ |
24,328 |
| ||||||
| Total assets |
|
651,257 |
|
|
648,789 |
|
|
303,545 |
|
|
287,812 |
|
|
25,631 |
|
|
26,837 |
| ||||||
| Total deposits |
|
368,142 |
|
|
360,793 |
|
|
280,227 |
|
|
263,602 |
|
|
11,860 |
|
|
11,883 |
| ||||||
| Common equity/Allocated equity |
|
47,396 |
|
|
48,528 |
|
|
18,395 |
|
|
19,206 |
|
|
2,391 |
|
|
2,223 |
| ||||||
| |
|
|
|
|
|
|
|
|
|
|
|
|
|
|
|
|
| |||||||
| For the nine months ended September 30 |
||||||||||||||||||||||||
| Global Corporate and Investment Banking(1) |
Equity Investments(1) |
Corporate Other |
||||||||||||||||||||||
| (Dollars in millions) |
2002 |
2001 |
2002 |
2001 |
2002 |
2001 |
||||||||||||||||||
| Net interest income(2) |
$ |
3,711 |
|
$ |
3,425 |
|
$ |
(116 |
) |
$ |
(108 |
) |
$ |
1,067 |
|
$ |
1,516 |
| ||||||
| Noninterest income(5) |
|
3,029 |
|
|
3,770 |
|
|
(222 |
) |
|
227 |
|
|
(63 |
) |
|
(111 |
) | ||||||
| |
|
|
|
|
|
|
|
|
|
|
|
|
|
|
|
|
| |||||||
| Total revenue |
|
6,740 |
|
|
7,195 |
|
|
(338 |
) |
|
119 |
|
|
1,004 |
|
|
1,405 |
| ||||||
| Provision for credit losses(4) |
|
683 |
|
|
794 |
|
|
— |
|
|
— |
|
|
266 |
|
|
959 |
| ||||||
| Gains (losses) on sale of securities |
|
(67 |
) |
|
(30 |
) |
|
— |
|
|
— |
|
|
349 |
|
|
109 |
| ||||||
| Amortization of intangibles(3) |
|
24 |
|
|
107 |
|
|
2 |
|
|
8 |
|
|
2 |
|
|
31 |
| ||||||
| Other noninterest expense(4) |
|
3,718 |
|
|
3,908 |
|
|
63 |
|
|
144 |
|
|
113 |
|
|
1,636 |
| ||||||
| |
|
|
|
|
|
|
|
|
|
|
|
|
|
|
|
|
| |||||||
| Income before income taxes |
|
2,248 |
|
|
2,356 |
|
|
(403 |
) |
|
(33 |
) |
|
972 |
|
|
(1,112 |
) | ||||||
| Income tax expense |
|
754 |
|
|
835 |
|
|
(154 |
) |
|
(16 |
) |
|
307 |
|
|
(257 |
) | ||||||
| |
|
|
|
|
|
|
|
|
|
|
|
|
|
|
|
|
| |||||||
| Net income |
$ |
1,494 |
|
$ |
1,521 |
|
$ |
(249 |
) |
$ |
(17 |
) |
$ |
665 |
|
$ |
(855 |
) | ||||||
| |
|
|
|
|
|
|
|
|
|
|
|
|
|
|
|
|
| |||||||
| Shareholder value added |
$ |
515 |
|
$ |
416 |
|
$ |
(438 |
) |
$ |
(224 |
) |
$ |
(525 |
) |
$ |
(579 |
) | ||||||
| Net interest yield (taxable-equivalent basis) |
|
2.49 |
% |
|
2.34 |
% |
|
n/m |
|
|
n/m |
|
|
n/m |
|
|
n/m |
| ||||||
| Return on average equity |
|
17.9 |
|
|
15.1 |
|
|
(15.6 |
)% |
|
(0.9 |
)% |
|
n/m |
|
|
n/m |
| ||||||
| Efficiency ratio (taxable-equivalent basis) |
|
55.5 |
|
|
55.8 |
|
|
n/m |
|
|
127.6 |
|
|
n/m |
|
|
n/m |
| ||||||
| Average: |
||||||||||||||||||||||||
| Total loans and leases |
$ |
63,841 |
|
$ |
85,897 |
|
$ |
440 |
|
$ |
487 |
|
$ |
64,111 |
|
$ |
87,916 |
| ||||||
| Total assets |
|
237,929 |
|
|
232,959 |
|
|
6,200 |
|
|
6,636 |
|
|
77,952 |
|
|
94,545 |
| ||||||
| Total deposits |
|
64,393 |
|
|
67,288 |
|
|
— |
|
|
17 |
|
|
11,662 |
|
|
18,003 |
| ||||||
| Common equity/Allocated equity |
|
11,176 |
|
|
13,498 |
|
|
2,131 |
|
|
2,394 |
|
|
13,303 |
|
|
11,207 |
| ||||||
| |
|
|
|
|
|
|
|
|
|
|
|
|
|
|
|
|
| |||||||
(1) |
There were no material intersegment revenues among the segments. |
(2) |
Net interest income is presented on a taxable-equivalent basis. |
(3) |
The Corporation adopted SFAS 142 on January 1, 2002. Accordingly, no goodwill amortization was recorded in 2002. |
(4) |
Corporate Other includes exit charges consisting of provision for credit losses of $395 million and noninterest expense of $1,305 million related to the exit
of certain consumer finance businesses in the third quarter of 2001. |
(5) |
Noninterest income for the nine months ended September 30, 2001 included the $83 million SFAS 133 transition adjustment net loss which was included in
trading account profits. The components of the transition adjustment by segment were a gain of $4 million for Consumer and Commercial Banking, a gain of $19 million for Global Corporate and Investment Banking and a loss of $106 million for Corporate
Other. |
| Three Months Ended September 30 |
Nine Months Ended September 30 |
|||||||||||||||
| (Dollars in millions) |
2002 |
2001 |
2002 |
2001 |
||||||||||||
| Net interest income |
$ |
3,728 |
|
$ |
3,362 |
|
$ |
10,741 |
|
$ |
9,751 |
| ||||
| Noninterest income |
|
2,174 |
|
|
1,949 |
|
|
6,169 |
|
|
5,758 |
| ||||
| |
|
|
|
|
|
|
|
|
|
|
| |||||
| Total revenue |
|
5,902 |
|
|
5,311 |
|
|
16,910 |
|
|
15,509 |
| ||||
| Provision for credit losses |
|
420 |
|
|
389 |
|
|
1,296 |
|
|
1,046 |
| ||||
| Noninterest expense |
|
3,011 |
|
|
2,816 |
|
|
8,599 |
|
|
8,401 |
| ||||
| Net income |
|
1,580 |
|
|
1,287 |
|
|
4,440 |
|
|
3,695 |
| ||||
| Shareholder value added |
|
1,075 |
|
|
867 |
|
|
2,920 |
|
|
2,447 |
| ||||
| Efficiency ratio |
|
51.0 |
% |
|
53.0 |
% |
|
50.9 |
% |
|
54.3 |
% | ||||
| |
|
|
|
|
|
|
|
|
|
|
| |||||
| Three Months Ended September 30 |
Nine Months Ended September 30 |
|||||||||||||||
| (Dollars in millions) |
2002 |
2001 |
2002 |
2001 |
||||||||||||
| Net interest income |
$ |
2,319 |
|
$ |
2,185 |
|
$ |
6,786 |
|
$ |
6,374 |
| ||||
| Noninterest income |
|
1,108 |
|
|
971 |
|
|
3,107 |
|
|
2,826 |
| ||||
| |
|
|
|
|
|
|
|
|
|
|
| |||||
| Total revenue |
|
3,427 |
|
|
3,156 |
|
|
9,893 |
|
|
9,200 |
| ||||
| Provision for credit losses |
|
55 |
|
|
71 |
|
|
193 |
|
|
203 |
| ||||
| Noninterest expense |
|
2,048 |
|
|
1,923 |
|
|
5,872 |
|
|
5,733 |
| ||||
| Net income |
|
838 |
|
|
702 |
|
|
2,398 |
|
|
1,961 |
| ||||
| Shareholder value added |
|
537 |
|
|
490 |
|
|
1,509 |
|
|
1,334 |
| ||||
| Efficiency ratio |
|
59.7 |
% |
|
60.9 |
% |
|
59.4 |
% |
|
62.3 |
% | ||||
| |
|
|
|
|
|
|
|
|
|
|
| |||||
| Three Months Ended September 30 |
Nine Months Ended September 30 |
|||||||||||||||
| (Dollars in millions) |
2002 |
2001 |
2002 |
2001 |
||||||||||||
| Net interest income |
$ |
809 |
|
$ |
552 |
|
$ |
2,180 |
|
$ |
1,493 |
| ||||
| Noninterest income |
|
781 |
|
|
714 |
|
|
2,245 |
|
|
2,207 |
| ||||
| |
|
|
|
|
|
|
|
|
|
|
| |||||
| Total revenue |
|
1,590 |
|
|
1,266 |
|
|
4,425 |
|
|
3,700 |
| ||||
| Provision for credit losses |
|
321 |
|
|
245 |
|
|
911 |
|
|
628 |
| ||||
| Noninterest expense |
|
604 |
|
|
525 |
|
|
1,694 |
|
|
1,563 |
| ||||
| Net income |
|
437 |
|
|
316 |
|
|
1,184 |
|
|
949 |
| ||||
| Shareholder value added |
|
350 |
|
|
234 |
|
|
923 |
|
|
712 |
| ||||
| Efficiency ratio |
|
38.0 |
% |
|
41.4 |
% |
|
38.3 |
% |
|
42.2 |
% | ||||
| |
|
|
|
|
|
|
|
|
|
|
| |||||
| Commercial Banking | ||||||||||||||||
| Three Months Ended September 30 |
Nine Months Ended September 30 |
|||||||||||||||
| (Dollars in millions) |
2002 |
2001 |
2002 |
2001 |
||||||||||||
| Net interest income |
$ |
600 |
|
$ |
625 |
|
$ |
1,775 |
|
$ |
1,884 |
| ||||
| Noninterest income |
|
285 |
|
|
264 |
|
|
817 |
|
|
725 |
| ||||
| |
|
|
|
|
|
|
|
|
|
|
| |||||
| Total revenue |
|
885 |
|
|
889 |
|
|
2,592 |
|
|
2,609 |
| ||||
| Provision for credit losses |
|
44 |
|
|
73 |
|
|
192 |
|
|
215 |
| ||||
| Noninterest expense |
|
359 |
|
|
368 |
|
|
1,033 |
|
|
1,105 |
| ||||
| Net income |
|
305 |
|
|
269 |
|
|
858 |
|
|
785 |
| ||||
| Shareholder value added |
|
188 |
|
|
143 |
|
|
488 |
|
|
401 |
| ||||
| Efficiency ratio |
|
40.6 |
% |
|
41.4 |
% |
|
39.9 |
% |
|
42.4 |
% | ||||
| |
|
|
|
|
|
|
|
|
|
|
| |||||
• |
Net interest income increased $990 million, or 10 percent, due to a favorable shift in loan mix, overall loan and deposit growth and the Corporation’s
overall asset and liability management strategies, partially offset by the compression of margins on deposits. Average on-balance sheet consumer bankcard outstandings increased 30 percent from a year ago, primarily due to new accounts, balance
transfers, the reduction in voluntary attrition partly due to efforts aimed at increasing customer satisfaction and an increase in new advances on previously securitized balances that are recorded on the Corporation’s balance sheet after the
revolving period of the securitization. |
• |
Noninterest income increased $411 million, or seven percent, primarily driven by increases in service charges, card income and mortgage banking income. These
increases were partially offset by a decrease in trading account profits within Consumer Products, which was due to the favorable net mark-to-market adjustments in 2001 on mortgage banking certificates and the related derivative instruments.
|
• |
The provision for credit losses increased $250 million, or 24 percent, primarily driven by higher provision in the bankcard loan portfolio within our
Consumer Products group, partially offset by a decline in commercial banking provision. The increase in bankcard provision was primarily attributable to a 30 percent increase in average on-balance sheet bankcard outstandings, portfolio
seasoning of outstandings from new account growth in 2000 and 2001 and a weaker economic environment. Seasoning refers to the length of time passed since an account was opened. |
• |
Noninterest expense increased $198 million, or two percent, primarily attributable to a change in assumptions for the Bank of America Pension Plan as well as
increases in marketing and promotional fees, personnel, data processing expense and increases in processing/support costs (which included increases related to e-commerce and debit card processing). The increase in data processing expense was
primarily due to costs associated with terminated contracts on discontinued software licenses. These increases were partially offset by the elimination of goodwill amortization. Goodwill amortization expense for the nine months ended September 30,
2001 was $339 million. |
| September 30 | ||||||
| (Dollars in billions) |
2002 |
2001 | ||||
| Assets under management |
$ |
271.9 |
$ |
281.8 | ||
| Client brokerage assets |
|
87.1 |
|
93.6 | ||
| Assets in custody |
|
42.1 |
|
43.1 | ||
| |
|
|
| |||
| Total client assets |
$ |
401.1 |
$ |
418.5 | ||
| |
|
|
| |||
| Three Months Ended September 30 |
Nine Months Ended September 30 |
|||||||||||||||
| (Dollars in millions) |
2002 |
2001 |
2002 |
2001 |
||||||||||||
| Net interest income |
$ |
200 |
|
$ |
192 |
|
$ |
571 |
|
$ |
544 |
| ||||
| Noninterest income |
|
381 |
|
|
418 |
|
|
1,228 |
|
|
1,306 |
| ||||
| |
|
|
|
|
|
|
|
|
|
|
| |||||
| Total revenue |
|
581 |
|
|
610 |
|
|
1,799 |
|
|
1,850 |
| ||||
| Provision for credit losses |
|
118 |
|
|
16 |
|
|
287 |
|
|
87 |
| ||||
| Noninterest expense |
|
360 |
|
|
363 |
|
|
1,083 |
|
|
1,151 |
| ||||
| Net income |
|
72 |
|
|
148 |
|
|
285 |
|
|
390 |
| ||||
| Shareholder value added |
|
(4 |
) |
|
95 |
|
|
74 |
|
|
233 |
| ||||
| Efficiency ratio |
|
61.8 |
% |
|
59.5 |
% |
|
60.2 |
% |
|
62.2 |
% | ||||
| |
|
|
|
|
|
|
|
|
|
|
| |||||
• |
Net interest income increased $27 million, or five percent, primarily due to the Corporation’s overall asset and liability management strategies.
|
• |
Despite the 22 percent drop in the S&P 500 from a year ago, noninterest income only declined $78 million, or six percent, primarily due to a decline in
investment and brokerage services activities, reflecting the current market environment. An increase in mutual fund fees was more than offset by a decline in personal asset management fees. |
• |
Provision expense increased $200 million, primarily due to large charge-offs in the second and third quarters of 2002 related to one loan in the Private Bank.
|
• |
Noninterest expense declined $68 million, or six percent, primarily due to the elimination of goodwill amortization and lower revenue-related incentive
compensation. Goodwill amortization expense for the nine months ended September 30, 2001 was $38 million. |
| Three Months Ended September 30 |
Nine Months Ended September 30 |
|||||||||||||||
| (Dollars in millions) |
2002 |
2001 |
2002 |
2001 |
||||||||||||
| Net interest income |
$ |
1,254 |
|
$ |
1,193 |
|
$ |
3,711 |
|
$ |
3,425 |
| ||||
| Noninterest income |
|
785 |
|
|
1,093 |
|
|
3,029 |
|
|
3,770 |
| ||||
| |
|
|
|
|
|
|
|
|
|
|
| |||||
| Total revenue |
|
2,039 |
|
|
2,286 |
|
|
6,740 |
|
|
7,195 |
| ||||
| Provision for credit losses |
|
203 |
|
|
292 |
|
|
683 |
|
|
794 |
| ||||
| Noninterest expense |
|
1,188 |
|
|
1,232 |
|
|
3,742 |
|
|
4,015 |
| ||||
| Net income |
|
428 |
|
|
491 |
|
|
1,494 |
|
|
1,521 |
| ||||
| Shareholder value added |
|
107 |
|
|
136 |
|
|
515 |
|
|
416 |
| ||||
| Efficiency ratio |
|
58.3 |
% |
|
53.9 |
% |
|
55.5 |
% |
|
55.8 |
% | ||||
| |
|
|
|
|
|
|
|
|
|
|
| |||||
| Three Months Ended September 30 |
Nine Months Ended September 30 |
|||||||||||||||
| (Dollars in millions) |
2002 |
2001 |
2002 |
2001 |
||||||||||||
| Net interest income |
$ |
523 |
|
$ |
459 |
|
$ |
1,519 |
|
$ |
1,280 |
| ||||
| Noninterest income |
|
392 |
|
|
731 |
|
|
1,995 |
|
|
2,848 |
| ||||
| |
|
|
|
|
|
|
|
|
|
|
| |||||
| Total revenue |
|
915 |
|
|
1,190 |
|
|
3,514 |
|
|
4,128 |
| ||||
| Provision for credit losses |
|
(17 |
) |
|
15 |
|
|
22 |
|
|
25 |
| ||||
| Noninterest expense |
|
791 |
|
|
827 |
|
|
2,562 |
|
|
2,793 |
| ||||
| Net income |
|
100 |
|
|
230 |
|
|
598 |
|
|
838 |
| ||||
| Shareholder value added |
|
(8 |
) |
|
123 |
|
|
285 |
|
|
508 |
| ||||
| Efficiency ratio |
|
86.4 |
% |
|
69.4 |
% |
|
72.9 |
% |
|
67.7 |
% | ||||
| |
|
|
|
|
|
|
|
|
|
|
| |||||
| Three Months Ended September 30 |
Nine Months Ended September 30 |
|||||||||||||||
| (Dollars in millions) |
2002 |
2001 |
2002 |
2001 |
||||||||||||
| Net interest income |
$ |
534 |
|
$ |
547 |
|
$ |
1,538 |
|
$ |
1,628 |
| ||||
| Noninterest income |
|
182 |
|
|
155 |
|
|
397 |
|
|
330 |
| ||||
| |
|
|
|
|
|
|
|
|
|
|
| |||||
| Total revenue |
|
716 |
|
|
702 |
|
|
1,935 |
|
|
1,958 |
| ||||
| Provision for credit losses |
|
216 |
|
|
285 |
|
|
666 |
|
|
777 |
| ||||
| Noninterest expense |
|
126 |
|
|
149 |
|
|
393 |
|
|
447 |
| ||||
| Net income |
|
242 |
|
|
172 |
|
|
573 |
|
|
472 |
| ||||
| Shareholder value added |
|
43 |
|
|
(64 |
) |
|
(52 |
) |
|
(266 |
) | ||||
| Efficiency ratio |
|
17.7 |
% |
|
21.2 |
% |
|
20.3 |
% |
|
22.9 |
% | ||||
| |
|
|
|
|
|
|
|
|
|
|
| |||||
| Three Months Ended September 30 |
Nine Months Ended September 30 |
|||||||||||||||
| (Dollars in millions) |
2002 |
2001 |
2002 |
2001 |
||||||||||||
| Net interest income |
$ |
197 |
|
$ |
187 |
|
$ |
654 |
|
$ |
517 |
| ||||
| Noninterest income |
|
211 |
|
|
207 |
|
|
637 |
|
|
592 |
| ||||
| |
|
|
|
|
|
|
|
|
|
|
| |||||
| Total revenue |
|
408 |
|
|
394 |
|
|
1,291 |
|
|
1,109 |
| ||||
| Provision for credit losses |
|
4 |
|
|
(8 |
) |
|
(5 |
) |
|
(8 |
) | ||||
| Noninterest expense |
|
271 |
|
|
256 |
|
|
787 |
|
|
775 |
| ||||
| Net income |
|
86 |
|
|
89 |
|
|
323 |
|
|
211 |
| ||||
| Shareholder value added |
|
72 |
|
|
77 |
|
|
282 |
|
|
174 |
| ||||
| Efficiency ratio |
|
66.5 |
% |
|
65.2 |
% |
|
61.0 |
% |
|
69.9 |
% | ||||
| |
|
|
|
|
|
|
|
|
|
|
| |||||
• |
Net interest income increased $286 million, or eight percent, primarily as a result of the margin impact of higher trading-related activities and the
Corporation’s overall asset and liability management strategies, partially offset by lower commercial loan levels. Net interest income on non-core deposit balances within the Global Treasury Services group declined during the quarter as
balances returned to more normal levels. |
• |
Noninterest income decreased $741 million, or 20 percent, primarily due to a sharp decline in trading account profits, partially offset by increases in
investment and brokerage services and service charges. Investment and brokerage services increased 38 percent to $478 million due to increased brokerage commissions due to higher customer volume. Service charges increased $37 million, or four
percent, as most corporate customers chose to pay higher fees rather than increase deposit balances in the lower rate environment. |
| Three Months Ended September 30 |
Nine Months Ended September 30 | |||||||||||
| (Dollars in millions) |
2002 |
2001 |
2002 |
2001 | ||||||||
| Trading account profits |
$ |
91 |
$ |
398 |
$ |
732 |
$ |
1,541 | ||||
| Trading-related net interest income |
|
485 |
|
417 |
|
1,387 |
|
1,182 | ||||
| |
|
|
|
|
|
|
| |||||
| Total trading-related revenue |
$ |
576 |
$ |
815 |
$ |
2,119 |
$ |
2,723 | ||||
| |
|
|
|
|
|
|
| |||||
| Trading-related revenue by product |
||||||||||||
| Foreign exchange |
$ |
127 |
$ |
138 |
$ |
389 |
$ |
419 | ||||
| Interest rate |
|
91 |
|
220 |
|
639 |
|
731 | ||||
| Credit(1) |
|
277 |
|
222 |
|
726 |
|
664 | ||||
| Equities |
|
79 |
|
209 |
|
308 |
|
757 | ||||
| Commodities |
|
2 |
|
26 |
|
57 |
|
152 | ||||
| |
|
|
|
|
|
|
| |||||
| Total trading-related revenue |
$ |
576 |
$ |
815 |
$ |
2,119 |
$ |
2,723 | ||||
| |
|
|
|
|
|
|
| |||||
(1) |
Credit includes fixed income and credit default swaps and hedges of credit exposure. |
| Three Months Ended September 30 |
Nine Months Ended September 30 | |||||||||||
| (Dollars in millions) |
2002 |
2001 |
2002 |
2001 | ||||||||
| Investment banking income |
||||||||||||
| Securities underwriting |
$ |
121 |
$ |
157 |
$ |
546 |
$ |
557 | ||||
| Syndications |
|
109 |
|
81 |
|
297 |
|
275 | ||||
| Advisory services |
|
62 |
|
32 |
|
200 |
|
157 | ||||
| Other |
|
11 |
|
20 |
|
31 |
|
71 | ||||
| |
|
|
|
|
|
|
| |||||
| Total |
$ |
303 |
$ |
290 |
$ |
1,074 |
$ |
1,060 | ||||
| |
|
|
|
|
|
|
| |||||
• |
Provision expense decreased $111 million, or 14 percent, due to a decline in loan levels and higher recoveries, partially offset by the impact of the weakened
economic environment. |
• |
A $273 million, or seven percent, decrease in noninterest expense was primarily due to lower revenue-related incentive compensation and the elimination of
goodwill amortization. Goodwill amortization expense for the nine months ended September 30, 2001 was $87 million. |
| Three Months Ended September 30 |
Nine Months Ended September 30 |
|||||||||||||||
| (Dollars in millions) |
2002 |
2001 |
2002 |
2001 |
||||||||||||
| Net interest income |
$ |
(37 |
) |
$ |
(35 |
) |
$ |
(116 |
) |
$ |
(108 |
) | ||||
| Noninterest income |
|
(193 |
) |
|
(25 |
) |
|
(222 |
) |
|
227 |
| ||||
| |
|
|
|
|
|
|
|
|
|
|
| |||||
| Total revenue |
|
(230 |
) |
|
(60 |
) |
|
(338 |
) |
|
119 |
| ||||
| Provision for credit losses |
|
— |
|
|
— |
|
|
— |
|
|
— |
| ||||
| Noninterest expense |
|
28 |
|
|
79 |
|
|
65 |
|
|
152 |
| ||||
| Net income (loss) |
|
(160 |
) |
|
(85 |
) |
|
(249 |
) |
|
(17 |
) | ||||
| Shareholder value added |
|
(222 |
) |
|
(156 |
) |
|
(438 |
) |
|
(224 |
) | ||||
| Efficiency ratio |
|
n/m |
|
|
n/m |
|
|
n/m |
|
|
127.6 |
% | ||||
| |
|
|
|
|
|
|
|
|
|
|
| |||||
| n/m = not meaningful | ||||||||||||||||
• |
Net interest income consists primarily of the funding cost associated with the carrying value of investments. |
• |
Equity investment gains (losses) decreased $512 million to $(229) million. The decrease was the result of weakness in equity markets in 2002 and a $140 million
gain in the strategic investments portfolio in the first quarter of 2001 related to the sale of an interest in the Star Systems ATM network. For the nine months ended September 30, 2002, Principal Investing recorded cash gains of $319 million,
offset by fair value adjustment losses of $11 million and impairment charges of $535 million. The impairment charges in the third quarter of 2002 included one large individual charge within the international telecom sector. For the nine months ended
September 30, 2001, Principal Investing recorded cash gains of $343 million, offset by fair value adjustment losses of $135 million and impairment charges of $96 million. Impairments recorded in both 2002 and 2001 were driven by continuing depressed
levels of economic activity across many sectors and weakness in capital markets, which were compounded by the impacts of September 11, 2001. The Corporation recognized a reduction in values of certain equity positions primarily within the
technology, media and telecom portfolios as well as value adjustments across many other industries both domestically and internationally. |
| (Dollars in millions) |
Expires in 1 year or less |
Expires after 1
year through 3 years |
Expires after 3
years through 5 years |
Expires after 5
years |
Total | ||||||||||
| Loan commitments(1) |
$ |
107,053 |
$ |
44,176 |
$ |
28,878 |
$ |
40,370 |
$ |
220,477 | |||||
| Standby letters of credit and financial guarantees |
|
20,485 |
|
6,345 |
|
756 |
|
3,593 |
|
31,179 | |||||
| Commercial letters of credit |
|
3,473 |
|
172 |
|
— |
|
325 |
|
3,970 | |||||
| Credit card lines |
|
73,120 |
|
— |
|
— |
|
— |
|
73,120 | |||||
| |
|
|
|
|
|
|
|
|
| ||||||
| Total credit extension commitments |
$ |
204,131 |
$ |
50,693 |
$ |
29,634 |
$ |
44,288 |
$ |
328,746 | |||||
| |
|
|
|
|
|
|
|
|
| ||||||
(1) |
Equity commitments primarily related to obligations to fund existing venture capital equity investments are included in loan commitments.
|
| September 30, 2002 |
December 31, 2001 | |||||||||||||||||
| Actual |
Minimum Required(1) |
Actual |
Minimum Required(1) | |||||||||||||||
| (Dollars in millions) |
Ratio |
Amount |
Ratio |
Amount |
||||||||||||||
| Tier 1 Capital |
||||||||||||||||||
| Bank of America Corporation |
8.13 |
% |
$ |
41,732 |
$ |
20,523 |
8.30 |
% |
$ |
41,972 |
$ |
20,243 | ||||||
| Bank of America, N.A. |
8.74 |
|
|
39,950 |
|
18,286 |
9.25 |
|
|
42,161 |
|
18,225 | ||||||
| Total Capital |
||||||||||||||||||
| Bank of America Corporation |
12.38 |
|
|
63,505 |
|
41,047 |
12.67 |
|
|
64,118 |
|
40,487 | ||||||
| Bank of America, N.A. |
11.58 |
|
|
52,918 |
|
36,572 |
12.55 |
|
|
57,192 |
|
36,450 | ||||||
| Leverage |
||||||||||||||||||
| Bank of America Corporation |
6.35 |
|
|
41,732 |
|
26,282 |
6.56 |
|
|
41,972 |
|
25,604 | ||||||
| Bank of America, N.A. |
7.02 |
|
|
39,950 |
|
22,769 |
7.59 |
|
|
42,161 |
|
22,233 | ||||||
| |
|
|
|
|
|
|
|
|
|
|
| |||||||
(1) |
Dollar amount required to meet guidelines for adequately capitalized institutions. |
| Outstanding Loans and Leases |
Nonperforming Assets(1) |
|||||||||||||||||||
| September 30 2002 |
December 31 2001 |
September 30 2002 |
December 31 2001 |
|||||||||||||||||
| (Dollars in millions) |
Amount |
Percent |
Amount |
Percent |
Amount |
Amount |
||||||||||||||
| Commercial — domestic |
$ |
105,240 |
30.8 |
% |
$ |
118,205 |
35.9 |
% |
$ |
3,132 |
|
$ |
3,123 |
| ||||||
| Commercial — foreign |
|
20,677 |
6.1 |
|
|
23,039 |
7.0 |
|
|
854 |
|
|
461 |
| ||||||
| Commercial real estate — domestic |
|
20,707 |
6.1 |
|
|
22,271 |
6.8 |
|
|
172 |
|
|
240 |
| ||||||
| Commercial real estate — foreign |
|
447 |
0.1 |
|
|
383 |
0.1 |
|
|
3 |
|
|
3 |
| ||||||
| |
|
|
|
|
|
|
|
|
|
|
|
|
| |||||||
| Total commercial |
|
147,071 |
43.1 |
|
|
163,898 |
49.8 |
|
|
4,161 |
|
|
3,827 |
| ||||||
| |
|
|
|
|
|
|
|
|
|
|
|
|
| |||||||
| Residential mortgage |
|
105,617 |
31.0 |
|
|
78,203 |
23.8 |
|
|
585 |
|
|
556 |
| ||||||
| Home equity lines |
|
23,464 |
6.9 |
|
|
22,107 |
6.7 |
|
|
57 |
|
|
80 |
| ||||||
| Direct/Indirect consumer(2) |
|
30,417 |
8.9 |
|
|
30,317 |
9.2 |
|
|
31 |
|
|
27 |
| ||||||
| Consumer finance(2) |
|
9,495 |
2.8 |
|
|
12,652 |
3.9 |
|
|
8 |
|
|
9 |
| ||||||
| Bankcard |
|
23,062 |
6.8 |
|
|
19,884 |
6.0 |
|
|
— |
|
|
— |
| ||||||
| Foreign consumer |
|
1,965 |
0.5 |
|
|
2,092 |
0.6 |
|
|
7 |
|
|
7 |
| ||||||
| |
|
|
|
|
|
|
|
|
|
|
|
|
| |||||||
| Total consumer |
|
194,020 |
56.9 |
|
|
165,255 |
50.2 |
|
|
688 |
|
|
679 |
| ||||||
| |
|
|
|
|
|
|
|
|
|
|
|
|
| |||||||
| Total nonperforming loans |
|
4,849 |
|
|
4,506 |
| ||||||||||||||
| |
|
|
|
|
| |||||||||||||||
| Foreclosed properties |
|
282 |
|
|
402 |
| ||||||||||||||
| |
|
|
|
|
| |||||||||||||||
| Total |
$ |
341,091 |
100.0 |
% |
$ |
329,153 |
100.0 |
% |
$ |
5,131 |
|
$ |
4,908 |
| ||||||
| |
|
|
|
|
|
|
|
|
|
|
|
|
| |||||||
| Nonperforming assets as a percentage of: |
||||||||||||||||||||
| Total assets |
|
0.78 |
% |
|
0.79 |
% | ||||||||||||||
| Outstanding loans, leases and foreclosed properties |
|
1.50 |
|
|
1.49 |
| ||||||||||||||
| Nonperforming loans as a percentage of outstanding loans and leases |
|
1.42 |
|
|
1.37 |
| ||||||||||||||
| Loans past due 90 days or more and still accruing interest |
$ |
726 |
|
$ |
680 |
| ||||||||||||||
| |
|
|
|
|
| |||||||||||||||
| Net Charge-offs(3) |
||||||||||||||||||||||||
| Three Months Ended September 30 |
Nine Months Ended September 30 |
|||||||||||||||||||||||
| 2002 |
2001 |
2002 |
2001 |
|||||||||||||||||||||
| (Dollars in millions) |
Amount |
Percent |
Amount |
Percent |
Amount |
Percent |
Amount |
Percent |
||||||||||||||||
| Commercial — domestic |
$ |
240 |
0.90 |
% |
$ |
412 |
1.26 |
% |
$ |
993 |
1.19 |
% |
$ |
1,235 |
1.20 |
% | ||||||||
| Commercial — foreign |
|
148 |
2.77 |
|
|
57 |
0.89 |
|
|
317 |
1.97 |
|
|
148 |
0.72 |
| ||||||||
| Commercial real estate — domestic |
|
6 |
0.12 |
|
|
4 |
0.07 |
|
|
27 |
0.17 |
|
|
22 |
0.12 |
| ||||||||
| |
|
|
|
|
|
|
|
|
|
|
|
|
|
|
| |||||||||
| Total commercial |
|
394 |
1.05 |
|
|
473 |
1.05 |
|
|
1,337 |
1.16 |
|
|
1,405 |
0.99 |
| ||||||||
| |
|
|
|
|
|
|
|
|
|
|
|
|
|
|
| |||||||||
| Residential mortgage |
|
5 |
0.02 |
|
|
7 |
0.04 |
|
|
24 |
0.03 |
|
|
20 |
0.03 |
| ||||||||
| Home equity lines |
|
5 |
0.08 |
|
|
4 |
0.07 |
|
|
20 |
0.12 |
|
|
14 |
0.08 |
| ||||||||
| Direct/Indirect consumer(2) |
|
48 |
0.63 |
|
|
68 |
0.87 |
|
|
150 |
0.66 |
|
|
167 |
0.74 |
| ||||||||
| Consumer finance(2,4) |
|
54 |
2.13 |
|
|
746 |
11.75 |
|
|
177 |
2.14 |
|
|
947 |
3.87 |
| ||||||||
| Bankcard |
|
285 |
5.09 |
|
|
181 |
4.08 |
|
|
796 |
5.14 |
|
|
464 |
3.89 |
| ||||||||
| Other consumer — domestic(5) |
|
11 |
n/m |
|
|
11 |
n/m |
|
|
25 |
n/m |
|
|
30 |
n/m |
| ||||||||
| Foreign consumer |
|
2 |
0.32 |
|
|
1 |
0.21 |
|
|
3 |
0.20 |
|
|
3 |
0.21 |
| ||||||||
| |
|
|
|
|
|
|
|
|
|
|
|
|
|
|
| |||||||||
| Total consumer |
|
410 |
0.85 |
|
|
1,018 |
2.27 |
|
|
1,195 |
0.89 |
|
|
1,645 |
1.18 |
| ||||||||
| |
|
|
|
|
|
|
|
|
|
|
|
|
|
|
| |||||||||
| Total net charge-offs |
$ |
804 |
0.94 |
% |
$ |
1,491 |
1.65 |
% |
$ |
2,532 |
1.01 |
% |
$ |
3,050 |
1.08 |
% | ||||||||
| |
|
|
|
|
|
|
|
|
|
|
|
|
|
|
| |||||||||
| Managed bankcard net losses and ratios(6) |
$ |
356 |
5.13 |
% |
$ |
307 |
4.81 |
% |
$ |
1,086 |
5.38 |
% |
$ |
852 |
4.71 |
% | ||||||||
| |
|
|
|
|
|
|
|
|
|
|
|
|
|
|
| |||||||||
(1) |
Balance does not include $184 million and $1.0 billion of nonperforming assets included in other assets at September 30, 2002 and December 31, 2001,
respectively. The Corporation had approximately $14 million and $48 million of troubled debt restructured loans at September 30, 2002 and December 31, 2001, respectively, which were accruing interest and were not included in nonperforming assets.
|
(2) |
In the second quarter of 2002, the auto lease receivable portfolio was reclassified from direct/indirect consumer loans to consumer finance loans for all
periods presented. |
(3) |
Percentage amounts are calculated as annualized net charge-offs divided by average outstanding loans and leases during the period for each loan category.
|
(4) |
Includes $635 million related to the exit of the subprime real estate lending business in the third quarter of 2001. |
(5) |
Represents charge-offs of overdrafts on checking accounts. |
(6) |
Includes both on-balance sheet and securitized loans. |
| (Dollars in millions) |
Third Quarter 2002 |
Second Quarter 2002 |
First Quarter 2002 |
Fourth Quarter 2001 |
Third Quarter 2001 |
|||||||||||||||
| Balance, beginning of period |
$ |
4,939 |
|
$ |
4,992 |
|
$ |
4,908 |
|
$ |
4,523 |
|
$ |
6,195 |
| |||||
| |
|
|
|
|
|
|
|
|
|
|
|
|
|
| ||||||
| Commercial |
||||||||||||||||||||
| Additions to nonperforming assets: |
||||||||||||||||||||
| New nonaccrual loans and foreclosed properties |
|
1,140 |
|
|
1,123 |
|
|
1,373 |
|
|
1,345 |
|
|
761 |
| |||||
| Advances on loans |
|
39 |
|
|
124 |
|
|
24 |
|
|
106 |
|
|
32 |
| |||||
| |
|
|
|
|
|
|
|
|
|
|
|
|
|
| ||||||
| Total commercial additions |
|
1,179 |
|
|
1,247 |
|
|
1,397 |
|
|
1,451 |
|
|
793 |
| |||||
| |
|
|
|
|
|
|
|
|
|
|
|
|
|
| ||||||
| Reductions in nonperforming assets: |
||||||||||||||||||||
| Paydowns, payoffs and sales |
|
(498 |
) |
|
(598 |
) |
|
(570 |
) |
|
(300 |
) |
|
(635 |
) | |||||
| Returns to performing status |
|
(45 |
) |
|
(48 |
) |
|
(33 |
) |
|
(82 |
) |
|
(86 |
) | |||||
| Charge-offs(1) |
|
(499 |
) |
|
(582 |
) |
|
(538 |
) |
|
(784 |
) |
|
(513 |
) | |||||
| |
|
|
|
|
|
|
|
|
|
|
|
|
|
| ||||||
| Total commercial reductions |
|
(1,042 |
) |
|
(1,228 |
) |
|
(1,141 |
) |
|
(1,166 |
) |
|
(1,234 |
) | |||||
| |
|
|
|
|
|
|
|
|
|
|
|
|
|
| ||||||
| Total commercial net additions to (reductions in) nonperforming assets |
|
137 |
|
|
19 |
|
|
256 |
|
|
285 |
|
|
(441 |
) | |||||
| |
|
|
|
|
|
|
|
|
|
|
|
|
|
| ||||||
| Consumer |
||||||||||||||||||||
| Additions to nonperforming assets: |
||||||||||||||||||||
| New nonaccrual loans and foreclosed properties |
|
442 |
|
|
405 |
|
|
375 |
|
|
374 |
|
|
694 |
| |||||
| |
|
|
|
|
|
|
|
|
|
|
|
|
|
| ||||||
| Total consumer additions |
|
442 |
|
|
405 |
|
|
375 |
|
|
374 |
|
|
694 |
| |||||
| |
|
|
|
|
|
|
|
|
|
|
|
|
|
| ||||||
| Reductions in nonperforming assets: |
||||||||||||||||||||
| Paydowns, payoffs and sales |
|
(186 |
) |
|
(223 |
) |
|
(318 |
) |
|
(174 |
) |
|
(413 |
) | |||||
| Returns to performing status |
|
(183 |
) |
|
(240 |
) |
|
(265 |
) |
|
(181 |
) |
|
(256 |
) | |||||
| Charge-offs(1) |
|
(20 |
) |
|
(24 |
) |
|
(29 |
) |
|
(22 |
) |
|
(69 |
) | |||||
| Transfers (to) from assets held for sale(2,3) |
|
2 |
|
|
10 |
|
|
65 |
|
|
103 |
|
|
(1,187 |
) | |||||
| |
|
|
|
|
|
|
|
|
|
|
|
|
|
| ||||||
| Total consumer reductions |
|
(387 |
) |
|
(477 |
) |
|
(547 |
) |
|
(274 |
) |
|
(1,925 |
) | |||||
| |
|
|
|
|
|
|
|
|
|
|
|
|
|
| ||||||
| Total consumer net additions to (reductions in) nonperforming assets |
|
55 |
|
|
(72 |
) |
|
(172 |
) |
|
100 |
|
|
(1,231 |
) | |||||
| |
|
|
|
|
|
|
|
|
|
|
|
|
|
| ||||||
| Total net additions to (reductions in) nonperforming assets |
|
192 |
|
|
(53 |
) |
|
84 |
|
|
385 |
|
|
(1,672 |
) | |||||
| |
|
|
|
|
|
|
|
|
|
|
|
|
|
| ||||||
| Balance, end of period |
$ |
5,131 |
|
$ |
4,939 |
|
$ |
4,992 |
|
$ |
4,908 |
|
$ |
4,523 |
| |||||
| |
|
|
|
|
|
|
|
|
|
|
|
|
|
| ||||||
(1) |
Certain loan products, including commercial bankcard and consumer non-real estate secured loans, are not classified as nonperforming; therefore, the
charge-offs on these loans are not included above. |
(2) |
Transfers from assets held for sale include assets held for sale that were foreclosed and transferred to foreclosed properties.
|
(3) |
In the third quarter of 2001, the transfer to assets held for sale was primarily related to the exit of the subprime real estate lending business.
|
| (Dollars in millions) |
Loans |
Letters of Credit |
Trading Exposure |
Total Exposure |
||||||||||||
| Balance, December 31, 2001, before charge-offs/write-downs |
$ |
457 |
|
$ |
44 |
|
$ |
2 |
|
$ |
503 |
| ||||
| |
|
|
|
|
|
|
|
|
|
|
| |||||
| Charge-offs/write-downs |
|
(231 |
) |
|
— |
|
|
— |
|
|
(231 |
) | ||||
| |
|
|
|
|
|
|
|
|
|
|
| |||||
| Balance, December 31, 2001 |
$ |
226 |
|
$ |
44 |
|
$ |
2 |
|
$ |
272 |
| ||||
| |
|
|
|
|
|
|
|
|
|
|
| |||||
| Charge-offs |
|
(48 |
) |
|
— |
|
|
— |
|
|
(48 |
) | ||||
| Other(1) |
|
(17 |
) |
|
(24 |
) |
|
(2 |
) |
|
(43 |
) | ||||
| |
|
|
|
|
|
|
|
|
|
|
| |||||
| Balance, September 30, 2002 |
$ |
161 |
|
$ |
20 |
|
$ |
— |
|
$ |
181 |
| ||||
| |
|
|
|
|
|
|
|
|
|
|
| |||||
(1) |
Other includes changes due to loan sales, paydowns, drawn letters of credit moving to loans and cancellations. |
| Table Thirteen |
||||||||||||
| Allocation of the Allowance for Credit Losses |
||||||||||||
| September 30, 2002 |
December 31, 2001 |
|||||||||||
| (Dollars in millions) |
Amount |
Percent |
Amount |
Percent |
||||||||
| Commercial non-impaired |
$ |
2,753 |
40.1 |
% |
$ |
2,939 |
42.7 |
% | ||||
| Commercial impaired |
|
732 |
11.1 |
|
|
733 |
10.7 |
| ||||
| |
|
|
|
|
|
|
| |||||
| Total commercial |
|
3,485 |
51.2 |
|
|
3,672 |
53.4 |
| ||||
| Total consumer |
|
2,003 |
29.2 |
|
|
1,859 |
27.0 |
| ||||
| Unassigned |
|
1,373 |
19.6 |
|
|
1,344 |
19.6 |
| ||||
| |
|
|
|
|
|
|
| |||||
| Total |
$ |
6,861 |
100.0 |
% |
$ |
6,875 |
100.0 |
% | ||||
| |
|
|
|
|
|
|
| |||||
| (Dollars in millions) |
Three Months Ended September 30 |
Nine Months Ended September 30 |
||||||||||||||
| 2002 |
2001 |
2002 |
2001 |
|||||||||||||
| Balance, beginning of period |
$ |
6,873 |
|
$ |
6,911 |
|
$ |
6,875 |
|
$ |
6,838 |
| ||||
| |
|
|
|
|
|
|
|
|
|
|
| |||||
| Loans and leases charged off |
||||||||||||||||
| Commercial — domestic |
|
(344 |
) |
|
(471 |
) |
|
(1,268 |
) |
|
(1,376 |
) | ||||
| Commercial — foreign |
|
(153 |
) |
|
(71 |
) |
|
(351 |
) |
|
(179 |
) | ||||
| Commercial real estate — domestic |
|
(8 |
) |
|
(5 |
) |
|
(33 |
) |
|
(27 |
) | ||||
| |
|
|
|
|
|
|
|
|
|
|
| |||||
| Total commercial |
|
(505 |
) |
|
(547 |
) |
|
(1,652 |
) |
|
(1,582 |
) | ||||
| |
|
|
|
|
|
|
|
|
|
|
| |||||
| Residential mortgage |
|
(10 |
) |
|
(11 |
) |
|
(35 |
) |
|
(30 |
) | ||||
| Home equity lines |
|
(8 |
) |
|
(8 |
) |
|
(30 |
) |
|
(23 |
) | ||||
| Direct/Indirect consumer(1) |
|
(80 |
) |
|
(99 |
) |
|
(264 |
) |
|
(274 |
) | ||||
| Consumer finance(1,2) |
|
(72 |
) |
|
(768 |
) |
|
(239 |
) |
|
(1,038 |
) | ||||
| Bankcard |
|
(310 |
) |
|
(204 |
) |
|
(882 |
) |
|
(524 |
) | ||||
| Other consumer — domestic |
|
(15 |
) |
|
(16 |
) |
|
(42 |
) |
|
(48 |
) | ||||
| Foreign consumer |
|
(2 |
) |
|
(1 |
) |
|
(3 |
) |
|
(4 |
) | ||||
| |
|
|
|
|
|
|
|
|
|
|
| |||||
| Total consumer |
|
(497 |
) |
|
(1,107 |
) |
|
(1,495 |
) |
|
(1,941 |
) | ||||
| |
|
|
|
|
|
|
|
|
|
|
| |||||
| Total loans and leases charged off |
|
(1,002 |
) |
|
(1,654 |
) |
|
(3,147 |
) |
|
(3,523 |
) | ||||
| |
|
|
|
|
|
|
|
|
|
|
| |||||
| Recoveries of loans and leases previously charged off |
||||||||||||||||
| Commercial — domestic |
|
104 |
|
|
59 |
|
|
275 |
|
|
141 |
| ||||
| Commercial — foreign |
|
5 |
|
|
14 |
|
|
34 |
|
|
31 |
| ||||
| Commercial real estate — domestic |
|
2 |
|
|
1 |
|
|
6 |
|
|
5 |
| ||||
| |
|
|
|
|
|
|
|
|
|
|
| |||||
| Total commercial |
|
111 |
|
|
74 |
|
|
315 |
|
|
177 |
| ||||
| |
|
|
|
|
|
|
|
|
|
|
| |||||
| Residential mortgage |
|
5 |
|
|
4 |
|
|
11 |
|
|
10 |
| ||||
| Home equity lines |
|
3 |
|
|
4 |
|
|
10 |
|
|
9 |
| ||||
| Direct/Indirect consumer(1) |
|
32 |
|
|
31 |
|
|
114 |
|
|
106 |
| ||||
| Consumer finance(1) |
|
18 |
|
|
22 |
|
|
62 |
|
|
92 |
| ||||
| Bankcard |
|
25 |
|
|
23 |
|
|
86 |
|
|
60 |
| ||||
| Other consumer — domestic |
|
4 |
|
|
5 |
|
|
17 |
|
|
18 |
| ||||
| Foreign consumer |
|
— |
|
|
— |
|
|
— |
|
|
1 |
| ||||
| |
|
|
|
|
|
|
|
|
|
|
| |||||
| Total consumer |
|
87 |
|
|
89 |
|
|
300 |
|
|
296 |
| ||||
| |
|
|
|
|
|
|
|
|
|
|
| |||||
| Total recoveries of loans and leases previously charged off |
|
198 |
|
|
163 |
|
|
615 |
|
|
473 |
| ||||
| |
|
|
|
|
|
|
|
|
|
|
| |||||
| Net charge-offs |
|
(804 |
) |
|
(1,491 |
) |
|
(2,532 |
) |
|
(3,050 |
) | ||||
| |
|
|
|
|
|
|
|
|
|
|
| |||||
| Provision for credit losses(3) |
|
804 |
|
|
1,251 |
|
|
2,532 |
|
|
2,886 |
| ||||
| Other, net |
|
(12 |
) |
|
(6 |
) |
|
(14 |
) |
|
(9 |
) | ||||
| |
|
|
|
|
|
|
|
|
|
|
| |||||
| Balance, September 30 |
$ |
6,861 |
|
$ |
6,665 |
|
$ |
6,861 |
|
$ |
6,665 |
| ||||
| |
|
|
|
|
|
|
|
|
|
|
| |||||
| Loans and leases outstanding at September 30 |
$ |
341,091 |
|
$ |
339,018 |
|
$ |
341,091 |
|
$ |
339,018 |
| ||||
| Allowance for credit losses as a percentage of loans and leases outstanding at September 30 |
|
2.01 |
% |
|
1.97 |
% |
|
2.01 |
% |
|
1.97 |
% | ||||
| Average loans and leases outstanding during the period |
$ |
340,484 |
|
$ |
357,726 |
|
$ |
334,703 |
|
$ |
376,261 |
| ||||
| Annualized net charge-offs as a percentage of average outstanding loans and leases during the period(2) |
|
0.94 |
% |
|
1.65 |
% |
|
1.01 |
% |
|
1.08 |
% | ||||
| Allowance for credit losses as a percentage of nonperforming loans at September 30 |
|
141.50 |
|
|
161.81 |
|
|
141.50 |
|
|
161.81 |
| ||||
| |
|
|
|
|
|
|
|
|
|
|
| |||||
| (1) In the second quarter of 2002, the auto lease receivable portfolio was
reclassified from direct/indirect consumer loans to consumer finance loans for all periods presented. | ||||||||||||||||
| (2) Includes $635 million related to the exit of the subprime lending business in
the third quarter of 2001. | ||||||||||||||||
| (3) Includes $395 million related to the exit of the subprime lending business in
the third quarter of 2001. | ||||||||||||||||
| Loans |
Foreclosed Properties(1) | ||||||||
| (Dollars in millions) |
Outstanding |
Nonperforming |
|||||||
| By Geographic Region(2) |
|||||||||
| California |
$ |
5,375 |
$ |
60 |
$ |
— | |||
| Southwest |
|
2,967 |
|
33 |
|
3 | |||
| Florida |
|
2,532 |
|
26 |
|
3 | |||
| Northwest |
|
2,235 |
|
12 |
|
3 | |||
| Mid-Atlantic |
|
1,749 |
|
8 |
|
5 | |||
| Midwest |
|
1,730 |
|
10 |
|
15 | |||
| Carolinas |
|
1,585 |
|
8 |
|
6 | |||
| Midsouth |
|
1,214 |
|
6 |
|
3 | |||
| Northeast |
|
744 |
|
9 |
|
21 | |||
| Geographically diversified |
|
162 |
|
— |
|
— | |||
| Other states |
|
414 |
|
— |
|
88 | |||
| Non-US |
|
447 |
|
3 |
|
— | |||
| |
|
|
|
|
| ||||
| Total |
$ |
21,154 |
$ |
175 |
$ |
147 | |||
| |
|
|
|
|
| ||||
| By Property Type |
|||||||||
| Office buildings |
$ |
4,513 |
$ |
12 |
$ |
1 | |||
| Apartments |
|
3,697 |
|
19 |
|
— | |||
| Residential |
|
3,053 |
|
14 |
|
— | |||
| Shopping centers/retail |
|
2,443 |
|
18 |
|
— | |||
| Industrial/warehouse |
|
2,134 |
|
35 |
|
14 | |||
| Land and land development |
|
1,231 |
|
— |
|
4 | |||
| Hotels/motels |
|
894 |
|
25 |
|
5 | |||
| Multiple use |
|
741 |
|
1 |
|
— | |||
| Miscellaneous commercial |
|
425 |
|
6 |
|
1 | |||
| Unsecured |
|
265 |
|
— |
|
— | |||
| Other |
|
1,311 |
|
42 |
|
122 | |||
| Non-US |
|
447 |
|
3 |
|
— | |||
| |
|
|
|
|
| ||||
| Total |
$ |
21,154 |
$ |
175 |
$ |
147 | |||
| |
|
|
|
|
| ||||
| (1) Foreclosed properties includes commercial real estate loans
only. |
|||||||||
| (2) Distribution based on geographic location of collateral. |
|||||||||
| September 30, 2002 |
December 31, 2001 | |||||||||
| (Dollars in millions) |
Outstanding |
Percent of Outstanding Loans and Leases |
Outstanding |
Percent of Outstanding Loans and Leases | ||||||
| Transportation |
$ |
8,826 |
2.6% |
$ |
10,350 |
3.1% | ||||
| Media |
|
7,374 |
2.2 |
|
6,704 |
2.0 | ||||
| Business services |
|
6,918 |
2.0 |
|
7,569 |
2.3 | ||||
| Agribusiness |
|
5,277 |
1.5 |
|
6,390 |
1.9 | ||||
| Equipment and general manufacturing |
|
5,184 |
1.5 |
|
6,648 |
2.0 | ||||
| Education and government |
|
4,975 |
1.5 |
|
4,198 |
1.3 | ||||
| Autos |
|
4,669 |
1.4 |
|
5,290 |
1.6 | ||||
| Healthcare and pharmaceuticals |
|
4,549 |
1.3 |
|
5,444 |
1.7 | ||||
| Utilities |
|
4,274 |
1.3 |
|
3,759 |
1.1 | ||||
| Retail |
|
4,189 |
1.2 |
|
4,450 |
1.4 | ||||
| Other(2,3) |
|
69,682 |
20.4 |
|
80,442 |
24.4 | ||||
| |
|
|
|
|
| |||||
| Total |
$ |
125,917 |
36.9% |
$ |
141,244 |
42.9% | ||||
| |
|
|
|
|
| |||||
(1) |
Includes only non-real estate commercial outstanding loans and leases. |
(2) |
At September 30, 2002, Other includes $8,898 of commercial loans to individuals and trusts, representing 2.6% of outstanding loans and leases. The remaining
balance in Other includes loans to 26 industries, the 10 largest of which are telecommunications, oil & gas, finance companies, food & beverage, sports & amusement, metals & mining, chemicals & plastics, securities, religious,
professional & social organizations and restaurants. The outstanding loans and leases related to these 10 industries totaled $29,125 and $32,304 at September 30, 2002 and December 31, 2001, respectively. |
(3) |
Total loans and leases outstanding to companies in the telecommunications industry were $3,600 at September 30, 2002. Credit exposure (including loans and
leases, letters of credit, derivatives, assets held for sale and binding commitments) to companies in the telecommunications industry that were in bankruptcy totaled $153 at September 30, 2002, with associated reserves of $34. Net charge-offs
associated with exposure to companies in the telecommunications industry that were in bankruptcy were $111 for the nine months ended September 30, 2002. |
| Table Seventeen |
|||||||||||||||||||||||||
| Selected Regional Foreign Exposure |
|||||||||||||||||||||||||
| (Dollars in millions) |
Loans and Loan Commitments |
Other Financing(1) |
Derivatives (Net Positive Mark-to- Market) |
Securities/ Other Investments(2) |
Total Cross-border Exposure(3) |
Gross Local Country Exposure(4) |
Total Binding Exposure September 30, 2002 |
Increase/ (Decrease) from December 31, 2001 |
|||||||||||||||||
| Region/Country |
|||||||||||||||||||||||||
| Asia |
|||||||||||||||||||||||||
| China |
$ |
60 |
$ |
5 |
$ |
32 |
$ |
39 |
$ |
136 |
$ |
60 |
$ |
196 |
$ |
(79 |
) | ||||||||
| Hong Kong(5) |
|
166 |
|
31 |
|
51 |
|
109 |
|
357 |
|
3,512 |
|
3,869 |
|
(386 |
) | ||||||||
| India |
|
462 |
|
73 |
|
57 |
|
32 |
|
624 |
|
868 |
|
1,492 |
|
(288 |
) | ||||||||
| Indonesia |
|
107 |
|
— |
|
18 |
|
20 |
|
145 |
|
3 |
|
148 |
|
(127 |
) | ||||||||
| Japan |
|
384 |
|
51 |
|
492 |
|
1,915 |
|
2,842 |
|
694 |
|
3,536 |
|
291 |
| ||||||||
| Korea (South) |
|
259 |
|
321 |
|
18 |
|
26 |
|
624 |
|
622 |
|
1,246 |
|
36 |
| ||||||||
| Malaysia |
|
31 |
|
3 |
|
— |
|
8 |
|
42 |
|
219 |
|
261 |
|
(85 |
) | ||||||||
| Pakistan |
|
9 |
|
— |
|
— |
|
— |
|
9 |
|
— |
|
9 |
|
(10 |
) | ||||||||
| Philippines |
|
28 |
|
39 |
|
4 |
|
8 |
|
79 |
|
123 |
|
202 |
|
(120 |
) | ||||||||
| Singapore |
|
178 |
|
8 |
|
88 |
|
20 |
|
294 |
|
1,027 |
|
1,321 |
|
(77 |
) | ||||||||
| Taiwan |
|
280 |
|
141 |
|
41 |
|
26 |
|
488 |
|
652 |
|
1,140 |
|
227 |
| ||||||||
| Thailand |
|
37 |
|
6 |
|
23 |
|
24 |
|
90 |
|
196 |
|
286 |
|
(102 |
) | ||||||||
| Other |
|
3 |
|
18 |
|
1 |
|
— |
|
22 |
|
94 |
|
116 |
|
(4 |
) | ||||||||
| |
|
|
|
|
|
|
|
|
|
|
|
|
|
|
|
| |||||||||
| Total |
$ |
2,004 |
$ |
696 |
$ |
825 |
$ |
2,227 |
$ |
5,752 |
$ |
8,070 |
$ |
13,822 |
$ |
(724 |
) | ||||||||
| |
|
|
|
|
|
|
|
|
|
|
|
|
|
|
|
| |||||||||
| Central and Eastern Europe |
|||||||||||||||||||||||||
| Russian Federation |
$ |
— |
$ |
— |
$ |
— |
$ |
14 |
$ |
14 |
$ |
— |
$ |
14 |
$ |
14 |
| ||||||||
| Turkey |
|
14 |
|
9 |
|
— |
|
42 |
|
65 |
|
— |
|
65 |
|
(62 |
) | ||||||||
| Other |
|
16 |
|
12 |
|
24 |
|
338 |
|
390 |
|
39 |
|
429 |
|
163 |
| ||||||||
| |
|
|
|
|
|
|
|
|
|
|
|
|
|
|
|
| |||||||||
| Total |
$ |
30 |
$ |
21 |
$ |
24 |
$ |
394 |
$ |
469 |
$ |
39 |
$ |
508 |
$ |
115 |
| ||||||||
| |
|
|
|
|
|
|
|
|
|
|
|
|
|
|
|
| |||||||||
| Latin America |
|||||||||||||||||||||||||
| Argentina |
$ |
302 |
$ |
45 |
$ |
16 |
$ |
62 |
$ |
425 |
$ |
81 |
$ |
506 |
$ |
(239 |
) | ||||||||
| Brazil |
|
387 |
|
261 |
|
122 |
|
174 |
|
944 |
|
603 |
|
1,547 |
|
(927 |
) | ||||||||
| Chile |
|
143 |
|
12 |
|
9 |
|
2 |
|
166 |
|
— |
|
166 |
|
(83 |
) | ||||||||
| Colombia |
|
88 |
|
9 |
|
18 |
|
7 |
|
122 |
|
— |
|
122 |
|
(17 |
) | ||||||||
| Mexico |
|
902 |
|
196 |
|
150 |
|
430 |
|
1,678 |
|
214 |
|
1,892 |
|
(335 |
) | ||||||||
| Venezuela |
|
111 |
|
4 |
|
5 |
|
114 |
|
234 |
|
8 |
|
242 |
|
1 |
| ||||||||
| Other |
|
126 |
|
73 |
|
88 |
|
30 |
|
317 |
|
— |
|
317 |
|
21 |
| ||||||||
| |
|
|
|
|
|
|
|
|
|
|
|
|
|
|
|
| |||||||||
| Total |
$ |
2,059 |
$ |
600 |
$ |
408 |
$ |
819 |
$ |
3,886 |
$ |
906 |
$ |
4,792 |
$ |
(1,579 |
) | ||||||||
| |
|
|
|
|
|
|
|
|
|
|
|
|
|
|
|
| |||||||||
| Total |
$ |
4,093 |
$ |
1,317 |
$ |
1,257 |
$ |
3,440 |
$ |
10,107 |
$ |
9,015 |
$ |
19,122 |
$ |
(2,188 |
) | ||||||||
| |
|
|
|
|
|
|
|
|
|
|
|
|
|
|
|
| |||||||||
(1) |
Includes acceptances, standby letters of credit, commercial letters of credit and formal guarantees. |
(2) |
Amounts outstanding in the table above for Philippines, Argentina, Mexico, Venezuela and Latin America Other have been reduced by $12 million, $93 million,
$507 million, $131 million and $37 million, respectively, at September 30, 2002, and $10 million, $0, $436 million, $105 million and $32 million, respectively, at December 31, 2001. Such amounts represent the fair value of U.S. Treasury securities
held as collateral outside the country of exposure. |
(3) |
Cross-border exposure includes amounts payable to the Corporation by residents of countries other than the one in which the credit is booked, regardless of
the currency in which the claim is denominated, consistent with FFIEC reporting rules. |
(4) |
Gross local country exposure includes amounts payable to the Corporation by residents of countries in which the credit is booked, regardless of the currency
in which the claim is denominated. Management does not net local funding or liabilities against local exposures as allowed by the FFIEC. |
(5) |
Gross local country exposure to Hong Kong consisted of $1.8 billion of consumer loans and $1.7 billion of commercial exposure at September 30, 2002. The
consumer loans were collateralized primarily by residential real estate. The commercial exposure was primarily to local clients and was diversified across many industries. |
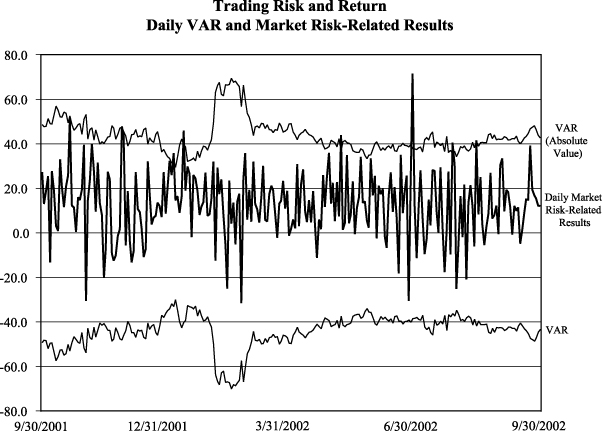
| Twelve Months Ended September 30 | ||||||||||||||||||
| 2002 |
2001 | |||||||||||||||||
| (Dollars in millions) |
Average VAR(1) |
High VAR(2) |
Low VAR(2) |
Average VAR(1) |
High VAR(2) |
Low VAR(2) | ||||||||||||
| Foreign exchange |
$ |
3.6 |
$ |
10.4 |
$ |
0.5 |
$ |
8.6 |
$ |
15.5 |
$ |
5.0 | ||||||
| Interest rate |
|
29.9 |
|
40.3 |
|
17.3 |
|
32.6 |
|
47.0 |
|
16.3 | ||||||
| Credit(3) |
|
13.8 |
|
21.6 |
|
6.5 |
|
9.1 |
|
16.9 |
|
3.0 | ||||||
| Real estate/mortgage(4) |
|
22.7 |
|
61.6 |
|
8.1 |
|
29.5 |
|
55.5 |
|
8.3 | ||||||
| Equities |
|
10.5 |
|
18.2 |
|
4.3 |
|
14.6 |
|
28.0 |
|
5.5 | ||||||
| Commodities |
|
8.2 |
|
12.4 |
|
3.4 |
|
3.0 |
|
8.2 |
|
0.1 | ||||||
| Total trading portfolio |
|
43.8 |
|
69.8 |
|
29.7 |
|
49.2 |
|
69.9 |
|
25.1 | ||||||
| |
|
|
|
|
|
|
|
|
|
|
| |||||||
(1) |
The average VAR for the total portfolio is less than the sum of the VARs of the individual portfolios due to risk offsets arising from the diversification of
the portfolio. |
(2) |
The high and low for the total portfolio may not equal the sum of the individual components as the highs or lows of the individual portfolios may have
occurred on different trading days. |
(3) |
Credit includes fixed income and credit default swaps and hedges of credit exposure. |
(4) |
Real estate/mortgage, which is included in the credit trading category in the Trading-Related Revenue table in Note Two of the consolidated financial
statements, includes capital market real estate and mortgage banking certificates. |
| Third Quarter 2002 |
Second Quarter 2002 |
First Quarter 2002 |
Fourth Quarter 2001 | |||||||||||||||||||||||||||||||||
| Average VAR(1) |
High VAR(2) |
Low VAR(2) |
Average VAR(1) |
High VAR(2) |
Low VAR(2) |
Average VAR(1) |
High VAR(2) |
Low VAR(2) |
Average VAR(1) |
High VAR(2) |
Low VAR(2) | |||||||||||||||||||||||||
| (Dollars in millions) |
||||||||||||||||||||||||||||||||||||
| Foreign exchange |
$ |
3.1 |
$ |
5.8 |
$ |
1.6 |
$ |
3.0 |
$ |
6.9 |
$ |
0.5 |
$ |
3.3 |
$ |
6.4 |
$ |
1.5 |
$ |
5.2 |
$ |
10.4 |
$ |
1.9 | ||||||||||||
| Interest rate |
|
32.1 |
|
40.3 |
|
24.4 |
|
29.3 |
|
34.0 |
|
25.2 |
|
26.3 |
|
38.9 |
|
17.3 |
|
31.9 |
|
39.4 |
|
24.4 | ||||||||||||
| Credit(3) |
|
16.3 |
|
18.4 |
|
14.6 |
|
17.0 |
|
21.6 |
|
13.1 |
|
7.9 |
|
10.4 |
|
6.5 |
|
13.9 |
|
17.3 |
|
8.8 | ||||||||||||
| Real estate/ mortgage(4) |
|
15.6 |
|
25.4 |
|
8.1 |
|
17.7 |
|
30.4 |
|
8.6 |
|
33.4 |
|
61.6 |
|
14.4 |
|
24.7 |
|
39.0 |
|
15.2 | ||||||||||||
| Equities |
|
6.3 |
|
13.8 |
|
4.6 |
|
7.7 |
|
12.3 |
|
4.3 |
|
14.2 |
|
18.2 |
|
10.9 |
|
13.9 |
|
16.5 |
|
11.4 | ||||||||||||
| Commodities |
|
9.1 |
|
12.4 |
|
5.8 |
|
7.7 |
|
10.2 |
|
3.4 |
|
8.2 |
|
10.6 |
|
6.2 |
|
7.8 |
|
10.9 |
|
5.7 | ||||||||||||
| Total trading portfolio |
|
41.2 |
|
48.4 |
|
34.5 |
|
40.4 |
|
49.4 |
|
33.7 |
|
47.9 |
|
69.8 |
|
29.7 |
|
46.0 |
|
57.0 |
|
35.8 | ||||||||||||
| |
|
|
|
|
|
|
|
|
|
|
|
|
|
|
|
|
|
|
|
|
|
|
| |||||||||||||
(1) |
The average VAR for the total portfolio is less than the sum of the VARs of the individual portfolios due to risk offsets arising from the diversification of
the portfolio. |
(2) |
The high and low for the total portfolio may not equal the sum of the individual components as the highs or lows of the individual portfolios may have
occurred on different trading days. |
(3) |
Credit includes fixed income and credit default swaps and hedges of credit exposure. |
(4) |
Real estate/mortgage, which is included in the credit trading category in the Trading-Related Revenue table in Note Two of the consolidated financial
statements, includes capital market real estate and mortgage banking certificates. |
| Fair Value |
Expected Maturity |
Average Estimated Duration | ||||||||||||||||||||||||||||||||
| (Dollars in millions, average estimated duration in years) |
Total |
2002 |
2003 |
2004 |
2005 |
2006 |
After 2006 |
|||||||||||||||||||||||||||
| Open interest rate contracts |
||||||||||||||||||||||||||||||||||
| Total receive fixed swaps |
$ |
3,561 |
|
3.90 | ||||||||||||||||||||||||||||||
| Notional amount |
$ |
65,009 |
|
$ |
624 |
|
$ |
246 |
|
$ |
1,091 |
|
$ |
13,770 |
|
$ |
25,768 |
|
$ |
23,510 |
|
|||||||||||||
| Weighted average receive rate |
|
4.55 |
% |
|
6.91 |
% |
|
9.41 |
% |
|
3.87 |
% |
|
3.40 |
% |
|
4.12 |
% |
|
5.62 |
% |
|||||||||||||
| Total pay fixed swaps |
|
(2,896 |
) |
5.43 | ||||||||||||||||||||||||||||||
| Notional amount |
$ |
54,385 |
|
$ |
624 |
|
$ |
10,083 |
|
$ |
414 |
|
$ |
5,728 |
|
$ |
71 |
|
$ |
37,465 |
|
|||||||||||||
| Weighted average pay rate |
|
4.81 |
% |
|
6.91 |
% |
|
3.49 |
% |
|
3.26 |
% |
|
4.60 |
% |
|
5.48 |
% |
|
5.18 |
% |
|||||||||||||
| Basis swaps |
|
(7 |
) |
|||||||||||||||||||||||||||||||
| Notional amount |
$ |
15,700 |
|
$ |
— |
|
$ |
— |
|
$ |
9,000 |
|
$ |
500 |
|
$ |
4,400 |
|
$ |
1,800 |
|
|||||||||||||
| |
|
|
||||||||||||||||||||||||||||||||
| Total swaps |
|
658 |
|
|||||||||||||||||||||||||||||||
| |
|
|
||||||||||||||||||||||||||||||||
| Option products |
|
356 |
|
|||||||||||||||||||||||||||||||
| Notional amount |
$ |
30,000 |
|
$ |
— |
|
$ |
— |
|
$ |
— |
|
$ |
30,000 |
|
|||||||||||||||||||
| Futures and forward rate contracts |
|
(34 |
) |
|||||||||||||||||||||||||||||||
| Notional amount |
$ |
(5,000 |
) |
$ |
(5,000 |
) |
||||||||||||||||||||||||||||
| |
|
|
|
|
|
|||||||||||||||||||||||||||||
| Total open interest rate contracts |
|
980 |
|
|||||||||||||||||||||||||||||||
| |
|
|
||||||||||||||||||||||||||||||||
| Closed interest rate contracts(1) |
|
1,247 |
|
|||||||||||||||||||||||||||||||
| |
|
|
||||||||||||||||||||||||||||||||
| Net interest rate contract position |
|
2,227 |
|
|||||||||||||||||||||||||||||||
| |
|
|
||||||||||||||||||||||||||||||||
| Open foreign exchange contracts |
|
180 |
|
|||||||||||||||||||||||||||||||
| Notional amount |
$ |
5,098 |
|
$ |
55 |
|
$ |
219 |
|
$ |
622 |
|
$ |
160 |
|
$ |
1,662 |
|
$ |
2,380 |
|
|||||||||||||
| |
|
|
|
|
|
|
|
|
|
|
|
|
|
|
|
|
|
|
|
|
||||||||||||||
| Total ALM contracts |
$ |
2,407 |
|
|||||||||||||||||||||||||||||||
| |
|
|
||||||||||||||||||||||||||||||||
| December 31, 2001 |
||||||||||||||||||||||||||||||||||
| Fair Value |
Expected Maturity |
Average Estimated Duration | ||||||||||||||||||||||||||||||||
| (Dollars in millions, average estimated duration in years) |
Total |
2002 |
2003 |
2004 |
2005 |
2006 |
After 2006 |
|||||||||||||||||||||||||||
| Open interest rate contracts |
||||||||||||||||||||||||||||||||||
| Total receive fixed swaps |
$ |
784 |
|
4.68 | ||||||||||||||||||||||||||||||
| Notional amount |
$ |
64,472 |
|
$ |
1,510 |
|
$ |
266 |
|
$ |
10,746 |
|
$ |
8,341 |
|
$ |
9,608 |
|
$ |
34,001 |
|
|||||||||||||
| Weighted average receive rate |
|
5.74 |
% |
|
7.04 |
% |
|
8.27 |
% |
|
5.31 |
% |
|
5.79 |
% |
|
5.37 |
% |
|
5.89 |
% |
|||||||||||||
| Total pay fixed swaps |
|
(322 |
) |
2.26 | ||||||||||||||||||||||||||||||
| Notional amount |
$ |
21,445 |
|
$ |
11,422 |
|
$ |
4,319 |
|
$ |
122 |
|
$ |
2,664 |
|
$ |
60 |
|
$ |
2,858 |
|
|||||||||||||
| Weighted average pay rate |
|
3.97 |
% |
|
2.61 |
% |
|
4.21 |
% |
|
6.09 |
% |
|
6.77 |
% |
|
5.83 |
% |
|
6.34 |
% |
|||||||||||||
| Basis swaps |
|
— |
|
|||||||||||||||||||||||||||||||
| Notional amount |
$ |
15,700 |
|
$ |
— |
|
$ |
— |
|
$ |
9,000 |
|
$ |
500 |
|
$ |
4,400 |
|
$ |
1,800 |
|
|||||||||||||
| |
|
|
||||||||||||||||||||||||||||||||
| Total swaps |
|
462 |
|
|||||||||||||||||||||||||||||||
| |
|
|
||||||||||||||||||||||||||||||||
| Option products |
|
907 |
|
|||||||||||||||||||||||||||||||
| Notional amount |
$ |
7,000 |
|
$ |
— |
|
$ |
7,000 |
|
|||||||||||||||||||||||||
| |
|
|
|
|
|
|
|
|
||||||||||||||||||||||||||
| Total open interest rate contracts |
|
1,369 |
|
|||||||||||||||||||||||||||||||
| |
|
|
||||||||||||||||||||||||||||||||
| Closed interest rate contracts(1) |
|
1,071 |
|
|||||||||||||||||||||||||||||||
| |
|
|
||||||||||||||||||||||||||||||||
| Net interest rate contract position |
|
2,440 |
|
|||||||||||||||||||||||||||||||
| |
|
|
||||||||||||||||||||||||||||||||
| Open foreign exchange contracts |
|
(285 |
) |
|||||||||||||||||||||||||||||||
| Notional amount |
$ |
6,968 |
|
$ |
465 |
|
$ |
283 |
|
$ |
576 |
|
$ |
1,180 |
|
$ |
2,335 |
|
$ |
2,129 |
|
|||||||||||||
| Total ALM contracts |
$ |
2,155 |
|
|||||||||||||||||||||||||||||||
| |
|
|
|
|
|
|
|
|
|
|
|
|
|
|
|
|
|
|
|
|
|
|
|
| ||||||||||
| (1) Represents the unamoritized net realized deferred gains associated with
closed contracts. As a result, no notional amount is reflected for expected maturity. | ||||||||||||||||||||||||||||||||||
| (Dollars in millions, except per share information) |
2002 Quarters |
|||||||||||
| Third |
Second |
First |
||||||||||
| Income statement |
||||||||||||
| Net interest income |
$ |
5,302 |
|
$ |
5,094 |
|
$ |
5,153 |
| |||
| Noninterest income |
|
3,220 |
|
|
3,481 |
|
|
3,440 |
| |||
| Total revenue |
|
8,522 |
|
|
8,575 |
|
|
8,593 |
| |||
| Provision for credit losses |
|
804 |
|
|
888 |
|
|
840 |
| |||
| Gains on sales of securities |
|
189 |
|
|
93 |
|
|
44 |
| |||
| Noninterest expense |
|
4,620 |
|
|
4,490 |
|
|
4,494 |
| |||
| Income before income taxes |
|
3,287 |
|
|
3,290 |
|
|
3,303 |
| |||
| Income tax expense |
|
1,052 |
|
|
1,069 |
|
|
1,124 |
| |||
| Net income |
|
2,235 |
|
|
2,221 |
|
|
2,179 |
| |||
| Average common shares issued and outstanding (in thousands) |
|
1,504,017 |
|
|
1,533,783 |
|
|
1,543,471 |
| |||
| Average diluted common shares issued and outstanding (in thousands) |
|
1,546,347 |
|
|
1,592,250 |
|
|
1,581,848 |
| |||
| |
|
|
|
|
|
|
|
| ||||
| Performance ratios |
||||||||||||
| Return on average assets |
|
1.33 |
% |
|
1.38 |
% |
|
1.39 |
% | |||
| Return on average common shareholders' equity |
|
19.02 |
|
|
18.47 |
|
|
18.64 |
| |||
| Total equity to total assets (period-end) |
|
7.31 |
|
|
7.48 |
|
|
7.77 |
| |||
| Total average equity to total average assets |
|
6.97 |
|
|
7.47 |
|
|
7.44 |
| |||
| Efficiency ratio (taxable-equivalent basis) |
|
53.19 |
|
|
51.34 |
|
|
51.74 |
| |||
| Dividend payout ratio |
|
40.25 |
|
|
41.40 |
|
|
42.48 |
| |||
| |
|
|
|
|
|
|
|
| ||||
| Per common share data |
||||||||||||
| Earnings |
$ |
1.49 |
|
$ |
1.45 |
|
$ |
1.41 |
| |||
| Diluted earnings |
|
1.45 |
|
|
1.40 |
|
|
1.38 |
| |||
| Cash dividends paid |
|
0.60 |
|
|
0.60 |
|
|
0.60 |
| |||
| Book value |
|
32.07 |
|
|
31.47 |
|
|
31.15 |
| |||
| |
|
|
|
|
|
|
|
| ||||
| Average balance sheet |
||||||||||||
| Total loans and leases |
$ |
340,484 |
|
$ |
335,684 |
|
$ |
327,801 |
| |||
| Total assets |
|
669,149 |
|
|
646,599 |
|
|
637,678 |
| |||
| Core deposits |
|
331,761 |
|
|
325,994 |
|
|
321,744 |
| |||
| Total deposits |
|
373,933 |
|
|
365,986 |
|
|
364,403 |
| |||
| Common shareholders' equity |
|
46,592 |
|
|
48,213 |
|
|
47,392 |
| |||
| Total shareholders' equity |
|
46,652 |
|
|
48,274 |
|
|
47,456 |
| |||
| |
|
|
|
|
|
|
|
| ||||
| Risk-based capital ratios (period-end) |
||||||||||||
| Tier 1 capital |
|
8.13 |
% |
|
8.09 |
% |
|
8.48 |
% | |||
| Total capital |
|
12.38 |
|
|
12.42 |
|
|
12.93 |
| |||
| Leverage ratio |
|
6.35 |
|
|
6.47 |
|
|
6.72 |
| |||
| |
|
|
|
|
|
|
|
| ||||
| Market price per share of common stock |
||||||||||||
| Closing |
$ |
63.80 |
|
$ |
70.36 |
|
$ |
68.02 |
| |||
| High |
|
71.94 |
|
|
77.08 |
|
|
69.61 |
| |||
| Low |
|
57.90 |
|
|
66.82 |
|
|
57.51 |
| |||
| |
|
|
|
|
|
|
|
| ||||
Exhibit 11 — |
Earnings Per Share Computation — included in Note Eight of the consolidated financial statements |
Exhibit 12 — |
Ratio of Earnings to Fixed Charges and Preferred Dividends |
Exhibit 99.1 — |
Certification of the Chief Executive Officer pursuant to 18 U.S.C. Section 1350, as adopted pursuant to Section 906 of the Sarbanes-Oxley Act of 2002
|
Exhibit 99.2 — |
Certification of the Chief Financial Officer pursuant to 18 U.S.C. Section 1350, as adopted pursuant to Section 906 of the Sarbanes-Oxley Act of 2002
|
| Date: November 8, 2002 |
/s/ Marc D. Oken | |
| MARC D. OKEN Executive Vice President and Principal Financial Executive (Duly Authorized Officer and Chief Accounting Officer) |
1. |
I have reviewed this quarterly report on Form 10-Q of Bank of America Corporation; |
2. |
Based on my knowledge, this quarterly report does not contain any untrue statement of a material fact or omit to state a material fact necessary to
make the statements made, in light of the circumstances under which such statements were made, not misleading with respect to the period covered by this quarterly report; |
3. |
Based on my knowledge, the financial statements, and other financial information included in this quarterly report, fairly present in all material
respects the financial condition, results of operations and cash flows of the registrant as of, and for, the periods presented in this quarterly report; |
4. |
The registrant’s other certifying officers and I are responsible for establishing and maintaining disclosure controls and procedures (as defined
in Exchange Act Rules 13a-14 and 15-d14) for the registrant, and we have: |
· |
designed such disclosure controls and procedures to ensure that material information relating to the registrant, including its consolidated subsidiaries, is
made known to us by others within those entities, particularly during the period in which this quarterly report is being prepared; |
· |
evaluated the effectiveness of the registrant’s disclosure controls and procedures as of a date within 90 days prior to the filing date of this
quarterly report (the “Evaluation Date”); and |
· |
presented in this quarterly report our conclusions about the effectiveness of the disclosure controls and procedures based on our evaluation as of the
Evaluation Date; |
5. |
The registrant’s other certifying officers and I have disclosed, based on our most recent evaluation, to the registrant’s auditors and the
audit committee of the registrant’s board of directors (or persons performing the equivalent function): |
· |
all significant deficiencies in the design or operation of internal controls which could adversely affect the registrant’s ability to record, process,
summarize and report financial data and have identified for the registrant’s auditors any material weaknesses in internal controls; and |
· |
any fraud, whether or not material, that involves management or other employees who have a significant role in the registrant’s internal controls;
and |
6. |
The registrant’s other certifying officers and I have indicated in this quarterly report whether or not there were significant changes in
internal controls or in other factors that could significantly affect internal controls subsequent to the date of our most recent evaluation, including any corrective actions with regard to significant deficiencies and material weaknesses.
|
| Exhibit |
Description | |
| 11 |
Earnings Per Share Computation — included in Note Eight of the consolidated financial statements | |
| 12 |
Ratio of Earnings to Fixed Charges and Preferred Dividends | |
| 99.1 |
Certification of the Chief Executive Officer pursuant to 18 U.S.C. Section 1350, as adopted pursuant to Section 906 of the Sarbanes-Oxley Act of
2002 | |
| 99.2 |
Certification of the Chief Financial Officer pursuant to 18 U.S.C. Section 1350, as adopted pursuant to Section 906 of the Sarbanes-Oxley Act of
2002 |