
Creating
America’s Premier
Financial Services Company
Ken Lewis
Chairman &
Chief Executive Officer
Bank of America
Jim Hance
Vice Chairman &
Chief Financial Officer
Bank of America
Filing pursuant to Rule 425 under the
Securities Act of 1933, as amended and
Deemed filed under Rule 14a-12 under the
Securities Exchange Act of 1934, as amended
Filer: Bank of America Corporation
Subject Company: FleetBoston Financial Corporation
Exchange Act File Number of
Subject Company: 1-6366

Forward Looking
Statements
This presentation contains forward-looking
statements, including statements about the
financial conditions, results of operations and earnings outlook of Bank of America
Corporation and FleetBoston Financial. The forward-looking statements involve certain
risks and
uncertainties. Factors that may cause actual results or earnings to differ
materially from such forward-looking statements include, among others, the following: 1)
projected business increases following process changes and other
investments are lower
than expected; 2) competitive pressure among financial services companies increases
significantly; 3) general economic conditions are less favorable than expected; 4) political
conditions and related actions by the
United States military abroad may adversely affect
the company’s businesses and economic conditions as a whole; 4) changes in the interest
rate environment reduce interest margins and impact funding sources; 5) changes in
foreign
exchange rates increases exposure; 6) changes in market rates and prices may
adversely impact the value of financial products and assets; 7) legislation or regulatory
environments, requirements or changes adversely affect the businesses in
which the
company is engaged; 8) litigation and regulatory liabilities, including costs, expenses,
settlements and judgments, may adversely affect the company or its businesses; and 9)
decisions to downsize, sell or close units or
otherwise change the business mix of any of
the company. For further information regarding either company, please read the Bank of
America and FleetBoston Financial reports filed with the SEC and available at www.sec.gov.
2

Transaction
Rationale
3
#1 U.S. consumer retail bank
Unparalleled retail distribution network
Largest consumer customer base – 33 million
Superior product delivery including strong card and mortgage platforms
Commanding business banking franchise
#1 small business lender in U.S. with 2.5 million clients
Largest middle market lender
Corporate banking leader
Business relationships with 95% of Fortune 500 companies
#1 Global Treasury Services provider with 16,000 clients
worldwide
Fastest growing investment bank on Wall
Street
Significant wealth management
business
More than $470 billion in assets under
management (#9 in U.S.)
Largest private bank in
U.S.
3rd largest bank-owned brokerage
($ in billions)
The financial strength and cash flow generation of the combined entity will
mitigate risk while providing significant resources to support future growth
Superior Financial Strength
4
Equity excludes goodwill resulting from the combination
Bank of America
FleetBoston
Combined
Market Cap
(10/24/03)
$121.9
$33.5
$155.4
Earnings (2003 YTD)
$8.1
$1.9
$10.0
Common Equity
$50.4
$17.6
$68.0
#3
financial services
worldwide
4th most profitable
company in world
#3 financial services
worldwide

Diversified Business
Mix
5
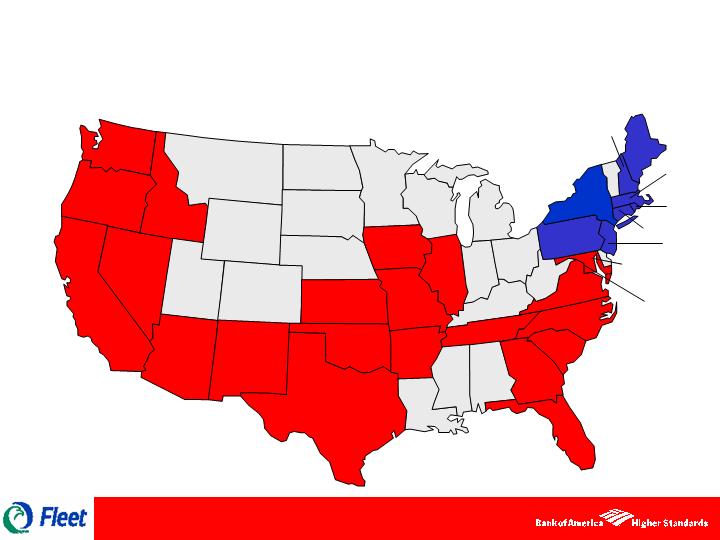
Unrivaled Market
Presence
Source: SNL Branch Data Source; Deposits as of June
2002, adjusted for pending transactions
WA
#1 (22%)
OR
#4 (11%)
ID
#4 (4%)
CA
#1 (21%)
NV
#3 (19%)
AZ
#2 (21%)
NM
#2 (16%)
KS
#2 (7%)
OK
#5 (5%)
TX
#2 (12%)
IA
#7 (2%)
MO
#2 (11%)
AR
# 3 (6%)
IL
#13
(1%)
TN #5 (6%)
GA
# 3
(12%)
SC #2
(12%)
NC #2 (21%)
VA
# 5 (10%)
MD
#1 (17%)
DC
#3 (17%)
FL
#1
(20%)
NY
#5 (3%)
PA
#10 (2%)
CT
#1 (22%)
RI
#2 (23%)
NJ
#1 (19%)
MA
#1 (23%)
ME
#3
8%
NH
#4 (6%)
State ranking and deposit share
6
9.8% of total U.S. deposit market
share

Transaction Summary
1
Based on closing BAC stock price as of 10/22/03.
7
Price Per Share:
$45.00 per FBF share 1
Fixed Exchange Ratio:
.5553 BAC shares for each FBF share
Accounting Treatment:
Purchase / tax-free exchange
Board Composition:
(19) 12 from Bank of America
7 from FleetBoston
Expected Closing:
Second Quarter 2004
Approvals:
Normal regulatory and shareholder
approvals of both companies

Value per FleetBoston share
$
45.00
Aggregate Consideration
2
$
47,363
million
Premium to Market
40.7
%
Price to Earnings - First Call Estimates:
Last Twelve Months (9/30/2003)
$
2.00
22.5
x
2003E
3
2.41
18.7
2004E
3
2.75
16.4
2005E
4
3.00
15.0
With Fully Phased-In Synergies
2004E
5
$
3.80
11.8
x
2005E
5
4.05
11.1
Price to Book Value
6
:
Stated
$
16.46
2.7
x
Tangible
12.13
3.7
Premium as % of
Core Deposits
7
33.6
%
1 Based on closing prices as of October 22, 2003.
2 Based on 1,052.6 million shares.
3 Forecast earnings estimate for 2003E and 2004E is mean First Call estimate as of October
22, 2003.
4 Forecast earnings estimate for 2005E is based on First Call mean 2004E EPS estimate of $2.75 grown at
9%.
5 Based on fully phased in synergies of $1.1 billion.
6 September 30, 2003 book value of $17.3 billion, tangible book value of $12.8 billion and 1,052.6 million shares.
7 Core deposits of $103.1 billion calculated as total deposits less time deposits greater than $100,000 and foreign deposits.
Summary of Transaction Multiples
8

Announce
Trans.
Price /
Price /
Premium as %
Date
Buyer
Target
Value
Stated
Tangible
LTM EPS
Forward EPS
Core Deposits
10/27/2003
Bank of America
FleetBoston
$
47,363
2.7
x
3.7
x
22.5
x
18.7
x
33.6
%
All Bank Acquisitions $5bn
10/04/2000
Firstar
U.S. Bancorp
21,237
2.7
x
4.4
x
13.8
x
12.9
x
34.8
%
10/02/2000
FleetBoston
Summit Bancorp
6,991
2.4
2.9
15.2
13.3
19.1
09/13/2000
Chase Manhattan
J.P. Morgan
34,423
3.2
3.4
17.6
17.1
49.9
06/01/1999
AmSouth
First American
6,341
3.4
3.9
28.9
19.8
38.0
05/10/1999
HSBC
Republic New York
8,078
2.8
3.1
51.8
18.2
16.3
04/30/1999
Firstar
Mercantile Bancorp
10,670
3.4
4.5
27.4
21.6
38.1
11/30/1998
Deutsche Bank
Bankers Trust
9,426
2.1
2.4
NM
NA
19.3
07/20/1998
SunTrust Banks
Crestar
9,606
4.3
4.7
28.3
24.7
46.7
12/01/1997
National City
First of America
7,148
3.8
4.3
22.8
22.4
36.2
11/18/1997
First Union
CoreStates
17,104
5.4
5.9
22.2
20.0
45.0
08/29/1997
NationsBank
Barnett Banks
15,523
4.0
5.8
25.2
20.7
42.4
03/20/1997
First Bank System
U.S. Bancorp
9,086
3.4
4.0
19.2
NA
29.8
Median
3.4
x
4.1
x
22.8
x
19.9
x
37.1
%
Mergers of Equals
04/15/2001
First Union
Wachovia
$
13,627
03/14/1999
Fleet Financial
BankBoston
16,258
07/01/1998
Star Banc
Firstar
7,357
06/08/1998
Norwest
Wells Fargo
34,611
04/13/1998
Bank One
First Chicago NBD
29,482
04/13/1998
NationsBank
BankAmerica
66,624
04/06/1998
Travelers Group
Citicorp
82,536
Price to Book
Source: SNL Financial, except for Bank of America / FleetBoston
which reflect management figures
Comparable Transaction Pricing
($ in millions)
9

Financial
Overview
($ in millions)
10
2004
2005
1
Bank of America projected net income
10,961
$
11,947
$
1
FleetBoston projected net income
1,487
2
3,148
Total
12,448
$
15,095
$
Adjustments
Expense efficiencies
250
1,100
Higher intangible amortization
(165)
(330)
Synergies
110
195
Projected net income for new Bank of America
12,643
$
16,060
$
Average projected diluted shares outstanding
1,781
2,016
Projected earnings per diluted share
7.10
$
7.97
$
1
Consensus First Call estimate for Bank of America
7.27
$
7.92
$
Projection vs. Consensus
-2%
1%
Excludes after-tax restructuring charge of $800 million
1
2004 First Call consensus with 9% increase in 2005
2
2004 reflects only 6 months earnings as a result of purchase accounting

Financial
Assumptions
Transaction closes in second quarter
2004
Overall expense efficiencies of $1.1 billion
after-tax, or 6% of
combined expense base
Higher intangible amortization of $330 million per year
Synergies of approximately $195 million after-tax per year
Restructuring charge of $800 million after-tax
Net share repurchases of approximately 67 million in 2004 and
23 million in 2005
11

Expense
Efficiencies
Overlapping business
infrastructure
Redundant
processes
Corporate overhead
Marketing
Vendor leverage
Occupancy
12

Impact of Expense
Efficiencies
13
Projected
Combined
Pre-tax
Less
Expense
Expense
Bank of America
FleetBoston
Efficiencies
Efficiencies
2003 annualized revenue
38,320
$
11,133
$
49,453
$
2003 annualized expense
19,793
6,371
(1,600)
24,564
Expense efficiency ratio
52%
57%
50%
*
Bank of America efficiency ratio excluding Global Corporate & Investment Banking = 49%

Focus on Customer
Retention
No branch disruption
Emerging service culture of excellence evident in
results
Convenience
Expanded breadth of products
Retail mortgage origination
Checking products
Credit and Debit card offerings
Continued investment in technology and brand
Customer Service will be the highest priority in
integration
14

Investment in BAC Today
Stock with a P/E discount versus 12+ for peers and
13+ for industry
Higher EPS expectations in
out years versus current expectations
Intense
associate focus on customer satisfaction that shows in
current revenue streams
Much improved risk profile versus years ago when both stocks
were at their highs
Attractive dividend yield (4%) and history of double digit increases
spanning a quarter century
Strong cash flow to pay dividend and repurchase shares
Franchise more diversified and unequalled in market share
presence
15

Capital Returned to
Shareholders
($ in millions)
Returned more than $47 billion in capital
since 1998
Improved Tier 1 capital ratio more than
100 basis points
Tier 1
7.06%
Tier 1
8.25%
EOP Common Shares
1,677
1,614
1,559
1,501
1,724
1,489
16
$47,249

Creating
America’s Premier Financial Services Company

APPENDIX

The NEW Bank of
America
($ in billions as of
9/30/03)
19
Assets and Equity exclude goodwill resulting from the combination
Bank of America
FleetBoston
Combined
Assets
737
$
196
$
933
$
Loans & leases
373
126
499
Deposits
409
133
542
Shareholder's equity
50
18
68
YTD Revenue
28
9
37
YTD Earnings
8
2
10
Employees
132,749
47,969
180,718
Banking centers
4,211
1,458
5,669
ATMs
13,120
3,431
16,551

Consumer & Small
Business Highlights
20
#1 Retail customers -
33 million
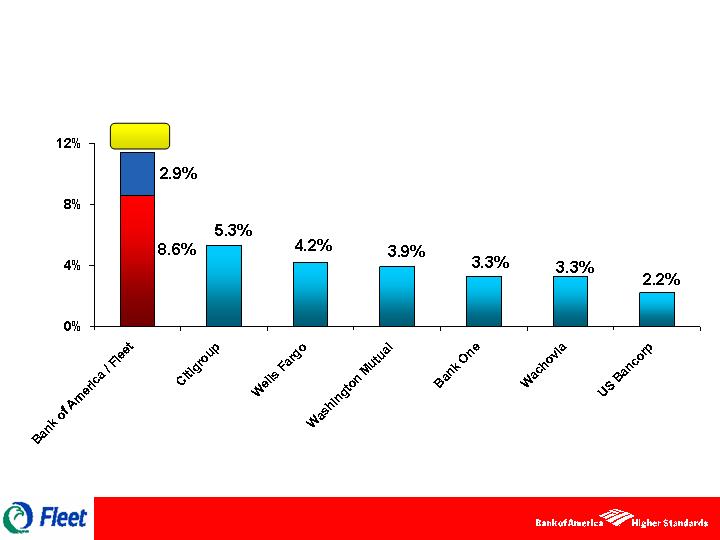
#1 Deposit market share in US -
9.8%
#1 Banking center locations -
5,669
#1 ATM network -
16,551
#1 Active online banking customers -
8 million
#1 Small business lender -
11,594 loans
#1 Debit card transactor -
15% + market share
#5 Credit card managed receivables -
$47 billion
#3 Retail mortgage originator -
$80 billion YTD 03

14.8%
Bank of America Has Presence Where Growth
Matters
Deposit market share of Top 50 MSAs with largest expected population growth
Current deposit market share percentage of Top 50 MSAs with largest expected population growth from
2002 – 2007 taken from SNL securities data and Lehman Brothers research
reports.
21
FleetBoston
Adds To Presence Where Wealth
Matters
Deposit market share of Top 50 MSAs with largest income concentration
Current deposit market share percentage of Top 50 MSAs
with largest # of households with annual income of
at least $50,000 taken from SNL Securities data and Lehman Brothers research reports.
11.5%
22

Source: Institutional Investor, July
2003; data as of 12/31/02. Rankings only include top 40 asset mangers ranked by total assets under management.
Top U.S. Wealth Managers by AUM and
Asset Class
23
Combined company moves to 9th largest asset manager
($'s in billions)
Company
Rank
$ AUM
Fidelity Investments
1
794
State Street Global Advisors
2
763
Barclays Global Investors
3
746
Capital Group Cos.
4
552
Citigroup
5
535
Mellon Financial Corporation
6
522
J.P. Morgan Flemming Asset Mgmt
7
516
Merrill Lynch Investment Managers
8
462
New Bank of America
9
456
Bank of America
17
310
FleetBoston's Columbia Mgmt Group
37
146
Total AUM

Ken Lewis
Chad Gifford
Chief Executive Officer
Chairman
Steele Alphin
Principal
Personnel
Executive
Milton Jones
Quality and
Productivity
Executive
Cathy Bessant
Chief Marketing
and
Communications
Officer
Jim Hance
Vice Chairman
and Chief
Financial
Officer
Amy Brinkley
Chief Risk
Officer
Jay Sarles
Vice Chairman
Special Advisor
to CEO
Liam McGee
President
Consumer
Banking
Gene Taylor
President
Commercial
Banking
Brian Moynihan
President
Wealth
Management
Barbara Desoer
President
Consumer
Products
Ed Brown
President
Global Corporate
and Investment
Banking
Brad Warner
President
Small Business
and Premier
Banking
Gene McQuade
President
Talented and Experienced Management
Team
24
Additional Information About the Merger
Bank of America
Corporation (“Bank of America”) and FleetBoston Financial Corporation (“FleetBoston”) will file a Joint Proxy Statement/Prospectus and other documents regarding the Agreement and Plan of Merger they entered, dated as of October
27, 2003 (the “Merger”) with the Securities and Exchange Commission (the “SEC”). Bank of America and FleetBoston will mail the Joint Proxy Statement/Prospectus to their respective shareholders. These documents will contain
important information about the transaction, and Bank of America and FleetBoston urge you to read these documents when they become available.
You may obtain copies of all documents filed with the SEC regarding
this transaction, free of charge, at the SEC’s website (www.sec.gov). You may also obtain these documents, free of charge, from Bank of America’s website (www.bankofamerica.com) under the tab “About Bank of America" and
then under the heading “Investor Relations” and then under the item “Complete SEC Filings”. You may also obtain these documents, free of charge, from FleetBoston’s website (www.fleetboston.com) under the tab
“About Fleet” and then under the heading “Investor Relations” and then under the item “SEC Filings”.
Participants in the Merger
Bank of America and FleetBoston and
their respective directors and executive officers may be deemed participants in the solicitation of proxies from stockholders in connection with this transaction. Information about the directors and executive officers of Bank of America and
FleetBoston and information about other persons who may be deemed participants in this transaction will be included in the Joint Proxy Statement/Prospectus. You can find information about Bank of America’s executive officers and directors in
their definitive proxy statement filed with the SEC on March 27, 2003. You can find information about FleetBoston’s executive officers and directors in their definitive proxy statement filed with the SEC on March 17, 2003. You can obtain free
copies of these documents from Bank of America and FleetBoston using the contact information above.