PROSPECTUS SUPPLEMENT
(To prospectus dated November 26, 2003)

| Subject to Completion Preliminary Prospectus Supplement dated July 1, 2004 |
| PROSPECTUS SUPPLEMENT (To prospectus dated November 26, 2003) |
|
$
Merrill Lynch & Co., Inc.
Profit Lock-In SUMmation SecuritiesSM
Linked to the Performance of the Nasdaq-100& Index
due July 31, 2007
“SUMSSM”
$1,000 principal amount per unit
| The SUMS:
• Senior unsecured debt securities of Merrill Lynch & Co., Inc. • No payments prior to maturity. • The amount we will pay at maturity is linked to the monthly percentage changes in the values of the Nasdaq-100 Index during the term of the SUMS, subject to a maximum percentage increase per month as described in this prospectus supplement and the profit lock-in-amount. • Expected settlement date: July 30, 2004.
Payment at maturity:
• You will receive a cash amount at maturity based upon the sum of the monthly returns of the Nasdaq-100 Index during the term of the SUMS. The amount payable at maturity on each unit of the SUMS will equal $1,000 plus the greater of:
• a summation amount equal to the product of $1,000 multiplied by the sum of the monthly percentage changes of the Nasdaq-100 Index over the term of the SUMS, as described below; and • the profit lock-in amount. • The monthly percentage changes in the value of the Nasdaq-100 Index are calculated for each month over the term of the SUMS, as described in this prospectus supplement, |
and are subject to a maximum monthly percentage increase of 2.5%. Therefore, the maximum amount you could receive at maturity is $1,900 per unit of the SUMS. However, in order for you to receive this maximum amount, the value of the Nasdaq-100 Index must increase by at least 2.5% per month throughout the term of the SUMS, which we consider very unlikely to occur. The monthly percentage decreases in the value of the Nasdaq-100 Index are not subject to any limit. However, in no event will you receive less than $1,000 for each unit of the SUMS.
Profit Lock-In Amount:
• The profit lock-in amount will equal the greater of: • $0 per unit if the summation amount never equals or exceeds 10% at any time during the term of the SUMS; • $100 per unit if the summation amount equals or exceeds 10% at any time during the term of the SUMS; • $200 per unit if the summation amount equals or exceeds 20% at any time during the term of the SUMS; and • $300 per unit if the summation amount equals or exceeds 30% at any time during the term of the SUMS. |
Investing in the SUMS involves risks that are described in the “Risk Factors” section beginning on page S-7 of this prospectus supplement.
Neither the Securities and Exchange Commission nor any state securities commission has approved or disapproved of these securities or determined if this prospectus supplement or the accompanying prospectus is truthful or complete. Any representation to the contrary is a criminal offense.
| Per Unit |
Total | ||||
| Public offering price (1) |
$ | 1,000 | $ | ||
| Underwriting discount |
$25 | $ | |||
| Proceeds, before expenses, to Merrill Lynch & Co., Inc. |
$975 | $ | |||
(1) The public offering price and the underwriting discount for any single transaction to purchase units or more will be $ and $ per unit, respectively.
Merrill Lynch & Co.
The date of this prospectus supplement is July , 2004.
“SUMS” is a service mark of Merrill Lynch & Co., Inc.
Nasdaq-100&, Nasdaq-100 Index& and Nasdaq& are trade or service marks of The Nasdaq Stock Market, Inc. and are licensed for use by Merrill Lynch & Co., Inc.
| Page | ||
| S-3 | ||
| S-7 | ||
| S-10 | ||
| S-17 | ||
| S-24 | ||
| S-29 | ||
| S-30 | ||
| S-30 | ||
| S-31 | ||
| S-31 | ||
| S-32 | ||
| S-33 |
| Page | ||
| 2 | ||
| 2 | ||
| 3 | ||
| 3 | ||
| 4 | ||
| 10 | ||
| 12 | ||
| 14 | ||
| 19 | ||
| 24 | ||
| 28 | ||
| 30 | ||
| 34 | ||
| 36 | ||
| 37 | ||
| 37 | ||
| 38 |
S-2
This summary includes questions and answers that highlight selected information from this prospectus supplement and the accompanying prospectus to help you understand the Profit Lock-In SUMmation SecuritiesSM Linked to the Performance of the Nasdaq-100& Index due July 31, 2007 (the “SUMS”). You should carefully read this prospectus supplement and the accompanying prospectus to fully understand the terms of the SUMS and the Nasdaq-100 Index, as well as the tax and other considerations that are important to you in making a decision about whether to invest in the SUMS. You should carefully review the “Risk Factors” section, which highlights certain risks, to determine whether an investment in the SUMS is appropriate for you.
References in this prospectus supplement to “ML&Co.”, “we”, “us” and “our” are to Merrill Lynch & Co., Inc., and references to “MLPF&S” are to Merrill Lynch, Pierce, Fenner & Smith Incorporated.
What are the SUMS?
The SUMS will be a series of senior debt securities issued by ML&Co. and will not be secured by collateral. The SUMS will rank equally with all of our other unsecured and unsubordinated debt. The SUMS will mature on July 31, 2007. The SUMS are not redeemable at our option or at the option of the holders at an earlier date.
We have designed the SUMS for investors who want to participate in possible increases in the value of the Nasdaq-100 Index, measured monthly during the term of the SUMS, and who are willing to forego benefiting from some possible increases in the Nasdaq-100 Index in return for the protection of their principal. At maturity, the holder of each SUMS will receive an amount based upon the sum of the monthly percentage increases and decreases in the value of the Nasdaq-100 Index (each a “Monthly Return”) over the term of the SUMS, subject to a maximum percentage increase during any month of 2.5% and a minimum redemption amount of $1,000 per unit of the SUMS and the Profit Lock-In Amount. The maximum percentage increase per month is referred to in this prospectus supplement as the “Monthly Return Cap”.
Each unit of the SUMS represents the $1000 original public offering price of the SUMS. You may transfer the SUMS only in whole units. You will not have the right to receive physical certificates evidencing your ownership except under limited circumstances. Instead, we will issue the SUMS in the form of a global certificate, which will be held by The Depository Trust Company, also known as DTC, or its nominee. Direct and indirect participants in DTC will record your ownership of the SUMS. You should refer to the section entitled “Description of the Debt Securities—Depositary” in the accompanying prospectus.
Will I receive interest?
You will not receive interest payments over the term of the SUMS. However, the payment at maturity, as described below, will not be less than $1,000 for each unit of the SUMS.
What will I receive on the stated maturity date of the SUMS?
For each SUMS unit that you own at maturity, you will receive a cash payment at maturity equal to $1,000 plus the greater of:
(i) the Supplemental Redemption Amount;
or
(ii) the Profit Lock-In Amount.
The “Supplemental Redemption Amount” equals:
$1,000 x the Summation Amount.
The “Summation Amount” will equal the sum of all positive and negative Monthly Returns on the Nasdaq-100 Index, with each Monthly Return being subject to the Monthly Return Cap, for each monthly calculation period during the term of the SUMS.
S-3
The “Profit Lock-In Amount” will equal the greater of:
| • | $0 per unit if the Summation Amount never equals or exceeds 10% at any time during the term of the SUMS; |
| • | $100 per unit if the Summation Amount equals or exceeds 10% at any time during the term of the SUMS; |
| • | $200 per unit if the Summation Amount equals or exceeds 20% at any time during the term of the SUMS; and |
| • | $300 per unit if the Summation Amount equals or exceeds 30% at any time during the term of the SUMS. The Profit Lock-In Amount will not exceed $300 per unit. |
You should understand that the opportunity to participate in possible increases in the value of the Nasdaq-100 Index through an investment in the SUMS is limited because each Monthly Return is limited by the Monthly Return Cap of 2.5% per month. However, in the event that the value of the Nasdaq-100 Index declines during any month, the Monthly Return will be reduced by the total percentage decrease in such month and the effect of those decreases on the Summation Amount could be such that you will receive only $1,000 per unit at maturity for your SUMS. This could be true even if the value of the Nasdaq-100 Index on the maturity date is significantly higher than the value of the Nasdaq-100 Index on the date the SUMS were priced for initial sale to the public (the “Pricing Date”).
For more specific information regarding the Summation Amount and the calculations referred to above, please see the section entitled “Description of the SUMS” in this prospectus supplement.
How is the monthly percentage change in the value of the Nasdaq-100 Index calculated?
Each Monthly Return equals:
| ( | Ending Value – Starting Value |
) | ||
| Starting Value |
subject to a maximum increase of 2.5% per month. The calculation agent shall determine each Monthly Return on the 27th day of each month, beginning August 27, 2004 through July 27, 2007 or, if any of those days is not a business day, the next succeeding day that is a business day, except as described in this prospectus supplement (each a “Monthly Return Calculation Date”).
The “Starting Value” will equal the closing value of the Nasdaq-100 Index on the immediately preceding Monthly Return Calculation Date. For purposes of determining the Monthly Return on the initial Monthly Return Calculation Date of August 27, 2004, the Starting Value will equal the closing value of the Nasdaq-100 Index on the Pricing Date.
The “Ending Value” will equal the closing value of the Nasdaq-100 Index on the Monthly Return Calculation Date for which the Monthly Return is being determined.
Who publishes the Nasdaq-100 Index and what does the Nasdaq-100 Index measure?
The Nasdaq-100 Index is a modified market capitalization-weighted index of 100 of the largest stocks of non-financial companies listed on The Nasdaq National Market tier of The Nasdaq Stock Market. The Index is currently calculated and published by The Nasdaq Stock Market, Inc. (the “Nasdaq”&). As of March 31, 2004, the major industry groups covered in the Nasdaq-100 Index (listed according to their respective capitalization in the Nasdaq-100 Index) were as follows: computer and office equipment (30.81%); computer software/services (25.64%); biotechnology (9.51%); telecommunications (13.41%); retail/wholesale trade (9.99%); health care (4.06%); services (3.44%); manufacturing (2.31%); and transportation (0.83%). The identity and capitalization weightings of the five largest companies represented in the Nasdaq-100 Index as of March 31, 2004, were as follows: Microsoft Corporation (7.98%); QUALCOMM Incorporated (5.55%); Intel Corporation (5.31%); Cisco Systems, Inc. (4.97%); and Amgen Inc. (2.99%). Current information regarding the market value of the Nasdaq-100 Index is available from the Nasdaq as well as numerous market information services. The Nasdaq-100 Index is determined, comprised and calculated by the Nasdaq without regard to the SUMS.
S-4
You should be aware that an investment in the SUMS does not entitle you to any ownership interest in the stocks of the companies included in the Nasdaq-100 Index.
How has the Nasdaq-100 Index performed historically?
We have included a table and a graph showing the month-end closing value of the Nasdaq-100 Index from February 1985 through June 2004 and the percentage change in the value of the Nasdaq-100 Index for each of those months in the section entitled “The Nasdaq-100 Index—Historical Data on the Nasdaq-100 Index” in this prospectus supplement. We have provided this historical information to help you evaluate the behavior of the Nasdaq-100 Index in various economic environments; however, past performance of the Nasdaq-100 Index is not indicative of how the Nasdaq-100 Index will perform in the future. It is important for you to understand that, because the Summation Amount will depend on the timing of increases and decreases in the values of the Nasdaq-100 Index during the term of the SUMS, and that because the full increase in the value of the Nasdaq-100 Index during any month may not be reflected in the Summation Amount as a result of the Monthly Return Cap, the value of the SUMS may not track increases, if any, in the value of the Nasdaq-100 Index.
What about taxes?
Each year, you will be required to pay taxes on ordinary income from the SUMS over their term based upon an estimated yield for the SUMS, even though you will not receive any payments from us until maturity. We have determined this estimated yield, in accordance with regulations issued by the U.S. Treasury Department, solely in order for you to figure the amount of taxes that you will owe each year as a result of owning a SUMS. This estimated yield is neither a prediction nor a guarantee of what the actual amount payable at maturity will be; nor is it a prediction or guarantee that any payment at maturity will even exceed $1,000. We have determined that this estimated yield will equal % per annum, compounded semiannually.
Based upon this estimated yield, if you pay your taxes on a calendar year basis and if you buy a SUMS for $1,000 and hold the SUMS until maturity, you will generally be required to pay taxes on the following amounts of ordinary income from the SUMS each year: $ in 2004, $ in 2005, $ in 2006 and $ in 2007. However, in 2007, the amount of ordinary income that you will be required to pay taxes on from owning each SUMS may be greater or less than $ , depending upon the amount you receive at maturity. Also, if the amount payable at maturity is less than $ , you may have a loss which you could deduct against other income you may have in 2007, but under current tax regulations, you would neither be required nor allowed to amend your tax returns for prior years. For further information, see “United States Federal Income Taxation” in this prospectus supplement.
Will the SUMS be listed on a stock exchange?
The SUMS will not be listed on any securities exchange and we do not expect a trading market for the SUMS to develop, which may affect the price that you receive for your SUMS upon any sale prior to maturity. You should review the section entitled “Risk Factors—A trading market for the SUMS is not expected to develop” in this prospectus supplement.
What is the role of MLPF&S?
MLPF&S, our subsidiary, is the underwriter for the offering and sale of the SUMS. After the initial offering, MLPF&S intends to buy and sell SUMS to create a secondary market for holders of the SUMS, and may stabilize or maintain the closing market price of the SUMS during the initial distribution. However, MLPF&S will not be obligated to engage in any of these market activities or to continue them once it has started.
MLPF&S also will be our agent for purposes of calculating, among other things, the redemption amount deliverable to you at maturity. Under certain circumstances, these duties could result in a conflict of interest between MLPF&S’s status as our subsidiary and its responsibilities as calculation agent.
S-5
What is ML&Co.?
Merrill Lynch & Co., Inc. is a holding company with various subsidiaries and affiliated companies that provide investment, financing, insurance and related services on a global basis. For information about ML&Co., please see the section entitled “Merrill Lynch & Co., Inc.” in the accompanying prospectus. You should also read the other documents we have filed with the SEC, which you can find by referring to the section entitled “Where You Can Find More Information” in this prospectus supplement.
Are there any risks associated with an investment in the SUMS?
Yes, an investment in the SUMS is subject to certain risks. Please refer to the section entitled “Risk Factors” in this prospectus supplement.
S-6
Your investment in the SUMS will involve certain risks. You should consider carefully the following discussion of risks before you decide that an investment in the SUMS is suitable for you.
Your return will not be based on the absolute change in the value of the Nasdaq-100 Index
Your return on the SUMS will not be based on the change in the value of the Nasdaq-100 Index from the Pricing Date to the final Monthly Return Calculation Date, but will instead be based on the sum of (i) the monthly percentage decreases and (ii) capped monthly percentage increases in the value of the Nasdaq-100 Index calculated as of each respective Monthly Return Calculation Date during the term of the SUMS. As a result, your return on the SUMS will not be based on the absolute change in the Nasdaq-100 Index over that period. We have provided six examples to illustrate this beginning on page S-13 of this prospectus supplement.
Your return on the SUMS will depend on when each Monthly Return is calculated
Your return will depend, subject to the Monthly Return Cap and the Profit Lock-In Amount, on the sum of the Monthly Returns, which in turn depends on the values of the Nasdaq-100 Index used to calculate each Monthly Return. Because the Nasdaq-100 Index can vary significantly from day to day, we believe that the total of the Monthly Returns over the term of the SUMS would vary depending upon which day of the month is selected for the Monthly Return Calculation Dates. Your return, therefore, could be significantly different if the Monthly Returns were calculated on different dates within a month during the same term of the SUMS, or if the SUMS were issued shortly before or after the Pricing Date. We cannot, however, predict the direction or magnitude of changes which would result in the selection of different dates.
You may not earn a return on your investment
Payment at maturity of any amount in excess of the $1,000 principal amount per unit will depend, subject to the Monthly Return Cap and the Profit Lock-In Amount, on the sum of the Monthly Returns of the Nasdaq-100 Index during the term of the SUMS. You may receive only the $1,000 principal amount per unit, and this may occur even if the value of the Nasdaq-100 Index increases significantly over the term of the SUMS. This is illustrated in hypothetical example 3 on page S-13.
Your yield may be lower than the yield on other standard debt securities of comparable maturity
The yield that you receive on your SUMS may be less than the return you could earn on other investments. Your yield may be less than the yield you would earn if you bought a standard senior non-callable debt security of ML&Co. with the same stated maturity date. Your investment may not reflect the full opportunity cost to you when you take into account factors that affect the time value of money.
Your return is based upon limited monthly percentage increases and unlimited monthly percentage decreases
You should understand that due to the application of the Monthly Return Cap, any increase in the value of the Nasdaq-100 Index will not exceed 2.5% per month. As a result, your return based upon the Summation Amount will be limited and you will not participate in any Nasdaq-100 Index increases in excess of such percentage on each Monthly Return Calculation Date. As a result, in no event will you receive a payment at maturity in excess of $1,900 per unit of the SUMS. The payment you receive at maturity will only equal this maximum amount only in the event (which we consider unlikely) that the Nasdaq-100 Index increases by at least the Monthly Return Cap each month during the term of the SUMS. However, there is no corresponding limit on the amount by which the Nasdaq-100 Index may decline in any given month for purposes of calculating the payment you receive at maturity. As a result, both the Summation Amount and the Profit Lock-In Amount may equal zero, in which case you would receive $1,000 per unit at maturity for your SUMS.
S-7
Your return will not reflect the return of owning the stocks included in the Nasdaq-100 Index
In addition to the reasons stated above, the return on your SUMS will not reflect the return you would realize if you actually owned the stocks included in the Nasdaq-100 Index and received the dividends paid on those stocks because of the cumulative effect of the Monthly Return Cap and because the value of the Nasdaq-100 Index is calculated by reference to the prices of the stocks included in the Nasdaq-100 Index without taking into consideration the value of dividends paid on those stocks.
A trading market for the SUMS is not expected to develop
The SUMS will not be listed on any securities exchange and we do not expect a trading market for the SUMS to develop. Although our affiliate, MLPF&S, has indicated that it expects to bid for SUMS offered for sale to it by SUMS holders, it is not required to do so and may cease making such bids at any time. The limited trading market for your SUMS may affect the price that you receive for your SUMS if you do not wish to hold your investment until maturity.
Many factors affect the trading value of the SUMS; these factors interrelate in complex ways and the effect of any one factor may offset or magnify the effect of another factor
The trading value of the SUMS will be affected by factors that interrelate in complex ways. It is important for you to understand that the effect of one factor may offset the increase in the trading value of the SUMS caused by another factor and that the effect of one factor may exacerbate the decrease in the trading value of the SUMS caused by another factor. For example, an increase in U.S. interest rates may offset some or all of any increase in the trading value of the SUMS attributable to another factor, such as an increase in the value of the Nasdaq-100 Index. The following paragraphs describe the expected impact on the market value of the SUMS given a change in a specific factor, assuming all other conditions remain constant.
The value of the Nasdaq-100 Index is expected to affect the trading value of the SUMS. We expect that the market value of the SUMS will depend, subject to the Monthly Return Cap and the Profit Lock-In Amount, on the monthly market values of the Nasdaq-100 Index. Because the payment you receive at maturity will not exceed the highest amount which will be determinable from time to time by reference to the Summation Amount and the Monthly Return Cap, we expect the SUMS to trade in the secondary market below, and perhaps significantly below, the then current maximum possible Summation Amount. For example, if early in the term of the SUMS, the summation of negative Monthly Returns exceeds the summation of possible maximum increases (i.e., the Monthly Return Cap), then no value will be given to the Summation Amount for the remainder of the term of the SUMS. You should be aware that, depending on the timing of increases and decreases in the value of the Nasdaq-100 Index during the term of the SUMS, it is possible for the Nasdaq-100 Index to increase over the term of the SUMS and the value of the SUMS to be significantly below the then current maximum possible Summation Amount.
Changes in the levels of interest rates are expected to affect the trading value of the SUMS. In general, if U.S. interest rates increase, we expect that the trading value of the SUMS will decrease and, conversely, if U.S. interest rates decrease, we expect the trading value of the SUMS will increase. Rising U.S. interest rates may lower the value of the Nasdaq-100 Index and, thus, the SUMS. Falling U.S. interest rates may increase the value of the Nasdaq-100 Index and, thus, may increase the value of the SUMS.
Changes in the volatility of the Nasdaq-100 Index are expected to affect the trading value of the SUMS. Volatility is the term used to describe the size and frequency of price and/or market fluctuations. Increased volatility increases the probability of negative changes in the Nasdaq-100 Index, and the magnitude of such negative changes, on any particular Monthly Return Calculation Date, thereby increasing the probability of
S-8
negative Monthly Returns, which would reduce the value of the SUMS. Increased volatility also increases the probability of positive changes in the Nasdaq-100 Index, and the magnitude of such positive changes, on any particular Monthly Return Calculation Date, however, as a result of the Monthly Returns Cap, these changes will have limited affect on the value of the SUMS. If the volatility of the Nasdaq-100 Index increases the trading value of the SUMS may be adversely affected.
Changes in dividend payments on the stocks included in the Nasdaq-100 Index are expected to affect the trading value of the SUMS. In general, if dividend payments on the stocks included in the Nasdaq-100 Index increase, we expect that the value of the SUMS will decrease and, conversely, if dividend payments on the stocks included in the Nasdaq-100 Index decrease, we expect that the value of the SUMS will increase.
Changes in our credit ratings may affect the trading value of the SUMS. Our credit ratings are an assessment of our ability to pay our obligations. Consequently, real or anticipated changes in our credit ratings may negatively affect the trading value of the SUMS. However, because the return on your SUMS is dependent upon factors in addition to our ability to pay our obligations under the SUMS, such as the monthly performance of the Nasdaq-100 Index, an improvement in our credit ratings will not reduce the other investment risks related to the SUMS and will not necessarily result in an increase in the trading value of the SUMS.
Purchases and sales by us and our affiliates may affect your return
We and our affiliates may from time to time buy or sell the stocks included in the Nasdaq-100 Index or futures or options contracts on the Nasdaq-100 Index for our own accounts for business reasons or in connection with hedging our obligations under the SUMS. These transactions could affect the price of these stocks and, in turn, the value of the Nasdaq-100 Index in a manner that would be adverse to your investment in the SUMS.
Potential conflicts
The calculation agent for the SUMS is MLPF&S, our subsidiary. Under certain circumstances, MLPF&S’ role as our subsidiary and its responsibilities as calculation agent for the SUMS could give rise to conflicts of interests. These conflicts could occur, for instance, in connection with its determination as to whether the value of the Nasdaq-100 Index can be calculated on a trading day, or in connection with its judgments that it would be required to make in the event of a discontinuance of the Nasdaq-100 Index. See the sections entitled “Description of the SUMS—Adjustments to the Nasdaq-100 Index” and “—Discontinuance of the Nasdaq-100 Index” in this prospectus supplement. MLPF&S is required to carry out its duties as calculation agent in good faith and using its reasonable judgment. However, you should be aware that because we control MLPF&S, potential conflicts of interest could arise.
We have entered into an arrangement with one of our subsidiaries to hedge the market risks associated with our obligations in connection with the SUMS. This subsidiary expects to make a profit in connection with this arrangement. We did not seek competitive bids for this arrangement from unaffiliated parties.
Tax consequences
You should consider the tax consequences of investing in the SUMS. See “United States Federal Income Taxation” in this prospectus supplement.
S-9
ML&Co. will issue the SUMS as a series of senior debt securities under the 1983 Indenture, which is more fully described in the accompanying prospectus. The SUMS will mature on July 31, 2007.
The SUMS will not be subject to redemption by ML&Co. or at the option of any beneficial owner before maturity. If an Event of Default occurs with respect to the SUMS, beneficial owners of the SUMS may accelerate the maturity of the SUMS, as described under the sections entitled “Events of Default and Acceleration” in this prospectus supplement and “Description of Debt Securities—Events of Default” in the accompanying prospectus.
ML&Co. will issue the SUMS in denominations of whole units each with a principal amount of $1,000 per unit.
The SUMS will not have the benefit of any sinking fund.
Payment at Maturity
At maturity, you will receive for each $1,000 principal amount of SUMS an amount equal to $1,000 plus the greater of:
(i) the Supplemental Redemption Amount;
or
(ii) the Profit Lock-In Amount.
The “Supplemental Redemption Amount” per unit equals $1,000 x Summation Amount, where the “Summation Amount” is the sum of the monthly percentage increases and decreases in the value of the Nasdaq-100 Index over the term of the SUMS (each a “Monthly Return”), each being subject to a maximum percentage increase of 2.5% (the “Monthly Return Cap”). The Monthly Return for each monthly period equals:
| ( | Ending Value – Starting Value |
) | ||
| Starting Value |
provided, however, that in no event will any resulting percentage increase be greater than 2.5%. There is no limit on any monthly percentage decrease.
The “Profit Lock-In Amount” will equal the greater of:
| • | $0 per unit if the Summation Amount never equals or exceeds 10% at any time during the term of the SUMS; |
| • | $100 per unit if the Summation Amount equals or exceeds 10% at any time during the term of the SUMS; |
| • | $200 per unit if the Summation Amount equals or exceeds 20% at any time during the term of the SUMS; and |
| • | $300 per unit if the Summation Amount equals or exceeds 30% at any time during the term of the SUMS. The Profit Lock-In Amount will not exceed $300 per unit. |
The calculation agent will determine each Monthly Return on the 27th of each month beginning August 27, 2004 through July 27, 2007 or, if any of those days is not an Index Business Day, the next succeeding day that is an Index Business Day, except as described below under the definition of Ending Value (each a “Monthly Return Calculation Date”), by determining the percentage change in the closing value of the Nasdaq-100 Index on such Monthly Return Calculation Date relative to the closing value of the Nasdaq-100 Index on the immediately preceding Monthly Return Calculation Date, or, in the case of the first Monthly Return Calculation Date of August 27, 2004, the Pricing Date. Each such Monthly Return (subject to the Monthly Return Cap) will be added to (or in the case of decreases, subtracted from) the Summation Amount.
S-10
You should understand that the maximum value of the Summation Amount will not be greater than 90% due to the Monthly Return Cap. As a result, in no event will you receive a payment at maturity in excess of $1,900 per unit of the SUMS.
The “Starting Value” will equal the closing value of the Nasdaq-100 Index on the immediately preceding Monthly Return Calculation Date or, in the case of the first Monthly Return Calculation Date of August 27, 2004, the Pricing Date, which will be disclosed to you in the final prospectus supplement delivered to you in connection with sales of the SUMS.
The “Ending Value” will equal the closing value of the Nasdaq-100 Index on the Monthly Return Calculation Date for which the Monthly Return is being determined; provided, however, that when determining the Ending Value for the final Monthly Return Calculation Date of July 27, 2007, the Ending Value will be determined by the calculation agent regardless of the occurrence of a Market Disruption Event on that day.
An “Index Business Day” means any day on which the New York Stock Exchange (the “NYSE”), the American Stock Exchange (the “AMEX”) and The Nasdaq Stock Market (the “Nasdaq”) are open for trading, the Nasdaq-100 Index or any successor index is calculated and published and a Market Disruption Event has not occurred.
“Business Day” means any day on which the NYSE, the AMEX and the Nasdaq are open for trading.
All determinations made by the calculation agent shall be at its sole discretion and, absent manifest error, shall be conclusive for all purposes and binding on ML&Co. and beneficial owners of the SUMS.
Hypothetical Examples of Monthly Percentage Changes in the Nasdaq-100 Index
The following table provides hypothetical percentage changes in the Nasdaq-100 Index from the closing value in the prior month for the specified index value for each example, subject to the Monthly Return Cap and the Profit Lock-In Amount. The sum of these Monthly Returns equals the Summation Amount. The examples are based on the following criteria:
| • | five hypothetical examples, each assuming hypothetical increases in the Nasdaq-100 Index over the term of the SUMS, with differing Summation Amounts; and |
| • | one hypothetical example, assuming a hypothetical decrease in the Nasdaq-100 Index over the term of the SUMS. |
These figures are for purposes of illustration only. Your return on the SUMS will not be based on a comparison of the respective value of the Nasdaq-100 Index on the Pricing Date and the final Monthly Return Calculation Date, but will instead be based, subject to the Monthly Return Cap and Profit Lock-In Amount, on the sum of the monthly percentage changes in the value of the Nasdaq-100 Index calculated as of each respective Monthly Return Calculation Date (i.e., each Monthly Return) during the term of the SUMS. As a result, your return on the SUMS will not be based on the absolute change in the Nasdaq-100 Index over that period. The actual Summation Amount will not exceed 90% due to the Monthly Return Cap. As a result, in no event will you receive a payment at maturity in excess of $1,900 per unit of the SUMS.
You should understand that for you to receive the maximum value of the Summation Amount, the Monthly Returns for all months over the term of the SUMS must equal or be greater than the Monthly Return Cap. This will occur only if there are no monthly percentage decreases and all Monthly Returns are equal to or greater than the maximum of 2.5%, which we consider very unlikely to occur. The Summation Amount will not be increased by any positive monthly increase in the Nasdaq-100 Index in excess of the Monthly Return Cap. Any negative Monthly Return, however, will reduce the Summation Amount and is not subject to any corresponding limit on decreases.
S-11
Your return will depend, subject to the Monthly Return Cap and the Profit Lock-In Amount, on the sum of the Monthly Returns, which in turn depends on the values of the Nasdaq-100 Index used to calculate each Monthly Return. Because the Nasdaq-100 Index can vary significantly from day to day, we believe that the total of the Monthly Returns over the term of the SUMS would vary depending upon which day of the month is selected for the Monthly Return Calculation Dates. Your return, therefore, could be significantly different than if the Monthly Returns were calculated on different dates within a month during the same term of the SUMS, or if the SUMS were issued shortly before or after the Pricing Date. For example, in hypothetical examples 1 and 2 and hypothetical examples 3 and 4 in the table below, the total percentage change in the Nasdaq-100 Index is the same for each pair (i.e., the starting index value and the ending index value for each pair of examples are the same); however, the resulting payment at maturity between each pair is drastically different.
Because the value of the Nasdaq-100 Index may be subject to significant fluctuations over the term of the SUMS, it is not possible to present a graph or table illustrating a complete range of possible payments at maturity you may receive. The examples of hypothetical payments at maturity and hypothetical Summation Amounts that follow are intended to illustrate the effect of general trends in the closing values of the Nasdaq-100 Index on the payment at maturity you may receive at maturity. However, the Nasdaq-100 Index may not appreciate or depreciate over the term of the SUMS in accordance with any trends depicted by the hypothetical examples shown below, and the magnitude and frequency of any fluctuations in the value of the Nasdaq-100 Index over the terms of the SUMS, which we refer to as the volatility of the Nasdaq-100 Index, may be significantly different than the volatility of the Nasdaq-100 Index implied by any of the hypothetical examples. A high volatility of the Nasdaq-100 Index during the term of the SUMS would be expected to increase the magnitude of positive and negative Monthly Returns on any given Monthly Return Calculation Date and may adversely affect the payment at maturity you may receive. In recent periods, the Nasdaq-100 Index has experienced significant volatility. We cannot predict the future volatility of the Index.
S-12
Hypothetical Calculations of the Payments at Maturity
| EXAMPLE 1 Increase in the Index |
EXAMPLE 2 |
EXAMPLE 3 Increase in the Index |
|||||||||||||||||||||||||||
| Monthly Return Calculation Date |
Index Value |
Monthly Return |
Summation Amount |
Index Value |
Monthly Return |
Summation Amount |
Index Value |
Monthly Return |
Summation Amount |
||||||||||||||||||||
| Year 1 | |||||||||||||||||||||||||||||
| August |
1503.42 | 1.68 | % | 1.68 | % | 1481.54 | 0.20 | % | 0.20 | % | 1481.54 | 0.20 | % | 0.20 | % | ||||||||||||||
| September |
1557.96 | 2.50 | % | 4.18 | % | 1484.50 | 0.20 | % | 0.40 | % | 1499.32 | 1.20 | % | 1.40 | % | ||||||||||||||
| October |
1536.01 | -1.41 | % | 2.77 | % | 1490.44 | 0.40 | % | 0.80 | % | 1538.30 | 2.50 | % | 3.90 | % | ||||||||||||||
| November |
1627.19 | 2.50 | % | 5.27 | % | 1493.42 | 0.20 | % | 1.00 | % | 1457.96 | -5.22 | % | -1.32 | % | ||||||||||||||
| December |
1657.56 | 1.87 | % | 7.14 | % | 1499.39 | 0.40 | % | 1.40 | % | 1475.46 | 1.20 | % | -0.12 | % | ||||||||||||||
| January |
1710.96 | 2.50 | % | 9.64 | % | 1502.39 | 0.20 | % | 1.60 | % | 1484.31 | 0.60 | % | 0.48 | % | ||||||||||||||
| February |
1679.32 | -1.85 | % | 7.79 | % | 1508.40 | 0.40 | % | 2.00 | % | 1502.12 | 1.20 | % | 1.68 | % | ||||||||||||||
| March |
1800.25 | 2.50 | % | 10.29 | % | 1511.42 | 0.20 | % | 2.20 | % | 1579.64 | 2.50 | % | 4.18 | % | ||||||||||||||
| April |
1750.36 | -2.77 | % | 7.52 | % | 1517.46 | 0.40 | % | 2.60 | % | 1598.60 | 1.20 | % | 5.38 | % | ||||||||||||||
| May |
1785.69 | 2.02 | % | 9.54 | % | 1520.50 | 0.20 | % | 2.80 | % | 1436.79 | -10.12 | % | -4.74 | % | ||||||||||||||
| June |
1799.74 | 0.79 | % | 10.32 | % | 1526.58 | 0.40 | % | 3.20 | % | 1454.03 | 1.20 | % | -3.54 | % | ||||||||||||||
| July |
1825.64 | 1.44 | % | 11.76 | % | 1529.63 | 0.20 | % | 3.40 | % | 1800.25 | 2.50 | % | -1.04 | % | ||||||||||||||
| Year 2 | |||||||||||||||||||||||||||||
| August |
1807.64 | -0.99 | % | 10.78 | % | 1554.11 | 1.60 | % | 5.00 | % | 1750.36 | -2.77 | % | -3.82 | % | ||||||||||||||
| September |
1817.35 | 0.54 | % | 11.31 | % | 1557.22 | 0.20 | % | 5.20 | % | 1785.69 | 2.02 | % | -1.80 | % | ||||||||||||||
| October |
1754.69 | -3.45 | % | 7.86 | % | 1563.44 | 0.40 | % | 5.60 | % | 1799.74 | 0.79 | % | -1.01 | % | ||||||||||||||
| November |
1721.69 | -1.88 | % | 5.98 | % | 1566.57 | 0.20 | % | 5.80 | % | 1825.64 | 1.44 | % | 0.43 | % | ||||||||||||||
| December |
1710.35 | -0.66 | % | 5.33 | % | 1572.84 | 0.40 | % | 6.20 | % | 1807.64 | -0.99 | % | -0.56 | % | ||||||||||||||
| January |
1706.79 | -0.21 | % | 5.12 | % | 1575.98 | 0.20 | % | 6.40 | % | 1817.35 | 0.54 | % | -0.02 | % | ||||||||||||||
| February |
1688.47 | -1.07 | % | 4.04 | % | 1582.29 | 0.40 | % | 6.80 | % | 1754.69 | -3.45 | % | -3.47 | % | ||||||||||||||
| March |
1649.56 | -2.30 | % | 1.74 | % | 1594.95 | 0.80 | % | 7.60 | % | 1721.69 | -1.88 | % | -5.35 | % | ||||||||||||||
| April |
1678.97 | 1.78 | % | 3.52 | % | 1601.33 | 0.40 | % | 8.00 | % | 1710.35 | -0.66 | % | -6.01 | % | ||||||||||||||
| May |
1629.34 | -2.96 | % | 0.57 | % | 1604.53 | 0.20 | % | 8.20 | % | 1706.79 | -0.21 | % | -6.22 | % | ||||||||||||||
| June |
1613.79 | -0.95 | % | -0.39 | % | 1610.95 | 0.40 | % | 8.60 | % | 1688.47 | -1.07 | % | -7.29 | % | ||||||||||||||
| July |
1631.56 | 1.10 | % | 0.71 | % | 1630.28 | 1.20 | % | 9.80 | % | 1649.56 | -2.30 | % | -9.59 | % | ||||||||||||||
| Year 3 | |||||||||||||||||||||||||||||
| August |
1649.89 | 1.12 | % | 1.84 | % | 1636.80 | 0.40 | % | 10.20 | % | 1678.97 | 1.78 | % | -7.81 | % | ||||||||||||||
| September |
1702.36 | 2.50 | % | 4.34 | % | 1640.07 | 0.20 | % | 10.40 | % | 1629.34 | -2.96 | % | -10.77 | % | ||||||||||||||
| October |
1756.06 | 2.50 | % | 6.84 | % | 1646.63 | 0.40 | % | 10.80 | % | 1613.79 | -0.95 | % | -11.72 | % | ||||||||||||||
| November |
1720.68 | -2.01 | % | 4.82 | % | 1649.93 | 0.20 | % | 11.00 | % | 1631.56 | 1.10 | % | -10.62 | % | ||||||||||||||
| December |
1687.63 | -1.92 | % | 2.90 | % | 1656.53 | 0.40 | % | 11.40 | % | 1649.89 | 1.12 | % | -9.50 | % | ||||||||||||||
| January |
1627.96 | -3.54 | % | -0.63 | % | 1692.97 | 2.20 | % | 13.60 | % | 1669.69 | 1.20 | % | -8.30 | % | ||||||||||||||
| February |
1610.33 | -1.08 | % | -1.72 | % | 1699.74 | 0.40 | % | 14.00 | % | 1776.49 | 2.50 | % | -5.80 | % | ||||||||||||||
| March |
1598.47 | -0.74 | % | -2.45 | % | 1703.14 | 0.20 | % | 14.20 | % | 1797.81 | 1.20 | % | -4.60 | % | ||||||||||||||
| April |
1567.49 | -1.94 | % | -4.39 | % | 1709.95 | 0.40 | % | 14.60 | % | 1819.38 | 1.20 | % | -3.40 | % | ||||||||||||||
| May |
1620.48 | 2.50 | % | -1.89 | % | 1713.37 | 0.20 | % | 14.80 | % | 1657.96 | -8.87 | % | -12.27 | % | ||||||||||||||
| June |
1656.87 | 2.25 | % | 0.35 | % | 1720.23 | 0.40 | % | 15.20 | % | 1677.86 | 1.20 | % | -11.07 | % | ||||||||||||||
| July |
1774.30 | 2.50 | % | 2.85 | % | 1774.30 | 2.50 | % | 17.70 | % | 1922.15 | 2.50 | % | -8.57 | % | ||||||||||||||
| Total Percentage Change in the Nasdaq-100 Index: |
20.00 | % | 20.00 | % | 30.00 | % | |||||||||||||||||||||||
| Supplemental Redemption Amount: |
$29.00 | $ | 177.00 | –$86.00 | |||||||||||||||||||||||||
| Profit Lock-In Amount: |
$ | 100.00 | $ | 100.00 | $0.00 | ||||||||||||||||||||||||
| Payment at Maturity: |
$1,100 | $1,177 | $1,000 | ||||||||||||||||||||||||||
S-13
| EXAMPLE 4 Hypothetical 30% Increase in the Index |
EXAMPLE 5 Hypothetical 40% Increase in the Index |
EXAMPLE 6 Hypothetical 40% Decrease in the Index |
|||||||||||||||||||||||||||||
| Monthly Return Calculation Date |
Index Value |
Monthly Return |
Summation Amount |
Index Value |
Monthly Return |
Summation Amount |
Index Value |
Monthly Return |
Summation Amount |
||||||||||||||||||||||
| Year 1 | |||||||||||||||||||||||||||||||
| August |
1481.54 | 0.20 | % | 0.20 | % | 1491.89 | 0.90 | % | 0.90 | % | 1678.58 | 2.50 | % | 2.50 | % | ||||||||||||||||
| September |
1490.43 | 0.60 | % | 0.80 | % | 1503.82 | 0.80 | % | 1.70 | % | 1657.92 | -1.23 | % | 1.27 | % | ||||||||||||||||
| October |
1502.35 | 0.80 | % | 1.60 | % | 1476.75 | -1.80 | % | -0.10 | % | 1628.08 | -1.80 | % | -0.53 | % | ||||||||||||||||
| November |
1475.31 | -1.80 | % | -0.20 | % | 1502.60 | 1.75 | % | 1.65 | % | 1546.79 | -4.99 | % | -5.52 | % | ||||||||||||||||
| December |
1501.13 | 1.75 | % | 1.55 | % | 1541.66 | 2.50 | % | 4.15 | % | 1565.35 | 1.20 | % | -4.32 | % | ||||||||||||||||
| January |
1504.13 | 0.20 | % | 1.75 | % | 1522.79 | -1.22 | % | 2.93 | % | 1474.96 | -5.77 | % | -10.10 | % | ||||||||||||||||
| February |
1510.99 | 0.46 | % | 2.21 | % | 1542.13 | 1.27 | % | 4.20 | % | 1486.76 | 0.80 | % | -9.30 | % | ||||||||||||||||
| March |
1530.18 | 1.27 | % | 3.48 | % | 1547.53 | 0.35 | % | 4.55 | % | 1384.68 | -6.87 | % | -16.16 | % | ||||||||||||||||
| April |
1535.53 | 0.35 | % | 3.83 | % | 1612.52 | 2.50 | % | 7.05 | % | 1267.97 | -8.43 | % | -24.59 | % | ||||||||||||||||
| May |
1600.02 | 2.50 | % | 6.33 | % | 1586.72 | -1.60 | % | 5.45 | % | 1150.36 | -9.28 | % | -33.87 | % | ||||||||||||||||
| June |
1574.42 | -1.60 | % | 4.73 | % | 1526.43 | -3.80 | % | 1.65 | % | 1185.69 | 2.50 | % | -31.37 | % | ||||||||||||||||
| July |
1514.60 | -3.80 | % | 0.93 | % | 1550.85 | 1.60 | % | 3.25 | % | 1099.74 | -7.25 | % | -38.62 | % | ||||||||||||||||
| Year 2 | |||||||||||||||||||||||||||||||
| August |
1538.83 | 1.60 | % | 2.53 | % | 1553.95 | 0.20 | % | 3.45 | % | 1025.64 | -6.74 | % | -45.36 | % | ||||||||||||||||
| September |
1541.91 | 0.20 | % | 2.73 | % | 1627.90 | 2.50 | % | 5.95 | % | 1107.64 | 2.50 | % | -42.86 | % | ||||||||||||||||
| October |
1548.07 | 0.40 | % | 3.13 | % | 1631.16 | 0.20 | % | 6.15 | % | 1117.35 | 0.88 | % | -41.98 | % | ||||||||||||||||
| November |
1551.17 | 0.20 | % | 3.33 | % | 1700.00 | 2.50 | % | 8.65 | % | 1254.69 | 2.50 | % | -39.48 | % | ||||||||||||||||
| December |
1700.00 | 2.50 | % | 5.83 | % | 1720.40 | 1.20 | % | 9.85 | % | 1321.69 | 2.50 | % | -36.98 | % | ||||||||||||||||
| January |
1703.40 | 0.20 | % | 6.03 | % | 1730.72 | 0.60 | % | 10.45 | % | 1210.35 | -8.42 | % | -45.40 | % | ||||||||||||||||
| February |
1710.21 | 0.40 | % | 6.43 | % | 1744.57 | 0.80 | % | 11.25 | % | 1206.79 | -0.29 | % | -45.70 | % | ||||||||||||||||
| March |
1723.90 | 0.80 | % | 7.23 | % | 1751.55 | 0.40 | % | 11.65 | % | 1188.47 | -1.52 | % | -47.21 | % | ||||||||||||||||
| April |
1730.79 | 0.40 | % | 7.63 | % | 1587.97 | -9.34 | % | 2.31 | % | 1149.56 | -3.27 | % | -50.49 | % | ||||||||||||||||
| May |
1734.25 | 0.20 | % | 7.83 | % | 1627.96 | 2.50 | % | 4.81 | % | 1154.16 | 0.40 | % | -50.09 | % | ||||||||||||||||
| June |
1627.96 | -6.13 | % | 1.70 | % | 1650.75 | 1.40 | % | 6.21 | % | 1156.47 | 0.20 | % | -49.89 | % | ||||||||||||||||
| July |
1647.50 | 1.20 | % | 2.90 | % | 1657.35 | 0.40 | % | 6.61 | % | 1161.09 | 0.40 | % | -49.49 | % | ||||||||||||||||
| Year 3 | |||||||||||||||||||||||||||||||
| August |
1654.09 | 0.40 | % | 3.30 | % | 1667.30 | 0.60 | % | 7.21 | % | 1175.03 | 1.20 | % | -48.29 | % | ||||||||||||||||
| September |
1657.39 | 0.20 | % | 3.50 | % | 1673.97 | 0.40 | % | 7.61 | % | 1179.73 | 0.40 | % | -47.89 | % | ||||||||||||||||
| October |
1664.02 | 0.40 | % | 3.90 | % | 1852.96 | 2.50 | % | 10.11 | % | 1025.97 | -13.03 | % | -60.92 | % | ||||||||||||||||
| November |
1667.35 | 0.20 | % | 4.10 | % | 1860.37 | 0.40 | % | 10.51 | % | 1098.46 | 2.50 | % | -58.42 | % | ||||||||||||||||
| December |
1674.02 | 0.40 | % | 4.50 | % | 1901.30 | 2.20 | % | 12.71 | % | 1100.66 | 0.20 | % | -58.22 | % | ||||||||||||||||
| January |
1710.85 | 2.20 | % | 6.70 | % | 1946.93 | 2.40 | % | 15.11 | % | 1105.06 | 0.40 | % | -57.82 | % | ||||||||||||||||
| February |
1717.69 | 0.40 | % | 7.10 | % | 1970.29 | 1.20 | % | 16.31 | % | 1054.96 | -4.53 | % | -62.36 | % | ||||||||||||||||
| March |
1721.13 | 0.20 | % | 7.30 | % | 2000.89 | 1.55 | % | 17.86 | % | 979.46 | -7.16 | % | -69.51 | % | ||||||||||||||||
| April |
1728.01 | 0.40 | % | 7.70 | % | 2064.92 | 2.50 | % | 20.36 | % | 886.48 | -9.49 | % | -79.01 | % | ||||||||||||||||
| May |
1731.47 | 0.20 | % | 7.90 | % | 2017.43 | -2.30 | % | 18.06 | % | 900.78 | 1.61 | % | -77.39 | % | ||||||||||||||||
| June |
1738.39 | 0.40 | % | 8.30 | % | 1854.68 | -8.07 | % | 9.99 | % | 957.673 | 2.50 | % | -74.89 | % | ||||||||||||||||
| July |
1922.15 | 2.50 | % | 10.80 | % | 2070.01 | 2.50 | % | 12.49 | % | 887.15 | -7.36 | % | -82.26 | % | ||||||||||||||||
| Total Percentage Change in the Nasdaq-100 Index: |
30.00 | % | 40.00 | % | –40.00 | % | |||||||||||||||||||||||||
| Supplemental Redemption Amount: |
$ | 108.00 | $ | 125.00 | –$823.00 | ||||||||||||||||||||||||||
| Profit Lock-In Amount: |
$ | 100.00 | $ | 200.00 | $100.00 | ||||||||||||||||||||||||||
| Payment at Maturity: |
$1,108 | $ | 1,200 | $ | 1,000 | ||||||||||||||||||||||||||
As you can see from the foregoing hypothetical examples, payment at maturity of any amount in excess of $1,000 per unit of the SUMS will depend, subject to the Monthly Return Cap and the Profit Lock-In Amount, on the sum of the Monthly Returns of the Nasdaq-100 Index during the term of the SUMS. You may receive only $1,000 per unit at maturity for your SUMS and this may occur even if the value of the Nasdaq-100 Index increases significantly over the term of the SUMS as illustrated in hypothetical example 3. Each shaded and bolded Summation Amount in the foregoing hypothetical examples represents a point at which the Profit Lock-In Amount would be increased.
Adjustments to the Nasdaq-100 Index; Market Disruption Events
If at any time the Nasdaq makes a material change in the formula for or the method of calculating the Nasdaq-100 Index or in any other way materially modifies the Nasdaq-100 Index so that the Nasdaq-100 Index does not, in the opinion of the calculation agent, fairly represent the value of the Nasdaq-100 Index had those changes or modifications not been made, then, from and after that time, the calculation agent will, at the close of business in New York, New York, on each date that the closing value of the Nasdaq-100 Index is to be calculated, make those adjustments as, in the good faith judgment of the calculation agent, may be necessary in order to arrive at a calculation of a value of a stock index comparable to the Nasdaq-100 Index as if those changes or modifications had not been made, and calculate the closing value with reference to the Nasdaq-100 Index, as so adjusted. Accordingly, if the method of calculating the Nasdaq-100 Index is modified so that the value of the Nasdaq-100 Index is a fraction or a multiple of what it would have been if it had not been modified, e.g., due to a split, then the calculation agent will adjust the Nasdaq-100 Index in order to arrive at a value of the Nasdaq-100 Index as if it had not been modified, e.g., as if a split had not occurred.
S-14
“Market Disruption Event” means either of the following events as determined by the calculation agent:
| (A) | the suspension of or material limitation on trading for more than two hours of trading, or during the one-half hour period preceding the close of trading, on the applicable exchange, in 20% or more of the stocks which then comprise the Nasdaq-100 Index or any successor index; or |
| (B) | the suspension of or material limitation on trading, in each case, for more than two hours of trading, or during the one-half hour period preceding the close of trading, on the applicable exchange, whether by reason of movements in price otherwise exceeding levels permitted by the relevant exchange or otherwise, in option contracts or futures contracts related to the Nasdaq-100 Index, or any successor index, which are traded on any major U.S. exchange. |
For the purpose of the above definition:
| (1) | a limitation on the hours in a trading day and/or number of days of trading will not constitute a Market Disruption Event if it results from an announced change in the regular business hours of the relevant exchange, and |
| (2) | for the purpose of clause (A) above, any limitations on trading during significant market fluctuations under NYSE Rule 80A, or any applicable rule or regulation enacted or promulgated by the NYSE or any other self regulatory organization or the SEC of similar scope as determined by the calculation agent, will be considered “material”. |
As a result of terrorist attacks the financial markets were closed from September 11, 2001 through September 14, 2001 and values of the Nasdaq-100 Index are not available for those dates. Those market closures would have constituted Market Disruption Events.
Discontinuance of the Nasdaq-100 Index
If the Nasdaq discontinues publication of the Nasdaq-100 Index and the Nasdaq or another entity publishes a successor or substitute index that the calculation agent determines, in its sole discretion, to be comparable to the Nasdaq-100 Index (a “successor index”), then, upon the calculation agent’s notification of its determination to the trustee and ML&Co., the calculation agent will substitute the successor index as calculated by the Nasdaq or any other entity for the Nasdaq-100 Index and calculate the Monthly Returns as described above under “—Payment at maturity”. Upon any selection by the calculation agent of a successor index, ML&Co. shall cause notice to be given to holders of the SUMS.
In the event that the Nasdaq discontinues publication of the Nasdaq-100 Index and:
| • | the calculation agent does not select a successor index, or |
| • | the successor index is no longer published, |
the calculation agent will compute a substitute value for the Nasdaq-100 Index in accordance with the procedures last used to calculate the Nasdaq-100 Index before any discontinuance. If a successor index is selected or the calculation agent calculates a value as a substitute for the Nasdaq-100 Index as described below, the successor index or value will be used as a substitute for the Nasdaq-100 Index for all purposes, including for purposes of determining whether a Market Disruption Event exists.
If the Nasdaq discontinues publication of the Nasdaq-100 Index before a Monthly Return Calculation Date and the calculation agent determines that no successor index is available at that time, then on each Business Day until the earlier to occur of:
| • | the determination of an Ending Value, and |
| • | a determination by the calculation agent that a successor index is available, |
S-15
the calculation agent will determine the value that would be used in computing a Monthly Return as described in the preceding paragraph as if that day were a Monthly Return Calculation Date. The calculation agent will cause notice of each value to be published not less often than once each month in The Wall Street Journal or another newspaper of general circulation, and arrange for information with respect to these values to be made available by telephone.
Notwithstanding these alternative arrangements, discontinuance of the publication of the Nasdaq-100 Index may adversely affect trading in the SUMS.
Events of Default and Acceleration
In case an Event of Default with respect to any SUMS has occurred and is continuing, the amount payable to a beneficial owner of a SUMS upon any acceleration permitted by the SUMS, with respect to each unit of SUMS, will be equal to the amount payable on the stated maturity date, calculated as though the date of early repayment were the stated maturity date and the final Monthly Return Calculation Date of the SUMS. See “—Payment at Maturity” in this prospectus supplement. If a bankruptcy proceeding is commenced in respect of ML&Co., the claim of the holder of a SUMS may be limited, under Section 502(b)(2) of Title 11 of the United States Code, to the original public offering price of the SUMS plus an additional amount of contingent interest calculated as though the date of the commencement of the proceeding were the maturity date of the SUMS.
In case of default in payment of the SUMS, whether at the stated maturity date or upon acceleration, from and after that date the SUMS will bear interest, payable upon demand of their holders, at the rate of % per annum, to the extent that payment of any interest is legally enforceable on the unpaid amount due and payable on that date in accordance with the terms of the SUMS to the date payment of that amount has been made or duly provided for.
S-16
The Nasdaq-100 Index is a modified market capitalization-weighted index of 100 of the largest stocks of non-financial companies listed on the Nasdaq National Market tier of The Nasdaq Stock Market. The Nasdaq-100 Index was first published in January 1985 and includes companies across a variety of major industry groups. As of March 31, 2004, the major industry groups covered in the Index (listed according to their respective capitalization in the Nasdaq-100 Index) were as follows: computer and office equipment (30.81%); computer software/services (25.64%); biotechnology (9.51%); telecommunications (13.41%); retail/wholesale trade (9.99%); health care (4.06%); services (3.44%); manufacturing (2.31%); and transportation (0.83%). The identity and capitalization weightings of the five largest companies represented in the Index as of March 31, 2004 were as follows: Microsoft Corporation (7.98%); QUALCOMM Incorporated (5.55%); Intel Corporation (5.31%); Cisco Systems, Inc. (4.97%); and Amgen Inc. (2.99%). Current information regarding the market value of the Nasdaq-100 Index is available from the Nasdaq as well as numerous market information services. The Nasdaq-100 Index is determined, comprised and calculated by the Nasdaq without regard to the SUMS.
The Nasdaq-100 Index share weights of the component securities of the Nasdaq-100 Index at any time are based upon the total shares outstanding in each of those securities and are additionally subject, in certain cases, to rebalancing. Accordingly, each underlying stock’s influence on the value of the Nasdaq-100 Index is directly proportional to the value of its Nasdaq-100 Index share weight.
Computation of the Nasdaq-100 Index
Underlying Stock Eligibility Criteria and Annual Ranking Review
Initial Eligibility Criteria
To be eligible for initial inclusion in the Nasdaq-100 Index, a security must be listed on The Nasdaq Stock Market and meet the following criteria:
| • | the security must be listed on the Nasdaq National Market (unless the security was dually listed on another U.S. market prior to January 1, 2004 and has continuously maintained that listing); |
| • | the security must be of a non-financial company; |
| • | the security may not be issued by an issuer currently in bankruptcy proceedings; |
| • | the security must have an average daily trading volume on The Nasdaq Stock Market of at least 200,000 shares; |
| • | if the security is of a foreign issuer (a foreign issuer is determined based on its country of incorporation), it must have listed options or be eligible for listed-options trading; |
| • | only one class of security per issuer is allowed; |
| • | the issuer of the security may not have entered into a definitive agreement or other arrangement which would result in the security no longer being listed on The Nasdaq Stock Market within the next six months; |
| • | the issuer of the security may not have annual financial statements with an audit opinion which the auditor or the company have indicated cannot be currently relied upon; |
| • | the security must have “seasoned” on The Nasdaq Stock Market or another recognized market (generally, a company is considered to be seasoned if it has been listed on a market for at least two years; in the case of spin-offs, the operating history of the spin-off will be considered); and |
| • | if the security would otherwise qualify to be in the top 25% of the securities included in the Nasdaq-100 Index by market capitalization for the six prior consecutive month ends, then a one-year “seasoning” criteria would apply. |
S-17
Continued Eligibility Criteria
In addition, to be eligible for continued inclusion in the Nasdaq-100 Index the following criteria apply:
| • | the security must be listed on the Nasdaq National Market (unless the security was dually listed on another U.S. market prior to January 1, 2004 and has continuously maintained that listing); |
| • | the security must be of a non-financial company; |
| • | the security may not be issued by an issuer currently in bankruptcy proceedings; |
| • | the security must have an average daily trading volume of at least 200,000 shares; |
| • | if the security is of a foreign issuer, it must have listed options or be eligible for listed-options trading, as measured annually during the ranking review process; |
| • | the security must have an adjusted market capitalization equal to or exceeding 0.10% of the aggregate adjusted market capitalization of the Nasdaq-100 Index at each month end. In the event a company does not meet this criterion for two consecutive month ends, it will be removed from the Nasdaq-100 Index effective after the close of trading on the third Friday of the following month; and |
| • | the issuer of the security may not have annual financial statements with an audit opinion which the auditor or the company have indicated cannot be currently relied upon. |
These Nasdaq-100 Index eligibility criteria may be revised from time to time by the Nasdaq without regard to the SUMS.
The Nasdaq-100 Index securities are evaluated on an annual basis, except under extraordinary circumstances which may result in an interim evaluation, as follows (this evaluation is referred to herein as the “Ranking Review”). Securities listed on The Nasdaq Stock Market which meet the above eligibility criteria are ranked by market value using closing prices as of the end of October and publicly available total shares outstanding as of the end of November. Nasdaq-100 Index eligible securities which are already in the Nasdaq-100 Index and which are in the top 150 eligible securities (based on market value) are retained in the Nasdaq-100 Index provided that such security was ranked in the top 100 eligible securities as of the previous ranking review. Securities not meeting such criteria are replaced. The replacement securities chosen are those Nasdaq-100 Index eligible securities not currently in the Nasdaq-100 Index which have the largest market capitalization.
Generally, the list of annual additions and deletions is publicly announced via a press release in the early part of December and replacements are made effective after the close of trading on the third Friday in December. Moreover, if at any time during the year a Nasdaq-100 Index security is no longer traded on The Nasdaq Stock Market, or is otherwise determined by the Nasdaq to become ineligible for continued inclusion in the Nasdaq-100 Index, the security will be replaced with the largest market capitalization security not currently in the Nasdaq-100 Index and meeting the Nasdaq-100 Index eligibility criteria listed above.
In addition to the Ranking Review, the securities in the Nasdaq-100 Index are monitored every day by the Nasdaq with respect to changes in total shares outstanding arising from secondary offerings, stock repurchases, conversions or other corporate actions. The Nasdaq has adopted the following quarterly scheduled weight adjustment procedures with respect to those changes. If the change in total shares outstanding arising from a corporate action is greater than or equal to 5.0%, that change is made to the Nasdaq-100 Index on the evening prior to the effective date of that corporate action or as soon as practical thereafter. Otherwise, if the change in total shares outstanding is less than 5.0%, then all those changes are accumulated and made effective at one time on a quarterly basis after the close of trading on the third Friday in each of March, June, September and December. In either case, the Nasdaq-100 Index share weights for those underlying stocks are adjusted by the same percentage amount by which the total shares outstanding have changed in those Nasdaq-100 Index securities. Ordinarily, whenever there is a change in the Nasdaq-100 Index share weights or a change in a
S-18
component security included in the Nasdaq-100 Index, the Nasdaq adjusts the divisor to assure that there is no discontinuity in the value of the Nasdaq-100 Index which might otherwise be caused by any of those changes.
Rebalancing of the Nasdaq-100 Index
The Nasdaq-100 Index is calculated under a “modified capitalization-weighted” methodology, which is a hybrid between equal weighting and conventional capitalization weighting. This methodology is expected to: (1) retain in general the economic attributes of capitalization weighting; (2) promote portfolio weight diversification (thereby limiting domination of the Nasdaq-100 Index by a few large stocks); (3) reduce Nasdaq-100 Index performance distortion by preserving the capitalization ranking of companies; and (4) reduce market impact on the smallest Nasdaq-100 Index securities from necessary weight rebalancings.
Under the methodology employed, on a quarterly basis coinciding with the Nasdaq’s quarterly scheduled weight adjustment procedures, the Nasdaq-100 Index securities are categorized as either “Large Stocks” or “Small Stocks” depending on whether their current percentage weights (after taking into account such scheduled weight adjustments due to stock repurchases, secondary offerings or other corporate actions) are greater than, or less than or equal to, the average percentage weight in the Nasdaq-100 Index (i.e., as a 100-stock index, the average percentage weight in the Nasdaq-100 Index is 1.0%).
This quarterly examination will result in a Nasdaq-100 Index rebalancing if either one or both of the following two weight distribution requirements are not met: (1) the current weight of the single largest market capitalization Nasdaq-100 Index security must be less than or equal to 24.0% and (2) the “collective weight” of those Nasdaq-100 Index securities whose individual current weights are in excess of 4.5%, when added together, must be less than or equal to 48.0%. In addition, the Nasdaq may conduct a special rebalancing if it is determined necessary to maintain the integrity of the Nasdaq-100 Index.
If either one or both of these weight distribution requirements are not met upon quarterly review, or the Nasdaq determines that a special rebalancing is required, a weight rebalancing will be performed. First, relating to weight distribution requirement (1) above, if the current weight of the single largest Nasdaq-100 Index security exceeds 24.0%, then the weights of all Large Stocks will be scaled down proportionately towards 1.0% by enough for the adjusted weight of the single largest Nasdaq-100 Index security to be set to 20.0%. Second, relating to weight distribution requirement (2) above, for those Nasdaq-100 Index securities whose individual current weights or adjusted weights in accordance with the preceding step are in excess of 4.5%, if their “collective weight” exceeds 48.0%, then the weights of all Large Stocks will be scaled down proportionately towards 1.0% by just enough for the “collective weight”, so adjusted, to be set to 40.0%.
The aggregate weight reduction among the Large Stocks resulting from either or both of the above rescalings will then be redistributed to the Small Stocks in the following iterative manner. In the first iteration, the weight of the largest Small Stock will be scaled upwards by a factor which sets it equal to the average Nasdaq-100 Index weight of 1.0%. The weights of each of the smaller remaining Small Stocks will be scaled up by the same factor reduced in relation to each stock’s relative ranking among the Small Stocks such that the smaller the Nasdaq-100 Index security in the ranking, the less the scale-up of its weight. This is intended to reduce the market impact of the weight rebalancing on the smallest component securities in the Nasdaq-100 Index.
In the second iteration, the weight of the second largest Small Stock, already adjusted in the first iteration, will be scaled upwards by a factor which sets it equal to the average index weight of 1.0%. The weights of each of the smaller remaining Small Stocks will be scaled up by this same factor reduced in relation to each stock’s relative ranking among the Small Stocks such that, once again, the smaller the stock in the ranking, the less the scale-up of its weight.
S-19
Additional iterations will be performed until the accumulated increase in weight among the Small Stocks exactly equals the aggregate weight reduction among the Large Stocks from rebalancing in accordance with weight distribution requirement (1) and/or weight distribution requirement (2).
Then, to complete the rebalancing procedure, once the final percent weights of each of the Nasdaq-100 Index securities are set, the Nasdaq-100 Index share weights will be determined anew based upon the last sale prices and aggregate capitalization of the Nasdaq-100 Index at the close of trading on the Thursday in the week immediately preceding the week of the third Friday in March, June, September and December. Changes to the Nasdaq-100 Index share weights will be made effective after the close of trading on the third Friday in March, June, September and December and an adjustment to the Nasdaq-100 Index divisor will be made to ensure continuity of the Index.
Ordinarily, new rebalanced weights will be determined by applying the above procedures to the current Nasdaq-100 Index share weights. However, the Nasdaq may from time to time determine rebalanced weights, if necessary, by instead applying the above procedure to the actual current market capitalization of the Nasdaq-100 Index components. In those instances, the Nasdaq would announce the different basis for rebalancing prior to its implementation.
Month-End Closing Values of the Nasdaq-100 Index. The following table sets forth the closing value of the Nasdaq-100 Index at the end of each month, in the period from February 1985 through June 2004 as well as the percentage increase or decrease in the value of the Nasdaq-100 Index over such month. This historical data on the Nasdaq-100 Index is not necessarily indicative of the future performance of the Nasdaq-100 Index or what the value of the SUMS may be. Any historical upward or downward trend in the closing value of the Nasdaq-100 Index during any period set forth below is not any indication that the Nasdaq-100 Index is more or less likely to increase or decrease at any time during the term of the SUMS. The closing value of the Nasdaq-100 Index on June 30, 2004 was 1,516.64.
Month-End Closing Values and Monthly Percentage Change of the Nasdaq-100 Index
| 1985 |
Percent Change for Month Ending: |
1986 |
Percent Change for Month Ending: |
1987 |
Percent Change for Month Ending: |
1988 |
Percent Change |
|||||||||||||
| January |
132.93 | 0.48 | % | 166.68 | 17.87 | % | 159.13 | 1.84 | % | |||||||||||
| February |
123.52 | 140.43 | 5.64 | 182.75 | 9.64 | 172.64 | 8.49 | |||||||||||||
| March |
117.36 | –4.99 | % | 148.86 | 6.00 | 186.04 | 1.80 | 173.26 | 0.36 | |||||||||||
| April |
115.38 | –1.69 | 154.91 | 4.06 | 184.83 | –0.65 | 175.92 | 1.54 | ||||||||||||
| May |
119.64 | 3.69 | 163.16 | 5.33 | 188.77 | 2.13 | 173.34 | –1.47 | ||||||||||||
| June |
122.14 | 2.09 | 162.62 | –0.33 | 189.24 | 0.25 | 189.03 | 9.05 | ||||||||||||
| July |
123.27 | 0.93 | 144.52 | –11.13 | 196.35 | 3.76 | 181.16 | –4.16 | ||||||||||||
| August |
118.30 | –4.03 | 151.70 | 4.97 | 209.57 | 6.73 | 171.00 | –5.61 | ||||||||||||
| September |
110.62 | –6.49 | 137.50 | –9.36 | 205.50 | –1.94 | 179.37 | 4.89 | ||||||||||||
| October |
115.48 | 4.39 | 144.48 | 5.08 | 150.07 | –26.97 | 174.78 | –2.56 | ||||||||||||
| November |
126.06 | 9.16 | 147.94 | 2.39 | 137.13 | –8.62 | 169.19 | –3.20 | ||||||||||||
| December |
132.29 | 4.94 | 141.41 | –4.41 | 156.25 | 13.94 | 177.41 | 4.86 |
| 1989 |
Percent Change |
1990 |
Percent Change |
1991 |
Percent Change |
1992 |
Percent Change |
|||||||||||||
| January |
186.47 | 5.11 | % | 201.94 | –9.78 | % | 232.43 | 15.91 | % | 338.31 | 2.25 | % | ||||||||
| February |
183.79 | –1.44 | 207.94 | 2.96 | 250.11 | 7.61 | 345.88 | 2.24 | ||||||||||||
| March |
185.87 | 1.13 | 213.15 | 2.52 | 264.91 | 5.92 | 323.05 | –6.60 | ||||||||||||
| April |
200.47 | 7.85 | 205.81 | –3.44 | 263.66 | –0.47 | 307.86 | –4.70 | ||||||||||||
| May |
214.55 | 7.02 | 236.15 | 14.74 | 279.00 | 5.82 | 315.30 | 2.42 | ||||||||||||
| June |
204.58 | –4.65 | 238.46 | 0.98 | 254.19 | –8.89 | 301.23 | –4.46 | ||||||||||||
| July |
214.28 | 4.74 | 223.39 | –6.32 | 272.16 | 7.07 | 310.90 | 3.21 | ||||||||||||
| August |
222.01 | 3.61 | 193.61 | –13.33 | 287.41 | 5.60 | 299.26 | –3.74 | ||||||||||||
| September |
226.42 | 1.99 | 177.06 | –8.55 | 287.54 | 0.05 | 313.18 | 4.65 | ||||||||||||
| October |
222.61 | –1.68 | 172.56 | –2.54 | 292.51 | 1.73 | 329.15 | 5.10 | ||||||||||||
| November |
224.44 | 0.82 | 192.66 | 11.65 | 284.79 | –2.64 | 350.96 | 6.63 | ||||||||||||
| December |
223.83 | –0.27 | 200.53 | 4.08 | 330.85 | 16.17 | 360.18 | 2.63 | ||||||||||||
S-20
| 1993 |
Percent Change |
1994 |
Percent Change |
1995 |
Percent Change |
1996 |
Percent Change |
1997 |
Percent Change |
||||||||||||||||
| January |
370.56 | 2.88 | % | 413.99 | 3.94 | % | 405.33 | 0.26 | % | 591.82 | 2.71 | % | 921.55 | 12.20 | % | ||||||||||
| February |
351.14 | –5.24 | 412.17 | –0.44 | 432.50 | 6.70 | 622.83 | 5.24 | 850.46 | –7.71 | |||||||||||||||
| March |
359.42 | 2.36 | 382.96 | –7.09 | 447.15 | 3.39 | 609.69 | –2.11 | 797.06 | –6.28 | |||||||||||||||
| April |
339.94 | –5.42 | 373.25 | –2.54 | 469.56 | 5.01 | 666.73 | 9.36 | 874.74 | 9.75 | |||||||||||||||
| May |
368.11 | 8.29 | 378.85 | 1.50 | 488.10 | 3.95 | 692.39 | 3.85 | 958.85 | 9.62 | |||||||||||||||
| June |
366.13 | –0.54 | 360.30 | –4.90 | 538.03 | 10.23 | 677.30 | –2.18 | 957.30 | –0.16 | |||||||||||||||
| July |
352.86 | –3.62 | 370.16 | 2.74 | 568.88 | 5.73 | 636.01 | –6.10 | 1,107.03 | 15.64 | |||||||||||||||
| August |
372.65 | 5.61 | 397.90 | 7.49 | 576.77 | 1.39 | 663.57 | 4.33 | 1,074.17 | –2.97 | |||||||||||||||
| September |
382.71 | 2.70 | 393.85 | –1.02 | 585.08 | 1.44 | 737.58 | 11.15 | 1,097.17 | 2.14 | |||||||||||||||
| October |
390.98 | 2.16 | 413.05 | 4.87 | 598.78 | 2.34 | 751.99 | 1.95 | 1,019.62 | –7.07 | |||||||||||||||
| November |
386.76 | –1.08 | 404.82 | –1.99 | 593.72 | –0.85 | 834.01 | 10.91 | 1,050.51 | 3.03 | |||||||||||||||
| December |
398.28 | 2.98 | 404.27 | –0.14 | 576.23 | –2.95 | 821.36 | –1.52 | 990.80 | –5.68 | |||||||||||||||
| 1998 |
Percent Change for Month Ending: |
1999 |
Percent Change for Month Ending: |
2000 |
Percent Change for Month Ending: |
2001 |
Percent Change for Month Ending: |
2002 |
Percent Change for Month Ending: |
||||||||||||||||
| January |
1,071.13 | 8.11 | % | 2,127.19 | 15.86 | % | 3,570.05 | –3.72 | % | 2,593.00 | 10.73 | % | 1,550.17 | –1.70 | % | ||||||||||
| February |
1,194.13 | 11.48 | 1,925.28 | –9.49 | 4,266.94 | 19.52 | 1,908.32 | –26.40 | 1,359.22 | –12.32 | |||||||||||||||
| March |
1,220.66 | 2.22 | 2,106.39 | 9.41 | 4,397.84 | 3.07 | 1,573.25 | –17.56 | 1,452.81 | 6.89 | |||||||||||||||
| April |
1,248.12 | 2.25 | 2,136.39 | 1.42 | 3,773.18 | –14.20 | 1,855.15 | 17.92 | 1,277.07 | –12.10 | |||||||||||||||
| May |
1,192.07 | –4.49 | 2,089.70 | –2.19 | 3,324.08 | –11.90 | 1,799.89 | –2.98 | 1,208.34 | –5.38 | |||||||||||||||
| June |
1,337.34 | 12.19 | 2,296.77 | 9.91 | 3,763.79 | 13.23 | 1,830.19 | 1.68 | 1,051.41 | –12.99 | |||||||||||||||
| July |
1,377.26 | 2.99 | 2,270.93 | –1.13 | 3,609.35 | –4.10 | 1,683.61 | –8.01 | 962.11 | –8.49 | |||||||||||||||
| August |
1,140.34 | –17.20 | 2,396.87 | 5.55 | 4,077.59 | 12.97 | 1,469.70 | –12.71 | 942.38 | –2.05 | |||||||||||||||
| September |
1,345.48 | 17.99 | 2,407.90 | 0.46 | 3,570.61 | –12.43 | 1,168.37 | –20.50 | 832.52 | –11.66 | |||||||||||||||
| October |
1,400.52 | 4.09 | 2,637.44 | 9.53 | 3,282.30 | –8.07 | 1,364.78 | 16.81 | 989.54 | 18.86 | |||||||||||||||
| November |
1,557.96 | 11.24 | 2,966.71 | 12.48 | 2,506.54 | –23.63 | 1,596.05 | 16.95 | 1,116.10 | 12.79 | |||||||||||||||
| December |
1,836.01 | 17.85 | 3,707.83 | 24.98 | 2,341.70 | –6.58 | 1,577.05 | –1.19 | 984.36 | –11.80 | |||||||||||||||
| 2003 |
Percent Change for Month Ending: |
2004 |
Percent Change for Month Ending: |
||||||||||||||||||||||
| January |
983.05 | –0.13 | % | 1,493.08 | 1.71 | % | |||||||||||||||||||
| February |
1,009.74 | 2.72 | 1,470.38 | –1.52 | |||||||||||||||||||||
| March |
1,018.66 | 0.88 | 1,438.41 | –2.17 | |||||||||||||||||||||
| April |
1,106.06 | 8.58 | 1,401.36 | –2.58 | |||||||||||||||||||||
| May |
1,197.89 | 8.30 | 1,466.22 | 4.63 | |||||||||||||||||||||
| June |
1,201.69 | 0.32 | 1,516.64 | 3.44 | |||||||||||||||||||||
| July |
1,276.94 | 6.26 | |||||||||||||||||||||||
| August |
1,314.20 | 5.03 | |||||||||||||||||||||||
| September |
1,303.70 | –2.80 | |||||||||||||||||||||||
| October |
1,416.39 | 8.64 | |||||||||||||||||||||||
| November |
1,424.25 | 0.55 | |||||||||||||||||||||||
| December |
1,467.92 | 3.07 | |||||||||||||||||||||||
S-21
The following graph sets forth the monthly performance of the Nasdaq-100 Index at the end of each month presented in the table above. The returns would vary if the monthly percentage change was calculated using any date other than the last day of each month. Past movements of the Nasdaq-100 Index are not indicative of the future Nasdaq-100 Index values.
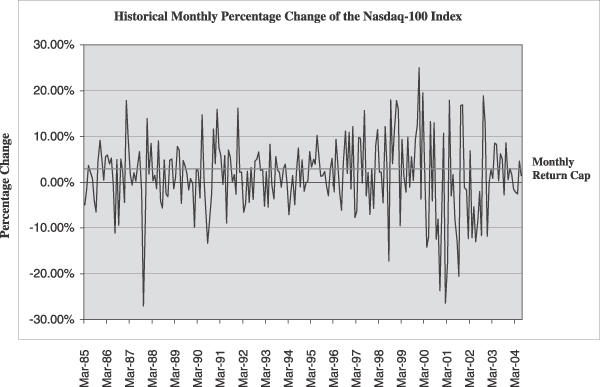
The Monthly Return Cap of 2.5% for the SUMS is indicated in the above graph. This is intended to illustrate on a historical basis where the Monthly Return Cap would have limited the monthly percentage increase added to the Summation Amount. This is for illustration only. Past movements of the Nasdaq-100 Index are not indicative of the future Nasdaq-100 Index values.
License Agreement
The Nasdaq and ML&Co. have entered into a non-exclusive license agreement providing for the license to ML&Co., in exchange for a fee, of the right to use the Nasdaq-100 Index in connection with certain securities, including the SUMS.
The license agreement between the Nasdaq and ML&Co. provides that the following language must be stated in this prospectus supplement:
“The SUMS are not sponsored, endorsed, sold or promoted by, The Nasdaq Stock Market, Inc. (including its affiliates) (the Nasdaq, with its affiliates, are referred to as the “Corporations”). The Corporations have not passed on the legality or suitability of, or the accuracy or adequacy of descriptions and disclosures relating to, the SUMS. The Corporations make no representation or warranty, express or implied to the owners of the SUMS or any member of the public regarding the advisability of investing in securities generally or in the SUMS particularly, or the ability of the NASDAQ-100 Index& to track general stock market performance. The Corporations’ only relationship to ML&Co. is in the licensing of the NASDAQ-100&, NASDAQ-100 Index& , and Nasdaq& trademarks
S-22
or service marks, and certain trade names of the Corporations and the use of the NASDAQ-100 Index& which is determined, composed and calculated by Nasdaq without regard to ML&Co. or the SUMS. Nasdaq has no obligation to take the needs of ML&Co. or the owners of the SUMS into consideration in determining, composing or calculating the NASDAQ-100 Index&. The Corporations are not responsible for and have not participated in the determination of the timing of, prices at, or quantities of the SUMS to be issued or in the determination or calculation of the equation by which the SUMS are to be converted into cash. The Corporations have no liability in connection with the administration, marketing or trading of the SUMS.
THE CORPORATIONS DO NOT GUARANTEE THE ACCURACY AND/OR UNINTERRUPTED CALCULATION OF THE NASDAQ-100 INDEX& OR ANY DATA INCLUDED THEREIN. THE CORPORATIONS MAKE NO WARRANTY, EXPRESS OR IMPLIED, AS TO RESULTS TO BE OBTAINED BY ML&CO., OWNERS OF THE SUMS, OR ANY OTHER PERSON OR ENTITY FROM THE USE OF THE NASDAQ-100 INDEX& OR ANY DATA INCLUDED THEREIN. THE CORPORATIONS MAKE NO EXPRESS OR IMPLIED WARRANTIES, AND EXPRESSLY DISCLAIM ALL WARRANTIES OF MERCHANTABILITY OR FITNESS FOR A PARTICULAR PURPOSE OR USE WITH RESPECT TO THE NASDAQ-100 INDEX& OR ANY DATA INCLUDED THEREIN. WITHOUT LIMITING ANY OF THE FOREGOING, IN NO EVENT SHALL THE CORPORATIONS HAVE ANY LIABILITY FOR ANY LOST PROFITS OR SPECIAL, INCIDENTAL, PUNITIVE, INDIRECT, OR CONSEQUENTIAL DAMAGES, EVEN IF NOTIFIED OF THE POSSIBILITY OF SUCH DAMAGES.”
All disclosures contained in this prospectus supplement regarding the Nasdaq-100 Index, including its make-up, method of calculation and changes in its components, are derived from publicly available information prepared by Nasdaq. ML&Co. and MLPF&S do not assume any responsibility for the accuracy or completeness of that information.
S-23
UNITED STATES FEDERAL INCOME TAXATION
Set forth in full below is the opinion of Sidley Austin Brown & Wood LLP, tax counsel to ML&Co., as to certain United States federal income tax consequences of the purchase, ownership and disposition of the SUMS. This opinion is based upon laws, regulations, rulings and decisions now in effect, all of which are subject to change (including retroactive changes in effective dates) or possible differing interpretations. The discussion below deals only with SUMS held as capital assets and does not purport to deal with persons in special tax situations, such as financial institutions, insurance companies, regulated investment companies, dealers in securities or currencies, traders in securities that elect to mark to market, tax-exempt entities, persons holding SUMS in a tax-deferred or tax-advantaged account, or persons holding SUMS as a hedge against currency risks, as a position in a “straddle” or as part of a “hedging” or “conversion” transaction for tax purposes. It also does not deal with holders other than original purchasers (except where otherwise specifically noted in this prospectus supplement). The following discussion also assumes that the issue price of the SUMS, as determined for United States federal income tax purposes, equals the principal amount thereof. Persons considering the purchase of the SUMS should consult their own tax advisors concerning the application of the United States federal income tax laws to their particular situations as well as any consequences of the purchase, ownership and disposition of the SUMS arising under the laws of any other taxing jurisdiction.
As used in this prospectus supplement, the term “U.S. Holder” means a beneficial owner of a SUMS that is for United States federal income tax purposes (a) a citizen or resident of the United States, (b) a corporation, partnership or other entity treated as a corporation or a partnership created or organized in or under the laws of the United States, any state thereof or the District of Columbia (other than a partnership that is not treated as a United States person under any applicable Treasury regulations), (c) an estate the income of which is subject to United States federal income taxation regardless of its source, (d) a trust if a court within the United States is able to exercise primary supervision over the administration of the trust and one or more United States persons have the authority to control all substantial decisions of the trust or (e) any other person whose income or gain in respect of a SUMS is effectively connected with the conduct of a United States trade or business. Notwithstanding clause (d) of the preceding sentence, to the extent provided in Treasury regulations, certain trusts in existence on August 20, 1996, and treated as United States persons prior to that date that elect to continue to be treated as United States persons also will be U.S. Holders. As used herein, the term “non-U.S. Holder” means a beneficial owner of a SUMS that is not a U.S. Holder.
General
There are no statutory provisions, regulations, published rulings or judicial decisions addressing or involving the characterization, for United States federal income tax purposes, of the SUMS or securities with terms substantially the same as the SUMS. However, although the matter is not free from doubt, under current law, each SUMS should be treated as a debt instrument of ML&Co. for United States federal income tax purposes. ML&Co. currently intends to treat each SUMS as a debt instrument of ML&Co. for United States federal income tax purposes and, where required, intends to file information returns with the Internal Revenue Service (the “IRS”) in accordance with this treatment, in the absence of any change or clarification in the law, by regulation or otherwise, requiring a different characterization of the SUMS. Prospective investors in the SUMS should be aware, however, that the IRS is not bound by ML&Co.’s characterization of the SUMS as indebtedness, and the IRS could possibly take a different position as to the proper characterization of the SUMS for United States federal income tax purposes. The following discussion of the principal United States federal income tax consequences of the purchase, ownership and disposition of the SUMS is based upon the assumption that each SUMS will be treated as a debt instrument of ML&Co. for United States federal income tax purposes. If the SUMS are not in fact treated as debt instruments of ML&Co. for United States federal income tax purposes, then the United States federal income tax treatment of the purchase, ownership and disposition of the SUMS could differ from the treatment discussed below with the result that the timing and character of income, gain or loss recognized in respect of a SUMS could differ from the timing and character of income, gain or loss recognized in respect of a SUMS had the SUMS in fact been treated as debt instruments of ML&Co. for United States federal income tax purposes.
S-24
U.S. Holders
On June 11, 1996, the Treasury Department issued final regulations (the “Final Regulations”) concerning the proper United States federal income tax treatment of contingent payment debt instruments such as the SUMS, which apply to debt instruments issued on or after August 13, 1996 and, accordingly, will apply to the SUMS. In general, the Final Regulations cause the timing and character of income, gain or loss reported on a contingent payment debt instrument to substantially differ from the timing and character of income, gain or loss reported on a contingent payment debt instrument under general principles of prior United States federal income tax law. Specifically, the Final Regulations generally require a U.S. Holder of such an instrument to include future contingent and noncontingent interest payments in income as that interest accrues based upon a projected payment schedule. Moreover, in general, under the Final Regulations, any gain recognized by a U.S. Holder on the sale, exchange or retirement of a contingent payment debt instrument is treated as ordinary income, and all or a portion of any loss realized could be treated as ordinary loss as opposed to capital loss (depending upon the circumstances). The Final Regulations provide no definitive guidance as to whether or not an instrument is properly characterized as a debt instrument for United States federal income tax purposes.
In particular, solely for purposes of applying the Final Regulations to the SUMS, ML&Co. has determined that the projected payment schedule for the SUMS will consist of payment on the maturity date of $1,000 per unit and a payment in excess of $1,000 per unit (the “Supplemental Payment Amount”) projected to equal $ per unit (the “Projected Supplemental Payment Amount”). This represents an estimated yield on the SUMS equal to % per annum, compounded semiannually. Accordingly, during the term of the SUMS, a U.S. Holder of a SUMS will be required to include in income as ordinary interest an amount equal to the sum of the daily portions of interest on the SUMS that are deemed to accrue at this estimated yield for each day during the taxable year (or portion of the taxable year) on which the U.S. Holder holds the SUMS. The amount of interest that will be deemed to accrue in any accrual period (i.e., generally each six-month period during which the SUMS are outstanding) will equal the product of this estimated yield (properly adjusted for the length of the accrual period) and the SUMS’s adjusted issue price (as defined below) at the beginning of the accrual period. The daily portions of interest will be determined by allocating to each day in the accrual period the ratable portion of the interest that is deemed to accrue during the accrual period. In general, for these purposes a SUMS’s adjusted issue price will equal the SUMS’s issue price (i.e., $1,000), increased by the interest previously accrued on the SUMS. At maturity of a SUMS, in the event that the actual Supplemental Payment Amount, if any, exceeds $ per unit (i.e., the Projected Supplemental Payment Amount), a U.S. Holder will be required to include the excess of the actual Supplemental Payment Amount over $ per unit (i.e., the Projected Supplemental Payment Amount) in income as ordinary interest on the stated maturity date.
Alternatively, in the event that the actual Supplemental Payment Amount, if any, is less than $ per unit (i.e., the Projected Supplemental Payment Amount), the amount by which the Projected Supplemental Payment Amount (i.e., $ per unit) exceeds the actual Supplemental Payment Amount will be treated first as an offset to any interest otherwise includible in income by the U.S. Holder with respect to the SUMS for the taxable year in which the stated maturity date occurs to the extent of the amount of that includible interest. Further, a U.S. Holder will be permitted to recognize and deduct, as an ordinary loss that is not subject to the limitations applicable to miscellaneous itemized deductions, any remaining portion of the Projected Supplemental Payment Amount (i.e., $ per unit) in excess of the actual Supplemental Payment Amount that is not treated as an interest offset pursuant to the foregoing rules. In addition, U.S. Holders purchasing a SUMS at a price that differs from the adjusted issue price of the SUMS as of the purchase date (e.g., subsequent purchasers) will be subject to rules providing for certain adjustments to the foregoing rules and these U.S. Holders should consult their own tax advisors concerning these rules.
Notwithstanding the foregoing, if the actual Supplemental Payment Amount becomes fixed more than 6 months before the maturity date, a U.S. Holder will have a positive or negative adjustment. Under the Final Regulations, a U.S. Holder would be required to take into account such positive or negative adjustment in a reasonable manner over the period to which it relates. In addition, under the Final Regulations, if the actual
S-25
Supplemental Payment Amount becomes fixed more than 6 months before the maturity date, the actual Supplemental Payment Amount will no longer be treated as a contingent payment after the date the actual Supplemental Payment Amount becomes fixed. Moreover, in such event, on the date the actual Supplemental Payment Amount becomes fixed, the projected payment schedule for the SUMS will be modified prospectively to reflect the fixed amount of the payment. In addition to the foregoing, for purposes of accruing original issue discount under the Final Regulations, if the actual Supplemental Payment Amount becomes fixed during an accrual period (i.e., generally each six-month period during which the SUMS are outstanding), a new accrual period will begin on the day after the day on which the actual Supplemental Payment Amount becomes fixed.
Upon the sale or exchange of a SUMS prior to the stated maturity date, a U.S. Holder will be required to recognize taxable gain or loss in an amount equal to the difference, if any, between the amount realized by the U.S. Holder upon such sale or exchange and the U.S. Holder’s adjusted tax basis in the SUMS as of the date of disposition. A U.S. Holder’s adjusted tax basis in a SUMS generally will equal such U.S. Holder’s initial investment in the SUMS increased by any interest previously included in income with respect to the SUMS by the U.S. Holder. Any taxable gain will be treated as ordinary income. Any taxable loss will be treated as ordinary loss to the extent of the U.S. Holder’s total interest inclusions on the SUMS. Any remaining loss generally will be treated as long-term or short-term capital loss (depending upon the U.S. Holder’s holding period for the SUMS). Notwithstanding the foregoing, if the actual Supplemental Payment Amount becomes fixed more than 6 months before the maturity date, any gain or loss recognized by a U.S. Holder upon the sale or exchange of a SUMS prior to the maturity date generally will be treated as capital gain or loss. Any such gain or loss would generally be long-term or short-term capital gain or loss (depending on the U.S. Holder’s holding period for the SUMS). All amounts includible in income by a U.S. Holder as ordinary interest pursuant to the Final Regulations will be treated as original issue discount.
All prospective investors in the SUMS should consult their own tax advisors concerning the application of the Final Regulations to their investment in the SUMS. Investors in the SUMS may also obtain the projected payment schedule, as determined by ML&Co. for purposes of applying the Final Regulations to the SUMS, by submitting a written request for such information to Merrill Lynch & Co., Inc., Corporate Secretary’s Office, 222 Broadway, 17th Floor, New York, New York 10038, (212) 670-0432, corporatesecretary@exchange.ml.com.
The projected payment schedule (including both the Projected Supplemental Payment Amount and the estimated yield on the SUMS) has been determined solely for United States federal income tax purposes (i.e., for purposes of applying the Final Regulations to the SUMS), and is neither a prediction nor a guarantee of what the actual Supplemental Payment Amount will be; nor is it a prediction or guarantee that any payment at maturity will even exceed $1,000 per unit.
S-26
Hypothetical Table
The following table sets forth the amount of interest that would be deemed to have accrued with respect to each unit of the SUMS during each accrual period over an assumed term of approximately three years for the SUMS based upon a hypothetical projected payment schedule for the SUMS (including both a hypothetical Projected Supplemental Payment Amount and a hypothetical estimated yield equal to 4.07% per annum (compounded semiannually)) as determined by ML&Co. for purposes of illustrating the application of the Final Regulations to the SUMS as if the SUMS had been issued on July 1, 2004 and were scheduled to mature on July 2, 2007. The following table is for illustrative purposes only. The actual projected payment schedule for the SUMS (including both the actual Projected Supplemental Payment Amount and the actual estimated yield) will be determined by ML&Co. on the Pricing Date and will depend upon actual market interest rates (and thus ML&Co.’s borrowing costs for debt instruments with comparable maturities) as of that date. The actual projected payment schedule for the SUMS (including both the actual Projected Supplemental Payment Amount and the actual estimated yield) and the actual tax accrual table will be set forth in the final prospectus supplement delivered to investors in connection with the initial sale of the SUMS.
| Accrual Period |
Interest deemed to accrue on SUMS during accrual period (per unit) |
Total interest deemed to have accrued on SUMS as of end of accrual period (per unit) | ||
| July 1, 2004 through January 1, 2005 |
$20.52 | $ 20.52 | ||
| January 2, 2005 through July 1, 2005 |
$20.77 | $ 41.29 | ||
| July 2, 2005 through January 1, 2006 |
$21.19 | $ 62.48 | ||
| January 2, 2006 through July 1, 2006 |
$21.62 | $ 84.10 | ||
| July 2, 2006 through January 1, 2007 |
$22.06 | $106.16 | ||
| January 2, 2007 through July 2, 2007 |
$22.51 | $128.67 | ||
Hypothetical Projected Supplemental Payment Amount = $128.67 per unit.
Non-U.S. Holders
A non-U.S. Holder will not be subject to United States federal income taxes on payments of principal, premium (if any) or interest (including original issue discount, if any) on a SUMS, unless such non-U.S. Holder is a direct or indirect 10% or greater shareholder of ML&Co., a controlled foreign corporation related to ML&Co. or a bank receiving interest described in section 881(c)(3)(A) of the Internal Revenue Code of 1986, as amended (the “Code”). However, income allocable to non-U.S. Holders will generally be subject to annual tax reporting on IRS Form 1042-S. For a non-U.S. Holder to qualify for the exemption from taxation, any person, U.S. or foreign, that has control, receipt or custody of an amount subject to withholding, or who can disburse or make payments of an amount subject to withholding (the “Withholding Agent”) must have received a statement that (a) is signed by the beneficial owner of the SUMS under penalties of perjury, (b) certifies that such owner is a non-U.S. Holder and (c) provides the name and address of the beneficial owner. The statement may generally be made on IRS Form W-8BEN (or other applicable form) or a substantially similar form, and the beneficial owner must inform the Withholding Agent of any change in the information on the statement within 30 days of that change by filing a new IRS Form W-8BEN (or other applicable form). Generally, a Form W-8BEN provided without a U.S. taxpayer identification number will remain in effect for a period starting on the date the form is signed and ending on the last day of the third succeeding calendar year, unless a change in circumstances makes any information on the form incorrect. If a SUMS is held through a securities clearing organization or certain other financial institutions, the organization or institution may provide a signed statement to the Withholding Agent. Under certain circumstances, the signed statement must be accompanied by a copy of the applicable IRS Form W-8BEN (or other applicable form) or the substitute form provided by the beneficial owner to the organization or institution.
S-27
Under current law, a SUMS will not be includible in the estate of a non-U.S. Holder unless the individual is a direct or indirect 10% or greater shareholder of ML&Co. or, at the time of such individual’s death, payments in respect of such SUMS would have been effectively connected with the conduct by such individual of a trade or business in the United States.
Backup withholding
Backup withholding at the applicable statutory rate of United States federal income tax may apply to payments made in respect of the SUMS to registered owners who are not “exempt recipients” and who fail to provide certain identifying information (such as the registered owner’s taxpayer identification number) in the required manner. Generally, individuals are not exempt recipients, whereas corporations and certain other entities generally are exempt recipients. Payments made in respect of the SUMS to a U.S. Holder must be reported to the IRS, unless the U.S. Holder is an exempt recipient or establishes an exemption. Compliance with the identification procedures described in the preceding section would establish an exemption from backup withholding for those non-U.S. Holders who are not exempt recipients.
In addition, upon the sale of a SUMS to (or through) a broker, the broker must withhold on the entire purchase price, unless either (a) the broker determines that the seller is a corporation or other exempt recipient or (b) the seller provides, in the required manner, certain identifying information (e.g., an IRS Form W-9) and, in the case of a non-U.S. Holder, certifies that such seller is a non-U.S. Holder (and certain other conditions are met). Such a sale must also be reported by the broker to the IRS, unless either (a) the broker determines that the seller is an exempt recipient or (b) the seller certifies its non-U.S. status (and certain other conditions are met). Certification of the registered owner’s non-U.S. status would be made normally on an IRS Form W-8BEN (or other applicable form) under penalties of perjury, although in certain cases it may be possible to submit other documentary evidence.
Any amounts withheld under the backup withholding rules from a payment to a beneficial owner would be allowed as a refund or a credit against such beneficial owner’s United States federal income tax provided the required information is furnished to the IRS.
S-28
Each fiduciary of a pension, profit-sharing or other employee benefit plan (a “plan”) subject to the Employee Retirement Income Security Act of 1974, as amended (“ERISA”), should consider the fiduciary standards of ERISA in the context of the plan’s particular circumstances before authorizing an investment in the SUMS. Accordingly, among other factors, the fiduciary should consider whether the investment would satisfy the prudence and diversification requirements of ERISA and would be consistent with the documents and instruments governing the plan, and whether the investment would involve a prohibited transaction under Section 406 of ERISA or Section 4975 of the Code.
Section 406 of ERISA and Section 4975 of the Code prohibit plans, as well as individual retirement accounts and Keogh plans subject to Section 4975 of the Code (also “plans”) from engaging in certain transactions involving “plan assets” with persons who are “parties in interest” under ERISA or “disqualified persons” under the Code (“parties in interest”) with respect to the plan or account. A violation of these prohibited transaction rules may result in civil penalties or other liabilities under ERISA and/or an excise tax under Section 4975 of the Code for those persons, unless exemptive relief is available under an applicable statutory, regulatory or administrative exemption. Certain employee benefit plans and arrangements including those that are governmental plans (as defined in section 3(32) of ERISA), certain church plans (as defined in Section 3(33) of ERISA) and foreign plans (as described in Section 4(b)(4) of ERISA) (“non-ERISA arrangements”) are not subject to the requirements of ERISA or Section 4975 of the Code but may be subject to similar provisions under applicable federal, state, local, foreign or other regulations, rules or laws (“similar laws”).
The acquisition of the SUMS by a plan with respect to which we, MLPF&S or certain of our affiliates is or becomes a party in interest may constitute or result in prohibited transactions under ERISA or Section 4975 of the Code, unless those SUMS are acquired pursuant to and in accordance with an applicable exemption. The U.S. Department of Labor has issued five prohibited transaction class exemptions, or “PTCEs”, that may provide exemptive relief if required for direct or indirect prohibited transactions that may arise from the purchase or holding of the SUMS. These exemptions are:
| (1) | PTCE 84-14, an exemption for certain transactions determined or effected by independent qualified professional asset managers; |
| (2) | PTCE 90-1, an exemption for certain transactions involving insurance company pooled separate accounts; |
| (3) | PTCE 91-38, an exemption for certain transactions involving bank collective investment funds; |
| (4) | PTCE 95-60, an exemption for transactions involving certain insurance company general accounts; and |
| (5) | PTCE 96-23, an exemption for plan asset transactions managed by in-house asset managers. |
The SUMS may not be purchased or held by (1) any plan, (2) any entity whose underlying assets include “plan assets” by reason of any plan’s investment in the entity (a “plan asset entity”) or (3) any person investing “plan assets” of any plan, unless in each case the purchaser or holder is eligible for the exemptive relief available under one or more of the PTCEs listed above or another applicable similar exemption. Any purchaser or holder of the SUMS or any interest in the SUMS will be deemed to have represented by its purchase and holding of the SUMS that it either (1) is not a plan or a plan asset entity and is not purchasing those SUMS on behalf of or with “plan assets” of any plan or plan asset entity or (2) with respect to the purchase or holding, is eligible for the exemptive relief available under any of the PTCEs listed above or another applicable exemption. In addition, any purchaser or holder of the SUMS or any interest in the SUMS which is a non-ERISA arrangement will be deemed to have represented by its purchase and holding of the SUMS that its purchase and holding will not violate the provisions of any similar law.
S-29
Due to the complexity of these rules and the penalties that may be imposed upon persons involved in non-exempt prohibited transactions, it is important that fiduciaries or other persons considering purchasing the SUMS on behalf of or with “plan assets” of any plan, plan asset entity or non-ERISA arrangement consult with their counsel regarding the availability of exemptive relief under any of the PTCEs listed above or any other applicable exemption, or the potential consequences of any purchase or holding under similar laws, as applicable.
The net proceeds from the sale of the SUMS will be used as described under “Use of Proceeds” in the accompanying prospectus and to hedge market risks of ML&Co. associated with its obligations in connection with the SUMS.
WHERE YOU CAN FIND MORE INFORMATION
We file reports, proxy statements and other information with the SEC. Our SEC filings are also available over the Internet at the SEC’s web site at http://www.sec.gov. The address of the SEC’s Internet site is provided solely for the information of prospective investors and is not intended to be an active link. You may also read and copy any document we file by visiting the SEC’s public reference room in Washington, D.C. Please call the SEC at 1-800-SEC-0330 for further information about the public reference rooms and their copy charges. You may also inspect our SEC reports and other information at the New York Stock Exchange, Inc., 20 Broad Street, New York, New York 10005.
We have filed a registration statement on Form S-3 with the SEC covering the SUMS and other securities. For further information on ML&Co. and the SUMS, you should refer to our registration statement and its exhibits. The prospectus accompanying this prospectus supplement summarizes material provisions of contracts and other documents that we refer you to. Because the prospectus may not contain all the information that you may find important, you should review the full text of these documents. We have included copies of these documents as exhibits to our registration statement.
You should rely only on the information contained or incorporated by reference in this prospectus supplement and the accompanying prospectus. We have not, and the underwriter has not, authorized any other person to provide you with different information. If anyone provides you with different or inconsistent information, you should not rely on it. We are not, and the underwriter is not, making an offer to sell these securities in any jurisdiction where the offer or sale is not permitted.
You should assume that the information appearing in this prospectus supplement and the accompanying prospectus is accurate as of the date on the front cover of this prospectus supplement only. Our business, financial condition and results of operations may have changed since that date.
S-30
MLPF&S has agreed, subject to the terms and conditions of the underwriting agreement and a terms agreement, to purchase from ML&Co. $ aggregate original public offering price of SUMS. The underwriting agreement provides that the obligations of the underwriter are subject to certain conditions and that the underwriter will be obligated to purchase all of the SUMS if any are purchased.
The underwriter has advised ML&Co. that it proposes initially to offer the SUMS directly to the public at the offering prices set forth on the cover page of this prospectus supplement and that it may offer a part of the SUMS to certain dealers at a price that represents a concession not in excess of % of the original public offering price of the SUMS. The underwriter may allow, and any such dealer may reallow, a concession not in excess of % of the original public offering price of the SUMS to certain dealers. After the initial public offering, the public offering prices and concessions may be changed. The underwriter is offering the SUMS subject to receipt and acceptance and subject to the underwriter’s right to reject any order in whole or in part. Proceeds to be received by ML&Co. will be net of the underwriting discount and expenses payable by ML&Co.
MLPF&S, a broker-dealer subsidiary of ML&Co. is a member of the National Association of Securities Dealers, Inc. and will participate in distributions of the SUMS. Accordingly, offerings of the SUMS will conform to the requirements of Rule 2720 of the Conduct Rules of the NASD.
The underwriter is permitted to engage in certain transactions that stabilize the price of the SUMS. These transactions consist of bids or purchases for the purpose of pegging, fixing or maintaining the price of the SUMS.
If the underwriter creates a short position in the SUMS in connection with the offering, i.e., if it sells more units of the SUMS than are set forth on the cover page of this prospectus supplement, the underwriter may reduce that short position by purchasing units of the SUMS in the open market. In general, purchases of a security for the purpose of stabilization or to reduce a short position could cause the price of the security to be higher than it might be in the absence of these purchases. “Naked” short sales are sales in excess of the underwriter’s overallotment option or, where no overallotment option exists, sales in excess of the number of units an underwriter has agreed to purchase from the issuer. Because MLPF&S, as underwriter for the SUMS, has no overallotment option, it would be required to close out a short position in the SUMS by purchasing SUMS in the open market. Neither ML&Co. nor the underwriter makes any representation or prediction as to the direction or magnitude of any effect that the transactions described above may have on the price of the SUMS. In addition, neither ML&Co. nor the underwriter makes any representation that the underwriter will engage in these transactions or that these transactions, once commenced, will not be discontinued without notice.
MLPF&S may use this prospectus supplement and the accompanying prospectus for offers and sales related to market-making transactions in the SUMS. MLPF&S may act as principal or agent in these transactions, and the sales will be made at prices related to prevailing market prices at the time of sale.
The validity of the SUMS will be passed upon for ML&Co. and for the underwriter by Sidley Austin Brown & Wood LLP, New York, New York.
S-31
The restated consolidated financial statements and the related restated financial statement schedule incorporated herein by reference from the Current Report on Form 8-K of Merrill Lynch & Co., Inc. and subsidiaries (“Merrill Lynch”) dated May 4, 2004 for the year ended December 26, 2003 have been audited by Deloitte & Touche LLP, an independent registered public accounting firm, as stated in their reports dated March 1, 2004 (May 4, 2004 as to Note 2) (which express unqualified opinions, and which report on the consolidated financial statements includes explanatory paragraphs for the change in accounting method in 2002 for goodwill amortization to conform to Statement of Financial Accounting Standards No. 142, Goodwill and Other Intangible Assets, and for the change in accounting method in 2004 for stock-based compensation to conform to Statement of Financial Accounting Standards No. 123, Accounting for Stock-Based Compensation, as amended by Statement of Financial Accounting Standards No. 148, Accounting for Stock-Based Compensation—Transition and Disclosure by retroactively restating its 2003, 2002 and 2001 consolidated financial statements), which are incorporated herein by reference, and have been so incorporated in reliance upon the reports of such firm given upon their authority as experts in accounting and auditing.
With respect to the unaudited condensed consolidated financial statements for the periods ended March 26, 2004 and March 28, 2003, which are incorporated herein by reference, Deloitte & Touche LLP have applied limited procedures in accordance with the standards of the Public Company Accounting Oversight Board (United States). However, as stated in their report included in Merrill Lynch’s Quarterly Report on Form 10-Q for the quarter ended March 26, 2004 and incorporated by reference herein, they did not audit and they do not express an opinion on those unaudited condensed consolidated financial statements. Accordingly, the degree of reliance on their report on such information should be restricted in light of the limited nature of the review procedures applied. Deloitte & Touche LLP are not subject to the liability provisions of Section 11 of the Securities Act of 1933 for their report on the unaudited condensed consolidated financial statements because such report is not a “report” or “part” of the registration statement prepared or certified by an accountant within the meaning of Sections 7 and 11 of the Act.
S-32
INDEX OF CERTAIN DEFINED TERMS
| Page | ||
| Business Day |
S-11 | |
| Ending Value |
S-4 | |
| Index Business Day |
S-11 | |
| Market Disruption Event |
S-15 | |
| Monthly Return |
S-3 | |
| Monthly Return Calculation Date |
S-4 | |
| Monthly Return Cap |
S-3 | |
| Pricing Date |
S-4 | |
| Profit Lock-In Amount |
S-4 | |
| Nasdaq |
S-4 | |
| Starting Value |
S-4 | |
| successor index |
S-15 | |
| Summation Amount |
S-3 | |
| SUMS |
S-1 | |
| Supplemental Redemption Amount |
S-3 |
S-33

$
Merrill Lynch & Co., Inc.
Profit Lock-In SUMmation SecuritiesSM
Linked to the Performance of the Nasdaq-100 Index
due July 31, 2007
“SUMSSM”
$1,000 principal amount per unit
| PROSPECTUS SUPPLEMENT
|
Merrill Lynch & Co.
July , 2004
“SUMS” is a service mark of Merrill Lynch & Co., Inc.