Bank
of America
First Quarter 2006 Results
Al de Molina
Chief Financial Officer
April 20, 2006
Exhibit 99.3
| Bank
of America First Quarter 2006 Results Al de Molina Chief Financial Officer April 20, 2006 Exhibit 99.3 |
 2 Forward Looking Statements This presentation contains forward-looking statements, including statements about the
financial conditions, results of operations and earnings outlook of Bank of
America Corporation. The forward- looking statements involve certain risks and uncertainties. Factors that may cause actual results or earnings to differ materially from such forward-looking statements include, among
others, the following: 1) projected business increases following process
changes and other investments are lower than expected; 2) competitive
pressure among financial services companies increases significantly;
3) general economic conditions are less favorable than expected; 4) political conditions including the threat of future terrorist activity and related actions by the United States abroad may adversely affect the company’s businesses and economic conditions as a
whole; 5) changes in the interest rate environment reduce interest margins and impact funding sources; 6) changes in foreign exchange rates increases exposure; 7) changes in market rates and prices may adversely impact the value of financial products; 8) legislation or regulatory environments, requirements or changes adversely affect the businesses in which the company is engaged; 9) changes in accounting standards, rules or interpretations, 10) litigation liabilities, including costs, expenses, settlements and judgments, may adversely affect the company or its businesses; 11) mergers and acquisitions and their integration into the company; and 12) decisions to downsize, sell or close units or otherwise change the business mix of any of the company. For further information regarding Bank of America Corporation, please read the Bank of America
reports filed with the SEC and available at www.sec.gov.
|
 3 Summary Earnings Statement Proforma 1 % Change 1 Proforma 1Q05 includes MBNA refer to 8-K filing 4/10/06 $ in millions GAAP 1Q06 1Q05 1Q05 Core net interest income (FTE) $ 8,630 $ 7,995 8 % $ 7,160 Market-based net interest income 410 546 546 Net interest income (FTE) 9,040 8,541 6 % 7,706 Noninterest income 8,901 7,775 15 % 6,032 Total revenue (FTE) 17,941 16,316 10 % 13,738 Provision for credit losses 1,270 882 44 % 580 Gains on sales of debt securities 14 659 NM 659 Noninterest expense (excl merger charges) 8,826 8,399 5 % 6,945 Merger charge 98 880 112 Noninterest expense 8,924 9,279 7,057 Net income before merger charges 5,047 4,994 1 % 4,468 Merger & restructuring charges (after-tax) 61 557 75 Net Income $ 4,986 $ 4,437 12 % $ 4,393 Diluted EPS reported $ 1.07 $ 1.07 Merger charge impact .01 .02 Diluted EPS (excl. merger charge) $ 1.08 $ 1.09 |
 4 Earnings Highlights – 1 st Qtr 2006 • Record earnings of $5 billion grew 14% over GAAP reported earnings in 1Q05 while EPS was steady due to MBNA dilution. On a proforma 1 basis and excluding merger charges net income grew 1%. • Versus 1Q05 proforma, growth includes headwinds of $388 million higher credit provision expense as well as $645 million lower securities gains (approximately $.14 impact) • 1Q06 highlighted by record market sensitive revenue with steady consumer growth and continuing commercial momentum. • Total revenue, on a proforma basis, grew 10% over 1Q05. – Market sensitive revenue grew 55% – Other revenue grew 5% • Expenses, excluding merger charges, grew 5% from last year resulting in a 5% operating leverage (revenue growth less expense growth). • 1Q06 expense includes $320 million charge for FAS123R acceleration of equity based compensation expense for Rule of 60 eligible participants • MBNA integration well underway and on track. 1 Proforma 1Q05 includes MBNA refer to 8-K filing 4/10/06 |
  5 Proforma 1 vs. 1Q05 vs. 4Q05 1Q06 1Q05 % chg 1Q05 4Q05 % chg % chg Net interest income $ 5,400 $ 5,029 7 % $ 4,215 $ 4,325 28 % 25 % Noninterest income 4,801 4,380 10 % 2,638 2,955 82 % 62 % Total revenue 10,201 9,409 8 % 6,853 7,280 49 % 40 % Securities gains (losses) (1) (1) (1) (1) - - Provision expense 1,257 1,012 24 % 710 1,299 77 % ( 3 %) Noninterest expense 4,693 4,665 - 3,238 3,325 45 % 41 % Pre-tax income 4,250 3,731 2,904 2,655 Income tax expense 1,575 1,323 1,026 945 Net income $ 2,675 $ 2,408 11 % $ 1,878 $ 1,710 42 % 56 % Efficiency Ratio 46 % 50 % 47 % 46 % ROE 17 % 17 % 26 % 22 % Global Consumer & Small Business Banking (GCSB) ($ in millions) GAAP Basis 1 Proforma 1Q05 includes MBNA refer to 8-K filing 4/10/06 |
  6 Proforma 1 vs. 1Q05 vs. 4Q05 1Q06 1Q05 % chg 1Q05 4Q05 % chg % chg Total revenue (FTE) $ 3,984 3,467 15 % $ 3,426 4,034 16 % ( 1 %) Provision expense 28 (7) (7) 48 Noninterest expense 2,206 1,931 14 % 1,931 2,070 14 % 7 % Pre-tax income 1,750 1,543 1,502 1,916 Income tax expense 649 547 530 682 Net income $ 1,102 $ 996 11 % $
972 $ 1,234 13 % (11 %) Debit purchase volume $ 38.6 bb $ 31.2 bb 24 %
Net new accounts Checking 603 k 611 k Savings 483 k 771 k Deposits (GCSB) ($ in millions) GAAP Basis 1 Proforma 1Q05 includes MBNA refer to 8-K filing 4/10/06 • #1 US deposit market share in US with largest branch and ATM network • #1 online banking presence with more than 19 million customers • #1 online bill pay with 10 million customers paying $44 billion in bills in the quarter. • Same store product sales up 11% over 1Q05 |
 7 Deposits Business Metrics (GCSB) - Proforma 5 Quarter trend of deposit indicators: 1Q06 4Q05 1 3Q05 1 2Q05 1 1Q05 1 Average balances (in billions) Checking $ 126.3 $ 125.8 $ 124.8 $ 123.4 $ 120.1 Savings 32.1 31.9 32.1 32.5 31.6 MMS 76.9 78.4 75.1 74.0 76.3 CDs & IRAs 84.8 85.5 93.8 92.8 90.1 Foreign & Other 10.0 11.1 11.9 10.8 9.6 Total GCSB deposits 330.2 332.7 337.8 333.5 327.6 Cumulative balances transferred ²
45.4 44.7 41.7 38.3 32.4 Deposit Spreads Checking 4.18 % 4.16 % 4.17 % 4.14 % 4.24 % Savings 3.36 3.52 3.78 4.01 4.37 MMS 2.53 2.50 1.89 1.54 1.34 CDs & IRAs 1.21 1.01 .80 .73 .63 Foreign & Other 3.68 3.58 3.02 2.93 2.80 Total GCSB deposits 2.93 2.86 2.63 2.54 2.52 1 Proforma 1Q05 includes MBNA refer to 8-K filing 4/10/06. 2 Premier customer balances transferred to GWIM segment |
 8 Deposits Business Metrics (GCSB) - GAAP 5 Quarter trend of deposit indicators: 1Q06 4Q05 3Q05 2Q05 1Q05 Average balances (in billions) Checking $ 126.3 $ 125.5 $ 124.4 $ 123.0 $ 119.8 Savings 32.1 31.9 32.0 32.5 31.5 MMS 76.9 71.9 68.8 67.7 69.7 CDs & IRAs 84.8 69.4 76.8 75.7 73.1 Foreign & Other 10.0 7.9 8.5 7.6 6.4 Total GCSB deposits 330.2 306.6 310.5 306.5 300.6 Cumulative balances transferred ²
45.4 44.7 41.7 38.3 32.4 Deposit Spreads Checking 4.18 % 4.16 % 4.17 % 4.14 % 4.24 % Savings 3.36 3.53 3.78 4.02 4.38 MMS 2.53 2.69 2.02 1.64 1.43 CDs & IRAs 1.21 1.19 .90 .80 .66 Foreign & Other 3.68 4.19 3.88 3.67 3.52 Total GCSB deposits 2.93 3.06 2.82 2.72 2.70 2 Premier customer balances transferred to GWIM segment |
  9 Proforma 1 vs. 1Q05 vs. 4Q05 1Q06 1Q05 % chg 1Q05 4Q05 % chg % chg Total revenue (FTE) $ 5,933 $ 5,594 6 % $ 2,140 2,276 177 % 161 % Provision expense 1,820 2,150 (15 %) 843 1,254 116 % 45 % Noninterest expense 2,016 2,184 ( 8 %) 758 730 166 % 176 % Pre-tax income 2,097 1,260 539 293 Income tax expense 777 446 190 104
Net income $ 1,320 $ 814 62 %
$ 349 $ 188 279 % 600 % Proforma 1 4Q05 North American Card $143.5 bb $ 138.4 bb 4 % $ 144.8 bb Managed losses 1,103 1,821 2,733 Losses % of receivables 3.12 %
5.35 % 7.48 % 30 day delinquency 4.45 % 4.61 % 3.98 % Risk Adj. Margin 10.26 % 8.28 % 5.63 % Purchase volume $ 49.6 bb $ 45.8 bb 8% $ 57.1 bb Card Services (GCSB) – Managed View ($ in millions) GAAP Basis 1 Proforma 1Q05 includes MBNA refer to 8-K filing 4/10/06 • #1 consumer credit card issuer in the United States and strong growing positions in
certain international markets with $23 billion of international managed
receivables. * Card Services financials includes North America credit card lending, International credit card lending, and unsecured consumer finance lending.
|
  10 Proforma 1 vs. 1Q05 vs. 4Q05 1Q06 1Q05 % chg 1Q05 4Q05 % chg % chg Total revenue (FTE) $ 5,278 $ 4,444 19 % $ 1,995 2,213 165 % 139 % Provision expense 1,166 1,000 17 % 698 1,191 67 % (2 %) Noninterest expense 2,016 2,184 ( 8 %) 758 730 166 % 176 % Pre-tax income 2,097 1,260 539 293 Income tax expense 777 446 190 104 Net income $ 1,320 $ 814 62 % $
349 $ 188 279 % 601 % Proforma 1 4Q05 North American Card $ 69.2 bb $ 63.1 bb 10 % $ 71.2 bb Net charge-offs 635 881 1,529 Losses % of receivables 3.73 %
5.67 % 8.51 % Card Services (GCSB) – Held View ($ in millions) GAAP Basis 1 Proforma 1Q05 includes MBNA refer to 8-K filing 4/10/06 • #1 consumer credit card issuer in the United States and strong growing positions in
certain international markets with $23 billion of international managed
receivables. * Card Services financials includes North America credit card lending, International credit card lending, and unsecured consumer finance lending.
|
  11 Home Equity (GCSB) ($ in millions) GAAP Basis 1 Proforma 1Q05 includes MBNA refer to 8-K filing 4/10/06 • #1 home equity lender in the United States with an 8.4% market share at end of 2005.
• $73.9 billion in home equity balances across all Bank of America segments at
3/31/06. 2 Includes originations across all business segments Proforma 1 vs. 1Q05 vs. 4Q05 1Q06 1Q05 % chg 1Q05 4Q05 % chg % chg Total revenue (FTE) $ 351 $ 323 9 % $ 323 350 9 % 0 % Provision expense 12 8 48 % 8 10 48 % 22 % Noninterest expense 154 182 (16 %) 182 146 (16 %) 5 % Pre-tax income 185 133 133 194 Income tax expense 69 47 47
69 Net income $ 117 $ 86 36 % $
86 $ 125 36 % (7 %) Home equity orig. 2 $ 18.6 bb $ 15.1 bb 23 % $ 15.1 bb $ 19.6 bb GCSB HE avg, bal. 53.0 bb 45.2 bb
44.7 bb 50.4 bb Total HE avg bal. 2 72.4 bb 59.3 bb 22 % 58.7 bb 68.5 bb Application units 2 302.6 k 262.6 k 15 % 272.7 k |
  12 Mortgage (GCSB) ($ in millions) GAAP Basis 1 Proforma 1Q05 includes MBNA refer to 8-K filing 4/10/06 • Ranks #6 in mortgage servicing and #5 in mortgage production at 12/31/05 with 1,700 retail account executives in nearly 160 locations. 2 Includes originations across all business segments Proforma 1 vs. 1Q05 vs. 4Q05 1Q06 1Q05 % chg 1Q05 4Q05 % chg % chg Total revenue (FTE) $ 347 $ 458 (24 %) $ 452 430 (23 %) (19 %) Provision expense 4 5 (24 %) 6 6 (24 %) (25 %) Noninterest expense 229 276 (17 %) 276 276 (17 %) (17 %) Pre-tax income 114 177 170 149 Income tax expense 42 63 60 53 Net income $ 72 $ 114 (37 %) $ 110
$ 96 (34 %) (25 %) Mortgage originations 2 $ 17.3 bb $17.5 bb (1 %) $ 17.5 bb $ 20.6 bb MSR s ending bal. 2,925 2,547 2,547 2,658 % of loans serviced 1.32 % 1.28 % 1.28 % 1.22
% |
 13 Consumer Credit Quality – Total BAC Excl. BK reform impact $ in millions Proforma 1 1 Proforma 1Q05 includes MBNA refer to 8-K filing 4/10/06 GAAP Upon acquisition of MBNA, in accordance with SOP 03-3, certain acquired loans that
were considered impaired at the acquisition date were written down to fair value. Therefore, reported net charge-offs and managed losses for the held and managed portfolios for the first quarter of 2006 are lower since these impaired loans that would have produced
charge-offs in the first quarter were reduced to fair value at the
acquisition date. SOP 03-3 did not impact the securitized loan
portfolio. If SOP 03-3 was not applied, the Corporation’s managed net charge-offs would have increased $71 million for credit card – domestic, $38 million for credit card – foreign, $60 million for direct/indirect consumer, $28 million for other consumer, for
a total increase of $197 million in managed net charge-offs for total
consumer. 1Q06 1Q05 1Q05 4Q05 4Q05 Consumer Consumer charge-offs $ 1,006 $ 1,338 $ 1,018 $ 1,749 Consumer recoveries 213 181 151 172 Net consumer charge-offs 793 1,158 867 1,577 $ 1,069 Net consumer c/o ratio .82% 1.30% 1.07% 1.79% 1.21% Allowance for loans & lease $ 5,468 $ 5,371 $ 4,279 $ 4,515 Managed North America Consumer Card Information: Net losses $ 1,103 $ 1,821 $ 884 $ 1,429 $ 905 Net losses % 3.12% 5.31% 6.17% 9.49% 6.01% 30-day delinquency 4.45% 4.61% 4.20% 4.17% |
  14 Proforma 1 vs. 1Q05 vs. 4Q05 1Q06 1Q05 % chg 1Q05 4Q05 % chg % chg Net interest income $ 2,714 $ 2,877 (6 %) $ 2,856 $ 2,771 ( 5 %) (2 %) Noninterest income 2,846 2,613 9 % 2,591 2,187 10 % 30 % Total revenue 5,560 5,490 1 % 5,447 4,958 2 % 12 % Securities gains (losses) 23 30 30 95 Provision expense 39 (151) (151) 97 Noninterest expense 3,026 2,713 12 % 2,705 2,956 12 % 2 % Pre-tax income 2,518 2,958 2,923 2,000 Income tax expense 932 1,085 1,072 711 Net income $ 1,586 $ 1,873 (15 %) $ 1,851 $ 1,289 (14 %) 23 % Efficiency Ratio 54 % 49 % 50 % 60 % ROE 15 % 18 % 18 % 12 % Global Corporate & Investment Banking (GCIB) ($ in millions) GAAP Basis 1 Proforma 1Q05 includes MBNA refer to 8-K filing 4/10/06 |
  15 Proforma 1 vs. 1Q05 vs. 4Q05 1Q06 1Q05 % chg 1Q05 4Q05 % chg % chg Total revenue (FTE) $1,338 $ 1,637 (18 %) $ 1,628 $1,397 (18 %) (4 %) Securities gains (losses) 9
21 21 - Provision expense 16 (26) NM (26) 228 NM NM Noninterest expense 513 496 3 % 498 526 3 % (3 %) Pre-tax income 818 1,188 1,177 643 Income tax expense 302 413 408 230 Net income $ 516 $ 775 (33 %) $ 769
$ 413 (33 %) 25 % Risk mitigation rev. $ (83) $ 138 $ 138 $ (36) Avg. loans 211 bb 183 bb 15% 183 bb 204 bb 15% 3 % Business Lending (GCIB) ($ in millions) GAAP Basis 1 Proforma 1Q05 includes MBNA refer to 8-K filing 4/10/06 • #1 middle market lender with clients representing more than 20% of middle market companies within our franchise. • Industry leading positions across Commercial Real Estate lending, Dealer Financial
Services, Business Capital and Business Banking and Leasing. •Client roster includes 97% of the US Fortune 500 and 79% of global Fortune 500 |
  16 Proforma 1 vs. 1Q05 vs. 4Q05 1Q06 1Q05 % chg 1Q05 4Q05 % chg % chg Total revenue (FTE) $ 2,216 $ 1,864 19 % $ 1,864 $ 1,554 19 % 42 % Securities gains (losses) 5
8 8 32 Provision expense 3 (2) (2) (14) Noninterest expense 1,394 1,172 19 % 1,171 1,310 19 % 6 % Pre-tax income 824 702 703 290 Income tax expense 305 247 247 101 Net income $ 519 $ 455 14 % $
456 $ 189 14 % 175 % Investment Banking $ 522 $ 375 39 % $ 374 $ 547 40 % (5 %) Sales & Trading ² Fixed Income 1,223 1,027 19 % 1,028 777 19 % 57 % Equity 476 470 1 % 470 262 1 % 82 % Avg. Trading assets 314 bb 275 bb 14 % 275 bb 313 bb 14 % - Total volatility (1 Std dev) 8.8 15.8 15.8 12.2 Capital Markets and Advisory Services (GCIB) ($ in millions) GAAP Basis 1 Proforma 1Q05 includes MBNA refer to 8-K filing 4/10/06 2 Includes securities gains |
  17 Proforma 1 vs. 1Q05 vs. 4Q05 1Q06 1Q05 % chg 1Q05 4Q05 % chg % chg Total revenue (FTE) $ 1,628 $ 1,417 15 % $ 1,411 $ 1,605 15 % 1 % Provision expense 6 (6) (5) (5) 1 Noninterest expense 806 778 4 % 783 780 3 % 3 % Pre-tax income 816 645 633 824 Income tax expense 302 232 228 296 Net income $ 514 $ 413 24 % $
405 $ 528 27 % (3 %) Average deposits $ 144.2 bb $150.5 bb (4 %) $150.5 bb $ 149.2 bb (4 %) (3 %) Deposit spread 2.77 % 2.10 % 2.10 % 2.64 % Treasury Services (GCIB) ($ in millions) GAAP Basis 1 Proforma 1Q05 includes MBNA refer to 8-K filing 4/10/06 • Voted #1 Principal Cash Management bank for international operations for both large corporate and middle market company categories (Treasury & Risk Management magazine, 2005) • Cited by the highest percentage of large U.S. corporations as the most important treasury
management relationship among providers of U.S. services. (independent
research company, 2005) • Voted “Best Bank for Payments and Collections in North America” and “Best Liquidity/Working Capital Management Bank in North America”. (Global Finance Magazine, 2005)
|
 18 1Q05 2Q05 3Q05 4Q05 1Q06 Commercial Commercial charge-offs $ 169 $ 207 $ 391 $ 255 $ 111 Commercial recoveries 121 189 133 163 81 Net commercial charge-offs 48 18 258 1 92 29 Nonperforming assets 1,558 1,167 859 779 833 Net commercial c/o ratio .10% .04% .50% 1 .17% .05% Allowance for loans & leases $ 4,120 $
3,874 $ 3,608 $ 3,613 $ 3,599 Commercial Credit Quality – Total BAC 1 3Q05 charge-offs included $209 million domestic airline industry exposure. Net
charge-off ratio excluding domestic airline industry charge-offs was
..06% $ in millions 2 Periods presented prior to 1Q06 are on a proforma basis |
  19 vs. 1Q05 vs. 4Q05 1Q06 1Q05 % chg 1Q05 4Q05 % chg % chg Net interest income $ 981 $ 979 - % $ 955
$ 1,001 3 % (2 %) Noninterest income 987 858 15 % 858 890 15 % 11 % Total revenue 1,968 1,837 7 % 1,813 1,891 9 % 4 % Securities gains (losses) - - Provision expense (1) 2 NM 2 1 NM NM Noninterest expense 992 909 9 % 909 946 9 % 5 % Pre-tax income 977 926 902 944 Income tax expense 363 327 318 337 Net income $ 614 $ 599 3 % $ 584 $ 607 5 % 1 % Efficiency Ratio 50 % 49 % 50 % 50 % ROE 23 % 22 % 24 % 22 % Global Wealth & Investment Management (GWIM) ($ in millions) GAAP Basis 1 Proforma 1Q05 includes MBNA refer to 8-K filing 4/10/06 Proforma 1 |
  20 vs. 1Q05 vs. 4Q05 1Q06 1Q05 % chg 1Q05 4Q05 % chg % chg Total revenue (FTE) $ 539 513 5 % $ 513 $ 525 5 % 3 % Provision expense (4) (2) (2) (3) Noninterest expense 314 305 3 % 305 313 3 % - Pre-tax income 230 210 210 215 Income tax expense 85 75 75 77 Net income $ 145 $ 135 7 % $ 135 $ 138 7 % 4 % Inv. & brokerage fees $ 252 $ 256 $ 256 $ 252 Average Loans 30.5 bb 29.7 bb 3 % 29.7 bb 30.4 bb 3 % - Average Deposits 18.5 bb 26.9 bb (31%) 26.9 bb 18.5 bb (31 %) - AUM 166.0 bb 164.6 bb - 164.6 bb 164.0 bb
- 1.2 % Private Bank (GWIM) ($ in millions) GAAP Basis 1 Proforma 1Q05 includes MBNA refer to 8-K filing 4/10/06 Proforma 1 |
  21 vs. 1Q05 vs. 4Q05 1Q06 1Q05 % chg 1Q05 4Q05 % chg % chg Total revenue (FTE) $ 363 332 9 % $ 332 345 9 % 5 % Noninterest expense 236 221 7 % 222 233 6 % 1 % Pre-tax income 127 111 110 112 Income tax expense 47 39 39 40 Net income $ 80 $ 72 11 % $ 71
$ 72 13 % 11 % Inv. & brokerage fees $ 364 $ 315 16 % $ 315 $ 335 16 % 8 % AUM 385.9 bb 316.1 bb 22 % 316.1 bb 361.2 bb 22 % 7 % % of AUM In 4 & 5 Star Funds (4) 56 % 52 % 52 % 56 % In 1 st & 2 nd quartiles (5) 82 % 72 % 72 % 78 % Columbia Management (GWIM) ($ in millions) GAAP Basis 1 Proforma 1Q05 includes MBNA refer to 8-K filing 4/10/06 Proforma 1 |
  22 vs. 1Q05 vs. 4Q05 1Q06 1Q05 % chg 1Q05 4Q05 % chg % chg Total revenue (FTE) $ 716 $ 575 25 % $ 575 $ 706 25 % 1% Provision expense 3 4 4 4 Noninterest expense 349 314 11 % 314 308 11 % 13 % Pre-tax income 364 257 257 394 Income tax expense 136 87 87 140 Net income $ 228 $ 170 34 % $
170 $ 254 38% (10 %) Asset mgmt fees $ 41 $ 26 $ 26 $ 38 Brokerage fees 139 138 138 130 Average loans 28.2 bb 21.2 bb 33 % 21.2 bb 26.7 bb 33 % 6 % Average deposits 47.9 bb 54.1 bb (11 %) 54.1 bb 49.3 bb (11 %) (3 %) AUM 15.3 bb 9.7 bb 57 % 9.7 bb 13.7 bb 57
% 12 % # of client advisors 4,046 3,978 3,978 3,999 Premier Banking & Investments (GWIM) ($ in millions) GAAP Basis 1 Proforma 1Q05 includes MBNA refer to 8-K filing 4/10/06 Proforma 1 |
 23 All Other • The corporation’s total equity investment gains were $660 million versus $481
million in 4Q05 and $399 million in 1Q05. $513 million in 1Q06, $453 million in
4Q05 and $264 million in 1Q05 of these gains are reported in this
segment. • Debt securities gains recorded were $14 million, a decrease from $71 million in 4Q05 and a decline from $659 million in 1Q05 |
 24 1Q06 4Q05 1Q05 Tier 1 Capital $ 83,201 $ 74,375 $
67,593 Risk Weighted Assets 948,190 901,469 817,862 Tier 1 Capital Ratio 8.45% 8.25% 8.26% Total Capital Ratio 11.33% 11.08% 11.52% Tier 1 Leverage Ratio 6.18% 5.91% 5.86% Tangible Equity $ 52,473 $ 52,984 $
49,869 Tangible Equity Ratio 4.04% 4.26% 4.29% Net liquid assets – bank level $ 282,100 $ 265,500 $ 272,700 Months to required funding- Parent Co. 25 29 26 Dividends paid $ 2,333 $
2,012 $ 1,835 Payout ratio 47% 56% 42% Dividend yield 4.39% 4.33% 4.08% Capital Strength $ in millions |
 25 Linked Quarter Net Interest Income & Yield 1Q06 4Q05 Change % Change Reported net interest income
(FTE) $ 9,040 $ 8,102 $ 938 12 % Market based related NII 410 419
(9) Core net interest Income (FTE) 8,630 7,683 947 12 % Avg. earning assets $ 1,219,611 $ 1,145,550 $
74,061 6 % Market based earning assets 336,496 329,237 7,259 2 % Reported net interest yield 2.98 % 2.82 % 16 bp Core net interest yield 3.93 % 3.75 % 18 bp Net Interest Income $ in millions • Addition of MBNA (including purchase accounting adjustments) added approximately
$800 mm and 16 bps to net interest income and net interest margin in 1Q06 • The positive impact of higher loan levels and asset liability management actions more
than offset the headwinds of compression and fewer days in the current
quarter. |
 26 Business Segment ALM Allocations 1Q06 1Q05 1 Global Consumer & Small Business $ 315 $ 616 Global Corporate & Investment Bank 51 269 Global Wealth & Investment Management 44 230 1 Proforma 1Q05 includes MBNA refer to 8-K filing 4/10/06 |
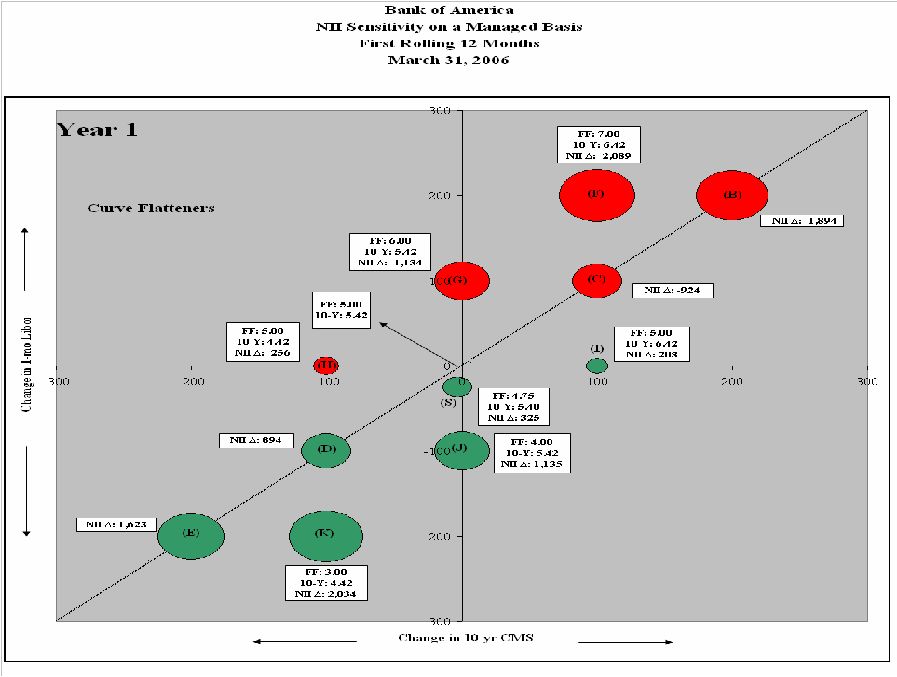 |
 28 Net Interest Income Sensitivity - Managed Net interest income impact for next 12 months Forward curve interest rate scenarios @3/31/06 @12/31/05 + 100 bp parallel shift ($ 924) ($ 357) - 100 bp parallel shift 894 244 Flattening scenario from forward curve + 100 bp flattening on short end ( 1,134) ( 523) Steepening scenario from forward curve + 100 bp steepening on long end 203 168 |
 29 • MBNA integration on target Relationships with financial institution partners remain strong Cost savings on target with over $150 million in 1Q driven by personnel related and
marketing One third of planned 6,000 position reductions achieved as of
3/31, primarily through attrition since merger announcement date. Recently
announced site conversion in 4Q. Integration projects on track with consumer
card platform conversion in 4Q • 1Q06 key events Initiated rollout of affinity cards in banking centers o Piloting 700 banking centers o Early results for applications and booked accounts 2X expectations Launched affinity cards through bankofamerica.com o Currently 315 products available o Applications and booked accounts on target Renewed relationships with several key affinity partners Began associate engagement and cultural integration MBNA facility branding well underway Completed management structure for Card Services business Maintained business as usual MBNA Integration Update |
 30 Footnote Disclosures Footnotes for Page 21 (4) Please consider the objectives, risks, charges and expenses of any Columbia fund
carefully before investing. Contact your financial advisor for a prospectus, which contains this and other important information about the fund. You should read it
carefully before investing. ©2006 by Morningstar, Inc. All rights
reserved. The information contained herein is the proprietary information of Morningstar, Inc., may not be copied or redistributed for any purpose and may only be used for noncommercial, personal purposes. The information contained herein is not represented or warranted to be accurate, correct, complete or timely. Morningstar, Inc. shall not be responsible for investment decisions, damages or other losses resulting from the use of this information. Past performance is no guarantee of future performance. Morningstar, Inc.
has not granted consent for it to be considered or deemed an “expert” under the Securities Act of 1933. (5) Results shown are defined by Columbia Management’s calculation of its percentage of
assets under management in the top two quartiles of categories based on Morningstar (Equity categories, Lipper ( Fixed Income categories) (iMoneyNet Money Market funds). The category percentile rank was calculated by ranking the three year gross return of share classes within the categories stated above . The assets of the number of funds within the top 2 quartile results include both were added and then divided by Columbia Managements total assets under management. Had fees
been included, rankings would have been lower. Past performance is no
guarantee of future results. |
 31 * * * * * * * * * * |