
Subject to Completion
Preliminary Term Sheet dated March 9, 2007
| TERM SHEET | Filed Pursuant to Rule 433 Registration No. 333-132911 | |
| (To product supplement BFN-2, dated March 9, 2007, MTN prospectus supplement, general prospectus supplement and prospectus, each dated March 31, 2006) Term Sheet Number: |
Units
Merrill Lynch & Co., Inc.
Medium-Term Notes, Series C
Buffered Return Notes
Linked to the Equally Weighted Index Basket
due October , 2010
(the “Notes”)
$1,000 original public offering price per unit
| Summary: | The Notes are designed for investors who believe that the Equally Weighted Index Basket (the “Basket”), comprised of the S&P 500 Index price-weighted, the Dow Jones EURO STOXX 50 Index price-weighted and the Nikkei 225 Index price-weighted (each a “Basket Component Index”, and together the “Basket Component Indices”) will appreciate from the starting value of the Basket on the pricing date to the ending value of the Basket on the valuation date, shortly before the maturity date. | |
| Maturity Date: | Expected to be October , 2010. Depending on the date the Notes are priced for initial sale to the public (the “Pricing Date”), which may be in March or April, the settlement date may occur in March or April and the maturity date may occur in September or October. Any reference in this term sheet to the month in which the settlement date or maturity date will occur is subject to change as specified above. | |
| Settlement Date: | Expected to be April , 2007. | |
| Payment on the Maturity Date: |
On the maturity date, you will receive a payment per unit equal to: (i) If the Ending Value is greater than or equal to the Starting Value: | |
| $1,000 + | [ | $1,000 × | ( | Ending Value - Starting Value | ) | × Participation Rate | ] | ; | ||||||||
| Starting Value |
| (ii) If the Ending Value is less than the Starting Value but is greater than or equal to the Threshold Value, the $1,000 original public offering price per unit; or (iii) If the Ending Value is less than the Threshold Value: |
| [ | $1,000 × | ( | Ending Value | × 100% | ) | ] | + $200 | |||||||
| Starting Value |
| as described in this term sheet and accompanying product supplement. If the value of the Basket has decreased below the Threshold Value, you may receive less, and possibly significantly less, than the $1,000 initial public offering price per unit. The Redemption Amount cannot be lower than $200 per unit. | ||
| Starting Value: | The Starting Value will be set to 100 on the Pricing Date. | |
| Ending Value: | The closing value of the Basket on the Valuation Date, provided if there is a disruption in the stocks included in any Basket Component Index or certain futures and options contracts relating to a Basket Component Index on the Valuation Date, the Ending Value will be the closing value of the Basket on the next scheduled Basket Business Day, as more fully described in the product supplement no. BFN-2. | |
| Valuation Date: | The Valuation Date will be the fifth scheduled Basket Business Day prior to the maturity date. The actual Valuation Date will be set forth in the term sheet made available in connection with sale of the Notes. | |
| Participation Rate: | The Participation Rate will be between 115% and 125%. The actual Participation Rate will be set forth in the term sheet made available in connection with sale of the Notes. | |
| Threshold Value: | The Threshold Value is 80% of the Starting Value. | |
| Initial Public Offering Price Per Unit: |
$1,000 | |
| Denominations: | The Notes will be issued in denominations of $20,000 and integral multiples of $1,000 in excess thereof. | |
| Listing: | The Notes will not be listed on any securities exchange. | |
| CUSIP: | 59018YA76 | |
Investing in the Notes involves a number of risks. See “Risk Factors” beginning on page PS-6 of the accompanying product supplement no. BFN-2, pages S-3 to S-4 of the MTN prospectus supplement and “ Risk Factors” beginning on page TS-6 of this term sheet.
Neither the Securities and Exchange Commission nor any state securities commission has approved or disapproved of these securities or determined if this term sheet or the accompanying product supplement, MTN prospectus supplement, general prospectus supplement and prospectus is truthful or complete. Any representation to the contrary is a criminal offense.
Merrill Lynch & Co.
The date of this term sheet is April , 2007.
“Standard and Poor’s®”, “Standard and Poor’s 500”, “S&P 500®” and S&P® are trademarks of The McGraw Hill Companies, Inc. and have been licensed for use by Merrill Lynch, Pierce, Fenner & Smith Incorporated and Merrill Lynch and Co., Inc. is an authorized sublicense.
“Dow JonesSM”, “Dow Jones Industrial AverageSM” and “DJIASM” are service marks of Dow Jones & Company, Inc. and have been licensed for use for certain purposes by Merrill Lynch, Pierce, Fenner & Smith Incorporated. Merrill Lynch & Co., Inc. is a sublicensee. The Notes are not sponsored, sold or promoted by Dow Jones. The “Dow Jones EURO STOXX 50SM” is proprietary and copyrighted material. The Dow Jones EURO STOXX 50SM and the related trademarks have been licensed for certain purposes by Merrill Lynch & Co., Inc and its subsidiaries. Neither STOXX Limited nor Dow Jones & Company, Inc. sponsors, endorses or promotes the Notes based on the Dow Jones EURO STOXX 50SM.
“Nikkei 225” is a registered trademark of Nikkei, Inc., and is licensed for use by Merrill Lynch & Co., Inc.
Additional Terms Specific to the Notes
You should read this term sheet, together with the documents listed below, which together contain the terms of the Notes and supersede all prior or contemporaneous oral statements as well as any other written materials. You should carefully consider, among other things, the matters set forth in “Risk Factors” beginning on page PS-6 of the accompanying product supplement no. BFN-2 and pages S-3 to S-4 in the accompanying MTN prospectus supplement, as the Notes involve risks not associated with conventional debt securities. We urge you to consult your investment, legal, tax, accounting and other advisers before you invest in the Notes.
You may access these documents on the SEC Web site at www.sec.gov as follows (or if such address has changed, by reviewing our filings for the relevant date on the SEC Web site):
| • | Product supplement no. BFN-2 dated March 9, 2007: |
http://www.sec.gov/Archives/edgar/data/65100/000119312507050958/d424b2.htm
| • | MTN prospectus supplement, dated March 31, 2006: |
http://www.sec.gov/Archives/edgar/data/65100/000119312506070946/d424b5.htm
| • | General prospectus supplement dated March 31, 2006: |
http://www.sec.gov/Archives/edgar/data/65100/000119312506070973/d424b5.htm
| • | Prospectus dated March 31, 2006: |
http://www.sec.gov/Archives/edgar/data/65100/000119312506070817/ds3asr.htm
Our Central Index Key, or CIK, on the SEC Web site is 65100. References in this term sheet to “ML&Co.”, “we”, “us” and “our” are to Merrill Lynch & Co., Inc., and references to “MLPF&S” are to Merrill Lynch, Pierce, Fenner & Smith Incorporated.
ML&Co. has filed a registration statement (including a prospectus) with the Securities and Exchange Commission (the “SEC”) for the offering to which this term sheet relates. Before you invest, you should read the prospectus in that registration statement, and the other documents relating to this offering that ML&Co. has filed with the SEC for more complete information about ML&Co. and this offering. You may get these documents without cost by visiting EDGAR on the SEC Web site at www.sec.gov. Alternatively, ML&Co., any agent or any dealer participating in this offering, will arrange to send you the prospectus, each prospectus supplement, product supplement no. BFN-2 and this term sheet if you so request by calling toll-free 1-866-500-5408.
TS-2
Summary Information
This summary includes questions and answers that highlight certain information regarding the Buffered Return Notes Linked to the Equally Weighted Index Basket (the “Notes”). You should carefully review this term sheet and the additional documents listed above under “Additional Terms Specific to the Notes” to fully understand the terms of the Notes, the Equally Weighted Index Basket (the “Basket”) and the tax and other considerations that are important to you in making a decision about whether to invest in the Notes.
What are the Notes?
The Notes will be part of a series of senior debt securities issued by ML&Co. entitled “Medium-Term Notes, Series C” and will not be secured by collateral. The Notes will rank equally with all of our other unsecured and unsubordinated debt. We cannot redeem the Notes before the maturity date. We will not make any payments on the Notes until the maturity date.
Each unit will represent a single Note with an original public offering price specified on the face of this term sheet. You may transfer the Notes only in whole units. You will not have the right to receive physical certificates evidencing your ownership except under limited circumstances. Instead, we will issue the Notes in the form of a global certificate, which will be held by The Depository Trust Company, also known as DTC, or its nominee. Direct and indirect participants in DTC will record your ownership of the Notes. You should refer to the section entitled “Description of Debt Securities—Depositary” in the accompanying general prospectus supplement.
What will I receive on the maturity date of the Notes?
On the maturity date, you will receive a cash payment per unit equal to the Redemption Amount.
The “Redemption Amount” per unit to which you will be entitled will depend on the direction of and percentage change in the value of the Basket and will equal:
(i) If the Ending Value is greater than or equal to the Starting Value:
| $1,000 + | [ | $1,000 × | ( | Ending Value - Starting Value | ) | × Participation Rate | ] | ; | ||||||||
| Starting Value |
(ii) If the Ending Value is less than the Starting Value but is greater than or equal to the Threshold Value, the $1,000 original public offering price per unit; or
(iii) If the Ending Value is less than the Threshold Value:
| [ | $1,000 × | ( | Ending Value | × 100% | ) | ] | + $200 | |||||||
| Starting Value |
The “Starting Value” will be set to 100 on the date the Notes are priced for initial sale to the public (the “Pricing Date”).
The “Ending Value” will equal the closing value of the Basket on the Valuation Date. If there is a disruption in the stocks included in any Basket Component Index (as defined in the face of this term sheet) (the “Underlying Stocks”) or certain futures and options contracts relating to a Basket Component Index on the Valuation Date, the Ending Value will be the closing value of the Basket on the next scheduled Basket Business Day, as more fully described in the product supplement no. BFN-2.
The “Threshold Value” is 80% of the Starting Value.
The “Valuation Date” will be the fifth scheduled Basket Business Day prior to the maturity date.
The “Participation Rate” will be between 115% and 125%. The actual Participation Rate will be set forth in the term sheet made available in connection with sale of the Notes.
A “Basket Business Day” means any day on which the Basket Component Indices or any successor indices are calculated and published.
TS-3
In the event that the Ending Value is less than the Threshold Value, the amount you receive on the maturity date will be less, and possibly significantly less, than the $1,000 original public offering price per unit. A decline in the value of the Basket below the Threshold Value will result in the amount paid on the maturity date on the Notes being reduced by an amount equal to 100% of the decline in excess of 20%, but in no event will the Redemption Amount be less than $200 per unit.
For more specific information about the Redemption Amount, please see the section entitled “Description of the Notes” in the product supplement no. BFN-2.
Will I receive interest payments on the Notes?
You will not receive any interest payments on the Notes, but will instead receive the Redemption Amount on the maturity date. We have designed the Notes for investors who are seeking leveraged exposure to increases in the value of the Basket, willing to forego interest payments on the Notes, such as fixed or floating interest rates paid on traditional interest bearing debt securities, and willing to accept less than the $1,000 original public offering price per unit on the maturity date if the Ending Value is less than the Threshold Value on the Valuation Date.
What price can I expect to receive if I sell the Notes prior to the stated maturity date?
In determining the economic terms of the Notes, and consequently the potential return on the Notes to you, a number of factors are taken into account. Among these factors are certain costs associated with creating, hedging and offering the Notes. In structuring the economic terms of the Notes, we seek to provide investors with what we believe to be commercially reasonable terms and to provide MLPF&S with compensation for its services in developing the Notes.
If you sell your Notes prior to the stated maturity date, you will receive a price determined by market conditions for the Notes. This price may be influenced by many factors, such as interest rates, volatility and the prevailing value of the Basket. In addition, the price, if any, at which you could sell your Notes in a secondary market transaction is expected to be affected by the factors that we considered in setting the economic terms of the Notes, namely the underwriting discount paid in respect of the Notes, and compensation for developing and hedging the product. Depending on the impact of these factors, you may receive significantly less than the $1,000 original public offering price per unit of your Notes if sold before the stated maturity date.
In a situation where there had been no movement in the value of the Basket and no changes in the market conditions from those existing on the date of this product supplement, the price, if any, at which you could sell your Notes in a secondary market transaction is expected to be lower than the $1,000 original public offering price per unit. This is due to, among other things, our costs of developing, hedging and distributing the Notes. Any potential purchasers for your Notes in the secondary market are unlikely to consider these factors.
TS-4
Examples
Set forth below are three examples of Redemption Amount calculations, assuming a Participation Rate of 120%, the midpoint of the range of 115% and 125%.
Example 1— The hypothetical Ending Value is 30% below the Starting Value:
Starting Value: 100
Hypothetical Ending Value: 70
| Redemption Amount (per unit) = |
[ | $ | 1,000 | × | ( | 70 | × | 100 | % | ) | ] | + $ | 200 | = $ | 900 | ||||||||||||
| 100 |
Example 2— The hypothetical Ending Value is 10% below the Starting Value:
Starting Value: 100
Hypothetical Ending Value: 90
| Redemption Amount (per unit) = |
$ | 1,000 | (If the Ending Value is less than the Starting Value but is greater than or equal to the Threshold Value, the Redemption Amount per unit will equal the $1,000 original public offering price.) | ||
Example 3— The hypothetical Ending Value is 10% above the Starting Value:
Starting Value: 100
Hypothetical Ending Value: 110
| Redemption Amount (per unit) = |
[ | $ | 1,000 | + | ( | 110 - 100 | ) | × | 120% | ] | = $ | 1,120 | |||||||||||
| 100 |
TS-5
An investment in the Notes involves significant risks. Investing in the Notes is not equivalent to investing directly in the Basket. The following is an overview of certain of the risks involved in investing in the Notes. You should carefully review the “Risk Factors” section contained in the product supplement no. BFN-2, dated March 9, 2007 and the MTN prospectus supplement.
| · | Your investment in the Notes may result in a loss. |
| · | Your yield may be lower than the yield on other debt securities of comparable maturity. |
| · | Your return on the Notes will not reflect the return on a direct investment in the Underlying Stocks. |
| · | A trading market for the Notes is not expected to develop and, if trading does develop, the market price you may receive or be quoted for your Notes on a date prior to the stated maturity date will be affected by this and other important factors including our costs of developing, hedging and distributing the Notes. |
| · | Your return will be affected by factors affecting international securities markets. |
| · | The level of the Basket Component Indices will not be adjusted for changes in exchange rates that might affect the Basket Component Indices. |
| · | The respective publishers of the Basket Component Indices may adjust the Basket Component Indices in a way that affects their levels, and these respective publishers have no obligation to consider your interests. |
| · | Many factors affect the trading value of the Notes; these factors interrelate in complex ways and the effect of any one factor may offset or magnify the effect of another factor. |
| · | Purchases and sales by us and our affiliates may affect your return. |
| · | Amounts payable on the Notes may be limited by state law. |
| · | Potential conflicts of interest could arise. |
| · | Tax consequences are uncertain. |
TS-6
Hypothetical Returns
The following table illustrates, for the Starting Value and a range of hypothetical Ending Values of the Basket:
| • | the percentage change from the Starting Value to the hypothetical Ending Value; |
| • | the total amount payable on the maturity date for each Note; |
| • | the total rate of return to holders of the Notes; |
| • | the pretax annualized rate of return to holders of the Notes; and |
| • | the pretax annualized rate of return of an investment in the Underlying Stocks, which includes an assumed aggregate dividend yield of 2.05% per annum, as more fully described below. |
The table below includes a Threshold Value of 80% and assumes a Participation Rate of 120%, the midpoint of the range of 115% and 125%.
| Hypothetical Ending Value |
Percentage change from the Starting Value to the hypothetical Ending Value |
Total amount payable on maturity per Note |
Total rate of return on the Notes |
Pretax annualized rate of return on the Notes (1) |
Pretax annualized rate of return of
the | |||||
| 20.00 | -80% | $ 400.00 | -60.00% | -24.54% | -36.78% | |||||
| 30.00 | -70% | $ 500.00 | -50.00% | -18.86% | -28.20% | |||||
| 40.00 | -60% | $ 600.00 | -40.00% | -14.08% | -21.61% | |||||
| 50.00 | -50% | $ 700.00 | -30.00% | -9.94% | -16.23% | |||||
| 60.00 | -40% | $ 800.00 | -20.00% | -6.27% | -11.65% | |||||
| 70.00 | -30.0% | $ 900.00 | -10.00% | -2.99% | -7.65% | |||||
| 80.00 | -20.0% | $ 1,000.00 | 0.00% (4) | 0.00% | -4.10% | |||||
| 90.00 | -10.0% | $ 1,000.00 | 0.00% (4) | 0.00% | -0.90% | |||||
| 100.00 (3) | 0.0% | $ 1,000.00 | 0.00% | 0.00% | 2.02% | |||||
| 110.00 | 10.0% | $ 1,120.00 | 12.00% | 3.26% | 4.71% | |||||
| 120.00 | 20.0% | $ 1,240.00 | 24.00% | 6.24% | 7.20% | |||||
| 130.00 | 30.0% | $ 1,360.00 | 36.00% | 8.98% | 9.52% | |||||
| 140.00 | 40.0% | $ 1,480.00 | 48.00% | 11.52% | 11.70% | |||||
| 150.00 | 50.0% | $ 1,600.00 | 60.00% | 13.89% | 13.75% | |||||
| 160.00 | 60.0% | $ 1,720.00 | 72.00% | 16.11% | 15.69% | |||||
| 170.00 | 70.0% | $ 1,840.00 | 84.00% | 18.20% | 17.53% | |||||
| 180.00 | 80.0% | $ 1,960.00 | 96.00% | 20.18% | 19.28% |
(1) The annualized rates of return specified in this column are calculated on a semiannual bond equivalent basis and assume an investment term from March 12, 2007 to September 12, 2010, a term expected to be equal to that of the Notes.
(2) This rate of return assumes:
(a) a percentage change in the aggregate price of the Underlying Stocks that equals the percentage change in value of the Basket from the Starting Value to the relevant hypothetical Ending Value;
(b) a constant dividend yield of 2.05% per annum (which equals the average of a dividend yield of 1.83% for the S&P 500 Index price-weighted, 3.28% for the Dow Jones EURO STOXX 50 Index price-weighted and 1.05% for the Nikkei 225 Index price-weighted), paid quarterly from the date of initial delivery of the Notes, applied to the value of the Basket at the end of each quarter assuming this value increases or decreases linearly from the Starting Value to the applicable hypothetical Ending Value; and
(c) no transaction fees or expenses.
(3) This will be the Starting Value.
TS-7
(4) If the Ending Value is less than the Starting Value but is greater than or equal to the Threshold Value, the Redemption Amount per unit will equal the $1,000 original public offering price.
The above figures are for purposes of illustration only. The actual amount received by you and the resulting total and pretax annualized rates of return will depend on the actual Participation Rate, the Ending Value and term of your investment.
TS-8
The Basket
The Basket is designed to allow investors to participate in the percentage changes in the levels of the Basket Component Indices from the Starting Value to the Ending Value of the Notes. The Basket Component Indices are described in the sections below. Each Basket Component Index will be assigned an equal weighting so that each Basket Component Index represents an equal portion of the value of the Basket on the Pricing Date. A fixed factor (the “Multiplier”) will be determined for each Basket Component Index, based upon the weighting of that Basket Component Index. For more specific information, please see the section entitled “The Basket” in the product supplement no. BFN-2.
Computation of the Basket
If March 5, 2007 was the Pricing Date, for each Basket Component Index, the weighting, the closing level, the hypothetical Multiplier and the initial contribution to the Basket level would be as follows:
| Basket Component Index |
Bloomberg Symbol |
Region | Initial Weighting |
Closing Level(1) |
Hypothetical Multiplier(2) |
Initial Basket Level Contribution | ||||||
| S&P 500 |
SPX | United States | 33.33% | 1,374.12 | 0.02425795 | 33.33 | ||||||
| Dow Jones EURO STOXX 50 |
SX5E | Europe | 33.33% | 3,980.06 | 0.00837508 | 33.33 | ||||||
| Nikkei 225 |
NKY | Japan | 33.33% | 16,642.25 | 0.00200293 | 33.33 | ||||||
| Starting Value |
100.00 | |||||||||||
| (1) | This is the closing level of each Basket Component Index on March 5, 2007. |
| (2) | The hypothetical Multiplier equals the weighting of the Basket Component Index (as a percentage) multiplied by 100, rounded to eight decimal places, and then divided by the closing level of that Basket Component Index on March 5, 2007 and rounded to eight decimal places. The actual Multiplier will be determined on the Pricing Date and set forth in the term sheet made available in connection with sale of the Notes. |
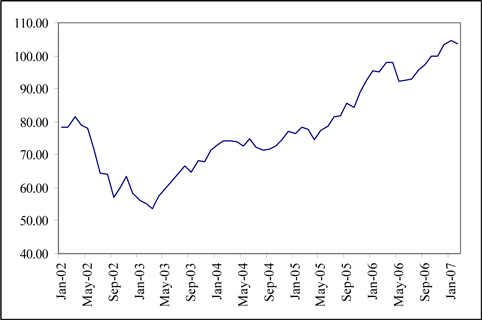
Hypothetical Historical Data on the Basket
While historical information on the Basket will not exist before the Pricing Date, the following table sets forth the hypothetical historical month-end values of the Basket from January 2002 through February 2007 based upon historical levels of each Basket Component Index, the hypothetical Multipliers and a Basket value of 100 on March 5, 2007. This hypothetical historical data on the Basket is not necessarily indicative of the future performance of the Basket or what the value of the Notes may be. Any historical upward or downward trend in the value of the Basket during any period set forth below is not an indication that the Basket is more or less likely to increase or decrease in value at any time during the term of the Notes.
| 2002 | 2003 | 2004 | 2005 | 2006 | 2007 | |||||||
| January | 78.18 | 56.29 | 72.82 | 76.46 | 95.32 | 104.70 | ||||||
| February | 78.41 | 55.08 | 74.12 | 78.33 | 95.14 | 103.62 | ||||||
| March | 81.61 | 53.60 | 74.13 | 77.60 | 97.86 | |||||||
| April | 79.08 | 57.39 | 73.76 | 74.65 | 97.81 | |||||||
| May | 78.14 | 59.76 | 72.72 | 77.26 | 92.25 | |||||||
| June | 71.53 | 62.10 | 74.97 | 78.75 | 92.43 | |||||||
| July | 64.39 | 64.28 | 72.19 | 81.63 | 92.85 | |||||||
| August | 64.18 | 66.58 | 71.35 | 81.80 | 95.86 | |||||||
| September | 57.03 | 64.69 | 71.55 | 85.71 | 97.37 | |||||||
| October | 59.89 | 68.20 | 72.54 | 84.34 | 99.81 | |||||||
| November | 63.42 | 67.93 | 74.40 | 88.97 | 99.97 | |||||||
| December | 58.51 | 71.48 | 77.13 | 92.53 | 103.41 | |||||||
TS-9
The following graph sets forth the hypothetical historical performance of the Basket presented in the preceding table. This hypothetical historical information is not necessarily indicative of the future performance of the Basket, and no assurance can be given that the value of the Basket will not decline and thereby reduce the amount which may be payable to you on the maturity date.
TS-10
The Basket Component Indices
S&P 500 Index price-weighted
All disclosure contained in this term sheet regarding the S&P 500 Index price-weighted (the “S&P 500 Index”), including, without limitation, its make-up, method of calculation and changes in its components has been derived from publicly available information prepared by Standard and Poor’s. ML&Co. and MLPF&S have not independently verified the accuracy or completeness of that information.
The S&P 500 Index is published by Standard & Poor’s, a division of The McGraw Hill Companies, Inc. (“Standard & Poor’s” or “S&P”). The S&P 500 Index is intended to provide an indication of the pattern of common stock price movement in the United States. The calculation of the level of the S&P 500 Index, discussed below in further detail, is based on the relative value of the aggregate market value of the common stocks of 500 companies as of a particular time compared to the aggregate average market value of the common stocks of 500 similar companies during the base period of the years 1941 through 1943. As of February 28, 2007, 424 companies or 85.7% of the market capitalization of the S&P 500 Index traded on the New York Stock Exchange; 76 companies or 14.3% of the market capitalization of the S&P 500 Index traded on The Nasdaq Stock Market; and no companies traded on the American Stock Exchange. As of February 28, 2007, the aggregate market value of the 500 companies included in the S&P 500 Index represented approximately 74% of the aggregate market value of stocks included in the Standard & Poor’s Stock Guide Database of domestic common stocks traded in the U.S., excluding American depositary receipts, limited partnerships and mutual funds. Standard & Poor’s chooses companies for inclusion in the S&P 500 Index with the aim of achieving a distribution by broad industry groupings that approximates the distribution of these groupings in the common stock population of the Standard & Poor’s Stock Guide Database, which Standard & Poor’s uses as an assumed model for the composition of the total market. Relevant criteria employed by Standard & Poor’s include the viability of the particular company, the extent to which that company represents the industry group to which it is assigned, the extent to which the market price of that company’s common stock is generally responsive to changes in the affairs of the respective industry and the market value and trading activity of the common stock of that company. Ten main groups of companies comprise the S&P 500 Index, with the approximate percentage of the market capitalization of the S&P 500 Index included in each group as of February 28, 2007 indicated in parentheses: Consumer Discretionary ( 10.7%); Consumer Staples (9.3%); Energy (9.7%); Financials (21.8%); Health Care (12.2%); Industrials (10.9%); Information Technology (14.9%); Materials (3.2%); Telecommunication Services ( 3.6%); and Utilities (3.6%). Standard & Poor’s may from time to time, in its sole discretion, add companies to, or delete companies from, the S&P 500 Index to achieve the objectives stated above.
The S&P 500 Index does not reflect the payment of dividends on the stocks included in the S&P 500 Index. Because of this, the calculation of the Ending Value will not reflect the payment of dividends on these stocks that investors would receive if they were to purchase these stocks and hold them for a period equal to the term of the Notes.
Computation of the S&P 500 Index
While S&P currently employs the following methodology to calculate the S&P 500 Index, no assurance can be given that S&P will not modify or change this methodology in a manner that may affect the Supplemental Redemption Amount.
Historically, the market value of any underlying stocks included in the S&P 500 Index was calculated as the product of the market price per share and the number of the then outstanding shares of that underlying stock. In March 2005, S&P began shifting the S&P 500 Index half way from a market capitalization weighted formula to a float-adjusted formula, before moving the S&P 500 Index to full float adjustment on September 16, 2005. S&P’s criteria for selecting stocks for the S&P 500 Index did not change by the shift to float adjustment. However, the adjustment affects each company’s weight in the S&P 500 Index (i.e., its market value).
Under float adjustment, the share counts used in calculating the S&P 500 Index reflect only those shares that are available to investors, not all of a company’s outstanding shares. Standard and Poor’s defines three groups of shareholders whose holdings are subject to float adjustment:
| • | holdings by other publicly traded corporations, venture capital firms, private equity firms, strategic partners, or leveraged buyout groups; |
TS-11
| • | holdings by government entities, including all levels of government in the United States or foreign countries; and |
| • | holdings by current or former officers and directors of the company, founders of the company, or family trusts of officers, directors, or founders, as well as holdings of trusts, foundations, pension funds, employee stock ownership plans, or other investment vehicles associated with and controlled by the company. |
However, treasury stock, stock options, restricted shares, equity participation units, warrants, preferred stock, convertible stock, and rights are not part of the float. In cases where holdings in a group exceed 10% of the outstanding shares of a company, the holdings of that group are excluded from the float-adjusted count of shares to be used in the index calculation. Shares held by mutual funds, investment advisory firms, pension funds, or foundations not associated with the company and investment funds in insurance companies, shares of a United States company traded in Canada as “exchangeable shares”, shares that trust beneficiaries may buy or sell without difficulty or significant additional expense beyond typical brokerage fees, and, if a company has multiple classes of stock outstanding, shares in an unlisted or non-traded class if such shares are convertible by shareholders without undue delay and cost, are also part of the float.
For each stock, an investable weight factor (“IWF”) is calculated by dividing the available float shares, defined as the total shares outstanding less shares held in one or more of the three groups listed above where the group holdings exceed 10% of the outstanding shares, by the total shares outstanding. The float-adjusted index is then calculated by dividing the sum of the IWF multiplied by both the price and the total shares outstanding for each stock by the index divisor. For companies with multiple classes of stock, Standard and Poor’s calculates the weighted average IWF for each stock using the proportion of the total company market capitalization of each share class as weights.
The S&P 500 Index is calculated using a base-weighted aggregate methodology: the level of the S&P 500 Index reflects the total market value of all 500 component stocks relative to the base period of the years 1941 through 1943 (the “base period”). An indexed number is used to represent the results of this calculation in order to make the value easier to work with and track over time. The actual total market value of the component stocks during the base period of the years 1941 through 1943 has been set to an indexed value of 10. This is often indicated by the notation 1941-43 = 10. In practice, the daily calculation of the S&P 500 Index is computed by dividing the total market value of the component stocks by the “index divisor”. By itself, the index divisor is an arbitrary number. However, in the context of the calculation of the S&P 500 Index, it serves as a link to the original base period level of the S&P 500 Index. The index divisor keeps the S&P 500 Index comparable over time and is the manipulation point for all adjustments to the S&P 500 Index.
Index Maintenance
Index maintenance includes monitoring and completing the adjustments for company additions and deletions, share changes, stock splits, stock dividends, and stock price adjustments due to company restructuring or spinoffs.
To prevent the level of the S&P 500 Index from changing due to these corporate actions, all corporate actions which affect the level of the S&P 500 Index require an index divisor adjustment. By adjusting the index divisor for the change in total market value of an individual company, the level of the S&P 500 Index remains constant. This helps maintain the level of the S&P 500 Index as an accurate barometer of stock market performance and ensures that the movement of the S&P 500 Index is not caused by the corporate action an individual company. All index divisor adjustments are made after the close of trading and after the calculation of the S&P 500 Index closing level.
Some corporate actions, such as stock splits and stock dividends, require simple changes in the common shares outstanding and the stock prices of the companies in the S&P 500 Index and do not require index divisor adjustments.
Changes in a company’s shares outstanding of 5.00% or more due to mergers, acquisitions, public offerings, private placements, tender offers, Dutch auctions, or exchange offers are made as soon as reasonably possible. All other changes of 5.00% or more (due to, for example, company stock repurchases, redemptions, exercise of options, warrants, subscription rights, conversion of preferred stock, notes, debt, equity participation
TS-12
units, or other recapitalizations) are made weekly and are announced on Tuesday for implementation after the close of trading on Wednesday. Changes of less than 5.00% are accumulated and made quarterly on the third Friday of March, June, September, and December, and are usually announced two days prior.
Also, changes in IWFs of more than ten percentage points caused by corporate actions (such as merger and acquisition activity, restructurings, or spinoffs) will be made as soon as reasonably possible. Other changes in IWFs will be made annually, in September when IWFs are reviewed.
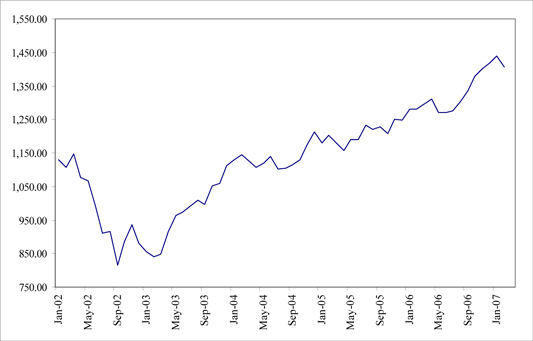
Historical Data on the S&P 500 Index
The following table sets forth the closing levels of the S&P 500 Index at the end of each month in the period from January 2002 through February 2007. This historical data on the S&P 500 Index is not necessarily indicative of the future performance of the S&P 500 Index or what the value of the Notes may be. Any historical upward or downward trend in the level of the S&P 500 Index during any period set forth below is not an indication that the S&P 500 Index is more or less likely to increase or decrease at any time during the term of the Notes.
| 2002
|
2003
|
2004
|
2005
|
2006
|
2007
| |||||||
| January |
1,130.20 | 855.70 | 1,131.13 | 1,181.27 | 1,280.08 | 1,438.24 | ||||||
| February |
1,106.73 | 841.15 | 1,144.94 | 1,203.60 | 1,280.66 | 1,406.82 | ||||||
| March |
1,147.39 | 848.18 | 1,126.21 | 1,180.59 | 1,294.83 | |||||||
| April |
1,076.92 | 916.92 | 1,107.30 | 1,156.85 | 1,310.61 | |||||||
| May |
1,067.14 | 963.59 | 1,120.68 | 1,191.50 | 1,270.09 | |||||||
| June |
989.82 | 974.50 | 1,140.84 | 1,191.33 | 1,270.20 | |||||||
| July |
911.62 | 990.31 | 1,101.72 | 1,234.18 | 1,276.66 | |||||||
| August |
916.07 | 1,008.01 | 1,104.24 | 1,220.33 | 1,303.82 | |||||||
| September |
815.28 | 995.97 | 1,114.58 | 1,228.81 | 1,335.85 | |||||||
| October |
885.76 | 1,050.71 | 1,130.20 | 1,207.01 | 1,377.94 | |||||||
| November |
936.31 | 1,058.20 | 1,173.82 | 1,249.48 | 1,400.63 | |||||||
| December |
879.82 | 1,111.92 | 1,211.92 | 1,248.29 | 1,418.30 | |||||||
The following graph sets forth the historical performance of the S&P 500 Index presented in the preceding table. Past movements of the S&P 500 Index are not necessarily indicative of the future performance of the S&P 500 Index. On March 5, 2007, the closing level of the S&P 500 Index was 1,374.12.
TS-13
License Agreement
Standard & Poor’s does not guarantee the accuracy and/or the completeness of the S&P 500 Index or any data included in the S&P 500 Index. Standard & Poor’s makes no warranty, express or implied, as to results to be obtained by the Calculation Agent, the holders of the Notes or any other person or entity from the use of the S&P 500 Index or any data included in the S&P 500 Index in connection with the rights licensed under the license agreement described in this term sheet or for any other use. Standard & Poor’s makes no express or implied warranties, and hereby expressly disclaims all warranties of merchantability or fitness for a particular purpose with respect to the S&P 500 Index or any data included in the S&P 500 Index. Without limiting any of the above information, in no event shall Standard & Poor’s have any liability for any special, punitive, indirect or consequential damage; including lost profits, even if notified of the possibility of these damages.
Standard & Poor’s and MLPF&S have entered into a non-exclusive license agreement providing for the license to MLPF&S, in exchange for a fee, of the right to use indices owned and published by Standard & Poor’s in connection with some securities, including the Notes, and ML&Co. is an authorized sublicensee of MLPF&S. The license agreement between Standard & Poor’s and MLPF&S provides that the following language must be stated in this term sheet:
“The Notes are not sponsored, endorsed, sold or promoted by S&P. S&P makes no representation or warranty, express or implied, to the holders of the Notes or any member of the public regarding the advisability of investing in securities generally or in the Notes particularly or the ability of the S&P 500 Index to track general stock market performance. S&P’s only relationship to MLPF&S (other than transactions entered into in the ordinary course of business) is the licensing of certain service marks and trade names of S&P and of the S&P 500 Index which is determined, composed and calculated by S&P without regard to ML&Co. or the Notes. S&P has no obligation to take the needs of ML&Co. or the holders of the Notes into consideration in determining, composing or calculating the S&P 500 Index. S&P is not responsible for and has not participated in the determination of the timing of the sale of the Notes, prices at which the Notes are to initially be sold, or quantities of the Notes to be issued or in the determination or calculation of the equation by which the Notes are to be converted into cash. S&P has no obligation or liability in connection with the administration, marketing or trading of the Notes.”
Dow Jones EURO STOXX 50 Index price-weighted
All disclosure contained in this term sheet regarding the Dow Jones EURO STOXX 50 Index price-weighted (the “Dow Jones EURO STOXX 50 Index”), including, without limitation, its make-up, method of calculation and changes in its components, has been derived from publicly available sources. The information reflects the policies of, and is subject to change by STOXX. ML&Co. and MLPF&S have not independently verified the accuracy or completeness of that information.
The Dow Jones EURO STOXX 50 Index was created by STOXX, a joint venture founded by SWX Group, Deutsche Börse AG and Dow Jones & Company, Inc. (“Dow Jones”). Publication of the Dow Jones EURO STOXX 50 Index began on February 26, 1998, based on an initial level of the Dow Jones EURO STOXX 50 Index of 1,000 at December 31, 1991.
The Dow Jones EURO STOXX 50 Index was created by STOXX Limited to reflect the market-capitalization weighted performance of large companies from the major industry groupings in Austria, Belgium, Finland, France, Germany, Greece, Ireland, Italy, the Netherlands, Portugal and Spain. The companies included in the Dow Jones EURO STOXX 50 Index account for approximately 60% of the free-float market capitalization of the Dow Jones EURO STOXX Total Market Index, which in turn accounts for approximately 95% of the free-float market capitalization of the countries with companies eligible for inclusion in the Dow Jones EURO STOXX 50 Index.
The Dow Jones EURO STOXX 50 Index is currently calculated by: (i) multiplying the per share price of each underlying security by the number of free-float adjusted outstanding shares (and, if the stock is not quoted in euros, then multiplying by the related country currency and an exchange factor which reflects the exchange rate between the related country currency and the euro); (ii) calculating the sum of all these products (the “Index Aggregate Market Capitalization”); and (iii) dividing the Index Aggregate Market Capitalization by a divisor which represents the Index Aggregate Market Capitalization on the base date of the Dow Jones EURO STOXX 50 Index and which can be adjusted to allow changes in the issued share capital of individual underlying securities, including the deletion and addition of stocks, the substitution of stocks, stock dividends and stock splits, to be made without
TS-14
distorting the Dow Jones EURO STOXX 50 Index. Because of this capitalization weighting, movements in share prices of the underlying securities of companies with relatively greater market capitalization will have a greater effect on the level of the entire Dow Jones EURO STOXX 50 Index than will movements in share prices of the underlying securities of companies with relatively smaller market capitalization.
The weight of each Underlying Stock that comprises the Dow Jones EURO STOXX 50 Index is capped at 10% of the Dow Jones EURO STOXX 50 Index’s total free-float market capitalization. The free-float weights are reviewed quarterly.
The composition of the Dow Jones EURO STOXX 50 Index is reviewed annually, and changes are implemented on the third Friday in September, using market data from the end of August as the basis for the review process. Changes in the composition of the Dow Jones EURO STOXX 50 Index are made to ensure that the Dow Jones EURO STOXX 50 Index includes those companies which, within the eligible countries and within each industry sector, have the greatest market capitalization. Changes in the composition of the Dow Jones EURO STOXX 50 Index are made entirely by STOXX without consultation with the companies represented in the Dow Jones EURO STOXX 50 Index or ML&Co. The Dow Jones EURO STOXX 50 Index is also reviewed on an ongoing basis, and a change in the composition of the Dow Jones EURO STOXX 50 Index may be necessary if there have been extraordinary events for one of the issuers of the underlying securities, e.g., delisting, bankruptcy, merger or takeover. In these cases, the event is taken into account as soon as it is effective. The underlying securities may be changed at any time for any reason. Neither STOXX nor any of its founders is affiliated with ML&Co. nor have they participated in any way in the creation of the Notes.
ML&Co. or its affiliates may presently or from time to time engage in business with the publishers, owners, founders or creators of the Dow Jones EURO STOXX 50 Index or any of its successors or one or more of the issuers of the underlying securities, including extending loans to, making equity investments in or providing advisory services, including merger and acquisition advisory services, to the publishers, their successors, founders or creators or to any of the issuers. In the course of business with the issuers, ML&Co. or its affiliates may acquire non-public information with respect to the issuers. ML&Co. may also act as market maker for the common stocks of the issuers. ML&Co. does not make any representation to any purchaser of the Notes with respect to any matters whatsoever relating to any of the publishers, their successors, founders or creators or to any of the issuers. Any prospective purchaser of the Notes should undertake an independent investigation of the issuers of the underlying securities and with respect to the competency of its publisher to formulate and calculate the Dow Jones EURO STOXX 50 Index as in its judgment is appropriate to make an informed decision with respect to an investment in the Notes. The composition of the Dow Jones EURO STOXX 50 Index does not reflect any investment or sell recommendations of ML&Co. or its affiliates.
A representative of an affiliate of ML&Co. may from time to time be a member of the STOXX Limited Advisory Committee. STOXX states in its Guide to the Dow Jones STOXX Indexes that STOXX’s Advisory Committee advises the Supervisory Board on matters relating to the Dow Jones EURO STOXX 50 Index. This advisory committee proposes changes in the composition of the Dow Jones EURO STOXX 50 Index to the Supervisory Board and makes recommendations with respect to the accuracy and transparency of the Dow Jones EURO STOXX 50 Index computation. Decisions on the composition and changes in the Dow Jones EURO STOXX 50 Index are reserved to the Supervisory Board.
TS-15
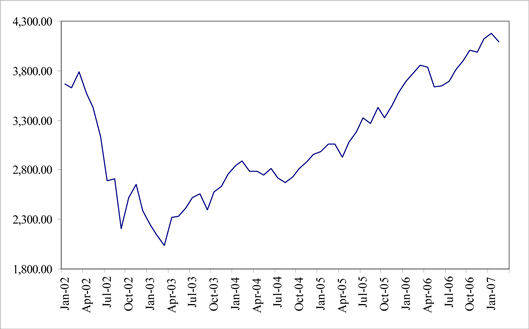
Historical Data on the Dow Jones EURO STOXX 50 Index
The following table sets forth the level of the Dow Jones EURO STOXX 50 Index at the end of each month in the period from January 2002 through February 2007. This historical data on the Dow Jones EURO STOXX 50 Index is not necessarily indicative of the future performance of the Dow Jones EURO STOXX 50 Index or what the value of the Notes may be. Any historical upward or downward trend in the level of the Dow Jones EURO STOXX 50 Index during any period set forth below is not an indication that the Dow Jones EURO STOXX 50 Index is more or less likely to increase or decrease at any time during the term of the Notes.
| 2002 | 2003 | 2004 | 2005 | 2006 | 2007 | |||||||
| January |
3,670.26 | 2,248.17 | 2,839.13 | 2,984.59 | 3,691.41 | 4,178.54 | ||||||
| February |
3,624.74 | 2,140.73 | 2,893.18 | 3,058.32 | 3,774.51 | 4,087.12 | ||||||
| March |
3,784.05 | 2,036.86 | 2,787.49 | 3,055.73 | 3,853.74 | |||||||
| April |
3,574.23 | 2,324.23 | 2,787.48 | 2,930.10 | 3,839.90 | |||||||
| May |
3,425.79 | 2,330.06 | 2,736.83 | 3,076.70 | 3,637.17 | |||||||
| June |
3,133.39 | 2,419.51 | 2,811.08 | 3,181.54 | 3,648.92 | |||||||
| July |
2,685.79 | 2,519.79 | 2,720.05 | 3,326.51 | 3,691.87 | |||||||
| August |
2,709.29 | 2,556.71 | 2,670.79 | 3,263.78 | 3,808.70 | |||||||
| September |
2,204.39 | 2,395.87 | 2,726.30 | 3,428.51 | 3,899.41 | |||||||
| October |
2,518.99 | 2,575.04 | 2,811.72 | 3,320.15 | 4,004.80 | |||||||
| November |
2,656.85 | 2,630.47 | 2,876.39 | 3,447.07 | 3,987.23 | |||||||
| December |
2,386.41 | 2,760.66 | 2,951.24 | 3,578.93 | 4,119.94 | |||||||
The following graph sets forth the historical performance of the Dow Jones EURO STOXX 50 Index presented in the preceding table. Past movements of the Dow Jones EURO STOXX 50 Index are not necessarily indicative of the future performance of the Dow Jones EURO STOXX 50 Index. On March 5, 2007, the closing level of the Dow Jones EURO STOXX 50 Index was 3,980.06.
TS-16
License Agreement
STOXX and ML&Co. have entered into a non-exclusive license agreement providing for the license to ML&Co. and its wholly-owned subsidiaries, in exchange for a fee, of the right to use the EURO STOXX 50 Index, which is owned and published by STOXX, in connection with certain securities and other products, including the Notes.
The license agreement between STOXX and ML&Co. provides that the following language must be set forth in this term sheet:
“The Dow Jones EURO STOXX 50 Index is proprietary and copyrighted material. The Dow Jones EURO STOXX 50 Index and the related trademarks have been licensed for certain purposes by Merrill Lynch & Co., Inc. STOXX, Dow Jones and Dow Jones EURO STOXX 50 Index are trademarks of Dow Jones & Company, Inc. and have been licensed for use. STOXX and Dow Jones have no relationship to Merrill Lynch & Co., Inc., other than the licensing of the Dow Jones EURO STOXX 50 Index and the related trademarks for use in connection with the Notes. STOXX and Dow Jones do not:
| • | Sponsor, endorse, sell or promote the Notes. |
| • | Recommend that any person invest in the Notes or any other securities. |
| • | Have any responsibility or liability for or make any decisions about the timing, amount or pricing of the Notes. |
| • | Have any responsibility or liability for the administration, management or marketing of the Notes. |
| • | Consider the needs of the owners of the Notes in determining, composing or calculating the Dow Jones EURO STOXX 50 Index or have any obligation to do so. |
|
STOXX and Dow Jones will not have any liability in connection with the Notes. Specifically,
· STOXX and Dow Jones do not make any warranty, express or implied and disclaim any and all warranty about:
The results to be obtained by the Notes, the owner of the Notes or any other person in connection with the use of the Dow Jones EURO STOXX 50 Index and the data included in the Dow Jones EURO STOXX 50 Index;
The accuracy or completeness of the Dow Jones EURO STOXX 50 Index and its data;
The merchantability and the fitness for a particular purpose or use of the Dow Jones EURO STOXX 50 Index and its data;
STOXX and Dow Jones will not have liability for any errors, omissions or interruptions in the Dow Jones EURO STOXX 50 Index or its data;
· Under no circumstances will STOXX or Dow Jones be liable for any lost profits or indirect, punitive, special or consequential damages or losses, even if STOXX or Dow Jones knows that they might occur.
The licensing agreement between the Merrill Lynch and Co., Inc. and STOXX is solely for their benefit and not for the benefit of the owners of the Notes or any other third parties.”
|
TS-17
Nikkei 225 Index price-weighted
All disclosure contained in this term sheet regarding the Nikkei 225 Index price-weighted (the “Nikkei 225 Index”), including, without limitation, its make-up, method of calculation and changes in its components, has been derived from publicly available sources. The information reflects the policies of, and is subject to change by Nikkei. ML&Co. and MLPF&S have not independently verified the accuracy or completeness of that information.
The Nikkei 225 Index is a stock index calculated, published and disseminated by Nikkei that measures the composite price performance of selected Japanese stocks. The Nikkei 225 Index is currently comprised of 225 stocks that trade on the Tokyo Stock Exchange (the “TSE”) and represents a broad cross-section of Japanese industry. All 225 of the stocks underlying the Nikkei 225 Index are stocks listed in the First Section of the TSE. Stocks listed in the First Section are among the most actively traded stocks on the TSE. Futures and options contracts on the Nikkei 225 Index are traded on the Singapore International Monetary Exchange, the Osaka Securities Exchange and the Chicago Mercantile Exchange.
The Nikkei 225 Index is a modified, price-weighted index. Each stock’s weight in the Nikkei 225 Index is based on its price per share rather than the total market capitalization of the issuer. Nikkei calculates the Nikkei 225 Index by multiplying the per share price of each stock by the corresponding weighting factor for that Underlying Stock (a “Weight Factor”), calculating the sum of all these products and dividing that sum by a divisor. The divisor, initially set on May 16, 1949 at 225, was 24.293 as of October 2, 2006, and is subject to periodic adjustments as set forth below. Each Weight Factor is computed by dividing ¥50 by the par value of the relevant stock, so that the share price of each stock when multiplied by its Weight Factor corresponds to a share price based on a uniform par value of ¥50. Each Weight Factor represents the number of shares of the related stock which are included in one trading unit of the Nikkei 225 Index. The stock prices used in the calculation of the Nikkei 225 Index are those reported by a primary market for the stocks, which is currently the TSE. The level of the Nikkei 225 Index is calculated once per minute during TSE trading hours.
In order to maintain continuity in the level of the Nikkei 225 Index in the event of certain changes due to non-market factors affecting the stocks, such as the addition or deletion of stocks, substitution of stocks, stock dividends, stock splits or distributions of assets to stockholders, the divisor used in calculating the Nikkei 225 Index is adjusted in a manner designed to prevent any instantaneous change or discontinuity in the level of the Nikkei 225 Index. The divisor remains at the new value until a further adjustment is necessary as the result of another change. As a result of each change affecting any stock, the divisor is adjusted in such a way that the sum of all share prices immediately after the change multiplied by the applicable Weight Factor and divided by the new divisor, i.e., the level of the Nikkei 225 Index immediately after the change, will equal the level of the Nikkei 225 Index immediately prior to the change.
Stocks may be deleted or added by Nikkei. However, to maintain continuity in the Nikkei 225 Index, the policy of Nikkei is generally not to alter the composition of the stocks except when a stock is deleted in accordance with the following criteria. Any stock becoming ineligible for listing in the First Section of the TSE due to any of the following reasons will be deleted from the Nikkei 225 Index: bankruptcy of the issuer; merger of the issuer into, or acquisition of the issuer by, another company; delisting of the stock or transfer of the stock to the “Seiri-Post” because of excess debt of the issuer or because of any other reason; or transfer of the stock to the Second Section of the TSE. Upon deletion of a stock from the Nikkei 225 Index, Nikkei will select, in accordance with certain criteria established by it, a replacement for the deleted stock. In an exceptional case, a newly listed stock in the First Section of the TSE that is recognized by Nikkei to be representative of a market may be added to the Nikkei 225 Index. As a result, an existing stock with low trading volume and not representative of a market will be deleted.
None of ML&Co., MLPF&S and Nikkei accepts any responsibility for the calculation, maintenance or publication of the Nikkei 225 Index or any successor index. Nikkei disclaims all responsibility for any errors or omissions in the calculation and dissemination of the Nikkei 225 Index or the manner in which the Nikkei 225 Index is applied in determining any Starting Value or Ending Value or any Redemption Amount payable to you on the maturity date of the Notes.
The Tokyo Stock Exchange
The TSE is one of the world’s largest securities exchanges in terms of market capitalization. Trading hours are currently from 9:00 A.M. to 11:00 A.M. and from 1:00 P.M. to 3:00 P.M., Tokyo time, Monday through Friday.
Due to the time zone difference, on any normal trading day the TSE will close prior to the opening of business in New York City on the same calendar day. Therefore, the closing level of the Nikkei 225 Index on a trading day will generally be available in the United States by the opening of business on the same calendar day.
The TSE has adopted certain measures, including daily price floors and ceilings on individual stocks, intended to prevent any extreme short-term price fluctuations resulting from order imbalances. In general, any stock listed on the TSE cannot be traded at a price lower than the applicable price floor or higher than the applicable price ceiling. These price floors
TS-18
and ceilings are expressed in absolute Japanese yen, rather than percentage limits based on the closing price of the stock on the previous trading day. In addition, when there is a major order imbalance in a listed stock, the TSE posts a “special bid quote” or a “special asked quote” for that stock at a specified higher or lower price level than the stock’s last sale price in order to solicit counter-orders and balance supply and demand for the stock. Prospective investors should also be aware that the TSE may suspend the trading of individual stocks in certain limited and extraordinary circumstances, including, for example, unusual trading activity in that stock. As a result, changes in the Nikkei 225 Index may be limited by price limitations or special quotes, or by suspension of trading, on individual stocks which comprise the Nikkei 225 Index, and these limitations may, in turn, adversely affect the value of the Notes.
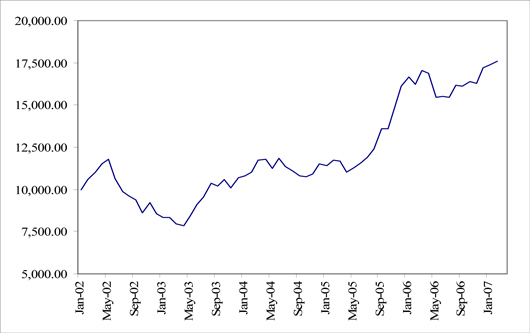
Historical Data on the Nikkei 225 Index
The following table sets forth the closing level of the Nikkei 225 Index at the end of each month in the period from January 2002 through February 2007. This historical data on the Nikkei 225 Index is not necessarily indicative of the future performance of the Nikkei 225 Index or what the value of the Notes may be. Any historical upward or downward trend in the level of the Nikkei 225 Index during any period set forth below is not an indication that the Nikkei 225 Index is more or less likely to increase or decrease at any time over the term of the Notes.
| 2002 | 2003 | 2004 | 2005 | 2006 | 2007 | |||||||
|
January |
9,997.80 | 8,339.94 | 10,783.61 | 11,387.59 | 16,649.82 | 17,383.42 | ||||||
| February |
10,587.83 | 8,363.04 | 11,041.92 | 11,740.60 | 16,205.43 | 17,604.12 | ||||||
| March |
11,024.94 | 7,972.71 | 11,715.39 | 11,668.95 | 17,059.66 | |||||||
| April |
11,492.54 | 7,831.42 | 11,761.79 | 11,008.90 | 16,906.23 | |||||||
| May |
11,763.70 | 8,424.51 | 11,236.37 | 11,276.59 | 15,467.33 | |||||||
| June |
10,621.84 | 9,083.11 | 11,858.87 | 11,584.01 | 15,505.18 | |||||||
| July |
9,877.94 | 9,563.21 | 11,325.78 | 11,899.60 | 15,456.81 | |||||||
| August |
9,619.30 | 10,343.55 | 11,081.79 | 12,413.60 | 16,140.76 | |||||||
| September |
9,383.29 | 10,219.05 | 10,823.57 | 13,574.30 | 16,127.58 | |||||||
| October |
8,640.48 | 10,559.59 | 10,771.42 | 13,606.50 | 16,399.39 | |||||||
| November |
9,215.56 | 10,100.57 | 10,899.25 | 14,872.15 | 16,274.33 | |||||||
| December |
8,578.95 | 10,676.64 | 11,488.76 | 16,111.43 | 17,225.83 | |||||||
The following graph sets forth the historical performance of the Nikkei 225 Index presented in the preceding table. Past movements of the Nikkei 225 Index are not necessarily indicative of the future performance of the Nikkei 225 Index. March 5, 2007, the closing level of the Nikkei 225 Index was 16,642.25.
TX-19
License Agreement
Nikkei and ML&Co. have entered into a non-exclusive license agreement providing for the license to ML&Co., in exchange for a fee, of a right to use indices owned and published by Nikkei in connection with some securities, including the Notes.
Nikkei is under no obligation to continue the calculation and dissemination of the Nikkei 225 Index. The Notes are not sponsored, endorsed, sold or promoted by Nikkei. No inference should be drawn from the information contained in this term sheet that Nikkei makes any representation or warranty, implied or express, to ML&Co., the holder of the Notes or any member of the public regarding the advisability of investing in securities generally or in the Notes in particular or the ability of the Notes to track general stock market performance. Nikkei has no obligation to take the needs of ML&Co. or the holders of the Notes into consideration in determining, composing or calculating the Nikkei 225 Index. Nikkei is not responsible for, and has not participated in the determination of the timing of, prices for, or quantities of, the Notes to be issued or in the determination or calculation of the equation by which the Notes are to be settled in cash. Nikkei has no obligation or liability in connection with the administration or marketing of the Notes.
The use of and reference to the Nikkei 225 Index in connection with the Notes have been consented to by Nikkei, the publisher of the Nikkei 225 Index. The copyright relating to the Nikkei 225 Index and intellectual property rights as to the indications for “Nikkei” and the Nikkei 225 Index and any other rights belong to Nikkei.
TS-20