
| PRICING SUPPLEMENT (To MTN prospectus supplement, general prospectus supplement and prospectus, each dated March 31, 2006) Pricing Supplement Number: 2712 |
Filed Pursuant to Rule 424(b)(3) Registration No. 333-132911 |
12,900,000 Units
Merrill Lynch & Co., Inc.
Medium-Term Notes, Series C
Accelerated Return Bear Market Notes
Linked to the Cohen & Steers Realty Majors Portfolio Index
due June 5, 2008
(the “Notes”)
$10 original public offering price per unit
Information included in this pricing supplement supersedes information in the accompanying MTN prospectus supplement, general prospectus supplement and prospectus to the extent that it is different from that information.
Investing in the Notes involves risks that are described in the “ Risk Factors” section beginning on page PS-7 of this pricing supplement and beginning on page S-3 of the accompanying MTN prospectus supplement.
| Per Unit | Total | |||
| Public offering price (1) |
$10.00 | $129,000,000 | ||
| Underwriting discount (1) |
$.20 | $2,580,000 | ||
| Proceeds, before expenses, to Merrill Lynch & Co., Inc. |
$9.80 | $126,420,000 |
| (1) | The public offering price and the underwriting discount for any single transaction to purchase between 100,000 to 299,999 units will be $9.95 per unit and $.15 per unit, respectively, for any single transaction to purchase between 300,000 to 499,999 units will be $9.90 per unit and $.10 per unit, respectively, and for any single transaction to purchase 500,000 units or more will be $9.85 per unit and $.05 per unit, respectively. |
Neither the Securities and Exchange Commission nor any state securities commission has approved or disapproved of these securities or determined if this pricing supplement or the accompanying MTN prospectus supplement, general prospectus supplement and prospectus is truthful or complete. Any representation to the contrary is a criminal offense.
Merrill Lynch & Co.
The date of this pricing supplement is March 29, 2007.
Pricing Supplement
| SUMMARY INFORMATION—Q&A | PS-3 | |
| RISK FACTORS | PS-7 | |
| DESCRIPTION OF THE NOTES | PS-11 | |
| THE INDEX | PS-16 | |
| UNITED STATES FEDERAL INCOME TAXATION | PS-21 | |
| ERISA CONSIDERATIONS | PS-24 | |
| USE OF PROCEEDS AND HEDGING | PS-25 | |
| SUPPLEMENTAL PLAN OF DISTRIBUTION | PS-25 | |
| EXPERTS | PS-25 | |
| INDEX OF CERTAIN DEFINED TERMS | PS-26 | |
| ANNEX A | A-1 | |
| Medium-Term Notes, Series C Prospectus Supplement | ||
| (the “MTN prospectus supplement”) | ||
| RISK FACTORS | S-3 | |
| DESCRIPTION OF THE NOTES | S-4 | |
| UNITED STATES FEDERAL INCOME TAXATION | S-22 | |
| PLAN OF DISTRIBUTION | S-29 | |
| VALIDITY OF THE NOTES | S-30 | |
| Debt Securities, Warrants, Preferred Stock, | ||
| Depositary Shares and Common Stock Prospectus Supplement | ||
| (the “general prospectus supplement”) | ||
| MERRILL LYNCH & CO., INC |
S-3 | |
| USE OF PROCEEDS |
S-3 | |
| RATIO OF EARNINGS TO FIXED CHARGES AND RATIO OF EARNINGS TO COMBINED FIXED CHARGES AND PREFERRED STOCK DIVIDENDS |
S-4 | |
| THE SECURITIES |
S-4 | |
| DESCRIPTION OF DEBT SECURITIES |
S-5 | |
| DESCRIPTION OF DEBT WARRANTS |
S-16 | |
| DESCRIPTION OF CURRENCY WARRANTS |
S-18 | |
| DESCRIPTION OF INDEX WARRANTS |
S-20 | |
| DESCRIPTION OF PREFERRED STOCK |
S-25 | |
| DESCRIPTION OF DEPOSITARY SHARES |
S-32 | |
| DESCRIPTION OF PREFERRED STOCK WARRANTS |
S-36 | |
| DESCRIPTION OF COMMON STOCK |
S-38 | |
| DESCRIPTION OF COMMON STOCK WARRANTS |
S-42 | |
| PLAN OF DISTRIBUTION |
S-44 | |
| WHERE YOU CAN FIND MORE INFORMATION |
S-45 | |
| INCORPORATION OF INFORMATION WE FILE WITH THE SEC |
S-46 | |
| EXPERTS |
S-46 | |
| Prospectus | ||
| WHERE YOU CAN FIND MORE INFORMATION |
2 | |
| INCORPORATION OF INFORMATION WE FILE WITH THE SEC |
2 | |
| EXPERTS |
2 | |
PS-2
This summary includes questions and answers that highlight selected information from this pricing supplement and the accompanying MTN prospectus supplement, general prospectus supplement and prospectus to help you understand the Accelerated Return Bear Market Notes Linked to the Cohen & Steers Realty Majors Portfolio Index due June 5, 2008 (the “Notes”). You should carefully read this pricing supplement, the accompanying MTN prospectus supplement, general prospectus supplement and prospectus to fully understand the terms of the Notes, the Cohen & Steers Realty Majors Portfolio Index (the “Index”) and the tax and other considerations that are important to you in making a decision about whether to invest in the Notes. You should carefully review the “Risk Factors” section in this pricing supplement and the accompanying MTN prospectus supplement, which highlights certain risks associated with an investment in the Notes, to determine whether an investment in the Notes is appropriate for you.
References in this pricing supplement to “ML&Co.”, “we”, “us” and “our” are to Merrill Lynch & Co., Inc. and references to “MLPF&S” are to Merrill Lynch, Pierce, Fenner & Smith Incorporated.
What are the Notes?
The Notes will be part of a series of senior debt securities issued by ML&Co. entitled “Medium-Term Notes, Series C” and will not be secured by collateral. The Notes will rank equally with all of our other unsecured and unsubordinated debt. The Notes will mature on June 5, 2008. We cannot redeem the Notes prior to the maturity date and we will not make any payments on the Notes until the maturity date.
Each unit will represent a single Note with a $10 original public offering price. You may transfer the Notes only in whole units. You will not have the right to receive physical certificates evidencing your ownership except under limited circumstances. Instead, we will issue the Notes in the form of a global certificate, which will be held by The Depository Trust Company, also known as DTC, or its nominee. Direct and indirect participants in DTC will record your ownership of the Notes. You should refer to the section entitled “Description of Debt Securities—Depositary” in the accompanying general prospectus supplement.
Are there any risks associated with my investment?
Yes, an investment in the Notes is subject to risks, including the risk of loss, and possibly a significant loss, of principal. Please refer to the section entitled “Risk Factors” in this pricing supplement and the accompanying MTN prospectus supplement.
Who publishes the Index and what does the Index measure?
The Index is a modified capitalization-weighted total return index of 30 selected common stocks of equity Real Estate Investment Trusts (“REITs”) (the “Underlying Stocks”) designed to represent the primary real estate property types and geographic regions. The Index was developed with a base value of 250.00 as of December 31, 1998.
The Index is constructed to screen out REITs with market capitalization below $500 million and that do not have average trading volume of at least 600,000 shares per month for the previous six months when rebalanced. Cohen & Steers Capital Management, Inc. (“Cohen & Steers”) then selects the REITs that best satisfy the Realty Majors Investment Criteria (as defined herein) for inclusion in the Index. Each Underlying Stock is weighted in the Index based on its market capitalization, with no one Underlying Stock being weighted above 8% of the total value of the Index. Standard & Poor’s, a division of The McGraw-Hill Companies, Inc. (“Standard & Poor’s” or “S&P”) calculates and maintains the Index in consultation with Cohen & Steers and quotes the Index intraday under the symbol “RMP.” For more information on the Index, please see the section entitled “The Index” in this pricing supplement
An investment in the Notes does not entitle you to any dividends, voting rights or any other ownership interest in the Underlying Stocks.
How has the Index performed historically?
We have included a graph showing the historical month-end closing levels of the Index from January 2002 through February 2007, in the section entitled “The Index—Historical Data on the Index” in this pricing supplement. We have provided this historical information to help you evaluate the behavior of the Index in various economic environments; however, past performance of the Index is not necessarily indicative of how the Index will perform in the future.
PS-3
What will I receive on the maturity date of the Notes?
On the maturity date, you will receive a cash payment per unit equal to the Redemption Amount.
The “Redemption Amount” per unit to which you will be entitled will depend on the direction of and percentage change in the level of the Index and will equal:
| (i) | If the Ending Value is equal to or less than the Starting Value: |
| $10 + |
[
|
$30 × |
(
|
Starting Value – Ending Value | )
|
]
|
; | |||||||||
| Starting Value |
| provided, however, the Redemption Amount will not exceed $13.42 per unit (the “Capped Value”). |
| (ii) | If the Ending Value is greater than the Starting Value you will receive: |
| $10 – |
[
|
$10 × |
(
|
Ending Value – Starting Value | )
|
]
|
; | |||||||||
| Starting Value |
| but the Redemption Amount will not be less than zero. |
The “Starting Value” equals 1,131.48, the closing level of the Index on March 29, 2007, the date the Notes were priced for initial sale to the public (the “Pricing Date”).
The “Ending Value” will equal the average of the closing levels of the Index for five business days shortly before the maturity date of the Notes, as more fully described in the section entitled “Description of the Notes—Payment of the Maturity—Determination of the Redemption Amount.” We may calculate the Ending Value by reference to fewer than five or even a single day’s closing level if, during the period shortly before the maturity date of the Notes, there is a disruption in the trading of a sufficient number of stocks included in the Index or certain futures or options contracts relating to the Index.
The opportunity to participate in the possible decreases in the level of the Index through an investment in the Notes is limited because the amount that you receive on the maturity date will never exceed the Capped Value, which will represent a return of 34.2% over the $10 original public offering price per unit of the Notes, depending on the Capped Value. However, in the event that the Ending Value is greater than the Starting Value, the amount you receive on the maturity date will be reduced proportionately by the amount of the percentage increase of the Index in excess of the Starting Value. As a result, you may receive less than the $10 original public offering price per unit.
For more specific information about the Redemption Amount, please see the section entitled “Description of the Notes” in this pricing supplement.
Will I receive interest payments on the Notes?
You will not receive any interest payments on the Notes, but you will instead receive the Redemption Amount per unit on the maturity date. We have designed the Notes for investors who are willing to forego interest payments on the Notes, such as fixed or floating interest rates paid on traditional interest bearing debt securities, and willing to accept a return that will not exceed the Capped Value and that may be less than the $10 original public offering price per unit, in exchange for the ability to participate in decrease, if any, in the level of the Index from the Starting Value to the Ending Value.
PS-4
Examples:
Set forth below are three examples of Redemption Amount calculations, including a Starting Value of 1,131.48, the closing level of the Index on March 29, 2007, and including a Capped Value of $13.42.
Example 1—The hypothetical Ending Value is 70% of the Starting Value:
Starting Value: 1,131.48
Hypothetical Ending Value: 792.04
| $10 + |
[
|
$30 × |
(
|
1,131.48 – 792.04 | )
|
]
|
= $19.00 | (Redemption Amount cannot be greater than the Capped Value) | ||||||||||
| 1,131.48 | ||||||||||||||||||
| Redemption Amount (per unit) = $13.42 |
||||||||||||||||||
Example 2—The hypothetical Ending Value is 90% of the Starting Value:
Starting Value: 1,131.48
Hypothetical Ending Value: 1,018.33
| $10 + |
[
|
$30 × |
(
|
1,131.48 – 1,018.33 | )
|
]
|
= $13.00 | |||||||||
| 1,131.48 | ||||||||||||||||
Redemption Amount (per unit) = $13.00
Example 3—The hypothetical Ending Value is 130% of the Starting Value:
Starting Value: 1,131.48
Hypothetical Ending Value: 1,470.92
| $10 – |
[
|
$10 × |
(
|
1,470.92 – 1,131.48 | )
|
]
|
= $7.00 | |||||||||
| 1,131.48 | ||||||||||||||||
Redemption Amount (per unit) = $7.00
What about taxes?
The United States federal income tax consequences of an investment in the Notes are complex and uncertain. By purchasing a Note, you and ML&Co. agree, in the absence of an administrative determination, judicial ruling or other authoritative guidance to the contrary, to characterize and treat a Note for all tax purposes as a pre-paid cash-settled forward contract linked to the level of the Index. Under this characterization and tax treatment of the Notes, you should be required to recognize gain or loss to the extent that you receive cash on the maturity date or upon a sale or exchange of a Note prior to the maturity date. You should review the discussion under the section entitled “United States Federal Income Taxation” in this pricing supplement.
Will the Notes be listed on a stock exchange?
The Notes will not be listed on any securities exchange and we do not expect a trading market for the Notes to develop, which may affect the price that you receive for your Notes upon any sale prior to the maturity date. You should review the section entitled “Risk Factors—There may be an uncertain trading market for the Notes and the market price you may receive or be quoted for your Notes on a date prior to the stated maturity date will be affected by this and other important factors including our costs of developing, hedging and distributing the Notes” in this pricing supplement.
What price can I expect to receive if I sell the Notes prior to the stated maturity date?
In determining the economic terms of the Notes, and consequently the potential return on the Notes to you, a number of factors are taken into
PS-5
account. Among these factors are certain costs associated with creating, hedging and offering the Notes. In structuring the economic terms of the Notes, we seek to provide investors with what we believe to be commercially reasonable terms and to provide MLPF&S with compensation for its services in developing the Notes.
If you sell your Notes prior to the stated maturity date, you will receive a price determined by market conditions for the Notes. This price may be influenced by many factors, such as interest rates, volatility and the prevailing level of the Index. In addition, the price, if any, at which you could sell your Notes in a secondary market transaction is expected to be affected by the factors that we considered in setting the economic terms of the Notes, namely the underwriting discount paid in respect of the Notes, and compensation for developing and hedging the product. Depending on the impact of these factors, you may receive significantly less than the $10 original public offering price per unit of your Notes if sold before the stated maturity date.
In a situation where there had been no movement in the level of the Index and no changes in the market conditions from those existing on the date of this pricing supplement, the price, if any, at which you could sell your Notes in a secondary market transaction is expected to be lower than the original issue price. This is due to, among other things, our costs of developing, hedging and distributing the Notes. Any potential purchasers of your Notes in the secondary market are unlikely to consider these factors.
What is the role of MLPF&S?
MLPF&S, our subsidiary, is the underwriter for the offering and sale of the Notes. After the initial offering, MLPF&S intends to buy and sell Notes to create a secondary market for holders of the Notes, and may stabilize or maintain the market price of the Notes during their initial distribution. However, MLPF&S will not be obligated to engage in any of these market activities or continue them once it has started.
MLPF&S will also be our agent for purposes of determining, among other things, the Starting Value and the Ending Value, and calculating the Redemption Amount (in such capacity, the “Calculation Agent”). Under certain circumstances, these duties could result in a conflict of interest between MLPF&S as our subsidiary and its responsibilities as Calculation Agent.
What is ML&Co.?
Merrill Lynch & Co., Inc. is a holding company with various subsidiaries and affiliated companies that provide investment, financing, insurance and related services on a global basis.
For information about ML&Co., see the section entitled “Merrill Lynch & Co., Inc.” in the accompanying general prospectus supplement. You should also read other documents ML&Co. has filed with the Securities and Exchange Commission, which you can find by referring to the sections entitled “Where You Can Find More Information” and “Incorporation of Information We File with the SEC” in the accompanying general prospectus supplement and prospectus.
PS-6
Your investment in the Notes will involve risks. You should carefully consider the following discussion of risks and the discussion of risks included in the accompanying MTN prospectus supplement before deciding whether an investment in the Notes is suitable for you.
Your investment may result in a loss
We will not repay you a fixed amount of principal on the Notes on the maturity date. The Redemption Amount will depend on the direction of and percentage change in the level of the Index from the Starting Value to the Ending Value of the Index. Because the level of the Index is subject to market fluctuations, the Redemption Amount you receive may be less than the $10 original public offering price per unit of the Notes. If the Ending Value is greater than the Starting Value, the Redemption Amount will be less than the $10 original public offering price per unit of the Notes. As a result, you may receive less, and possibly significantly less, than the $10 original public offering price per unit.
Your yield may be lower than the yield on other debt securities of comparable maturity
The yield that you will receive on your Notes, which could be negative, may be less than the return you could earn on other investments. Your yield may be less than the yield you would earn if you bought a traditional interest bearing debt security of ML&Co. with the same stated maturity date. Your investment may not reflect the full opportunity cost to you when you take into account factors that affect the time value of money. Unlike traditional interest bearing debt securities, the Notes do not guarantee the return of a principal amount on the maturity date.
You must rely on your own evaluation of the merits of an investment linked to the Index
In the ordinary course of their businesses, affiliates of ML&Co. from time to time express views on expected developments in the real estate industry and the Underlying Stocks, and these views are sometimes communicated to clients. However, these views may vary over differing time-horizons and are subject to change. Moreover, other professionals who deal in equity markets may at any time have significantly different views from those of our affiliates. For reasons such as these, we believe that investors in securities relating to the real estate industry should generally derive information concerning the real estate industry from multiple sources. In connection with your purchase of the Notes, you should investigate the real estate industry and the Underlying Stocks and not rely on views which may be expressed by our affiliates in the ordinary course of their businesses with respect to future movements in the real estate industry. In addition, since the Notes are designed for investors with a bearish view of the real estate industry, you should purchase the Notes only if you believe that the Index will, or is likely to, decline from the Starting Value to the Ending Value.
Your return on the Notes is limited and will not reflect the return on an investment in the stocks included the Index
The opportunity to participate in the possible decreases in the level of the Index through an investment in the Notes is limited because the Redemption Amount will never exceed the Capped Value, which will represent an appreciation of 34.2% over the $10 original public offering price per unit of the Notes. Even if the Ending Value of the Index is less than the Starting Value of the Index by more than the Capped Value, you will not receive more than the Capped Value per unit at maturity.
If the value of the stocks included in the Index increases such that the level of the Index is above the Starting Value, this will result in a decrease in the value of the Notes. If the value of the stocks included in the Index decreases, this will result in an increase in the value of the Notes, subject to the Capped Value of the Notes at maturity.
There may be an uncertain trading market for the Notes and the market price you may receive or be quoted for your Notes on a date prior to the stated maturity date will be affected by this and other important factors including our costs of developing, hedging and distributing the Notes
The Notes will not be listed on any futures or securities exchange and we do not expect a trading market for the Notes to develop. Although MLPF&S, our subsidiary, has indicated that it currently expects to bid for Notes offered for sale to it by holders of the Notes, it is not required to do so and may cease making those bids at
PS-7
any time. The limited trading market for your Notes may affect the price that you receive for your Notes if you do not wish to hold your investment until the maturity date.
If MLPF&S makes a market in the Notes, the price it quotes would reflect any changes in market conditions and other relevant factors. In addition, the price, if any, at which you could sell your Notes in a secondary market transaction is expected to be affected by the factors that we considered in setting the economic terms of the Notes, namely the underwriting discount paid in respect of the Notes and other costs associated with the Notes, and compensation for developing and hedging the product. This quoted price could be higher or lower than the original issue price. Furthermore, there is no assurance that MLPF&S or any other party will be willing to buy the Notes. MLPF&S is not obligated to make a market in the Notes.
Assuming there is no change in the levels of the Indices and no change in market conditions or any other relevant factors, the price, if any, at which MLPF&S or another purchaser might be willing to purchase your Notes in a secondary market transaction is expected to be lower than the original issue price. This is due to, among other things, the fact that the original issue price included, and secondary market prices are likely to exclude, underwriting discount paid with respect to, and the developing and hedging costs associated with, the Notes.
Because investments in REITs are subject to similar risks associated with investment in real estate, an investment in the Notes will be subject to risks associated with investing in real estate
The shares of common stock underlying the Index to which the Notes are linked are comprised of 30 selected common stocks of REITs. Because REITs invest primarily in income producing real estate or real estate related loans or interests, investments in REITs, though not direct investments in real estate, still are subject to the risks associated with investing in real estate. The following are some of the conditions that may impact the structure of and cash flow generated by REITs, the value of REITs and, consequently, the market value of the Notes:
| • | a decline in the value of real estate properties; |
| • | extended vacancies of properties; |
| • | increases in property and operating taxes; |
| • | increased competition or overbuilding; |
| • | a lack of available mortgage funds or other limits on accessing capital; |
| • | tenant bankruptcies and other credit problems; |
| • | limitation on rents, including decreases in market rates for rents; |
| • | changes in zoning laws and governmental regulations; and |
| • | costs resulting from the clean–up of, and legal liability to third parties for damages resulting from environmental problems. |
The Underlying Stocks are concentrated in one industry
All of the Underlying Stocks are issued by real estate investment trusts. As a result, because the Notes are linked to the Index, the performance of the Notes will be concentrated in the real estate industry.
Cohen & Steers Capital Management, Inc. or Standard & Poor’s may adjust the Index in a way that affects its level, and the Cohen & Steers Capital Management, Inc. has no obligation to consider your interests
Cohen & Steers Capital Management, Inc. (“Cohen & Steers”) and Standard & Poor’s, a division of The McGraw-Hill Companies, Inc. (“Standard & Poor’s” or “S&P”) are responsible for calculating and maintaining the Index. Cohen & Steers and Standard & Poor’s can add, delete or substitute the stocks underlying the Index or make other methodological changes that could change the level of the Index. You should realize that the changing of REITs included in the Index may affect the Index as a newly added REIT may perform significantly better or worse than the REIT or REITs it replaces. Additionally, Cohen & Steers and Standard & Poor’s may alter, discontinue or suspend calculation or dissemination of the Index. Any of these actions could adversely affect the value of the Notes. Cohen & Steers and Standard & Poor’s have no obligation to consider your interests in calculating or revising the Index. See “The Index.”
PS-8
Many factors affect the trading value of the Notes; these factors interrelate in complex ways and the effect of any one factor may offset or magnify the effect of another factor
The trading value of the Notes will be affected by factors that interrelate in complex ways. The effect of one factor may offset the increase in the trading value of the Notes caused by another factor and the effect of one factor may exacerbate the decrease in the trading value of the Notes caused by another factor. For example, an increase in United States interest rates may offset some or all of any increase in the trading value of the Notes attributable to another factor, such as a decrease in the level of the Index. The following paragraphs describe the expected impact on the trading value of the Notes given a change in a specific factor, assuming all other conditions remain constant.
The level of the Index is expected to affect the trading value of the Notes. We expect that the trading value of the Notes will depend substantially on the amount, if any, by which the level of the Index is below or is not below the Starting Value. However, if you choose to sell your Notes when the level of the Index is below the Starting Value, you may receive substantially less than the amount that would be payable on the maturity date based on this value because of the expectation that the level of the Index will continue to fluctuate until the Ending Value is determined. In addition, because the payment on the maturity date on the Notes will not exceed the Capped Value, we do not expect that the Notes will trade in the secondary market above the Capped Value.
Changes in the volatility of the Index are expected to affect the trading value of the Notes. Volatility is the term used to describe the size and frequency of price and/or market fluctuations. If the volatility of the Index increases or decreases, the trading value of the Notes may be adversely affected.
Changes in the levels of interest rates are expected to affect the trading value of the Notes. We expect that changes in interest rates will affect the trading value of the Notes. Generally, if United States interest rates increase, the value of outstanding debt securities tends to decline and, conversely, if United States interest rates decrease, the value of outstanding debt securities tends to increase. In addition, increases in United States interest rates may decrease the level of the Index, which would generally tend to increase the trading value of the Notes, and, conversely, decreases in United States interest rates may increase the level of the Index, which would generally tend to decrease the trading value of the Notes.
As the time remaining to the stated maturity date of the Notes decreases, the “time premium” associated with the Notes is expected to decrease. We anticipate that before their stated maturity date, the Notes may trade at a value above that which would be expected based on factors such as the level of interest rates and the level of the Index. This difference will reflect a “time premium” due to expectations concerning the level of the Index during the period before the stated maturity date of the Notes. However, as the time remaining to the stated maturity date of the Notes decreases, we expect that this time premium will decrease, lowering the trading value of the Notes.
Changes in our credit ratings may affect the trading value of the Notes. Our credit ratings are an assessment of our ability to pay our obligations. Consequently, real or anticipated changes in our credit ratings may affect the trading value of the Notes. However, because the return on your Notes is dependent upon factors in addition to our ability to pay our obligations under the Notes, such as the percentage decrease, if any, in the level of the Index from the Starting Value to the Ending Value, an improvement in our credit ratings will not reduce the other investment risks related to the Notes.
In general, assuming all relevant factors are held constant, we expect that the effect on the trading value of the Notes of a given change in some of the factors listed above will be less if it occurs later in the term of the Notes than if it occurs earlier in the term of the Notes. We expect, however, that the effect on the trading value of the Notes of a given change in the level of the Index will be greater if it occurs later in the term of the Notes than if it occurs earlier in the term of the Notes.
Purchases and sales by us and our affiliates may affect your return
We and our affiliates may from time to time buy or sell Underlying Stocks or futures or options contracts on the Index for our own accounts for business reasons and expect to enter into these transactions in connection with hedging our obligations under the Notes. These transactions could affect the price of these stocks and, in turn, the level of the Index in a manner that could be adverse to your investment in the Notes. Any purchases or sales by us, our affiliates or others on our behalf on or before the Pricing Date may temporarily increase or decrease the prices of the stocks included in the Index. Temporary increases or decreases in the market prices of these stocks may also
PS-9
occur as a result of the purchasing activities of other market participants. Consequently, the prices of these stocks may change subsequent to the Pricing Date, affecting the level of the Index and therefore the trading value of the Notes.
Potential conflicts of interest could arise
MLPF&S, our subsidiary, is our agent for the purposes of determining the Starting Value and the Ending Value, and calculating the Redemption Amount. Under certain circumstances, MLPF&S as our subsidiary and in its responsibilities as Calculation Agent for the Notes could give rise to conflicts of interest. These conflicts could occur, for instance, in connection with its determination as to whether the level of the Index can be calculated on a particular trading day, or in connection with judgments that it would be required to make in the event of a discontinuance or unavailability of the Index. See the sections entitled “Description of the Notes—Payment at Maturity,” “—Adjustments to the Index” and “—Discontinuance of the Index” in this pricing supplement. MLPF&S is required to carry out its duties as Calculation Agent in good faith and using its reasonable judgment. However, because we control MLPF&S, potential conflicts of interest could arise.
We expect to enter into arrangements to hedge the market risks associated with our obligation to pay the Redemption Amount due on the maturity date on the Notes. We may seek competitive terms in entering into the hedging arrangements for the Notes, but are not required to do so, and we may enter into such hedging arrangements with one of our subsidiaries or affiliated companies. Such hedging activity is expected to result in a profit to those engaging in the hedging activity, which could be more or less than initially expected, but which could also result in a loss for the hedging counterparty.
ML&Co. or its affiliates may presently or from time to time engage in business with one or more of the REITs included in the Index including extending loans to, or making equity investments in, those REITs or providing advisory services to those REITs, including merger and acquisition advisory services. In the course of business, ML&Co. or its affiliates may acquire non-public information relating to those REITs and, in addition, one or more affiliates of ML&Co. may publish research reports about those REITs. ML&Co. does not make any representation to any purchasers of the Notes regarding any matters whatsoever relating to the REITs included in the Index. Any prospective purchaser of the Notes should undertake an independent investigation of the REITs included in the Index as in its judgment is appropriate to make an informed decision regarding an investment in the Notes. The composition of those REITs does not reflect any investment recommendations of ML&Co. or its affiliates.
Tax consequences are uncertain
You should consider the tax consequences of investing in the Notes, aspects of which are uncertain. See the section entitled “United States Federal Income Taxation” in this pricing supplement.
PS-10
ML&Co. will issue the Notes as part of a series of senior unsecured debt securities entitled “Medium-Term Notes, Series C,” which is more fully described in the MTN prospectus supplement, under the 1983 Indenture, which is more fully described in the accompanying general prospectus supplement. The Bank of New York has succeeded JPMorgan Chase Bank, N.A. as the trustee under such indenture. The Notes will mature on June 5, 2008. Information included in this pricing supplement supersedes information in the accompanying MTN prospectus supplement, general prospectus supplement and prospectus to the extent that it is different from that information. The CUSIP number for the Notes is 59022C145.
The Notes will not be subject to redemption by ML&Co. or repayment at the option of any holder of the Notes before the maturity date.
ML&Co. will issue the Notes in denominations of whole units each with a $10 original public offering price per unit. You may transfer the Notes only in whole units. You will not have the right to receive physical certificates evidencing your ownership except under limited circumstances. Instead, we will issue the Notes in the form of a global certificate, which will be held by The Depository Trust Company, also known as DTC, or its nominee. Direct and indirect participants in DTC will record your ownership of the Notes. You should refer to the section entitled “Description of Debt Securities—Depositary” in the accompanying general prospectus supplement.
The Notes will not have the benefit of any sinking fund and there is no principal protection on the Notes.
Payment on the Maturity Date
On the maturity date, you will be entitled to receive a cash payment per unit equal to the Redemption Amount per unit, as provided below. There will be no other payment of interest, periodic or otherwise, on the Notes prior to the maturity date.
Determination of the Redemption Amount
The “Redemption Amount” per unit will be determined by the Calculation Agent and will equal:
| (i) | If the Ending Value is equal to or less than the Starting Value: |
| $10 + |
[
|
$30 × |
(
|
Starting Value – Ending Value | ) | ]
|
; | |||||||||||
| Starting Value |
provided, however, the Redemption Amount per unit will not exceed $13.42 (the “Capped Value”).
| (ii) | If the Ending Value is greater than the Starting Value: |
| $10 – |
[
|
$10 × |
(
|
Ending Value – Starting Value | ) | ] | ; | |||||||||||
| Starting Value |
but the Redemption Amount will not be less than zero.
The “Starting Value” equals 1,131.48, the closing level of the Cohen & Steers Realty Majors Portfolio Index (the “Index”) on March 29, 2007, the date the Notes were priced for initial sale to the public (the “Pricing Date”).
The “Ending Value” will be determined by the Calculation Agent and will equal the average of the closing levels of the Index determined on the first five Calculation Days during the Calculation Period. If there are fewer than five Calculation Days during the Calculation Period, then the Ending Value will equal the average of the closing levels of the Index on those Calculation Days. If there is only one Calculation Day during the Calculation Period, then the Ending Value will equal the closing level of the Index on that Calculation Day. If no Calculation Days occur during the Calculation Period, then the Ending Value will equal the closing level of the Index determined (or, if not determinable, estimated by the Calculation Agent in a manner which it considers commercially reasonable under the circumstances) on the last scheduled Index Business Day in the Calculation Period, regardless of the occurrence of a Market Disruption Event (as described below) on that scheduled Index Business Day.
PS-11
The “Calculation Period” means the period from and including the seventh scheduled Index Business Day before the maturity date to and including the second scheduled Index Business Day before the maturity date.
A “Calculation Day” means any Index Business Day during the Calculation Period on which a Market Disruption Event has not occurred.
An “Index Business Day” means a day on which the New York Stock Exchange (the “NYSE”), the American Stock Exchange (the “AMEX”) and The Nasdaq Stock Market (the “Nasdaq”) are open for trading and the Index or any successor index is calculated and published.
“Market Disruption Event” means either of the following events as determined by the Calculation Agent:
| (A) | the suspension of or material limitation on trading, in each case, for more than two hours of trading, or during the one-half hour period preceding the close of trading, on the primary exchange on which the stock included in the Index or any successor index trade as determined by the Calculation Agent (without taking into account any extended or after-hours trading session), in 20% or more of the stocks which then comprise the Index or any successor index; or |
| (B) | the suspension of or material limitation on trading, in each case, for more than two hours of trading, or during the one-half hour period preceding the close of trading, on the primary exchange that trade options contracts or futures contracts related to the stocks included in the Index as determined by the Calculation Agent (without taking into account any extended or after-hours trading session), whether by reason of movements in price otherwise exceeding levels permitted by the relevant exchange or otherwise, in option contracts or futures contracts related to the Index, or any successor index. |
For the purpose of determining whether a Market Disruption Event has occurred:
| (1) | a limitation on the hours in a trading day and/or number of days of trading will not constitute a Market Disruption Event if it results from an announced change in the regular business hours of the relevant exchange; |
| (2) | a decision to permanently discontinue trading in the relevant futures or options contracts related to the Index, or any successor index, will not constitute a Market Disruption Event; |
| (3) | a suspension in trading in a futures or options contract on the Index, or any successor index, by a major securities market by reason of (a) a price change violating limits set by that securities market, (b) an imbalance of orders relating to those contracts or (c) a disparity in bid and ask quotes relating to those contracts will constitute a suspension of or material limitation on trading in futures or options contracts related to the Index; |
| (4) | a suspension of or material limitation on trading on the relevant exchange will not include any time when that exchange is closed for trading under ordinary circumstances; and |
| (5) | for the purpose of clause (A) above, any limitations on trading during significant market fluctuations under NYSE Rule 80B, or any applicable rule or regulation enacted or promulgated by the NYSE or any other self regulatory organization or the Securities and Exchange Commission of similar scope as determined by the calculation agent, will be considered “material”. |
All determinations made by the Calculation Agent, absent a determination of a manifest error, will be conclusive for all purposes and binding on ML&Co. and the holders and beneficial owners of the Notes.
PS-12
Hypothetical Returns
The following table illustrates, for the Starting Value of 1,131.48, the closing value of the Index on March 29, 2007, and a range of hypothetical Ending Values of the Index:
| • | the percentage change from the Starting Value to the hypothetical Ending Value; |
| • | the total amount payable on the maturity date per unit; |
| • | the total rate of return to holders of the Notes; and |
| • | the pretax annualized rate of return to holders of the Notes. |
The table below includes a Capped Value of $13.42.
| Hypothetical Ending Value |
Percentage change to the hypothetical Ending Value |
Total amount payable on the maturity date per unit |
Total rate of return on the Notes |
Pretax annualized rate of return on the Notes(1) |
Pretax annualized rate of return of the
stocks | |||||
| 565.74 | –50.00% | $13.42 | 34.20% | 26.79% | –46.91% | |||||
| 678.89 | –40.00% | $13.42 | 34.20% | 26.79% | –35.15% | |||||
| 792.04 | –30.00% | $13.42 | 34.20% | 26.79% | –24.41% | |||||
| 905.18 | –20.00% | $13.42 (4) | 34.20% | 26.79% | –14.49% | |||||
| 1,018.33 | –10.00% | $13.00 | 30.00% | 23.73% | –5.24% | |||||
| 1,046.62 | –7.50% | $12.25 | 22.50% | 18.12% | –3.01% | |||||
| 1,074.91 | –5.00% | $11.50 | 15.00% | 12.31% | –0.82% | |||||
| 1,103.19 | –2.50% | $10.75 | 7.50% | 6.28% | 1.33% | |||||
| 1,131.48 (3) | 0.00% | $10.00 | 0.00% | 0.00% | 3.46% | |||||
| 1,188.05 | 5.00% | $9.50 | –5.00% | –4.34% | 7.63% | |||||
| 1,244.63 | 10.00% | $9.00 | –10.00% | –8.81% | 11.69% | |||||
| 1,357.78 | 20.00% | $8.00 | –20.00% | –18.19% | 19.51% | |||||
| 1,470.92 | 30.00% | $7.00 | –30.00% | –28.28% | 26.98% | |||||
| 1,584.07 | 40.00% | $6.00 | –40.00% | –39.23% | 34.13% | |||||
| 1,697.22 | 50.00% | $5.00 | –50.00% | –51.28% | 40.99% | |||||
| 1,810.37 | 60.00% | $4.00 | –60.00% | –64.81% | 47.61% | |||||
| 1,923.52 | 70.00% | $3.00 | –70.00% | –80.45% | 54.00% |
| (1) | The annualized rates of return specified in this column are calculated on a semiannual bond equivalent basis and assume an investment term from April 5, 2007 to June 5, 2008, a term equal to that of the Notes. |
| (2) | This rate of return assumes: |
| (a) | a percentage change in the aggregate price of the underlying stocks that equals the percentage change in the Index from the Starting Value to the relevant hypothetical Ending Value; |
| (b) | a constant dividend yield of 0.00% per annum; and |
| (c) | no transaction fees or expenses. |
| (3) | This is the Starting Value. |
| (4) | The total amount payable on the maturity date per unit of the Notes cannot exceed the Capped Value. |
The 0.00% dividend yield assumed for the Index indicates that dividends are reinvested into the Index and therefore are reflected in the Index’s performance.
The above figures are for purposes of illustration only. The actual amount received by you and the resulting total and pretax annualized rates of return will depend on the actual Ending Value and term of your investment.
PS-13
Adjustments to the Index
If at any time Cohen & Steers or Standard & Poor’s makes a material change in the formula for or the method of calculating the Index or in any other way materially modifies the Index so that the Index does not, in the opinion of the Calculation Agent, fairly represent the level of the Index had those changes or modifications not been made, then, from and after that time, the Calculation Agent will, at the close of business in New York, New York, on each date that the closing level of the Index is to be calculated, make any adjustments as, in the good faith judgment of the Calculation Agent, may be necessary in order to arrive at a calculation of a level of a stock index comparable to the Index as if those changes or modifications had not been made, and calculate the closing level with reference to the Index, as so adjusted. For example, if the method of calculating the Index is modified so that the level of the Index is a fraction or a multiple of what it would have been if it had not been modified, then the Calculation Agent will adjust the Index in order to arrive at a level of the Index as if it had not been modified.
Discontinuance of the Index
If Cohen & Steers or Standard & Poor’s discontinue publication of the Index and Cohen & Steers, Standard & Poor’s or another entity publishes a successor or substitute index that the Calculation Agent determines, in its sole discretion, to be comparable to the Index (a “successor index”), then, upon the Calculation Agent’s notification of that determination to the trustee and ML&Co., the Calculation Agent will substitute the successor index as calculated by Cohen & Steers, Standard & Poor’s or any other entity for the Index and calculate the Ending Value as described above under “—Payment on the Maturity Date”. Upon any selection by the Calculation Agent of a successor index, ML&Co. will cause notice to be given to holders of the Notes.
In the event that Cohen & Steers or Standard & Poor’s discontinues publication of the Index and:
| • | the Calculation Agent does not select a successor index; or |
| • | the successor index is not published on any of the Calculation Days, |
the Calculation Agent will compute a substitute level for the Index in accordance with the procedures last used to calculate the Index before any discontinuance. If a successor index is selected or the Calculation Agent calculates a level as a substitute for the Index as described below, the successor index or level will be used as a substitute for the Index for all purposes, including the purpose of determining whether a Market Disruption Event exists.
If Cohen & Steers or Standard & Poor’s discontinues publication of the Index before the Calculation Period and the Calculation Agent determines that no successor index is available at that time, then on each Business Day until the earlier to occur of:
| • | the determination of the Ending Value; and |
| • | a determination by the Calculation Agent that a successor index is available, |
the Calculation Agent will determine the value that would be used in computing the Redemption Amount as described in the preceding paragraph as if that day were a Calculation Day. The Calculation Agent will cause notice of each value to be published not less often than once each month in The Wall Street Journal or another newspaper of general circulation and arrange for information with respect to these values to be made available by telephone.
A “Business Day” is any day on which the NYSE, the AMEX and the Nasdaq are open for trading.
Notwithstanding these alternative arrangements, discontinuance of the publication of the Index may adversely affect trading in the Notes.
Events of Default and Acceleration
In case an Event of Default with respect to any Notes has occurred and is continuing, the amount payable to a holder of a Note upon any acceleration permitted by the Notes, with respect to each $10 original public offering price per unit, will be equal to the Redemption Amount per unit, calculated as though the date of acceleration were the stated maturity date of the Notes.
In case of default in payment of the Notes, whether on the stated maturity date or upon acceleration, from and after that date the Notes will bear interest, payable upon demand of their holders, at the then current Federal
PS-14
Funds Rate, reset daily, as determined by reference to Reuters page FEDFUNDS1 under the heading “EFFECT”, to the extent that payment of such interest shall be legally enforceable, on the unpaid amount due and payable on that date in accordance with the terms of the Notes to the date payment of that amount has been made or duly provided for. “Reuters page FEDFUNDS1” means such page or any successor page, or page on a successor service, displaying such rate. If the Federal Funds Rate cannot be determined by reference to Reuters page FEDFUNDS1, such rate will be determined in accordance with the procedures set forth in the accompanying MTN prospectus supplement relating to the determination of the Federal Funds Rate in the event of the unavailability of Moneyline Telerate page 120.
PS-15
All disclosure contained in this pricing supplement regarding the Index, including, without limitation, its make-up, method of calculation and changes in its components has been derived from publicly available information prepared by Cohen & Steers. ML&Co. and MLPF&S have not independently verified the accuracy or completeness of that information.
The Index is a modified capitalization weighted total return index of the common stocks of 30 selected REITs designed to represent the primary real estate property types and geographic regions. The Index was developed with a base value of 250.00 as of December 31, 1998. The Index was constructed by Cohen & Steers with the fundamental objective that each REIT satisfy the “Realty Majors Investment Criteria.” The Realty Majors Investment Criteria developed by Cohen & Steers attempts to select REITs that have (1) a dominant position within primary property sectors, (2) strong management, (3) sound capital structure and (4) $500 million minimum market capitalization.
The Index was constructed to screen out REITs with market capitalization below $500 million and that did not have average trading volume of at least 600,000 shares per month for the previous six months. Each Underlying Stock was then weighted based on its market capitalization, with no one Underlying Stock being weighed above 8% of the value of the Index. The shares outstanding for all the other stocks below 8% were then increased proportionately until the sum of the weightings was 100%.
The Index aims to offer exposure to the property sectors that Cohen & Steers considers to be representative of the income-producing real estate asset class. As of March 29, 2007, the sector weightings of the Index were as follows:
| Property Sector |
Percentage Weightings | |
| Office |
18.68% | |
| Regional Mall |
18.18% | |
| Apartment |
21.18% | |
| Shopping Center |
13.35% | |
| Industrial |
8.55% | |
| Self Storage |
6.55% | |
| Office/Industrial |
4.12% | |
| Hotel |
5.59% | |
| Health Care |
3.79% |
PS-16
We have included a brief description of each of the REITs whose stocks are included in the Index and their corresponding historical stock price information in Annex A to this pricing supplement. The weightings, market capitalization and average daily trading volume of each REIT as of March 29, 2007, as reported by Cohen & Steers is displayed in the table below.
| Company |
Index Weighting |
Market Capitalization (in millions of dollars) |
Average Daily Trading Volume (in thousands of shares) | |||
| Simon Property Group, Inc. |
8.00% | $24,931 | 1,480,969 | |||
| Public Storage, Inc. |
6.55% | $16,567 | 1,109,733 | |||
| Vornado Realty Trust |
6.82% | $18,078 | 1,434,262 | |||
| Boston Properties, Inc. |
6.65% | $14,070 | 1,066,840 | |||
| ProLogis |
6.44% | $16,730 | 2,443,996 | |||
| General Growth Properties, Inc. |
6.32% | $15,823 | 1,675,823 | |||
| Equity Residential |
5.70% | $14,248 | 2,352,776 | |||
| Host Hotels & Resorts, Inc. |
5.59% | $14,011 | 8,964,738 | |||
| Archstone-Smith Trust |
4.71% | $11,975 | 1,710,747 | |||
| Kimco Realty Corp. |
4.50% | $12,267 | 1,414,994 | |||
| Avalonbay Communities, Inc. |
3.90% | $10,285 | 910,090 | |||
| Developers Diversified Realty Corp. |
2.83% | $8,013 | 2,453,148 | |||
| Macerich Company |
2.68% | $6,691 | 927,040 | |||
| SL Green Realty Corp. |
2.43% | $8,229 | 732,380 | |||
| Duke Realty Corp. |
2.37% | $5,957 | 683,995 | |||
| Regency Centers Corp. |
2.33% | $5,823 | 429,400 | |||
| Apartment Investment and Management Company |
2.26% | $5,650 | 1,272,580 | |||
| Health Care Property Investors, Inc. |
2.01% | $7,466 | 1,087,800 | |||
| AMB Property Corp. |
2.10% | $5,860 | 777,315 | |||
| Federal Realty Investment Trust |
1.97% | $5,083 | 284,780 | |||
| Ventas, Inc. |
1.78% | $4,515 | 716,046 | |||
| Liberty Property Trust |
1.75% | $4,480 | 655,830 | |||
| Camden Property Trust |
1.74% | $4,015 | 564,250 | |||
| Weingarten Realty Investors |
1.74% | $4,148 | 800,866 | |||
| United Dominion Realty Trust, Inc. |
1.66% | $4,159 | 1,406,290 | |||
| Mack-Cali Realty Corp. |
1.19% | $3,203 | 478,715 | |||
| Essex Property Trust, Inc. |
1.21% | $3,148 | 330,880 | |||
| CBL & Associates Properties, Inc. |
1.18% | $2,958 | 508,605 | |||
| Alexandria Real Estate Equities, Inc. |
0.91% | $2,960 | 414,960 | |||
| Cousins Properties Incorporated |
0.67% | $1,699 | 385,625 |
Using the weightings determined in the initial index construction, the index divisor was calculated to yield an initial index value of 250.00 at the close of trading on December 31, 1998. Quarterly thereafter, the Index is rebalanced to compensate for changes in shares outstanding and to enforce the maximum 8% weight limit. The shares outstanding for each component stock in the Index remains fixed between quarterly rebalancings except in the event of certain corporate actions. These include payments of dividends other than ordinary cash, stock distributions, stock splits, reverse stock splits, rights offerings, distributions, reorganizations, recapitalizations, or similar events with respect to the component stocks. Weightings are not adjusted for share issuance or repurchases, unless they change the total shares outstanding by more then 5%. In case of merger of spin-off, the stock’s weighting is adjusted if the change in shares outstanding is more than 5%. In the case of a spin-off, the new company is not automatically included in the Index. Whenever the shares outstanding are adjusted for any security, its new weighting is subject to the maximum 8% limit.
Calculation of the Index is designed to reinvest dividends immediately. This is done by taking the closing price on the day before the security trades ex-dividend and adjusting it by the amount of the dividend. The index
PS-17
divisor is then adjusted to maintain index price continuity. This results in the reinvestment of the dividend on the ex-dividend date and a total return value for the Index.
The Index is calculated and maintained by Standard & Poor’s in consultation with Cohen & Steers. Standard & Poor’s quotes the Index intraday under the symbol “RMP.” Cohen & Steers may suggest changes in the industry categories represented in the Index or changes in the number of component stocks in an industry category to properly reflect the changing conditions of the real estate securities market. In addition, Cohen & Steers may advise Standard & Poor’s on treatment of unusual corporate actions. Routine corporate actions such as stock splits or stock dividends that require mechanical index divisor adjustments are expected to be handled by Standard & Poor’s staff without consultation.
When possible, all stock replacements and unusual divisor adjustments caused by the occurrence of extraordinary events such as dissolution, merger, bankruptcy, nonroutine spin-offs, or extraordinary dividends are made by Standard & Poor’s in consultation with Cohen & Steers. In cases where a replacement is needed, stocks are selected from a replacement list provided to Standard & Poor’s each quarter by Cohen & Steers. Actual selections from this list are made by Standard & Poor’s. As soon as Standard & Poor’s receives the replacement list, and before a selection is made, the list will be made available to Standard & Poor’s list of interested parties. In selecting replacement stocks, the minimum market capitalization and trading volume requirements must be met. The weighting of the new security will then be set according to its market capitalization subject to the maximum 8% limit.
Index Maintenance
Constituent weightings are rebalanced quarterly to compensate for changes in shares outstanding and to adhere to the maximum 8% weighting limit. This is performed as of the close of trading on the third Friday of February, May, August, and November. The same modified capitalization weighting method described earlier is used to calculate the weightings of each component stock. The market capitalizations are calculated using current shares outstanding figures and the primary market prices from the first Friday of the same month. A two week lag is provided so that any interested parties have sufficient time to receive the new weightings before they take effect.
Initially, each constituent in the Index must have a market capitalization of at least $500 million and average trading volume of at least 600,000 shares per month for the previous six months to qualify. On a quarterly basis, any security that has fallen below a market capitalization of $400 million or has average trading volume less than 500,000 shares per month for the previous six months will be removed from the Index. The quarterly review criteria are less stringent than the initial criteria in order to provide a buffer, thereby avoiding unnecessary turnover resulting from a security that may have temporarily moved below the minimum requirements.
PS-18
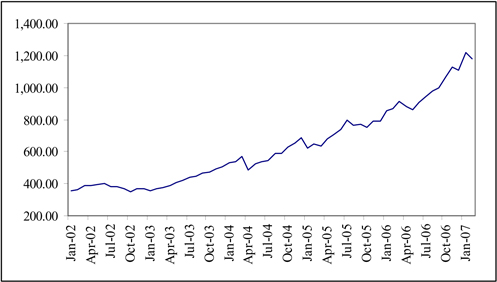
Historical Data on the Index
The following table sets forth the closing levels of the Index at the end of each month in the period from January 2002 through February 2007. This historical data on the Index is not necessarily indicative of the future performance of the Index or what the value of the Notes may be. Any historical upward or downward trend in the level of the Index during any period set forth below is not an indication that the Index is more or less likely to increase or decrease at any time during the term of the Notes.
| 2002 | 2003 | 2004 | 2005 | 2006 | 2007 | |||||||
| January |
354.98 | 357.42 | 529.08 | 624.41 | 853.60 | 1,217.94 | ||||||
| February |
362.51 | 367.35 | 539.24 | 645.70 | 869.31 | 1,182.64 | ||||||
| March |
384.98 | 373.77 | 572.60 | 637.23 | 916.55 | |||||||
| April |
385.17 | 388.12 | 487.30 | 681.38 | 882.68 | |||||||
| May |
393.01 | 409.43 | 525.33 | 704.50 | 859.87 | |||||||
| June |
403.30 | 418.41 | 539.60 | 735.49 | 904.82 | |||||||
| July |
383.88 | 443.11 | 545.83 | 797.36 | 944.36 | |||||||
| August |
384.14 | 448.37 | 591.91 | 765.94 | 976.85 | |||||||
| September |
367.84 | 464.45 | 589.88 | 768.41 | 999.75 | |||||||
| October |
349.17 | 471.38 | 626.88 | 751.58 | 1,066.98 | |||||||
| November |
366.23 | 491.17 | 653.90 | 788.80 | 1,129.13 | |||||||
| December |
368.22 | 506.12 | 688.13 | 792.09 | 1,107.81 |
The following graph sets forth the historical performance of the Index presented in the preceding table. Past movements of the Index are not necessarily indicative of the future performance of the Index.
PS-19
License Agreement
Cohen & Steers and ML&Co. have entered into a non-exclusive license agreement providing for the license to ML&Co., in exchange for a fee, of a right to use indices owned and published by Cohen & Steers in connection with the Notes.
Cohen & Steers is under no obligation to continue the calculation and dissemination of the Index. The Notes are not sponsored, endorsed, sold or promoted by Cohen & Steers. No inference should be drawn from the information contained in this pricing supplement that Cohen & Steers makes any representation or warranty, implied or express, to ML&Co., the holder of the Notes or any member of the public regarding the advisability of investing in securities generally or in the Notes in particular or the ability of the Notes to track general stock market performance. Cohen & Steers has no obligation to take the needs of ML&Co. or the holders of the Notes into consideration in determining, composing or calculating the Index. Cohen & Steers is not responsible for, and has not participated in the determination of the timing of, prices for, or quantities of, the Notes to be issued or in the determination or calculation of the equation by which the Notes are to be settled in cash. Cohen & Steers has no obligation or liability in connection with the administration or marketing of the Notes.
PS-20
UNITED STATES FEDERAL INCOME TAXATION
Set forth in full below is the opinion of Sidley Austin LLP, counsel to ML&Co. (“Tax Counsel”). As the law applicable to the United States federal income taxation of instruments such as the Notes is technical and complex, the discussion below necessarily represents only a general summary. The following discussion is based upon laws, regulations, rulings and decisions now in effect, all of which are subject to change (including changes in effective dates) or possible differing interpretations. The discussion below supplements the discussion set forth under the section entitled “United States Federal Income Taxation” that is contained in the accompanying MTN prospectus supplement and supersedes that discussion to the extent that it contains information that is inconsistent with that contained in the accompanying MTN prospectus supplement. The discussion below deals only with Notes held as capital assets and does not purport to deal with persons in special tax situations, such as financial institutions, insurance companies, regulated investment companies, real estate investment trusts, tax-exempt entities or persons holding Notes in a tax-deferred or tax-advantaged account (except to the extent specifically discussed below), dealers in securities or currencies, traders in securities that elect to mark to market, persons subject to the alternative minimum tax, persons holding Notes as a hedge against currency risks, as a position in a “straddle” or as part of a “hedging”, “conversion” or “integrated” transaction for tax purposes, or persons whose functional currency is not the United States dollar. It also does not deal with holders other than original purchasers. If a partnership holds the Notes, the tax treatment of a partner in the partnership will generally depend upon the status of the partner and the activities of the partnership. Thus, persons who are partners in a partnership holding the Notes should consult their own tax advisors. Moreover, all persons considering the purchase of the Notes should consult their own tax advisors concerning the application of United States federal income tax laws to their particular situations as well as any consequences of the purchase, ownership and disposition of the Notes arising under the laws of any other taxing jurisdiction.
As used herein, the term “U.S. Holder” means a beneficial owner of a Note that is for United States federal income tax purposes (i) a citizen or resident of the United States, (ii) a corporation or a partnership (including an entity treated as a corporation or a partnership for United States federal income tax purposes) that is created or organized in or under the laws of the United States, any state thereof or the District of Columbia (unless, in the case of a partnership, Treasury regulations are adopted that provide otherwise), (iii) an estate the income of which is subject to United States federal income tax regardless of its source, (iv) a trust if a court within the United States is able to exercise primary supervision over the administration of the trust and one or more United States persons have the authority to control all substantial decisions of the trust or (v) any other person whose income or gain in respect of a Note is effectively connected with the conduct of a United States trade or business. Certain trusts not described in clause (iv) above in existence on August 20, 1996, that elect to be treated as United States persons will also be U.S. Holders for purposes of the following discussion. As used herein, the term “non-U.S. Holder” means a beneficial owner of a Note that is not a U.S. Holder.
General
There are no statutory provisions, regulations, published rulings or judicial decisions addressing or involving the characterization and treatment, for United States federal income tax purposes, of the Notes or securities with terms substantially the same as the Notes. Accordingly, the proper United States federal income tax characterization and treatment of the Notes is uncertain. Pursuant to the terms of the Notes, ML&Co. and every holder of a Note agree (in the absence of an administrative determination, judicial ruling or other authoritative guidance to the contrary) to characterize and treat a Note for all tax purposes as a pre-paid cash-settled forward contract linked to the level of the Index. In the opinion of Tax Counsel, this characterization and tax treatment of the Notes, although not the only reasonable characterization and tax treatment, is based on reasonable interpretations of law currently in effect and, even if successfully challenged by the Internal Revenue Service (the “IRS”), will not result in the imposition of penalties. The characterization and tax treatment of the Notes described above is not, however, binding on the IRS or the courts. No statutory, judicial or administrative authority directly addresses the characterization and treatment of the Notes or instruments similar to the Notes for United States federal income tax purposes, and no ruling is being requested from the IRS with respect to the Notes.
Due to the absence of authorities that directly address instruments that are similar to the Notes, significant aspects of the United States federal income tax consequences of an investment in the Notes are not certain, and no assurance can be given that the IRS or the courts will agree with the characterization and tax treatment described above. Accordingly, prospective purchasers are urged to consult their own tax advisors regarding the United States federal income tax consequences of an investment in the Notes (including alternative characterizations and tax treatments of the Notes) and with respect to any tax consequences arising under the laws of any state, local or
PS-21
foreign taxing jurisdiction. Unless otherwise stated, the following discussion is based on the assumption that the characterization and treatment described above is accepted for United States federal income tax purposes.
Tax Treatment of the Notes
Assuming the characterization and tax treatment of the Notes as set forth above, Tax Counsel believes that the following United States federal income tax consequences should result.
Tax Basis. A U.S. Holder’s tax basis in a Note will equal the amount paid by the U.S. Holder to acquire the Note.
Payment on the Maturity Date. Upon the receipt of cash on the maturity date of the Notes, a U.S. Holder will recognize gain or loss. The amount of that gain or loss will be the extent to which the amount of the cash received differs from the U.S. Holder’s tax basis in the Note. It is uncertain whether any such gain or loss would be treated as ordinary income or loss or capital gain or loss. Absent a future clarification in current law (by an administrative determination, judicial ruling or otherwise), where required, ML&Co. intends to report any such gain or loss to the IRS in a manner consistent with the treatment of that gain or loss as capital gain or loss. If any gain or loss is treated as capital gain or loss, then that gain or loss will generally be short-term or long-term capital gain or loss, depending upon the U.S. Holder’s holding period as of the maturity date. The deductibility of capital losses is subject to certain limitations.
Sale or Exchange of the Notes. Upon a sale or exchange of a Note prior to the maturity date of the Notes, a U.S. Holder will generally recognize capital gain or loss in an amount equal to the difference between the amount realized on the sale or exchange and the U.S. Holder’s tax basis in the Note so sold or exchanged. Any such capital gain or loss will generally be short-term or long-term capital gain or loss, depending upon the U.S. Holder’s holding period as of the date of such sale or exchange. As discussed above, the deductibility of capital losses is subject to certain limitations.
Possible Alternative Tax Treatments of an Investment in the Notes
Due to the absence of authorities that directly address the proper characterization and tax treatment of the Notes, no assurance can be given that the IRS will accept, or that a court will uphold, the characterization and tax treatment of the Notes described above. In particular, the IRS could seek to analyze the United States federal income tax consequences of owning the Notes under Treasury regulations governing contingent payment debt instruments (the “CPDI Regulations”).
If the IRS were successful in asserting that the CPDI Regulations applied to the Notes, the timing and character of income thereon would be significantly affected. Among other things, a U.S. Holder would be required to accrue original issue discount on the Notes every year at a “comparable yield” for us, determined at the time of issuance of the Notes. Furthermore, any gain realized on the maturity date or upon a sale or other disposition of the Notes would generally be treated as ordinary income, and any loss realized on the maturity date or upon a sale or other disposition of the Notes would be treated as ordinary loss to the extent of the U.S. Holder’s prior accruals of original issue discount and capital loss thereafter.
Even if the CPDI Regulations do not apply to the Notes, other alternative United States federal income tax characterizations or treatments of the Notes may also be possible, and if applied could also affect the timing and the character of the income or loss with respect to the Notes. Accordingly, prospective purchasers are urged to consult their tax advisors regarding the United States federal income tax consequences of an investment in the Notes.
Unrelated Business Taxable Income
Section 511 of the Internal Revenue Code of 1986, as amended (the “Code”) generally imposes a tax, at regular corporate or trust income tax rates, on the “unrelated business taxable income” of certain tax-exempt organizations, including qualified pension and profit sharing plan trusts and individual retirement accounts. As discussed above, the United States federal income tax characterization and treatment of the Notes is uncertain. Nevertheless, in general, if the Notes are held for investment purposes, the amount of income or gain, if any, realized on the maturity date or upon a sale or exchange of a Note prior to the maturity date, or any income that would accrue to a holder of a Note if the Notes were characterized as contingent payment debt instruments (as discussed above), will not constitute unrelated business taxable income. However, if a Note constitutes debt-
PS-22
financed property (as defined in Section 514(b) of the Code) by reason of indebtedness incurred by a holder of a Note to purchase the Note, all or a portion of any income or gain realized with respect to such Note may be classified as unrelated business taxable income pursuant to Section 514 of the Code. Moreover, prospective investors in the Notes should be aware that whether or not any income or gain realized with respect to a Note which is owned by an organization that is generally exempt from United States federal income taxation pursuant to Section 501(a) of the Code constitutes unrelated business taxable income will depend upon the specific facts and circumstances applicable to such organization. Accordingly, any potential investors in the Notes that are generally exempt from United States federal income taxation pursuant to Section 501(a) of the Code are urged to consult with their own tax advisors concerning the United States federal income tax consequences to them of investing in the Notes.
Non-U.S. Holders
Based on the characterization and tax treatment of each Note as a pre-paid cash-settled forward contract linked to the level of the Index, in the case of a non-U.S. Holder, a payment made with respect to a Note on the maturity date will not be subject to United States withholding tax, provided that the non-U.S. Holder complies with applicable certification requirements and that the payment is not effectively connected with a United States trade or business of the non-U.S. Holder. Any capital gain realized upon the sale or other disposition of a Note by a non-U.S. Holder will generally not be subject to United States federal income tax if (i) that gain is not effectively connected with a United States trade or business of the non-U.S. Holder and (ii) in the case of an individual non-U.S. Holder, the individual is not present in the United States for 183 days or more in the taxable year of the sale or other disposition, or the gain is not attributable to a fixed place of business maintained by the individual in the United States, and the individual does not have a “tax home” (as defined for United States federal income tax purposes) in the United States.
As discussed above, alternative characterizations and treatments of the Notes for United States federal income tax purposes are possible. Should an alternative characterization and tax treatment of the Notes, by reason of a change or clarification of the law, by regulation or otherwise, cause payments with respect to the Notes to become subject to withholding tax, ML&Co. will withhold tax at the applicable statutory rate. Prospective non-U.S. Holders of the Notes should consult their own tax advisors in this regard.
Backup Withholding
A beneficial owner of a Note may be subject to backup withholding at the applicable statutory rate of United States federal income tax on certain amounts paid to the beneficial owner unless the beneficial owner provides proof of an applicable exemption or a correct taxpayer identification number, and otherwise complies with applicable requirements of the backup withholding rules.
Any amounts withheld under the backup withholding rules from a payment to a beneficial owner would be allowed as a refund or a credit against the beneficial owner’s United States federal income tax provided the required information is furnished to the IRS.
PS-23
Each fiduciary of a pension, profit-sharing or other employee benefit plan subject to the Employee Retirement Income Security Act of 1974, as amended (“ERISA”) (a “Plan”), should consider the fiduciary standards of ERISA in the context of the Plan’s particular circumstances before authorizing an investment in the securities. Accordingly, among other factors, the fiduciary should consider whether the investment would satisfy the prudence and diversification requirements of ERISA and would be consistent with the documents and instruments governing the Plan.
In addition, we and certain of our subsidiaries and affiliates, including MLPF&S, may be each considered a party in interest within the meaning of ERISA, or a disqualified person within the meaning of the Internal Revenue Code of 1986, as amended (the “Code”), with respect to many Plans, as well as many individual retirement accounts and Keogh plans (also “Plans”). Prohibited transactions within the meaning of ERISA or the Code would likely arise, for example, if the securities are acquired by or with the assets of a Plan with respect to which MLPF&S or any of its affiliates is a party in interest, unless the securities are acquired pursuant to an exemption from the prohibited transaction rules. A violation of these prohibited transaction rules could result in an excise tax or other liabilities under ERISA and/or Section 4975 of the Code for such persons, unless exemptive relief is available under an applicable statutory or administrative exemption.
Under ERISA and various prohibited transaction class exemptions (“PTCEs”) issued by the U.S. Department of Labor, exemptive relief may be available for direct or indirect prohibited transactions resulting from the purchase, holding or disposition of the securities. Those exemptions are PTCE 96-23 (for certain transactions determined by in-house asset managers), PTCE 95-60 (for certain transactions involving insurance company general accounts), PTCE 91-38 (for certain transactions involving bank collective investment funds), PTCE 90-1 (for certain transactions involving insurance company separate accounts), PTCE 84-14 (for certain transactions determined by independent qualified asset managers), and the exemption under new Section 408(b)(17) of ERISA and new Section 4975(d)(20) of the Code for certain arm’s-length transactions with a person that is a party in interest solely by reason of providing services to Plans or being an affiliate of such a service provider (the “Service Provider Exemption”).
Because we may be considered a party in interest with respect to many Plans, the securities may not be purchased, held or disposed of by any Plan, any entity whose underlying assets include plan assets by reason of any Plan’s investment in the entity (a “Plan Asset Entity”) or any person investing plan assets of any Plan, unless such purchase, holding or disposition is eligible for exemptive relief, including relief available under PTCE 96-23, 95-60, 91-38, 90-1, or 84-14 or the Service Provider Exemption, or such purchase, holding or disposition is otherwise not prohibited. Any purchaser, including any fiduciary purchasing on behalf of a Plan, transferee or holder of the securities will be deemed to have represented, in its corporate and its fiduciary capacity, by its purchase and holding of the securities that either (a) it is not a Plan or a Plan Asset Entity and is not purchasing such securities on behalf of or with plan assets of any Plan or with any assets of a governmental, church or foreign plan that is subject to any federal, state, local or foreign law that is substantially similar to the provisions of Section 406 of ERISA or Section 4975 of the Code or (b) its purchase, holding and disposition are eligible for exemptive relief or such purchase, holding and disposition are not prohibited by ERISA or Section 4975 of the Code (or in the case of a governmental, church or foreign plan, any substantially similar federal, state, local or foreign law).
Under ERISA, assets of a Plan may include assets held in the general account of an insurance company which has issued an insurance policy to such plan or assets of an entity in which the Plan has invested. Accordingly, insurance company general accounts that include assets of a Plan must ensure that one of the foregoing exemptions is available. Due to the complexity of these rules and the penalties that may be imposed upon persons involved in non-exempt prohibited transactions, it is particularly important that fiduciaries or other persons considering purchasing the securities on behalf of or with “plan assets” of any Plan consult with their counsel regarding the availability of exemptive relief under PTCE 96-23, 95-60, 91-38, 90-1 or 84-14 or the Service Provider Exemption.
Purchasers of the securities have exclusive responsibility for ensuring that their purchase, holding and disposition of the securities do not violate the prohibited transaction rules of ERISA or the Code or any similar regulations applicable to governmental or church plans, as described above.
PS-24
The net proceeds from the sale of the Notes will be used as described under “Use of Proceeds” in the accompanying general prospectus supplement and to hedge market risks of ML&Co. associated with its obligation to pay the Redemption Amount.
SUPPLEMENTAL PLAN OF DISTRIBUTION
MLPF&S has advised ML&Co. that it proposes initially to offer all or part of the Notes directly to the public on a fixed price basis at the offering prices set forth on the cover of this pricing supplement. After the initial public offering, the public offering prices may be changed. The obligations of MLPF&S are subject to certain conditions and it is committed to take and pay for all of the Notes if any are taken.
The consolidated financial statements, the related financial statement schedule, and management’s report on the effectiveness of internal control over financial reporting incorporated in this pricing supplement by reference from Merrill Lynch & Co., Inc.’s Annual Report on Form 10-K for the year ended December 29, 2006 have been audited by Deloitte & Touche LLP, an independent registered public accounting firm, as stated in their reports, which are incorporated herein by reference (which reports express an unqualified opinion on the consolidated financial statements and financial statement schedule and include an explanatory paragraph regarding the change in accounting method in 2006 for share-based payments to conform to Statement of Financial Accounting Standard No. 123 (revised 2004), Share-Based Payment) and have been so incorporated in reliance upon the reports of such firm given upon their authority as experts in accounting and auditing.
PS-25
INDEX OF CERTAIN DEFINED TERMS
| Business Day |
PS-14 | |
| Calculation Agent |
PS-6 | |
| Calculation Day |
PS-12 | |
| Calculation Period |
PS-12 | |
| Capped Value |
PS-4 | |
| Ending Value |
PS-4 | |
| Index |
PS-1 | |
| Index Business Day |
PS-12 | |
| Market Disruption Event |
PS-12 | |
| Notes |
PS-1 | |
| Pricing Date |
PS-4 | |
| Redemption Amount |
PS-4 | |
| Starting Value |
PS-4 | |
| successor index |
PS-14 |
Capitalized terms used in this pricing supplement and not otherwise defined shall have the meanings ascribed to them in the accompanying MTN prospectus supplement, general prospectus supplement and prospectus, as applicable.
PS-26
This annex contains tables which provide a brief synopsis of the business of each of the REITs as well as the split-adjusted month-end closing market prices in U.S. dollars for each Underlying Stock in each month from January 2002 through February 2007 (or from the first month-end for which that data is available) and rounded to two decimal places where necessary. The historical prices of the Underlying Stocks are not indicative of the future performance of the Underlying Stocks. The following information, with respect to the business of each REIT issuing an Underlying Stock, has been derived from publicly available documents published by that REIT. Because the common stock of each REIT is registered under the Securities Exchange Act of 1934, these REITs are required to file periodically financial and other information specified by the Securities Exchange Commission (the “SEC”). For more information about the REITs, information provided to or filed with the SEC by the REITs can be inspected at the SEC’s public reference facilities or accessed through the SEC’s web site at http://www.sec.gov.
SIMON PROPERTY GROUP, INC.
Simon Property Group, Inc. is a Delaware corporation that operates as a self-administered and self-managed REIT engaged primarily in the ownership, development and management of retail real estate, primarily regional malls, Premium Outlet centers and community/lifestyle centers.
| 2002 |
Closing Price |
2003 |
Closing Price |
2004 |
Closing Price |
2005 |
Closing Price |
2006 |
Closing Price |
2007 |
Closing Price | |||||||||||
| January |
30.29 | January |
32.70 | January |
52.05 | January |
59.30 | January |
82.84 | January |
114.39 | |||||||||||
| February |
30.78 | February |
34.64 | February |
54.49 | February |
61.96 | February |
82.97 | February |
112.74 | |||||||||||
| March |
32.63 | March |
35.83 | March |
58.44 | March |
60.58 | March |
84.14 | |||||||||||||
| April |
33.75 | April |
36.72 | April |
48.21 | April |
66.07 | April |
81.88 | |||||||||||||
| May |
34.07 | May |
37.62 | May |
51.57 | May |
68.72 | May |
79.63 | |||||||||||||
| June |
36.84 | June |
39.03 | June |
51.42 | June |
72.49 | June |
82.94 | |||||||||||||
| July |
35.99 | July |
42.35 | July |
51.61 | July |
79.74 | July |
85.53 | |||||||||||||
| August |
35.59 | August |
42.71 | August |
55.95 | August |
76.07 | August |
84.79 | |||||||||||||
| September |
35.73 | September |
43.58 | September |
53.63 | September |
74.12 | September |
90.62 | |||||||||||||
| October |
34.15 | October |
45.08 | October |
58.32 | October |
71.62 | October |
97.10 | |||||||||||||
| November |
33.72 | November |
47.45 | November |
62.08 | November |
77.31 | November |
101.98 | |||||||||||||
| December |
34.07 | December |
46.34 | December |
64.67 | December |
76.63 | December |
101.29 |
A-1
PUBLIC STORAGE, INC.
Public Storage, Inc. is an equity REIT organized under the laws of California. Public Storage, Inc. is a fully integrated, self-administered and self-managed REIT that acquires, develops, owns and operates self-storage facilities.
| 2002 |
Closing Price |
2003 |
Closing Price |
2004 |
Closing Price |
2005 |
Closing Price |
2006 |
Closing Price |
2007 |
Closing Price | |||||||||||
| January |
36.61 | January |
30.95 | January |
47.51 | January |
52.51 | January |
72.57 | January |
108.76 | |||||||||||
| February |
36.76 | February |
33.00 | February |
47.73 | February |
54.56 | February |
78.02 | February |
101.27 | |||||||||||
| March |
37.01 | March |
30.30 | March |
48.66 | March |
56.94 | March |
81.23 | |||||||||||||
| April |
37.97 | April |
32.15 | April |
41.79 | April |
58.70 | April |
76.88 | |||||||||||||
| May |
36.74 | May |
34.17 | May |
45.99 | May |
60.13 | May |
71.68 | |||||||||||||
| June |
37.10 | June |
33.87 | June |
46.01 | June |
63.25 | June |
75.90 | |||||||||||||
| July |
37.75 | July |
36.20 | July |
47.13 | July |
66.75 | July |
80.29 | |||||||||||||
| August |
31.90 | August |
36.89 | August |
50.85 | August |
67.52 | August |
86.65 | |||||||||||||
| September |
31.90 | September |
39.23 | September |
49.55 | September |
67.00 | September |
85.99 | |||||||||||||
| October |
29.42 | October |
40.00 | October |
52.25 | October |
66.20 | October |
89.71 | |||||||||||||
| November |
31.11 | November |
44.40 | November |
53.38 | November |
70.60 | November |
96.28 | |||||||||||||
| December |
32.31 | December |
43.39 | December |
55.75 | December |
67.72 | December |
97.50 |
VORNADO REALTY TRUST
Vornado Realty Trust is a fully-integrated REIT and conducts its business through Vornado Realty L.P., a Delaware limited partnership. As of December 31, 2006, we own directly or indirectly office properties, retail properties, merchandise mart properties, temperature controlled logistics, toy stores and other real estate investments.
| 2002 |
Closing Price |
2003 |
Closing Price |
2004 |
Closing Price |
2005 |
Closing Price |
2006 |
Closing Price |
2007 |
Closing Price | |||||||||||
| January |
42.66 | January |
34.50 | January |
55.95 | January |
69.14 | January |
88.34 | January |
122.35 | |||||||||||
| February |
41.80 | February |
35.00 | February |
56.90 | February |
68.70 | February |
88.99 | February |
127.20 | |||||||||||
| March |
44.16 | March |
35.80 | March |
60.48 | March |
69.27 | March |
96.00 | |||||||||||||
| April |
44.10 | April |
38.00 | April |
50.45 | April |
76.45 | April |
95.64 | |||||||||||||
| May |
44.45 | May |
42.20 | May |
54.65 | May |
78.70 | May |
89.89 | |||||||||||||
| June |
46.20 | June |
43.60 | June |
57.11 | June |
80.40 | June |
97.55 | |||||||||||||
| July |
43.55 | July |
45.84 | July |
58.09 | July |
88.64 | July |
104.55 | |||||||||||||
| August |
41.32 | August |
47.15 | August |
62.76 | August |
86.02 | August |
105.91 | |||||||||||||
| September |
39.45 | September |
48.04 | September |
62.68 | September |
86.62 | September |
109.00 | |||||||||||||
| October |
36.75 | October |
50.55 | October |
67.20 | October |
81.00 | October |
119.25 | |||||||||||||
| November |
37.36 | November |
54.71 | November |
73.50 | November |
85.35 | November |
126.11 | |||||||||||||
| December |
37.20 | December |
54.75 | December |
76.13 | December |
83.47 | December |
121.50 |
A-2
BOSTON PROPERTIES, INC.
Boston Properties, Inc., a Delaware corporation organized in 1997 is a fully integrated self-administered and self-managed REIT and one of the largest owners and developers of office properties in the United States. Its properties are concentrated in Boston, Washington, D.C., midtown Manhattan, San Francisco and Princeton, NJ.
| 2002 |
Closing Price |
2003 |
Closing Price |
2004 |
Closing Price |
2005 |
Closing Price |
2006 |
Closing Price |
2007 |
Closing Price | |||||||||||
| January |
36.64 | January |
35.90 | January |
50.03 | January |
57.78 | January |
78.26 | January |
126.09 | |||||||||||
| February |
37.67 | February |
37.20 | February |
51.23 | February |
59.80 | February |
84.67 | February |
120.10 | |||||||||||
| March |
39.45 | March |
37.90 | March |
54.31 | March |
60.23 | March |
93.25 | |||||||||||||
| April |
38.98 | April |
39.20 | April |
47.00 | April |
66.47 | April |
88.27 | |||||||||||||
| May |
41.00 | May |
41.92 | May |
49.36 | May |
66.80 | May |
84.65 | |||||||||||||
| June |
39.95 | June |
43.80 | June |
50.08 | June |
70.00 | June |
90.40 | |||||||||||||
| July |
37.30 | July |
43.29 | July |
52.90 | July |
76.15 | July |
98.20 | |||||||||||||
| August |
37.88 | August |
42.95 | August |
55.48 | August |
71.15 | August |
101.63 | |||||||||||||
| September |
37.20 | September |
43.47 | September |
55.39 | September |
70.90 | September |
103.34 | |||||||||||||
| October |
35.70 | October |
44.25 | October |
59.72 | October |
69.22 | October |
106.83 | |||||||||||||
| November |
37.07 | November |
46.25 | November |
60.18 | November |
75.21 | November |
117.05 | |||||||||||||
| December |
36.86 | December |
48.19 | December |
64.67 | December |
74.13 | December |
111.88 |
PROLOGIS
ProLogis are organized under Maryland law and have elected to be taxed as a REIT under the Internal Revenue Code of 1986, as amended. ProLogis is the world’s largest owner, manager and developer of industrial distribution facilities. Its business strategy is designed to achieve long-term sustainable growth in cash flow and a high level of return for its shareholders. ProLogis manages its business by utilizing the ProLogis Operating System, an organizational structure and service delivery system built around customers.
| 2002 |
Closing Price |
2003 |
Closing Price |
2004 |
Closing Price |
2005 |
Closing Price |
2006 |
Closing Price |
2007 |
Closing Price | |||||||||||
| January |
21.61 | January |
24.85 | January |
32.64 | January |
38.14 | January |
51.22 | January |
65.00 | |||||||||||
| February |
22.50 | February |
24.78 | February |
33.13 | February |
39.76 | February |
52.52 | February |
66.13 | |||||||||||
| March |
23.35 | March |
25.32 | March |
35.87 | March |
37.10 | March |
53.50 | |||||||||||||
| April |
22.20 | April |
25.74 | April |
29.42 | April |
39.59 | April |
50.22 | |||||||||||||
| May |
23.95 | May |
26.89 | May |
32.06 | May |
40.84 | May |
49.45 | |||||||||||||
| June |
26.00 | June |
27.30 | June |
32.92 | June |
40.24 | June |
52.12 | |||||||||||||
| July |
25.50 | July |
27.55 | July |
34.04 | July |
45.56 | July |
55.35 | |||||||||||||
| August |
24.94 | August |
28.19 | August |
36.15 | August |
43.51 | August |
56.46 | |||||||||||||
| September |
24.91 | September |
30.25 | September |
35.24 | September |
44.31 | September |
57.06 | |||||||||||||
| October |
24.20 | October |
29.54 | October |
38.98 | October |
43.00 | October |
63.27 | |||||||||||||
| November |
24.58 | November |
30.50 | November |
40.23 | November |
45.36 | November |
65.17 | |||||||||||||
| December |
25.15 | December |
32.09 | December |
43.33 | December |
46.72 | December |
60.77 |
A-3
GENERAL GROWTH PROPERTIES, INC.
General Growth Properties, Inc. is a self-administered and self-managed REIT. It is a Delaware corporation and was organized in 1986. General Growth Properties, Inc.’s business is focused in two main areas, retail and other, including the operation, development and management of retail and other rental property, primarily shopping centers and master planned communities including the development and sale of land, primarily in large-scale, long-term community development projects in and around Columbia, Maryland; Summerlin, Nevada; and Houston, Texas.
| 2002 |
Closing Price |
2003 |
Closing Price |
2004 |
Closing Price |
2005 |
Closing Price |
2006 |
Closing Price |
2007 |
Closing Price | |||||||||||
| January |
13.50 | January |
16.50 | January |
30.00 | January |
31.77 | January |
51.60 | January |
61.52 | |||||||||||
| February |
14.00 | February |
17.42 | February |
31.26 | February |
34.90 | February |
50.39 | February |
63.43 | |||||||||||
| March |
14.73 | March |
17.98 | March |
35.15 | March |
34.10 | March |
48.87 | |||||||||||||
| April |
15.24 | April |
18.54 | April |
27.11 | April |
39.11 | April |
46.95 | |||||||||||||
| May |
16.21 | May |
19.55 | May |
29.38 | May |
38.93 | May |
43.76 | |||||||||||||
| June |
17.00 | June |
20.81 | June |
29.57 | June |
41.09 | June |
45.06 | |||||||||||||
| July |
16.16 | July |
22.73 | July |
30.08 | July |
45.98 | July |
45.64 | |||||||||||||
| August |
16.80 | August |
23.12 | August |
30.17 | August |
45.09 | August |
45.33 | |||||||||||||
| September |
17.17 | September |
23.90 | September |
31.00 | September |
44.93 | September |
47.65 | |||||||||||||
| October |
16.03 | October |
25.50 | October |
32.99 | October |
42.48 | October |
51.90 | |||||||||||||
| November |
16.47 | November |
26.87 | November |
34.31 | November |
45.62 | November |
54.94 | |||||||||||||
| December |
17.33 | December |
27.75 | December |
36.16 | December |
46.99 | December |
52.23 |
EQUITY RESIDENTIAL
Equity Residential, a Maryland REIT formed in March 1993, is focused on the acquisition, development and management of high quality apartment properties in top United States growth markets.
| 2002 |
Closing Price |
2003 |
Closing Price |
2004 |
Closing Price |
2005 |
Closing Price |
2006 |
Closing Price |
2007 |
Closing Price | |||||||||||
| January |
26.78 | January |
24.44 | January |
29.10 | January |
31.54 | January |
42.41 | January |
56.28 | |||||||||||
| February |
26.95 | February |
24.28 | February |
29.75 | February |
32.81 | February |
45.28 | February |
50.79 | |||||||||||
| March |
28.74 | March |
24.07 | March |
29.85 | March |
32.21 | March |
46.79 | |||||||||||||
| April |
28.20 | April |
25.91 | April |
27.46 | April |
34.35 | April |
44.87 | |||||||||||||
| May |
28.94 | May |
26.48 | May |
29.44 | May |
35.90 | May |
44.10 | |||||||||||||
| June |
28.75 | June |
25.95 | June |
29.73 | June |
36.82 | June |
44.73 | |||||||||||||
| July |
26.75 | July |
27.90 | July |
29.55 | July |
40.40 | July |
46.51 | |||||||||||||
| August |
27.92 | August |
29.08 | August |
32.39 | August |
37.77 | August |
49.87 | |||||||||||||
| September |
23.94 | September |
29.28 | September |
31.00 | September |
37.85 | September |
50.58 | |||||||||||||
| October |
23.72 | October |
29.25 | October |
33.35 | October |
39.25 | October |
54.61 | |||||||||||||
| November |
26.12 | November |
29.36 | November |
33.71 | November |
40.76 | November |
53.26 | |||||||||||||
| December |
24.58 | December |
29.51 | December |
36.18 | December |
39.12 | December |
50.75 |
A-4
HOST HOTELS & RESORTS, INC.
Host Hotels & Resorts, Inc. is a Maryland corporation that operates as a self-managed and self- administered REIT. Its lodging portfolio consisted of luxury and upper upscale hotels with hotels in most of the major metropolitan areas in 26 states, Washington, D.C., Toronto and Calgary, Canada, Mexico City, Mexico and Santiago, Chile. Its property locations primarily include central business districts of major cities, airport areas and resort/convention destinations.
| 2002 |
Closing Price |
2003 |
Closing Price |
2004 |
Closing Price |
2005 |
Closing Price |
2006 |
Closing Price |
2007 |
Closing Price | |||||||||||
| January |
10.09 | January |
8.15 | January |
12.67 | January |
16.00 | January |
19.95 | January |
26.47 | |||||||||||
| February |
10.80 | February |
6.92 | February |
12.16 | February |
15.98 | February |
19.43 | February |
26.28 | |||||||||||
| March |
11.95 | March |
6.92 | March |
12.78 | March |
16.56 | March |
21.40 | |||||||||||||
| April |
11.91 | April |
7.72 | April |
11.90 | April |
16.82 | April |
21.02 | |||||||||||||
| May |
11.48 | May |
9.00 | May |
12.26 | May |
16.75 | May |
20.07 | |||||||||||||
| June |
11.30 | June |
9.15 | June |
12.36 | June |
17.50 | June |
21.87 | |||||||||||||
| July |
11.25 | July |
9.98 | July |
12.95 | July |
18.65 | July |
21.22 | |||||||||||||
| August |
10.14 | August |
10.02 | August |
13.35 | August |
17.49 | August |
22.54 | |||||||||||||
| September |
9.28 | September |
10.73 | September |
14.03 | September |
16.90 | September |
22.93 | |||||||||||||
| October |
8.20 | October |
10.45 | October |
14.55 | October |
16.79 | October |
23.06 | |||||||||||||
| November |
9.15 | November |
11.15 | November |
15.66 | November |
17.90 | November |
25.22 | |||||||||||||
| December |
8.85 | December |
12.32 | December |
17.30 | December |
18.95 | December |
24.55 |
ARCHSTONE-SMITH TRUST
Archstone-Smith is engaged primarily in the acquisition, development, redevelopment, operation and long-term ownership of apartment communities in the United States. It has elected REIT status and is structured as an UPREIT, with all property ownership and business operations conducted through an operating trust. The company owns and operates a portfolio of High-Rise and garden apartment communities concentrated in the Washington, D.C. metropolitan area, Southern California, the New York City metropolitan area, the San Francisco Bay Area, Boston and Seattle.
| 2002 |
Closing Price |
2003 |
Closing Price |
2004 |
Closing Price |
2005 |
Closing Price |
2006 |
Closing Price |
2007 |
Closing Price | |||||||||||
| January |
24.88 | January |
22.20 | January |
27.43 | January |
34.30 | January |
46.86 | January |
63.21 | |||||||||||
| February |
25.88 | February |
22.05 | February |
28.00 | February |
33.83 | February |
47.40 | February |
56.41 | |||||||||||
| March |
26.79 | March |
21.96 | March |
29.51 | March |
34.11 | March |
48.77 | |||||||||||||
| April |
26.96 | April |
22.80 | April |
27.43 | April |
35.97 | April |
48.88 | |||||||||||||
| May |
27.01 | May |
23.76 | May |
29.05 | May |
36.82 | May |
48.35 | |||||||||||||
| June |
26.70 | June |
24.00 | June |
29.33 | June |
38.62 | June |
50.87 | |||||||||||||
| July |
25.40 | July |
25.85 | July |
29.43 | July |
42.50 | July |
52.47 | |||||||||||||
| August |
26.35 | August |
26.15 | August |
31.25 | August |
40.30 | August |
53.18 | |||||||||||||
| September |
23.88 | September |
26.38 | September |
31.64 | September |
39.87 | September |
54.44 | |||||||||||||
| October |
22.94 | October |
26.70 | October |
33.55 | October |
40.57 | October |
60.21 | |||||||||||||
| November |
23.10 | November |
27.48 | November |
36.50 | November |
41.81 | November |
59.98 | |||||||||||||
| December |
23.54 | December |
27.98 | December |
38.30 | December |
41.89 | December |
58.21 |
A-5
KIMCO REALTY CORP.
Kimco Realty Corporation, a Maryland corporation, is one of the nation’s largest owners and operators of neighborhood and community shopping centers. The Company is a self-administered REIT and manages its properties through present management, which has owned and operated neighborhood and community shopping centers for over 45 years.
| 2002 |
Closing Price |
2003 |
Closing Price |
2004 |
Closing Price |
2005 |
Closing Price |
2006 |
Closing Price |
2007 |
Closing Price | |||||||||||
| January |
15.26 | January |
15.70 | January |
23.07 | January |
26.49 | January |
35.09 | January |
49.60 | |||||||||||
| February |
15.51 | February |
16.85 | February |
23.48 | February |
26.56 | February |
35.93 | February |
50.26 | |||||||||||
| March |
16.35 | March |
17.56 | March |
25.49 | March |
26.95 | March |
40.64 | |||||||||||||
| April |
16.05 | April |
18.10 | April |
21.37 | April |
27.70 | April |
37.13 | |||||||||||||
| May |
15.95 | May |
18.70 | May |
22.98 | May |
28.88 | May |
35.85 | |||||||||||||
| June |
16.75 | June |
18.95 | June |
22.75 | June |
29.46 | June |
36.49 | |||||||||||||
| July |
16.07 | July |
20.47 | July |
24.05 | July |
32.83 | July |
39.24 | |||||||||||||
| August |
15.88 | August |
20.84 | August |
25.16 | August |
31.62 | August |
41.55 | |||||||||||||
| September |
15.55 | September |
20.49 | September |
25.65 | September |
31.42 | September |
42.87 | |||||||||||||
| October |
15.15 | October |
20.83 | October |
27.28 | October |
29.62 | October |
44.43 | |||||||||||||
| November |
15.68 | November |
22.00 | November |
28.44 | November |
31.45 | November |
46.38 | |||||||||||||
| December |
15.32 | December |
22.38 | December |
29.00 | December |
32.08 | December |
44.95 |
AVALONBAY COMMUNITIES, INC.
AvalonBay Communities, Inc. is a Maryland corporation that has elected to be treated as a REIT, for federal income tax purposes. AvalonBay Communities, Inc. engages in the development, redevelopment, acquisition, ownership and operation of multifamily communities in high barrier-to-entry markets of the United States. These barriers-to-entry generally include a difficult and lengthy entitlement process with local jurisdictions and dense urban or suburban areas where zoned and entitled land is in limited supply. These markets are located in the Northeast, Mid-Atlantic, Midwest, Pacific Northwest, and Northern and Southern California regions of the United States.
| 2002 |
Closing Price |
2003 |
Closing Price |
2004 |
Closing Price |
2005 |
Closing Price |
2006 |
Closing Price |
2007 |
Closing Price | |||||||||||
| January |
44.95 | January |
36.80 | January |
49.10 | January |
66.92 | January |
99.48 | January |
148.36 | |||||||||||
| February |
46.14 | February |
36.71 | February |
50.38 | February |
69.50 | February |
103.00 | February |
137.56 | |||||||||||
| March |
49.80 | March |
36.90 | March |
53.58 | March |
66.89 | March |
109.10 | |||||||||||||
| April |
47.67 | April |
39.89 | April |
49.63 | April |
72.00 | April |
107.70 | |||||||||||||
| May |
47.36 | May |
41.93 | May |
54.45 | May |
74.87 | May |
106.30 | |||||||||||||
| June |
46.70 | June |
42.64 | June |
56.52 | June |
80.80 | June |
110.62 | |||||||||||||
| July |
44.95 | July |
46.98 | July |
58.20 | July |
87.56 | July |
116.92 | |||||||||||||
| August |
45.25 | August |
46.40 | August |
60.40 | August |
84.04 | August |
121.00 | |||||||||||||
| September |
41.80 | September |
46.80 | September |
60.22 | September |
85.70 | September |
120.40 | |||||||||||||
| October |
37.70 | October |
45.67 | October |
65.47 | October |
86.25 | October |
131.06 | |||||||||||||
| November |
39.60 | November |
47.80 | November |
71.10 | November |
91.45 | November |
133.08 | |||||||||||||
| December |
39.14 | December |
47.80 | December |
75.30 | December |
89.25 | December |
130.05 |
A-6
DEVELOPERS DIVERSIFIED REALTY CORP.
Developers Diversified Realty Corporation, an Ohio Corporation, a self-administered and self-managed REIT, is in the business of acquiring, developing, redeveloping, owning, leasing and managing shopping centers.
| 2002 |
Closing Price |
2003 |
Closing Price |
2004 |
Closing Price |
2005 |
Closing Price |
2006 |
Closing Price |
2007 |
Closing Price | |||||||||||
| January |
19.10 | January |
22.42 | January |
34.38 | January |
39.75 | January |
49.26 | January |
67.12 | |||||||||||
| February |
20.21 | February |
23.30 | February |
36.77 | February |
41.83 | February |
50.19 | February |
65.56 | |||||||||||
| March |
21.00 | March |
24.15 | March |
40.40 | March |
39.75 | March |
54.75 | |||||||||||||
| April |
22.10 | April |
25.20 | April |
32.75 | April |
42.44 | April |
53.20 | |||||||||||||
| May |
23.20 | May |
28.23 | May |
34.39 | May |
45.60 | May |
51.15 | |||||||||||||
| June |
22.50 | June |
28.44 | June |
35.37 | June |
45.96 | June |
52.18 | |||||||||||||
| July |
23.00 | July |
29.70 | July |
35.88 | July |
48.67 | July |
52.78 | |||||||||||||
| August |
23.10 | August |
29.02 | August |
37.71 | August |
47.99 | August |
54.10 | |||||||||||||
| September |
22.01 | September |
29.87 | September |
39.15 | September |
46.70 | September |
55.76 | |||||||||||||
| October |
21.40 | October |
28.90 | October |
41.80 | October |
43.68 | October |
60.90 | |||||||||||||
| November |
22.03 | November |
31.51 | November |
43.05 | November |
45.30 | November |
64.78 | |||||||||||||
| December |
21.99 | December |
33.57 | December |
44.37 | December |
47.02 | December |
62.95 |
MACERICH COMPANY
The Macerich Company is involved in the acquisition, ownership, development, redevelopment, management and leasing of regional and community shopping centers located throughout the United States. The Company is the sole general partner of, and owns a majority of the ownership interests in The Macerich Partnership, L.P., a Delaware limited partnership.
| 2002 |
Closing Price |
2003 |
Closing Price |
2004 |
Closing Price |
2005 |
Closing Price |
2006 |
Closing Price |
2007 |
Closing Price | |||||||||||
| January |
27.57 | January |
29.70 | January |
48.13 | January |
57.21 | January |
72.57 | January |
95.53 | |||||||||||
| February |
27.35 | February |
32.15 | February |
49.40 | February |
57.21 | February |
72.05 | February |
93.60 | |||||||||||
| March |
30.15 | March |
31.68 | March |
53.90 | March |
53.28 | March |
73.95 | |||||||||||||
| April |
29.35 | April |
33.00 | April |
41.87 | April |
60.30 | April |
73.22 | |||||||||||||
| May |
28.55 | May |
34.50 | May |
45.25 | May |
63.03 | May |
68.91 | |||||||||||||
| June |
31.00 | June |
35.13 | June |
47.87 | June |
67.05 | June |
70.20 | |||||||||||||
| July |
29.90 | July |
37.33 | July |
47.90 | July |
70.22 | July |
72.75 | |||||||||||||
| August |
30.48 | August |
37.20 | August |
54.50 | August |
65.08 | August |
74.66 | |||||||||||||
| September |
30.98 | September |
37.75 | September |
53.29 | September |
64.94 | September |
76.36 | |||||||||||||
| October |
28.45 | October |
40.20 | October |
59.75 | October |
64.27 | October |
80.35 | |||||||||||||
| November |
30.41 | November |
42.20 | November |
60.74 | November |
67.98 | November |
85.47 | |||||||||||||
| December |
30.75 | December |
44.50 | December |
62.80 | December |
67.14 | December |
86.57 |
A-7
SL GREEN REALTY CORP.
SL Green Realty Corp. is a self-managed REIT with in-house capabilities in property management, acquisitions, financing, development, construction and leasing. It was formed in June 1997 for the purpose of continuing the commercial real estate business of S.L. Green Properties, Inc., our predecessor entity. S.L. Green Properties, Inc., which was founded in 1980 by Stephen L. Green, its Chairman and former Chief Executive Officer, had been engaged in the business of owning, managing, leasing, acquiring and repositioning office properties in Manhattan, a borough of New York City, or Manhattan.
| 2002 |
Closing Price |
2003 |
Closing Price |
2004 |
Closing Price |
2005 |
Closing Price |
2006 |
Closing Price |
2007 |
Closing Price | |||||||||||
| January |
31.65 | January |
30.22 | January |
42.97 | January |
53.23 | January |
84.04 | January |
146.58 | |||||||||||
| February |
31.92 | February |
29.45 | February |
44.00 | February |
56.38 | February |
86.91 | February |
145.86 | |||||||||||
| March |
33.60 | March |
30.56 | March |
47.70 | March |
56.22 | March |
101.50 | |||||||||||||
| April |
35.10 | April |
32.23 | April |
40.80 | April |
61.00 | April |
99.00 | |||||||||||||
| May |
35.80 | May |
34.54 | May |
45.50 | May |
61.95 | May |
99.21 | |||||||||||||
| June |
35.65 | June |
34.89 | June |
46.80 | June |
64.50 | June |
109.47 | |||||||||||||
| July |
32.25 | July |
35.81 | July |
49.10 | July |
69.70 | July |
114.30 | |||||||||||||
| August |
33.07 | August |
35.17 | August |
50.00 | August |
66.13 | August |
111.56 | |||||||||||||
| September |
30.74 | September |
36.11 | September |
51.81 | September |
68.18 | September |
111.70 | |||||||||||||
| October |
29.18 | October |
36.15 | October |
54.82 | October |
68.03 | October |
121.05 | |||||||||||||
| November |
31.72 | November |
37.36 | November |
57.63 | November |
73.85 | November |
135.24 | |||||||||||||
| December |
31.60 | December |
41.05 | December |
60.55 | December |
76.39 | December |
132.78 |
DUKE REALTY CORP.
Duke Realty Corp. is a self-administered and self-managed REIT, which began operations upon completion of an initial public offering in February 1986. Its diversified portfolio of rental properties are leased by tenants whose businesses include manufacturing, retailing, wholesale trade, distribution and professional services. Duke Realty Corp. also owns or controls unencumbered land ready for development.
| 2002 |
Closing Price |
2003 |
Closing Price |
2004 |
Closing Price |
2005 |
Closing Price |
2006 |
Closing Price |
2007 |
Closing Price | |||||||||||
| January |
23.25 | January |
25.05 | January |
32.87 | January |
31.10 | January |
36.28 | January |
44.12 | |||||||||||
| February |
23.80 | February |
25.95 | February |
32.40 | February |
31.68 | February |
35.10 | February |
44.06 | |||||||||||
| March |
26.00 | March |
26.98 | March |
34.72 | March |
29.85 | March |
37.95 | |||||||||||||
| April |
26.30 | April |
27.40 | April |
29.16 | April |
30.60 | April |
35.40 | |||||||||||||
| May |
27.06 | May |
28.38 | May |
32.36 | May |
30.87 | May |
33.94 | |||||||||||||
| June |
28.95 | June |
27.55 | June |
31.81 | June |
31.66 | June |
35.15 | |||||||||||||
| July |
25.75 | July |
28.82 | July |
30.76 | July |
33.96 | July |
37.26 | |||||||||||||
| August |
26.23 | August |
27.67 | August |
34.00 | August |
32.74 | August |
37.98 | |||||||||||||
| September |
24.62 | September |
29.20 | September |
33.20 | September |
33.88 | September |
37.35 | |||||||||||||
| October |
24.30 | October |
29.28 | October |
34.10 | October |
34.10 | October |
40.06 | |||||||||||||
| November |
25.00 | November |
30.80 | November |
34.55 | November |
34.00 | November |
43.52 | |||||||||||||
| December |
25.45 | December |
31.00 | December |
34.14 | December |
33.40 | December |
40.90 |
A-8
REGENCY CENTERS CORP.
Regency Centers Corp. is a qualified REIT, which began operations in 1993. Its primary operating and investment goal is long-term growth in earnings per share and total shareholder return, which it works to achieve by focusing on a strategy of owning, operating and developing high-quality community and neighborhood shopping centers that are tenanted by market-dominant grocers, category-leading anchors, specialty retailers and restaurants located in areas with above average household incomes and population densities.
| 2002 |
Closing Price |
2003 |
Closing Price |
2004 |
Closing Price |
2005 |
Closing Price |
2006 |
Closing Price |
2007 |
Closing Price | |||||||||||
| January |
28.70 | January |
31.68 | January |
41.70 | January |
49.40 | January |
64.45 | January |
87.10 | |||||||||||
| February |
28.30 | February |
32.17 | February |
41.95 | February |
51.00 | February |
64.50 | February |
85.74 | |||||||||||
| March |
29.02 | March |
32.95 | March |
46.73 | March |
47.63 | March |
67.19 | |||||||||||||
| April |
29.40 | April |
33.00 | April |
37.91 | April |
52.65 | April |
63.09 | |||||||||||||
| May |
29.36 | May |
33.98 | May |
40.30 | May |
55.85 | May |
61.61 | |||||||||||||
| June |
29.65 | June |
34.98 | June |
42.90 | June |
57.20 | June |
62.15 | |||||||||||||
| July |
31.50 | July |
36.38 | July |
42.50 | July |
61.70 | July |
64.12 | |||||||||||||
| August |
31.75 | August |
35.28 | August |
46.00 | August |
58.33 | August |
67.27 | |||||||||||||
| September |
31.00 | September |
36.85 | September |
46.49 | September |
57.45 | September |
68.76 | |||||||||||||
| October |
31.26 | October |
37.08 | October |
48.86 | October |
55.67 | October |
72.16 | |||||||||||||
| November |
30.90 | November |
39.50 | November |
52.00 | November |
58.05 | November |
78.98 | |||||||||||||
| December |
32.40 | December |
39.85 | December |
55.40 | December |
58.95 | December |
78.17 |
APARTMENT INVESTMENT AND MANAGEMENT COMPANY
Apartment Investment and Management Company is a Maryland corporation incorporated on January 10, 1994. It is a self-administered and self-managed REIT, engaged in the acquisition, ownership, management and redevelopment of apartment properties. Based on apartment unit data compiled by the National Multi Housing Council, as of January 1, 2006, it was the largest owner of apartment properties in the United States. Its portfolio includes garden style, mid-rise and high-rise properties.
| 2002 |
Closing Price |
2003 |
Closing Price |
2004 |
Closing Price |
2005 |
Closing Price |
2006 |
Closing Price |
2007 |
Closing Price | |||||||||||
| January |
43.60 | January |
36.35 | January |
35.18 | January |
35.90 | January |
42.52 | January |
62.63 | |||||||||||
| February |
45.18 | February |
36.77 | February |
32.40 | February |
38.26 | February |
44.31 | February |
58.86 | |||||||||||
| March |
48.37 | March |
36.48 | March |
31.09 | March |
37.20 | March |
46.90 | |||||||||||||
| April |
49.10 | April |
37.76 | April |
28.17 | April |
38.12 | April |
44.69 | |||||||||||||
| May |
46.58 | May |
35.23 | May |
28.88 | May |
37.10 | May |
43.25 | |||||||||||||
| June |
49.20 | June |
34.60 | June |
31.13 | June |
40.92 | June |
43.45 | |||||||||||||
| July |
44.96 | July |
39.41 | July |
31.97 | July |
44.00 | July |
48.09 | |||||||||||||
| August |
43.65 | August |
38.55 | August |
35.50 | August |
39.90 | August |
51.24 | |||||||||||||
| September |
38.85 | September |
39.36 | September |
34.78 | September |
38.78 | September |
54.41 | |||||||||||||
| October |
35.14 | October |
40.90 | October |
36.69 | October |
38.40 | October |
57.32 | |||||||||||||
| November |
37.37 | November |
34.05 | November |
36.37 | November |
38.73 | November |
57.64 | |||||||||||||
| December |
37.48 | December |
34.50 | December |
38.54 | December |
37.87 | December |
56.02 |
A-9
HEALTH CARE PROPERTY INVESTORS, INC.
Health Care Property Investors, Inc., together with its consolidated subsidiaries and joint ventures, invests primarily in real estate serving the healthcare industry in the United States. Health Care Property Investors, Inc. is a Maryland REIT organized in 1985. Health Care Property Investors, Inc. is headquartered in Long Beach, California, with operations in Nashville, Tennessee and Orlando, Florida. Health Care Property Investors, Inc. acquires healthcare facilities and leases them to healthcare providers and provides mortgage financing secured by healthcare facilities. The Company’s portfolio includes: (i) senior housing, including independent living facilities, assisted living facilities and continuing care retirement communities; (ii) medical office buildings; (iii) hospitals; (iv) skilled nursing facilities; and (v) other healthcare facilities, including laboratory and office buildings.
| 2002 |
Closing Price |
2003 |
Closing Price |
2004 |
Closing Price |
2005 |
Closing Price |
2006 |
Closing Price |
2007 |
Closing Price | |||||||||||
| January |
18.99 | January |
18.42 | January |
28.12 | January |
25.96 | January |
27.75 | January |
41.25 | |||||||||||
| February |
18.90 | February |
17.68 | February |
27.84 | February |
25.20 | February |
27.47 | February |
36.77 | |||||||||||
| March |
20.28 | March |
16.68 | March |
28.30 | March |
23.47 | March |
28.40 | |||||||||||||
| April |
20.42 | April |
18.61 | April |
23.90 | April |
25.64 | April |
27.42 | |||||||||||||
| May |
20.89 | May |
19.61 | May |
24.03 | May |
27.19 | May |
26.15 | |||||||||||||
| June |
21.45 | June |
21.18 | June |
24.04 | June |
27.04 | June |
26.74 | |||||||||||||
| July |
21.91 | July |
21.92 | July |
24.96 | July |
27.86 | July |
27.42 | |||||||||||||
| August |
21.50 | August |
21.03 | August |
25.35 | August |
27.17 | August |
30.09 | |||||||||||||
| September |
21.30 | September |
23.35 | September |
26.00 | September |
26.99 | September |
31.05 | |||||||||||||
| October |
21.60 | October |
23.32 | October |
27.83 | October |
25.45 | October |
31.40 | |||||||||||||
| November |
21.80 | November |
23.42 | November |
26.83 | November |
26.27 | November |
36.27 | |||||||||||||
| December |
19.15 | December |
25.40 | December |
27.69 | December |
25.56 | December |
36.82 |
AMB PROPERTY CORP.
AMB Property Corporation, a Maryland corporation, acquires, develops and operates industrial properties in key distribution markets throughout North America, Europe and Asia. Its strategy focuses on providing properties for customers who value the efficient movement of goods located mostly in the world’s busiest distribution markets: large, supply-constrained locations with proximity to airports, seaports and major highway systems.
| 2002 |
Closing Price |
2003 |
Closing Price |
2004 |
Closing Price |
2005 |
Closing Price |
2006 |
Closing Price |
2007 |
Closing Price | |||||||||||
| January |
25.61 | January |
27.65 | January |
34.95 | January |
37.23 | January |
52.20 | January |
60.85 | |||||||||||
| February |
26.05 | February |
28.00 | February |
35.42 | February |
38.82 | February |
53.65 | February |
58.78 | |||||||||||
| March |
27.50 | March |
28.25 | March |
37.17 | March |
37.80 | March |
54.27 | |||||||||||||
| April |
28.04 | April |
27.30 | April |
30.30 | April |
38.99 | April |
49.99 | |||||||||||||
| May |
29.15 | May |
27.41 | May |
33.05 | May |
40.31 | May |
49.43 | |||||||||||||
| June |
31.00 | June |
28.17 | June |
34.63 | June |
43.43 | June |
50.55 | |||||||||||||
| July |
29.55 | July |
28.10 | July |
35.14 | July |
45.99 | July |
52.43 | |||||||||||||
| August |
29.75 | August |
28.50 | August |
37.35 | August |
44.33 | August |
55.83 | |||||||||||||
| September |
28.90 | September |
30.81 | September |
37.02 | September |
44.90 | September |
55.11 | |||||||||||||
| October |
26.80 | October |
29.99 | October |
37.50 | October |
44.18 | October |
58.41 | |||||||||||||
| November |
27.65 | November |
31.46 | November |
39.95 | November |
46.76 | November |
61.27 | |||||||||||||
| December |
27.36 | December |
32.88 | December |
40.39 | December |
49.17 | December |
58.61 |
A-10
FEDERAL REALTY INVESTMENT TRUST
Federal Realty Investment Trust is an equity REIT specializing in the ownership, management, development and redevelopment of high quality retail and mixed-use properties, located primarily in densely populated and affluent communities with relatively high barriers to entry throughout the Northeast and Mid-Atlantic United States, as well as in California.
| 2002 |
Closing Price |
2003 |
Closing Price |
2004 |
Closing Price |
2005 |
Closing Price |
2006 |
Closing Price |
2007 |
Closing Price | |||||||||||
| January |
24.31 | January |
28.04 | January |
41.29 | January |
47.18 | January |
66.82 | January |
93.42 | |||||||||||
| February |
25.16 | February |
29.31 | February |
42.35 | February |
50.19 | February |
69.69 | February |
90.49 | |||||||||||
| March |
25.67 | March |
30.37 | March |
46.20 | March |
48.35 | March |
75.20 | |||||||||||||
| April |
26.95 | April |
30.82 | April |
37.08 | April |
53.50 | April |
68.23 | |||||||||||||
| May |
27.40 | May |
33.00 | May |
39.90 | May |
55.20 | May |
68.38 | |||||||||||||
| June |
27.71 | June |
32.00 | June |
41.59 | June |
59.00 | June |
70.00 | |||||||||||||
| July |
27.30 | July |
34.87 | July |
42.20 | July |
65.31 | July |
72.55 | |||||||||||||
| August |
27.00 | August |
34.98 | August |
45.38 | August |
61.92 | August |
74.07 | |||||||||||||
| September |
27.00 | September |
36.86 | September |
44.00 | September |
60.93 | September |
74.30 | |||||||||||||
| October |
26.35 | October |
37.95 | October |
47.45 | October |
60.65 | October |
80.15 | |||||||||||||
| November |
27.29 | November |
39.31 | November |
50.15 | November |
62.98 | November |
85.18 | |||||||||||||
| December |
28.12 | December |
38.39 | December |
51.65 | December |
60.65 | December |
85.00 |
VENTAS, INC.
Ventas, Inc. is a healthcare REIT with a geographically diverse portfolio of seniors housing and healthcare-related properties in the United States. Except with respect to its medical office buildings, Ventas, Inc. leases these properties to healthcare operating companies under “triple-net” or “absolute-net” leases, which require the tenants to pay all property-related expenses. Ventas, Inc. also had real estate loan investments relating to seniors housing and healthcare-related third parties as of December 31, 2006.
| 2002 |
Closing Price |
2003 |
Closing Price |
2004 |
Closing Price |
2005 |
Closing Price |
2006 |
Closing Price |
2007 |
Closing Price | |||||||||||
| January |
12.13 | January |
11.35 | January |
25.00 | January |
25.60 | January |
30.60 | January |
46.25 | |||||||||||
| February |
12.69 | February |
12.00 | February |
26.45 | February |
25.82 | February |
31.00 | February |
45.83 | |||||||||||
| March |
12.65 | March |
11.60 | March |
27.48 | March |
24.96 | March |
33.18 | |||||||||||||
| April |
13.50 | April |
13.00 | April |
22.09 | April |
26.98 | April |
32.67 | |||||||||||||
| May |
13.15 | May |
14.15 | May |
23.32 | May |
28.54 | May |
32.44 | |||||||||||||
| June |
12.75 | June |
15.15 | June |
23.35 | June |
30.20 | June |
33.88 | |||||||||||||
| July |
13.00 | July |
16.55 | July |
25.52 | July |
32.29 | July |
35.73 | |||||||||||||
| August |
13.00 | August |
16.91 | August |
27.35 | August |
31.15 | August |
40.05 | |||||||||||||
| September |
13.35 | September |
17.12 | September |
25.92 | September |
32.20 | September |
38.54 | |||||||||||||
| October |
11.40 | October |
18.70 | October |
26.90 | October |
30.63 | October |
38.98 | |||||||||||||
| November |
12.50 | November |
20.02 | November |
27.10 | November |
31.53 | November |
38.95 | |||||||||||||
| December |
11.45 | December |
22.00 | December |
27.41 | December |
32.02 | December |
42.32 |
A-11
LIBERTY PROPERTY TRUST
Liberty Property Trust is a self-administered and self-managed Maryland REIT. Substantially all of the Trust’s assets are owned directly or indirectly, and substantially all of the Trust’s operations are conducted directly or indirectly, by its subsidiary, Liberty Property Limited Partnership, a Pennsylvania limited partnership. The Liberty Property Trust’s industrial properties consist of a variety of warehouse, distribution, service, assembly, light manufacturing and research and development facilities. They include both single-tenant and multi-tenant facilities, with most designed flexibly to accommodate various types of tenants, space requirements and industrial uses. The Liberty Property Trust’s office properties are multi-story and single-story office buildings located principally in suburban mixed-use developments or office parks. Substantially all of the Liberty Property Trust’s properties are located in prime business locations within established business communities. In addition, Liberty Property Trust is developing a 1.25 million square foot office tower, known as the Comcast Center, in Philadelphia’s central business district.
| 2002 |
Closing Price |
2003 |
Closing Price |
2004 |
Closing Price |
2005 |
Closing Price |
2006 |
Closing Price |
2007 |
Closing Price | |||||||||||
| January |
29.35 | January |
29.99 | January |
38.58 | January |
39.05 | January |
45.26 | January |
51.74 | |||||||||||
| February |
30.10 | February |
31.22 | February |
42.28 | February |
41.46 | February |
44.78 | February |
51.25 | |||||||||||
| March |
32.25 | March |
31.30 | March |
45.00 | March |
39.05 | March |
47.16 | |||||||||||||
| April |
31.95 | April |
31.29 | April |
36.55 | April |
39.83 | April |
44.70 | |||||||||||||
| May |
34.50 | May |
33.27 | May |
39.89 | May |
41.29 | May |
42.58 | |||||||||||||
| June |
35.00 | June |
34.60 | June |
40.21 | June |
44.31 | June |
44.20 | |||||||||||||
| July |
32.15 | July |
34.69 | July |
38.40 | July |
44.88 | July |
46.85 | |||||||||||||
| August |
32.63 | August |
34.83 | August |
40.46 | August |
43.40 | August |
47.87 | |||||||||||||
| September |
31.00 | September |
36.98 | September |
39.84 | September |
42.54 | September |
47.79 | |||||||||||||
| October |
29.34 | October |
36.38 | October |
40.55 | October |
41.69 | October |
48.20 | |||||||||||||
| November |
31.45 | November |
37.83 | November |
41.00 | November |
42.46 | November |
51.21 | |||||||||||||
| December |
31.94 | December |
38.90 | December |
43.20 | December |
42.85 | December |
49.14 |
CAMDEN PROPERTY TRUST
Formed on May 25, 1993, Camden Property Trust, a Texas REIT, engaged in the ownership, development, construction and management of multifamily apartment communities. Its portfolio consists of middle- to upper-market multifamily communities. Camden Property Trust targets acquisitions and developments in selected markets in the United States.
| 2002 |
Closing Price |
2003 |
Closing Price |
2004 |
Closing Price |
2005 |
Closing Price |
2006 |
Closing Price |
2007 |
Closing Price | |||||||||||
| January |
34.86 | January |
31.50 | January |
43.50 | January |
45.31 | January |
65.10 | January |
78.40 | |||||||||||
| February |
36.00 | February |
31.90 | February |
43.70 | February |
46.40 | February |
65.85 | February |
71.98 | |||||||||||
| March |
39.12 | March |
32.40 | March |
44.95 | March |
47.03 | March |
72.05 | |||||||||||||
| April |
39.80 | April |
34.95 | April |
42.32 | April |
51.00 | April |
68.73 | |||||||||||||
| May |
38.40 | May |
34.74 | May |
46.71 | May |
51.61 | May |
71.40 | |||||||||||||
| June |
37.03 | June |
34.95 | June |
45.80 | June |
53.75 | June |
73.55 | |||||||||||||
| July |
37.00 | July |
37.31 | July |
45.00 | July |
55.28 | July |
76.45 | |||||||||||||
| August |
35.85 | August |
38.10 | August |
47.08 | August |
52.30 | August |
77.59 | |||||||||||||
| September |
33.15 | September |
38.43 | September |
46.20 | September |
55.75 | September |
76.01 | |||||||||||||
| October |
31.34 | October |
39.60 | October |
45.40 | October |
56.35 | October |
80.72 | |||||||||||||
| November |
33.99 | November |
42.04 | November |
49.03 | November |
59.00 | November |
79.73 | |||||||||||||
| December |
33.00 | December |
44.30 | December |
51.00 | December |
57.92 | December |
73.85 |
A-12
WEINGARTEN REALTY INVESTORS
Weingarten Realty Investors is a real estate investment trust organized under the Texas Real Estate Investment Trust Act. Weingarten Realty Investors, and its predecessor entity, began the ownership and development of shopping centers and other commercial real estate in 1948. Weingarten Realty Investors’s primary business is leasing space to tenants in the shopping and industrial centers it owns or leases. Weingarten Realty Investors also manages centers for joint ventures in which Weingarten Realty Investors are partners or for other outside owners for which Weingarten Realty investors charges fees.
| 2002 |
Closing Price |
2003 |
Closing Price |
2004 |
Closing Price |
2005 |
Closing Price |
2006 |
Closing Price |
2007 |
Closing Price | |||||||||||
| January |
21.89 | January |
24.27 | January |
31.67 | January |
35.75 | January |
40.53 | January |
49.51 | |||||||||||
| February |
21.91 | February |
25.90 | February |
33.03 | February |
36.83 | February |
39.38 | February |
49.44 | |||||||||||
| March |
22.84 | March |
26.07 | March |
34.60 | March |
34.51 | March |
40.75 | |||||||||||||
| April |
23.73 | April |
26.33 | April |
28.91 | April |
36.01 | April |
39.41 | |||||||||||||
| May |
24.27 | May |
27.55 | May |
30.97 | May |
38.01 | May |
37.86 | |||||||||||||
| June |
23.60 | June |
27.93 | June |
31.28 | June |
39.22 | June |
38.28 | |||||||||||||
| July |
24.73 | July |
28.90 | July |
30.80 | July |
39.28 | July |
39.96 | |||||||||||||
| August |
25.53 | August |
29.84 | August |
33.62 | August |
38.55 | August |
42.42 | |||||||||||||
| September |
24.40 | September |
30.00 | September |
33.01 | September |
37.85 | September |
43.02 | |||||||||||||
| October |
24.77 | October |
28.85 | October |
36.16 | October |
35.56 | October |
46.50 | |||||||||||||
| November |
24.81 | November |
30.05 | November |
40.75 | November |
37.77 | November |
47.72 | |||||||||||||
| December |
24.57 | December |
29.57 | December |
40.10 | December |
37.81 | December |
46.11 |
UDR, INC.
UDR, Inc. (formerly known as United Dominion Realty Trust, Inc.) is a REIT that owns, acquires, renovates, develops, and manages apartment communities nationwide.
| 2002 |
Closing Price |
2003 |
Closing Price |
2004 |
Closing Price |
2005 |
Closing Price |
2006 |
Closing Price |
2007 |
Closing Price | |||||||||||
| January |
14.34 | January |
15.99 | January |
18.50 | January |
22.22 | January |
25.41 | January |
32.79 | |||||||||||
| February |
14.10 | February |
15.57 | February |
18.87 | February |
22.10 | February |
26.75 | February |
32.65 | |||||||||||
| March |
15.84 | March |
15.98 | March |
19.62 | March |
20.87 | March |
28.54 | |||||||||||||
| April |
16.70 | April |
16.69 | April |
17.95 | April |
22.15 | April |
27.19 | |||||||||||||
| May |
15.85 | May |
17.10 | May |
19.94 | May |
23.05 | May |
27.01 | |||||||||||||
| June |
15.75 | June |
17.22 | June |
19.78 | June |
24.05 | June |
28.01 | |||||||||||||
| July |
16.20 | July |
18.03 | July |
19.39 | July |
25.45 | July |
27.85 | |||||||||||||
| August |
16.61 | August |
18.32 | August |
21.23 | August |
23.68 | August |
30.51 | |||||||||||||
| September |
15.91 | September |
18.31 | September |
19.83 | September |
23.70 | September |
30.20 | |||||||||||||
| October |
14.43 | October |
17.45 | October |
21.08 | October |
22.13 | October |
32.37 | |||||||||||||
| November |
15.52 | November |
18.45 | November |
22.99 | November |
22.39 | November |
33.58 | |||||||||||||
| December |
16.36 | December |
19.20 | December |
24.80 | December |
23.44 | December |
31.79 |
A-13
MACK-CALI REALTY CORP.
Mack-Cali Realty Corporation, a Maryland corporation, is a fully-integrated, self-administered and self-managed REIT that owns and operates a real estate portfolio comprised predominantly of Class A office and office/flex properties located primarily in the Northeast. Mack-Cali Realty Corporation performs substantially all commercial real estate leasing, management, acquisition, development and construction services on an in-house basis.
| 2002 |
Closing Price |
2003 |
Closing Price |
2004 |
Closing Price |
2005 |
Closing Price |
2006 |
Closing Price |
2007 |
Closing Price | |||||||||||
| January |
31.51 | January |
28.50 | January |
40.57 | January |
41.98 | January |
44.72 | January |
55.64 | |||||||||||
| February |
31.45 | February |
28.90 | February |
42.56 | February |
44.20 | February |
44.90 | February |
51.68 | |||||||||||
| March |
34.68 | March |
30.97 | March |
44.91 | March |
42.35 | March |
48.00 | |||||||||||||
| April |
32.80 | April |
31.56 | April |
37.35 | April |
43.99 | April |
45.22 | |||||||||||||
| May |
34.83 | May |
34.37 | May |
39.96 | May |
44.09 | May |
42.88 | |||||||||||||
| June |
35.15 | June |
36.38 | June |
41.38 | June |
45.30 | June |
45.92 | |||||||||||||
| July |
31.29 | July |
36.82 | July |
40.90 | July |
47.91 | July |
48.31 | |||||||||||||
| August |
33.55 | August |
36.80 | August |
45.26 | August |
44.05 | August |
53.15 | |||||||||||||
| September |
32.13 | September |
39.20 | September |
44.30 | September |
44.94 | September |
51.80 | |||||||||||||
| October |
28.89 | October |
37.69 | October |
44.17 | October |
42.65 | October |
52.90 | |||||||||||||
| November |
30.00 | November |
39.90 | November |
43.74 | November |
44.17 | November |
54.64 | |||||||||||||
| December |
30.30 | December |
41.62 | December |
46.03 | December |
43.20 | December |
51.00 |
ESSEX PROPERTY TRUST, INC.
Essex Property Trust, Inc. is a Maryland corporation that operates as a self-administered and self-managed REIT. Essex Property Trust, Inc. is engaged primarily in the ownership, operation, management, acquisition, development and redevelopment of real estate. The majority of its real estate consists of apartment communities, located predominantly along the West Coast.
| 2002 |
Closing Price |
2003 |
Closing Price |
2004 |
Closing Price |
2005 |
Closing Price |
2006 |
Closing Price |
2007 |
Closing Price | |||||||||||
| January |
46.34 | January |
50.48 | January |
62.15 | January |
71.95 | January |
99.38 | January |
144.34 | |||||||||||
| February |
47.40 | February |
50.95 | February |
62.97 | February |
72.08 | February |
99.65 | February |
138.89 | |||||||||||
| March |
52.18 | March |
52.25 | March |
65.50 | March |
69.10 | March |
108.73 | |||||||||||||
| April |
52.00 | April |
54.97 | April |
60.95 | April |
75.95 | April |
109.10 | |||||||||||||
| May |
52.25 | May |
56.99 | May |
65.55 | May |
80.00 | May |
106.50 | |||||||||||||
| June |
54.70 | June |
57.25 | June |
68.35 | June |
83.06 | June |
111.66 | |||||||||||||
| July |
51.00 | July |
60.60 | July |
65.90 | July |
91.86 | July |
117.09 | |||||||||||||
| August |
52.80 | August |
62.85 | August |
73.75 | August |
87.95 | August |
125.47 | |||||||||||||
| September |
49.44 | September |
62.71 | September |
71.85 | September |
90.00 | September |
121.40 | |||||||||||||
| October |
47.46 | October |
59.88 | October |
78.46 | October |
89.88 | October |
133.28 | |||||||||||||
| November |
51.00 | November |
63.95 | November |
80.53 | November |
91.70 | November |
132.04 | |||||||||||||
| December |
50.85 | December |
64.22 | December |
83.80 | December |
92.20 | December |
129.25 |
A-14
CBL & ASSOCIATES PROPERTIES, INC.
CBL & Associates Properties, Inc. is a self-managed, self-administered, fully integrated REIT. It owns, develops, acquires, leases, manages and operates regional malls and open-air and community shopping centers. Its shopping center properties are primarily located in the southeastern and midwestern United States.
| 2002 |
Closing Price |
2003 |
Closing Price |
2004 |
Closing Price |
2005 |
Closing Price |
2006 |
Closing Price |
2007 |
Closing Price | |||||||||||
| January |
16.88 | January |
19.23 | January |
30.23 | January |
34.39 | January |
42.32 | January |
46.93 | |||||||||||
| February |
17.13 | February |
19.93 | February |
28.78 | February |
37.26 | February |
42.60 | February |
47.13 | |||||||||||
| March |
17.68 | March |
20.30 | March |
30.67 | March |
35.76 | March |
42.45 | |||||||||||||
| April |
18.30 | April |
21.23 | April |
25.13 | April |
38.69 | April |
39.99 | |||||||||||||
| May |
18.90 | May |
21.68 | May |
26.66 | May |
40.74 | May |
37.41 | |||||||||||||
| June |
20.25 | June |
21.50 | June |
27.50 | June |
43.07 | June |
38.93 | |||||||||||||
| July |
18.36 | July |
24.09 | July |
27.55 | July |
45.88 | July |
39.16 | |||||||||||||
| August |
19.50 | August |
24.49 | August |
30.54 | August |
42.42 | August |
40.74 | |||||||||||||
| September |
19.38 | September |
24.95 | September |
30.48 | September |
40.99 | September |
41.91 | |||||||||||||
| October |
18.48 | October |
26.65 | October |
32.78 | October |
37.35 | October |
43.73 | |||||||||||||
| November |
19.65 | November |
28.13 | November |
36.65 | November |
40.25 | November |
43.10 | |||||||||||||
| December |
20.03 | December |
28.25 | December |
38.18 | December |
39.51 | December |
43.35 |
ALEXANDRIA REAL ESTATE EQUITIES, INC.
Alexandria Real Estate Equities, Inc. is a Maryland corporation formed in October 1994 that has elected to be taxed as a REIT. It is engaged principally in the ownership, operation, management, selective redevelopment, development and acquisition of properties for the life sciences industry. Its properties are designed and improved for lease primarily to institutional (universities and independent not-for-profit institutions), pharmaceutical, biotechnology, medical device, life science product, service, biodefense and translational research entities, as well as governmental agencies. The properties leased to tenants in the life science industry typically consist of buildings containing scientific research and development laboratories and other improvements that are generic to tenants operating in the life science industry.
| 2002 |
Closing Price |
2003 |
Closing Price |
2004 |
Closing Price |
2005 |
Closing Price |
2006 |
Closing Price |
2007 |
Closing Price | |||||||||||
| January |
40.45 | January |
41.35 | January |
61.85 | January |
66.56 | January |
88.25 | January |
108.36 | |||||||||||
| February |
41.35 | February |
41.55 | February |
61.38 | February |
66.98 | February |
88.02 | February |
105.19 | |||||||||||
| March |
44.60 | March |
42.05 | March |
63.00 | March |
64.38 | March |
95.33 | |||||||||||||
| April |
45.70 | April |
42.30 | April |
56.82 | April |
68.82 | April |
90.60 | |||||||||||||
| May |
46.50 | May |
44.30 | May |
54.95 | May |
69.30 | May |
83.96 | |||||||||||||
| June |
49.34 | June |
45.00 | June |
56.78 | June |
73.45 | June |
88.68 | |||||||||||||
| July |
43.15 | July |
45.75 | July |
60.09 | July |
80.45 | July |
94.42 | |||||||||||||
| August |
43.93 | August |
46.75 | August |
64.80 | August |
81.95 | August |
98.02 | |||||||||||||
| September |
42.48 | September |
48.03 | September |
65.72 | September |
82.69 | September |
93.80 | |||||||||||||
| October |
42.00 | October |
51.00 | October |
66.05 | October |
80.85 | October |
99.70 | |||||||||||||
| November |
40.79 | November |
56.10 | November |
71.80 | November |
84.00 | November |
103.08 | |||||||||||||
| December |
42.60 | December |
57.90 | December |
74.42 | December |
80.50 | December |
100.40 |
A-15
COUSINS PROPERTIES INC.
Cousins Properties Incorporated is a Georgia corporation, which since 1987 has elected to be taxed as a REIT that owns, develops, and manages its own real estate portfolio and performs certain real estate related services for other parties. Its strategy is to produce strong stockholder returns by creating value through the acquisition, development and redevelopment of high quality, well-located office, multi-family, retail, industrial, and residential properties. Cousins Properties Incorporated has developed substantially all of the income producing real estate assets it owns and operates. A key element in the Cousins Properties Incorporated’s strategy is to actively manage its portfolio of investment properties and, at the appropriate times, to engage in timely and strategic dispositions either by sale or through contributions to ventures in which Cousins Properties Incorporated retains an ownership interest. These transactions seek to maximize the value of the assets t Cousins Properties Incorporated has created, generate capital for additional development properties and return a portion of the value created to stockholders.
| 2002 |
Closing Price |
2003 |
Closing Price |
2004 |
Closing Price |
2005 |
Closing Price |
2006 |
Closing Price |
2007 |
Closing Price | |||||||||||
| January |
24.90 | January |
24.15 | January |
30.70 | January |
30.29 | January |
31.22 | January |
39.14 | |||||||||||
| February |
26.14 | February |
24.68 | February |
30.70 | February |
27.13 | February |
30.67 | February |
34.34 | |||||||||||
| March |
26.05 | March |
25.85 | March |
32.79 | March |
25.87 | March |
33.43 | |||||||||||||
| April |
27.00 | April |
26.26 | April |
28.12 | April |
27.00 | April |
31.45 | |||||||||||||
| May |
27.04 | May |
27.01 | May |
31.29 | May |
28.34 | May |
30.22 | |||||||||||||
| June |
24.76 | June |
27.90 | June |
32.95 | June |
29.58 | June |
30.93 | |||||||||||||
| July |
23.95 | July |
28.20 | July |
32.13 | July |
32.60 | July |
31.77 | |||||||||||||
| August |
23.90 | August |
29.00 | August |
36.00 | August |
30.31 | August |
34.37 | |||||||||||||
| September |
23.00 | September |
27.75 | September |
34.31 | September |
30.22 | September |
34.21 | |||||||||||||
| October |
22.40 | October |
28.75 | October |
37.22 | October |
29.54 | October |
35.77 | |||||||||||||
| November |
24.05 | November |
30.10 | November |
32.80 | November |
27.84 | November |
36.33 | |||||||||||||
| December |
24.70 | December |
30.60 | December |
30.27 | December |
28.30 | December |
35.27 |
A-16

12,900,000 Units
Merrill Lynch & Co., Inc.
Medium-Term Notes, Series C
Accelerated Return Bear Market Notes
Linked to the Cohen & Steers Realty Majors Portfolio Index
due June 5, 2008
(the “Notes”)
$10 original public offering price per unit
|
PRICING SUPPLEMENT
|
Merrill Lynch & Co.
March 29, 2007