CALCULATION OF REGISTRATION FEE
| Title of Each Class of Securities to be Registered |
Amount to be Registered |
Proposed Offering Price Per Unit |
Proposed Maximum Aggregate Offering Price |
Amount of Fee(1) | ||||
| Capped Leveraged Index Return Notes® Linked to a Basket of 17 Common Equity Securities in the Technology and Industrial Sectors, due June 4, 2013 |
2,390,381 | $10.00 | $23,903,810 | $2,775.23 | ||||
| (1) | Calculated in accordance with Rule 457(r) of the Securities Act of 1933. |
Filed Pursuant to Rule 424(b)(2)
Registration No. 333-158663
The LIRNs are being offered by Bank of America Corporation (“BAC”). The LIRNs will have the terms specified in this term sheet as supplemented by the documents indicated below under “Additional Terms” (together, the “Note Prospectus”). Investing in the LIRNs involves a number of risks. There are important differences between the LIRNs and a conventional debt security, including different investment risks. See “Risk Factors” and “Additional Risk Factor” on page TS-6 of this term sheet and beginning on page S-8 of product supplement STOCK LIRN-1. LIRNs:
|
Are Not FDIC Insured
|
Are Not Bank Guaranteed
|
May Lose Value
|
In connection with this offering, Merrill Lynch, Pierce, Fenner & Smith Incorporated (“MLPF&S”) is acting in its capacity as principal for your account.
None of the Securities and Exchange Commission (the “SEC”), any state securities commission, or any other regulatory body has approved or disapproved of these securities or determined if this Note Prospectus is truthful or complete. Any representation to the contrary is a criminal offense.
| Per Unit |
Total |
|||||||||||
| Public offering price (1) |
$ | 10.00 | $ | 23,903,810.00 | ||||||||
| Underwriting discount (1) |
$ | 0.20 | $ | 478,076.20 | ||||||||
| Proceeds, before expenses, to Bank of America Corporation |
$ | 9.80 | $ | 23,425,733.80 | ||||||||
| (1) | The public offering price and underwriting discount for any purchase of 500,000 units or more in a single transaction by an individual investor will be $9.95 per unit and $0.15 per unit, respectively. |
| Merrill Lynch & Co.
|

| |||
| May 26, 2011 |
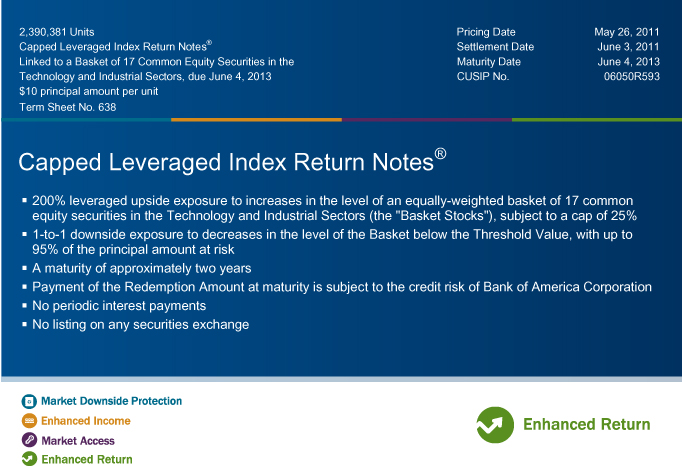
2,390,381 Units Pricing Date May 26, 2011
Capped Leveraged Index Return Notes® Settlement Date June 3, 2011
Linked to a Basket of 17 Common Equity Securities in the Maturity Date June 4, 2013
Technology and Industrial Sectors, due June 4, 2013 CUSIP No. 06050R593
$10 principal amount per unit
Term Sheet No. 638
Capped Leveraged Index Return Notes®
200% leveraged upside exposure to increases in the level of an equally-weighted basket of 17 common equity securities in the Technology and Industrial Sectors (the “Basket Stocks”), subject to a cap of 25%
1-to-1 downside exposure to decreases in the level of the Basket below the Threshold Value, with up to 95% of the principal amount at risk
A maturity of approximately two years
Payment of the Redemption Amount at maturity is subject to the credit risk of Bank of America Corporation
No periodic interest payments
No listing on any securities exchange
Market Downside Protection
Enhanced Income
Enhanced Return
Market Access
Enhanced Return

Summary
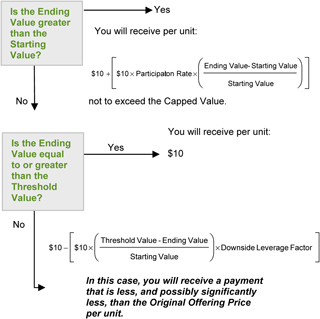
The Capped Leveraged Index Return Notes® Linked to a Basket of 17 Common Equity Securities in the Technology and Industrial Sectors, due June 4, 2013 (the “LIRNs”) are our senior unsecured debt securities. The LIRNs are not guaranteed or insured by the Federal Deposit Insurance Corporation or secured by collateral. The LIRNs will rank equally with all of our other unsecured and unsubordinated debt, and any payments due on the LIRNs, including any repayment of principal, will be subject to the credit risk of BAC. The LIRNs provide a leveraged return for investors, subject to a cap, if the level of an equally-weighted static basket (the “Basket”) of the common stocks of 17 companies in the technology and industrial sectors (the “Basket Stocks”) increases moderately from the Starting Value of the Basket, which was set to 100.00 on the pricing date, to the Ending Value of the Basket, determined on a calculation day shortly before the maturity date. Investors must be willing to forgo interest payments on the LIRNs and be willing to accept a return that is capped or a repayment that is less, and potentially significantly less, than the Original Offering Price.
The Basket consists of the following common equity securities:
| Basket Stock |
Ticker | Weight | Initial Share Price |
Component Ratio |
Initial Basket Value Contribution | |||||
| Apple Inc. |
AAPL | 5.8824% | 335.00 | 0.01755940 | 5.8824 | |||||
| The Boeing Company |
BA | 5.8824% | 76.66 | 0.07673363 | 5.8824 | |||||
| Cisco Systems, Inc. |
CSCO | 5.8824% | 16.25 | 0.36199385 | 5.8824 | |||||
| Deere & Company |
DE | 5.8824% | 84.94 | 0.06925359 | 5.8824 | |||||
| Dell Inc. |
DELL | 5.8824% | 15.80 | 0.37230380 | 5.8824 | |||||
| Danaher Corporation |
DHR | 5.8824% | 53.64 | 0.10966443 | 5.8824 | |||||
| Emerson Electric Co. |
EMR | 5.8824% | 54.04 | 0.10885270 | 5.8824 | |||||
| Honeywell International, Inc. |
HON | 5.8824% | 58.50 | 0.10055385 | 5.8824 | |||||
| Hewlett-Packard Company |
HPQ | 5.8824% | 36.55 | 0.16094118 | 5.8824 | |||||
| International Business Machines Corporation |
IBM | 5.8824% | 167.18 | 0.03518603 | 5.8824 | |||||
| Illinois Tool Works Inc. |
ITW | 5.8824% | 56.99 | 0.10321811 | 5.8824 | |||||
| Juniper Networks, Inc. |
JNPR | 5.8824% | 36.98 | 0.15906977 | 5.8824 | |||||
| Microsoft Corporation |
MSFT | 5.8824% | 24.67 | 0.23844345 | 5.8824 | |||||
| Oracle Corporation |
ORCL | 5.8824% | 33.40 | 0.17611976 | 5.8824 | |||||
| QUALCOMM, Inc. |
QCOM | 5.8824% | 57.17 | 0.10289313 | 5.8824 | |||||
| Texas Instruments Incorporated |
TXN | 5.8824% | 34.32 | 0.17139860 | 5.8824 | |||||
| United Technologies Corporation |
UTX | 5.8824% | 86.39 | 0.06809121 | 5.8824 |
Capitalized terms used but not defined in this term sheet have the meanings set forth in product supplement STOCK LIRN-1. Unless otherwise indicated or unless the context requires otherwise, all references in this document to “we,” “us,” “our,” or similar references are to BAC.
|
Capped Leveraged Index Return Notes® |
TS-2 |
|
Capped Leveraged Index Return Notes® |
TS-3 |
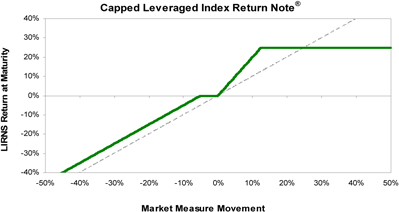
Hypothetical Payout Profile
|
This graph reflects the hypothetical returns on the LIRNs at maturity, based upon the Participation Rate of 200%, a Threshold Value equal to 95% of the Starting Value, and a Capped Value of $12.50 (a 25% return). The green line reflects the hypothetical returns on the LIRNs, while the dotted gray line reflects the hypothetical returns of a direct investment in the Basket Stocks, excluding dividends.
This graph has been prepared for purposes of illustration only. Your actual return will depend on the actual Ending Value and the term of your investment. |
Hypothetical Redemption Amounts
Examples
Set forth below are four examples of hypothetical Redemption Amount calculations (rounded to two decimal places) payable at maturity, based upon the Participation Rate of 200%, the Downside Leverage Factor of 100%, the Starting Value of 100.00, the Threshold Value of 95.00 (95% of the Starting Value), and the Capped Value of $12.50 per unit.
Example 1 — The hypothetical Ending Value is 70% of the Starting Value and is less than the Threshold Value:
| Starting Value: |
100.00 | |||||
| Hypothetical Ending Value: |
70.00 | |||||
| Threshold Value: |
95.00 |
| $10 – |
[ | $10 × | ( | 95.00 – 70.00 | ) | × 100% | ] | = $7.50 | ||||||||||||
| 100.00 |
Hypothetical Redemption Amount (per unit) = $7.50
Example 2 — The hypothetical Ending Value is 97% of the Starting Value and is greater than the Threshold Value:
| Starting Value: |
100.00 | |||||
| Hypothetical Ending Value: |
97.00 | |||||
| Threshold Value: |
95.00 |
Hypothetical Redemption Amount (per unit) = $10.00
If the Ending Value is less than or equal to the Starting Value but is greater than or equal to the Threshold Value, the Redemption Amount will equal the Original Offering Price.
Example 3 — The hypothetical Ending Value is 104% of the Starting Value:
| Starting Value: |
100.00 | |||||
| Hypothetical Ending Value: |
104.00 |
| $10 + |
[ | $10 × 200% × | ( | 104.00 – 100.00 | ) | ] | = $10.80 | |||||||||||
| 100.00 |
Hypothetical Redemption Amount (per unit) = $10.80
Example 4 — The hypothetical Ending Value is 150% of the Starting Value:
| Starting Value: |
100.00 | |||||
| Hypothetical Ending Value: |
150.00 |
| $10 + |
[ | $10 × 200% × | ( | 150.00 – 100.00 | ) | ] | = $20.00 | |||||||||||
| 100.00 |
Hypothetical Redemption Amount (per unit) = $12.50 (The Redemption Amount cannot be greater than the Capped Value.)
|
Capped Leveraged Index Return Notes® |
TS-4 |
The following table illustrates, the Starting Value of 100.00, the Threshold Value of 95.00 (95% of the Starting Value), and a range of hypothetical Ending Values of the Basket:
| § | the percentage change from the Starting Value to the hypothetical Ending Value; |
| § | the hypothetical Redemption Amount per unit of the LIRNs (rounded to two decimal places); and |
| § | the hypothetical total rate of return to holders of the LIRNs. |
The table below is based on the Participation Rate of 200%, the Downside Leverage Factor of 100%, and the Capped Value of $12.50 (per unit).
| Hypothetical |
Percentage Change from the Starting Value to the Hypothetical Ending Value |
Hypothetical Redemption |
Hypothetical Total Rate | |||||||||||||||
| 50.00 | -50.00 | % | $ | 5.50 | -45.00 | % | ||||||||||||
| 60.00 | -40.00 | % | $ | 6.50 | -35.00 | % | ||||||||||||
| 70.00 | -30.00 | % | $ | 7.50 | -25.00 | % | ||||||||||||
| 80.00 | -20.00 | % | $ | 8.50 | -15.00 | % | ||||||||||||
| 90.00 | -10.00 | % | $ | 9.50 | -5.00 | % | ||||||||||||
| 95.00 | (2) | -5.00 | % | $ | 10.00 | 0.00 | % | |||||||||||
| 98.00 | -2.00 | % | $ | 10.00 | 0.00 | % | ||||||||||||
| 100.00 | (3) | 0.00 | % | $ | 10.00 | 0.00 | % | |||||||||||
| 102.00 | 2.00 | % | $ | 10.40 | 4.00 | % | ||||||||||||
| 104.00 | 4.00 | % | $ | 10.80 | 8.00 | % | ||||||||||||
| 110.00 | 10.00 | % | $ | 12.00 | 20.00 | % | ||||||||||||
| 120.00 | 20.00 | % | $ | 12.50 | (4) | 25.00 | % | |||||||||||
| 130.00 | 30.00 | % | $ | 12.50 | 25.00 | % | ||||||||||||
| 140.00 | 40.00 | % | $ | 12.50 | 25.00 | % | ||||||||||||
| 150.00 | 50.00 | % | $ | 12.50 | 25.00 | % | ||||||||||||
| (1) | The Ending Value will not include any income generated by dividends paid on the Basket Stocks, which you would otherwise be entitled to receive if you invested in those stocks directly |
| (2) | This is the Threshold Value. |
| (3) | This is the Starting Value. |
| (4) | The hypothetical Redemption Amount per unit of the LIRNs cannot exceed the Capped Value of $12.50. |
The above figures are for purposes of illustration only. The actual amount you receive and the resulting total rate of return will depend on the actual Ending Value and the term of your investment.
|
Capped Leveraged Index Return Notes® |
TS-5 |
Risk Factors
There are important differences between the LIRNs and a conventional debt security. An investment in the LIRNs involves significant risks, including those listed below. You should carefully review the more detailed explanation of risks relating to the LIRNs in the “Risk Factors” sections beginning on page S-8 of product supplement STOCK LIRN-1 and page S-4 of the MTN prospectus supplement identified below under “Additional Terms.” We also urge you to consult your investment, legal, tax, accounting, and other advisors before you invest in the LIRNs.
| § | Your investment may result in a loss; there is no guaranteed return of principal. |
| § | Your yield may be less than the yield on a conventional debt security of comparable maturity. |
| § | Your investment return, if any, is limited to the return represented by the Capped Value. |
| § | Your investment return, if any, may be less than a comparable investment directly in the Basket Stocks. |
| § | You must rely on your own evaluation of the merits of an investment linked to the Basket Stocks. |
| § | In seeking to provide you with what we believe to be commercially reasonable terms for the LIRNs while providing MLPF&S with compensation for its services, we have considered the costs of developing, hedging, and distributing the LIRNs. |
| § | A trading market is not expected to develop for the LIRNs. MLPF&S is not obligated to make a market for, or to repurchase, the LIRNs. |
| § | The Redemption Amount will not be affected by all developments relating to the Basket Stocks. |
| § | Changes in the values of the Basket Stocks may offset each other. |
| § | The issuers of the Basket Stocks will have no obligations with respect to the LIRNs, and neither we nor MLPF&S will perform any due diligence procedures with respect to these issuers. |
| § | You will have no rights of a holder of any of the Basket Stocks, and you will not be entitled to receive securities or dividends or other distributions by the issuers of the Basket Stocks. |
| § | The Redemptions Amount will not be adjusted by all corporate events that could affect the Basket Stocks. |
| § | Although we or our affiliates may from time to time hold one or more Basket Stocks, we do not control any company included in the Basket and are not responsible for any disclosure made by any other company. |
| § | If you attempt to sell the LIRNs prior to maturity, their market value, if any, will be affected by various factors that interrelate in complex ways, and their market value may be less than the Original Offering Price. |
| § | Payments on the LIRNs are subject to our credit risk, and changes in our credit ratings are expected to affect the value of the LIRNs. |
| § | Purchases and sales by us and our affiliates of stocks included in the Basket may affect your return. |
| § | Our trading and hedging activities may create conflicts of interest with you. |
| § | Our hedging activities may affect your return on the LIRNs and their market value. |
| § | Our business activities relating to the companies represented by the Basket Stocks may create conflicts of interest with you. |
| § | There may be potential conflicts of interest involving the calculation agent. We have the right to appoint and remove the calculation agent. |
| § | The U.S. federal income tax consequences of the LIRNs are uncertain, and may be adverse to a holder of the LIRNs. See “Summary Tax Consequences” and “Certain U.S. Federal Income Taxation Considerations” below and “U.S. Federal Income Tax Summary” beginning on page S-32 of product supplement STOCK LIRN-1. |
Additional Risk Factor
The stocks included in the Basket are concentrated in two sectors. All of the stocks included in the Basket are issued by companies that operate in the technology and industrial sectors. As a result, the stocks that will determine the performance of the LIRNs are concentrated in two sectors. Although an investment in the LIRNs will not give holders any ownership or other direct interests in the Basket Stocks, the return on an investment in the LIRNs will be subject to certain risks associated with a direct equity investment in companies in the applicable sector. Accordingly, by investing in the LIRNs, you will not benefit from the diversification which could result from an investment linked to companies that operate in more than two sectors.
|
Capped Leveraged Index Return Notes® |
TS-6 |
Investor Considerations
Other Provisions
We will deliver the LIRNs against payment therefor in New York, New York on a date that is greater than three business days following the pricing date. Under Rule 15c6-1 of the Securities Exchange Act of 1934, trades in the secondary market generally are required to settle in three business days, unless the parties to any such trade expressly agree otherwise. Accordingly, purchasers who wish to trade the LIRNs more than three business days prior to the original issue date will be required to specify alternative settlement arrangements to prevent a failed settlement.
If you place an order to purchase the LIRNs, you are consenting to MLPF&S acting as a principal in effecting the transaction for your account.
Supplement to the Plan of Distribution; Conflicts of Interest
MLPF&S, a broker-dealer subsidiary of BAC, is a member of the Financial Industry Regulatory Authority, Inc. (“FINRA”) and will participate as selling agent in the distribution of the LIRNs. Accordingly, offerings of the LIRNs will conform to the requirements of FINRA Rule 5121. Under our distribution agreement with MLPF&S, MLPF&S will purchase the LIRNs from us on the issue date as principal at the purchase price indicated on the cover of this term sheet, less the indicated underwriting discount. In the original offering of the LIRNs, the LIRNs will be sold in minimum investment amounts of 100 units.
MLPF&S may use this Note Prospectus for offers and sales in secondary market transactions and market-making transactions in the LIRNs but is not obligated to engage in such secondary market transactions and/or market-making transactions. MLPF&S may act as principal or agent in these transactions, and any such sales will be made at prices related to prevailing market prices at the time of the sale.
|
Capped Leveraged Index Return Notes® |
TS-7 |
The Basket
None of the issuers of the Basket Stocks have authorized or sanctioned the LIRNs or participated in the preparation of this term sheet. Each of these issuers is subject to the informational requirements of the Exchange Act and files reports and other information with the SEC. Companies with securities registered under the Exchange Act are required to file periodically financial and other information required by the SEC. Information filed with the SEC can be inspected and copied at the Public Reference Section of the SEC, 100 F Street, N.E., Room 1580, Washington, D.C. 20549. Copies of this material also can be obtained from the Public Reference Section at prescribed rates. In addition, information filed electronically by each of the issuers of the Basket Stocks with the SEC can be reviewed through a website maintained by the SEC. The address of the SEC’s website is http://www.sec.gov.
Although we and our affiliates may hold securities of the issuers of the Basket Stocks from time to time, we do not control these issuers. The issuers of the Basket Stocks will have no obligations with respect to the LIRNs. This term sheet relates only to the LIRNs and does not relate to the Basket Stocks. We are not offering or selling securities of any of the issuers of the Basket Stocks. The descriptions of the Basket Stocks in this section are derived from the publicly available documents described in the preceding paragraph. None of us or our affiliates has participated in the preparation of these documents, verified the accuracy or the completeness of the information concerning the Basket Stocks included in the publicly available documents or made any due diligence inquiry with respect to the Basket Stocks. We do not make any representation that the publicly available documents or any other publicly available information about the Basket Stocks are accurate or complete. There can be no assurance that events occurring prior or subsequent to the date of this term sheet (including events that would affect the accuracy or completeness of the publicly available documents described in the preceding paragraph) that might affect the value of any of the Basket Stocks have been or will be publicly disclosed. We do not intend to furnish to you any additional information about the Basket Stocks. Neither we nor any of our affiliates makes any representation to you as to the future performance of any of the Basket Stocks.
The selection of the Basket Stocks is not a recommendation to buy or sell any of the Basket Stocks. Neither we nor any of our affiliates make any representation to you as to the performance of the Basket Stocks.
You should make your own investigation into the Basket Stocks.
On the pricing date, for each Basket Stock, the Initial Component Weight, the Initial Stock Value, the Component Ratio and the Initial Basket Value Contribution were as follows:
| Basket Stock |
Bloomberg Symbol |
Initial Component Weight |
Initial Stock Value(1) |
Component Ratio(2) |
Initial Basket Value Contribution | |||||
| Apple Inc. |
AAPL | 5.8824% | 335.00 | 0.01755940 | 5.8824 | |||||
| The Boeing Company |
BA | 5.8824% | 76.66 | 0.07673363 | 5.8824 | |||||
| Cisco Systems, Inc. |
CSCO | 5.8824% | 16.25 | 0.36199385 | 5.8824 | |||||
| Deere & Co. |
DE | 5.8824% | 84.94 | 0.06925359 | 5.8824 | |||||
| Dell Inc. |
DELL | 5.8824% | 15.80 | 0.37230380 | 5.8824 | |||||
| Danaher Corporation |
DHR | 5.8824% | 53.64 | 0.10966443 | 5.8824 | |||||
| Emerson Electric Co. |
EMR | 5.8824% | 54.04 | 0.10885270 | 5.8824 | |||||
| Honeywell International, Inc. |
HON | 5.8824% | 58.50 | 0.10055385 | 5.8824 | |||||
| Hewlett-Packard Company |
HPQ | 5.8824% | 36.55 | 0.16094118 | 5.8824 | |||||
| International Business Machines Corporation |
IBM | 5.8824% | 167.18 | 0.03518603 | 5.8824 | |||||
| Illinois Tool Works Inc. |
ITW | 5.8824% | 56.99 | 0.10321811 | 5.8824 | |||||
| Juniper Networks, Inc. |
JNPR | 5.8824% | 36.98 | 0.15906977 | 5.8824 | |||||
| Microsoft Corporation |
MSFT | 5.8824% | 24.67 | 0.23844345 | 5.8824 | |||||
| Oracle Corporation |
ORCL | 5.8824% | 33.40 | 0.17611976 | 5.8824 | |||||
| QUALCOMM, Inc. |
QCOM | 5.8824% | 57.17 | 0.10289313 | 5.8824 | |||||
| Texas Instruments Inc. |
TXN | 5.8824% | 34.32 | 0.17139860 | 5.8824 | |||||
| United Technologies Corporation |
UTX | 5.8824% | 86.39 | 0.06809121 | 5.8824 | |||||
| Starting Value | 100.00 |
| (1) | These were the closing prices of the Basket Stocks on the pricing date. The Price Multiplier for each Basket Stock was set to 1 on the pricing date, and is subject to adjustment for certain corporate events relating to that Basket Stock. See the section entitled “Description of LIRNs—Anti-Dilution Adjustments” beginning on page S-23 of the product supplement STOCK LIRN-1. |
| (2) | Each hypothetical Component Ratio equals the Initial Component Weight of the Basket Stock (as a percentage) multiplied by 100, and then divided by the closing price of that Basket Stock on the pricing date and rounded to eight decimal places. |
The calculation agent will calculate the value of the Basket by summing the products of the closing price for each Basket Stock and its Price Multiplier on the calculation day and the Component Ratio applicable to such Basket Component Index. If a Market Disruption Event occurs as to any Basket Stock on the scheduled calculation day, the closing price of that Basket Stock will be determined as more fully described beginning on page S-18 of product supplement STOCK LIRN-1 in the section “Description of LIRNs—Determining the Starting Value and the Ending Value—Ending Value.”
|
Capped Leveraged Index Return Notes® |
TS-8 |
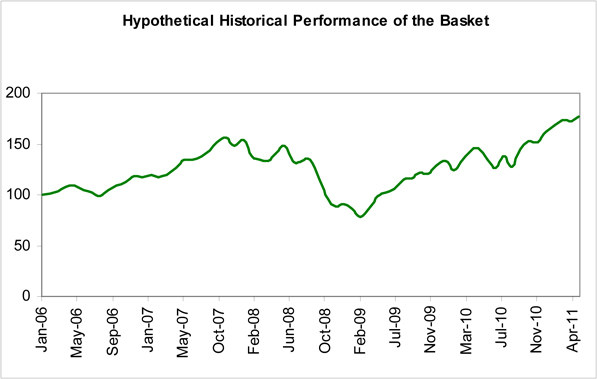
While actual historical information on the Basket did not exist before the pricing date, the following graph sets forth the hypothetical historical monthly performance of the Basket in the period from January 2006 through April 2011, based upon actual month-end historical levels of each Basket Stock, hypothetical Component Ratios determined as of December 31, 2005, and a Basket value of 100.00 as of that date. This hypothetical historical data on the Basket is not necessarily indicative of the future performance of the Basket or what the value of the LIRNs may be. Any historical upward or downward trend in the value of the Basket during any period set forth below is not an indication that the value of the Basket is more or less likely to increase or decrease at any time over the term of the LIRNs.
|
Capped Leveraged Index Return Notes® |
TS-9 |
Historical Data of the Basket Stocks
The following tables set forth the high, low, and period-end closing prices of each of the Basket Stocks on its principal exchange from the first quarter of 2006 through the pricing date. We obtained the historical prices of the Basket Stocks (rounded to two decimal places) shown below from the Bloomberg Financial® service, without independent verification. The historical value of any Basket Stock should not be taken as an indication of its future performance, and we cannot assure you that its value on the calculation day will not decrease from its value on the pricing date.
Apple Inc.
Apple Inc. designs, manufactures, and markets personal computers and related personal computing and mobile communication devices along with a variety of related software, services, peripherals, and networking solutions. The company sells its products worldwide through its online stores, its retail stores, its direct sales force, third-party wholesalers, and resellers. This Basket Stock trades on the Nasdaq Global Select Market under the symbol “AAPL.”
| High Closing Price |
Low Closing Price |
Period-End Closing Price | ||||||
| 2006 |
First Quarter | 85.61 | 58.72 | 62.72 | ||||
| Second Quarter | 71.93 | 56.02 | 57.12 | |||||
| Third Quarter | 77.74 | 50.55 | 77.03 | |||||
| Fourth Quarter | 91.80 | 73.18 | 84.84 | |||||
| 2007 |
First Quarter | 97.13 | 83.27 | 92.91 | ||||
| Second Quarter | 125.09 | 90.24 | 122.04 | |||||
| Third Quarter | 154.50 | 117.05 | 153.54 | |||||
| Fourth Quarter | 199.83 | 153.76 | 198.08 | |||||
| 2008 |
First Quarter | 194.97 | 119.15 | 143.50 | ||||
| Second Quarter | 189.96 | 147.14 | 167.44 | |||||
| Third Quarter | 179.69 | 105.26 | 113.66 | |||||
| Fourth Quarter | 111.04 | 80.49 | 85.35 | |||||
| 2009 |
First Quarter | 109.87 | 78.20 | 105.12 | ||||
| Second Quarter | 144.67 | 108.69 | 142.43 | |||||
| Third Quarter | 186.15 | 135.40 | 185.37 | |||||
| Fourth Quarter | 211.64 | 180.76 | 210.86 | |||||
| 2010 |
First Quarter | 235.83 | 192.00 | 234.93 | ||||
| Second Quarter | 274.16 | 235.86 | 251.53 | |||||
| Third Quarter | 292.46 | 240.16 | 283.75 | |||||
| Fourth Quarter | 325.47 | 278.64 | 322.56 | |||||
| 2011 |
First Quarter | 363.13 | 326.72 | 348.45 | ||||
| Second Quarter (through the pricing date) | 353.10 | 327.46 | 335.00 | |||||
|
Capped Leveraged Index Return Notes® |
TS-10 |
The Boeing Company
The Boeing Company, together with its subsidiaries, develops, produces, and markets commercial jet aircraft, as well as provides related support services to the commercial airline industry worldwide. The company also researches, develops, produces, modifies, and supports information, space, and defense systems, including military aircraft, helicopters and space and missile systems. This Basket Stock trades on the New York Stock Exchange under the symbol “BA.”
| High Closing Price |
Low Closing Price |
Period-End Closing Price | ||||||
| 2006 |
First Quarter | 79.18 | 66.49 | 77.93 | ||||
| Second Quarter | 88.94 | 76.98 | 81.91 | |||||
| Third Quarter | 83.75 | 72.80 | 78.85 | |||||
| Fourth Quarter | 91.10 | 79.14 | 88.84 | |||||
| 2007 |
First Quarter | 91.71 | 85.43 | 88.91 | ||||
| Second Quarter | 100.59 | 88.83 | 96.16 | |||||
| Third Quarter | 107.23 | 92.74 | 104.99 | |||||
| Fourth Quarter | 106.65 | 86.62 | 87.46 | |||||
| 2008 |
First Quarter | 86.98 | 72.45 | 74.37 | ||||
| Second Quarter | 87.07 | 65.72 | 65.72 | |||||
| Third Quarter | 69.26 | 55.47 | 57.35 | |||||
| Fourth Quarter | 56.62 | 37.11 | 42.67 | |||||
| 2009 |
First Quarter | 46.31 | 29.36 | 35.58 | ||||
| Second Quarter | 52.83 | 35.44 | 42.50 | |||||
| Third Quarter | 54.62 | 39.04 | 54.15 | |||||
| Fourth Quarter | 56.05 | 47.22 | 54.13 | |||||
| 2010 |
First Quarter | 74.11 | 56.18 | 72.61 | ||||
| Second Quarter | 75.59 | 60.11 | 62.75 | |||||
| Third Quarter | 69.69 | 60.76 | 66.54 | |||||
| Fourth Quarter | 71.66 | 62.50 | 65.26 | |||||
| 2011 |
First Quarter | 73.93 | 66.40 | 73.93 | ||||
| Second Quarter (through the pricing date) | 79.95 | 72.13 | 76.66 | |||||
Cisco Systems, Inc.
Cisco Systems, Inc. supplies data networking products for the Internet. The company’s Internet Protocol-based networking solutions are installed at corporations, public institutions and telecommunication companies worldwide. The company’s solutions transport data, voice, and video within buildings, across campuses, and around the world. This Basket Stock trades on the Nasdaq Global Select Market under the symbol “CSCO.”
| High Closing Price |
Low Closing Price |
Period-End Closing Price | ||||||
| 2006 |
First Quarter | 21.97 | 17.45 | 21.67 | ||||
| Second Quarter | 21.86 | 19.30 | 19.53 | |||||
| Third Quarter | 23.50 | 17.24 | 23.00 | |||||
| Fourth Quarter | 27.63 | 22.98 | 27.33 | |||||
| 2007 |
First Quarter | 28.93 | 25.30 | 25.53 | ||||
| Second Quarter | 28.36 | 25.40 | 27.85 | |||||
| Third Quarter | 33.22 | 27.89 | 33.11 | |||||
| Fourth Quarter | 34.08 | 26.96 | 27.07 | |||||
| 2008 |
First Quarter | 26.75 | 22.86 | 24.09 | ||||
| Second Quarter | 27.54 | 23.11 | 23.26 | |||||
| Third Quarter | 24.91 | 21.04 | 22.56 | |||||
| Fourth Quarter | 21.95 | 14.47 | 16.30 | |||||
| 2009 |
First Quarter | 17.79 | 13.62 | 16.77 | ||||
| Second Quarter | 20.10 | 16.85 | 18.64 | |||||
| Third Quarter | 23.66 | 18.13 | 23.54 | |||||
| Fourth Quarter | 24.38 | 22.67 | 23.94 | |||||
| 2010 |
First Quarter | 26.65 | 22.47 | 26.03 | ||||
| Second Quarter | 27.57 | 21.31 | 21.31 | |||||
| Third Quarter | 24.77 | 20.05 | 21.90 | |||||
| Fourth Quarter | 24.51 | 19.07 | 20.23 | |||||
| 2011 |
First Quarter | 22.06 | 17.00 | 17.15 | ||||
| Second Quarter (through the pricing date) | 18.07 | 16.19 | 16.25 | |||||
|
Capped Leveraged Index Return Notes® |
TS-11 |
Deere & Company
Deere & Company manufactures and distributes a range of agricultural, construction and forestry, and commercial and consumer equipment. The company supplies replacement parts for its own products and for those of other manufacturers. The company also provides product and parts financing services. This Basket Stock trades on the New York Stock Exchange under the symbol “DE.”
| High Closing Price |
Low Closing Price |
Period-End Closing Price | ||||||
| 2006 |
First Quarter | 39.89 | 34.00 | 39.53 | ||||
| Second Quarter | 45.67 | 38.65 | 41.75 | |||||
| Third Quarter | 42.39 | 34.34 | 41.96 | |||||
| Fourth Quarter | 49.07 | 41.80 | 47.54 | |||||
| 2007 |
First Quarter | 57.98 | 45.45 | 54.32 | ||||
| Second Quarter | 62.15 | 52.24 | 60.37 | |||||
| Third Quarter | 74.21 | 58.55 | 74.21 | |||||
| Fourth Quarter | 93.12 | 70.76 | 93.12 | |||||
| 2008 |
First Quarter | 94.69 | 76.40 | 80.44 | ||||
| Second Quarter | 93.35 | 71.38 | 72.13 | |||||
| Third Quarter | 73.47 | 47.76 | 49.50 | |||||
| Fourth Quarter | 46.30 | 28.77 | 38.32 | |||||
| 2009 |
First Quarter | 45.99 | 24.83 | 32.87 | ||||
| Second Quarter | 47.05 | 34.26 | 39.95 | |||||
| Third Quarter | 46.31 | 35.31 | 42.92 | |||||
| Fourth Quarter | 56.59 | 41.13 | 54.09 | |||||
| 2010 |
First Quarter | 61.96 | 48.96 | 59.46 | ||||
| Second Quarter | 62.21 | 54.78 | 55.68 | |||||
| Third Quarter | 73.61 | 54.50 | 69.78 | |||||
| Fourth Quarter | 84.46 | 68.57 | 83.05 | |||||
| 2011 |
First Quarter | 96.89 | 83.02 | 96.89 | ||||
| Second Quarter (through the pricing date) | 99.24 | 83.06 | 84.94 | |||||
Dell Inc.
Dell Inc. offers a wide range of computers and related products. The company sells personal computers, servers and networking products, storage systems, mobility products, software and peripherals, and services. The company serves consumers and businesses in the Americas, Europe, the Middle East, Africa, and the Asia Pacific region. This Basket Stock trades on the Nasdaq Global Select Market under the symbol “DELL.”
| High Closing Price |
Low Closing Price |
Period-End Closing Price | ||||||
| 2006 |
First Quarter | 32.00 | 28.90 | 29.76 | ||||
| Second Quarter | 29.85 | 23.63 | 24.41 | |||||
| Third Quarter | 24.59 | 19.94 | 22.84 | |||||
| Fourth Quarter | 27.62 | 22.72 | 25.09 | |||||
| 2007 |
First Quarter | 27.28 | 21.79 | 23.21 | ||||
| Second Quarter | 28.55 | 23.02 | 28.55 | |||||
| Third Quarter | 29.34 | 25.93 | 27.60 | |||||
| Fourth Quarter | 30.60 | 23.57 | 24.51 | |||||
| 2008 |
First Quarter | 24.39 | 19.07 | 19.92 | ||||
| Second Quarter | 24.45 | 18.24 | 21.88 | |||||
| Third Quarter | 25.63 | 15.41 | 16.48 | |||||
| Fourth Quarter | 16.15 | 9.30 | 10.24 | |||||
| 2009 |
First Quarter | 11.27 | 7.99 | 9.48 | ||||
| Second Quarter | 13.86 | 9.50 | 13.73 | |||||
| Third Quarter | 16.92 | 11.97 | 15.26 | |||||
| Fourth Quarter | 16.07 | 12.81 | 14.36 | |||||
| 2010 |
First Quarter | 15.22 | 12.90 | 15.01 | ||||
| Second Quarter | 17.50 | 12.06 | 12.06 | |||||
| Third Quarter | 13.74 | 11.59 | 12.96 | |||||
| Fourth Quarter | 14.71 | 12.90 | 13.55 | |||||
| 2011 |
First Quarter | 15.83 | 13.15 | 14.51 | ||||
| Second Quarter (through the pricing date) | 16.75 | 14.25 | 15.80 | |||||
|
Capped Leveraged Index Return Notes® |
TS-12 |
Danaher Corporation
Danaher Corporation designs, manufactures and markets professional, medical, industrial and commercial products and services in the sectors of test and measurement, environmental, life sciences, dental, and industrial technologies. This Basket Stock trades on the New York Stock Exchange under the symbol “DHR.”
| High Closing Price |
Low Closing Price |
Period-End Closing Price | ||||||
| 2006 |
First Quarter | 32.27 | 27.15 | 31.78 | ||||
| Second Quarter | 34.11 | 30.62 | 32.16 | |||||
| Third Quarter | 34.34 | 30.20 | 34.34 | |||||
| Fourth Quarter | 37.49 | 33.66 | 36.22 | |||||
| 2007 |
First Quarter | 37.89 | 34.94 | 35.73 | ||||
| Second Quarter | 37.75 | 35.07 | 37.75 | |||||
| Third Quarter | 41.91 | 36.83 | 41.36 | |||||
| Fourth Quarter | 44.31 | 40.22 | 43.87 | |||||
| 2008 |
First Quarter | 43.46 | 35.07 | 38.02 | ||||
| Second Quarter | 41.28 | 36.93 | 38.65 | |||||
| Third Quarter | 42.25 | 34.12 | 34.70 | |||||
| Fourth Quarter | 34.27 | 24.74 | 28.31 | |||||
| 2009 |
First Quarter | 29.27 | 24.02 | 27.11 | ||||
| Second Quarter | 32.00 | 26.26 | 30.87 | |||||
| Third Quarter | 34.31 | 28.88 | 33.66 | |||||
| Fourth Quarter | 38.05 | 32.37 | 37.60 | |||||
| 2010 |
First Quarter | 40.44 | 35.08 | 39.96 | ||||
| Second Quarter | 43.71 | 37.12 | 37.12 | |||||
| Third Quarter | 41.45 | 35.74 | 40.61 | |||||
| Fourth Quarter | 47.37 | 39.72 | 47.17 | |||||
| 2011 |
First Quarter | 51.96 | 46.05 | 51.90 | ||||
| Second Quarter (through the pricing date) | 55.77 | 51.55 | 53.64 | |||||
Emerson Electric Co.
Emerson Electric Co. manufactures and markets electrical, electromechanical, and electronic products and systems. The company produces a variety of products, including process control, industrial automation, electronics, appliance components, and electric motors. The company sells its products around the world. This Basket Stock trades on the New York Stock Exchange under the symbol “EMR.”
| High Closing Price |
Low Closing Price |
Period-End Closing Price | ||||||
| 2006 |
First Quarter | 42.84 | 37.54 | 41.82 | ||||
| Second Quarter | 43.74 | 39.31 | 41.91 | |||||
| Third Quarter | 42.03 | 38.08 | 41.93 | |||||
| Fourth Quarter | 44.52 | 41.11 | 44.09 | |||||
| 2007 |
First Quarter | 45.80 | 42.11 | 43.09 | ||||
| Second Quarter | 49.11 | 41.85 | 46.80 | |||||
| Third Quarter | 53.37 | 45.42 | 53.22 | |||||
| Fourth Quarter | 58.32 | 50.50 | 56.66 | |||||
| 2008 |
First Quarter | 55.83 | 47.88 | 51.46 | ||||
| Second Quarter | 58.20 | 48.17 | 49.45 | |||||
| Third Quarter | 50.94 | 38.46 | 40.79 | |||||
| Fourth Quarter | 39.19 | 29.98 | 36.61 | |||||
| 2009 |
First Quarter | 39.10 | 24.87 | 28.58 | ||||
| Second Quarter | 37.35 | 29.53 | 32.40 | |||||
| Third Quarter | 41.24 | 30.63 | 40.08 | |||||
| Fourth Quarter | 43.37 | 37.75 | 42.60 | |||||
| 2010 |
First Quarter | 50.81 | 41.54 | 50.34 | ||||
| Second Quarter | 53.62 | 43.29 | 43.69 | |||||
| Third Quarter | 53.46 | 43.40 | 52.66 | |||||
| Fourth Quarter | 58.68 | 52.76 | 57.17 | |||||
| 2011 |
First Quarter | 61.85 | 56.35 | 58.43 | ||||
| Second Quarter (through the pricing date) | 60.81 | 52.82 | 54.04 | |||||
|
Capped Leveraged Index Return Notes® |
TS-13 |
Honeywell International, Inc.
Honeywell International Inc. is a diversified technology and manufacturing company with operations around the world. The company provides aerospace products and services, control technologies, automotive products, and power generation systems. Honeywell also provides specialty chemicals, fibers, plastics, and electronic and advanced materials. This Basket Stock trades on the New York Stock Exchange under the symbol “HON.”
| High Closing Price |
Low Closing Price |
Period-End Closing Price | ||||||
| 2006 |
First Quarter | 42.85 | 35.84 | 42.77 | ||||
| Second Quarter | 44.16 | 37.62 | 40.30 | |||||
| Third Quarter | 41.37 | 36.21 | 40.90 | |||||
| Fourth Quarter | 45.46 | 41.35 | 45.24 | |||||
| 2007 |
First Quarter | 48.31 | 44.13 | 46.06 | ||||
| Second Quarter | 58.87 | 46.15 | 56.28 | |||||
| Third Quarter | 61.45 | 54.12 | 59.47 | |||||
| Fourth Quarter | 61.77 | 53.19 | 61.57 | |||||
| 2008 |
First Quarter | 60.48 | 53.95 | 56.42 | ||||
| Second Quarter | 62.43 | 49.14 | 50.28 | |||||
| Third Quarter | 52.73 | 40.37 | 41.55 | |||||
| Fourth Quarter | 39.68 | 23.67 | 32.83 | |||||
| 2009 |
First Quarter | 36.04 | 23.23 | 27.86 | ||||
| Second Quarter | 35.79 | 28.31 | 31.40 | |||||
| Third Quarter | 40.17 | 29.31 | 37.15 | |||||
| Fourth Quarter | 41.31 | 35.60 | 39.20 | |||||
| 2010 |
First Quarter | 45.27 | 36.87 | 45.27 | ||||
| Second Quarter | 48.52 | 39.03 | 39.03 | |||||
| Third Quarter | 44.46 | 38.53 | 43.94 | |||||
| Fourth Quarter | 53.72 | 43.61 | 53.16 | |||||
| 2011 |
First Quarter | 59.71 | 53.48 | 59.71 | ||||
| Second Quarter (through the pricing date) | 62.00 | 57.11 | 58.50 | |||||
Hewlett-Packard Company
Hewlett-Packard Company provides imaging and printing systems, computing systems, and information technology services for business and home. The company’s products include laser and inkjet printers, scanners, copiers and faxes, personal computers, workstations, storage solutions, and other computing and printing systems. This Basket Stock trades on the New York Stock Exchange under the symbol “HPQ.”
| High Closing Price |
Low Closing Price |
Period-End Closing Price | ||||||
| 2006 |
First Quarter | 34.19 | 28.77 | 32.90 | ||||
| Second Quarter | 34.36 | 29.79 | 31.68 | |||||
| Third Quarter | 36.92 | 30.52 | 36.69 | |||||
| Fourth Quarter | 41.60 | 37.42 | 41.19 | |||||
| 2007 |
First Quarter | 43.53 | 38.67 | 40.14 | ||||
| Second Quarter | 46.03 | 40.31 | 44.62 | |||||
| Third Quarter | 50.98 | 44.94 | 49.79 | |||||
| Fourth Quarter | 53.41 | 47.54 | 50.48 | |||||
| 2008 |
First Quarter | 49.65 | 40.50 | 45.66 | ||||
| Second Quarter | 49.13 | 44.21 | 44.21 | |||||
| Third Quarter | 48.41 | 41.45 | 46.24 | |||||
| Fourth Quarter | 44.97 | 29.34 | 36.29 | |||||
| 2009 |
First Quarter | 39.31 | 25.53 | 32.06 | ||||
| Second Quarter | 38.98 | 32.88 | 38.65 | |||||
| Third Quarter | 47.88 | 36.84 | 47.21 | |||||
| Fourth Quarter | 52.93 | 45.28 | 51.51 | |||||
| 2010 |
First Quarter | 53.50 | 47.03 | 53.15 | ||||
| Second Quarter | 54.52 | 43.28 | 43.28 | |||||
| Third Quarter | 47.57 | 38.00 | 42.07 | |||||
| Fourth Quarter | 44.25 | 40.64 | 42.10 | |||||
| 2011 |
First Quarter | 48.99 | 40.13 | 40.97 | ||||
| Second Quarter (through the pricing date) | 41.57 | 35.81 | 36.55 | |||||
|
Capped Leveraged Index Return Notes® |
TS-14 |
International Business Machines Corporation
International Business Machines Corporation provides computer solutions through the use of advanced information technology. The company’s solutions include technologies, systems, products, services, software, and financing. The company offers its products through its global sales and distribution organization, as well as through a variety of third party distributors and resellers. This Basket Stock trades on the New York Stock Exchange under the symbol “IBM.”
| High Closing Price |
Low Closing Price |
Period-End Closing Price | ||||||
| 2006 |
First Quarter | 84.95 | 79.51 | 82.47 | ||||
| Second Quarter | 84.17 | 76.56 | 76.82 | |||||
| Third Quarter | 83.42 | 73.57 | 81.94 | |||||
| Fourth Quarter | 97.15 | 81.65 | 97.15 | |||||
| 2007 |
First Quarter | 100.82 | 90.90 | 94.26 | ||||
| Second Quarter | 107.99 | 94.29 | 105.25 | |||||
| Third Quarter | 118.19 | 105.01 | 117.80 | |||||
| Fourth Quarter | 119.60 | 100.65 | 108.10 | |||||
| 2008 |
First Quarter | 119.06 | 97.50 | 115.14 | ||||
| Second Quarter | 129.71 | 114.81 | 118.53 | |||||
| Third Quarter | 130.00 | 111.47 | 116.96 | |||||
| Fourth Quarter | 110.13 | 71.74 | 84.16 | |||||
| 2009 |
First Quarter | 98.78 | 81.98 | 96.89 | ||||
| Second Quarter | 109.40 | 97.61 | 104.42 | |||||
| Third Quarter | 122.11 | 100.19 | 119.61 | |||||
| Fourth Quarter | 132.57 | 117.90 | 130.90 | |||||
| 2010 |
First Quarter | 134.14 | 121.88 | 128.25 | ||||
| Second Quarter | 132.68 | 122.10 | 123.48 | |||||
| Third Quarter | 135.48 | 121.86 | 134.14 | |||||
| Fourth Quarter | 146.92 | 135.25 | 146.76 | |||||
| 2011 |
First Quarter | 166.05 | 147.05 | 163.07 | ||||
| Second Quarter (through the pricing date) | 172.87 | 163.25 | 167.18 | |||||
Illinois Tool Works Inc.
Illinois Tool Works Inc. designs and manufactures fasteners and components, equipment and consumable systems, and a variety of specialty products and equipment. The company’s products include industrial fluids and adhesives, tooling for specialty applications, welding products, and quality measurement equipment and systems. This Basket Stock trades on the New York Stock Exchange under the symbol “ITW.”
| High Closing Price |
Low Closing Price |
Period-End Closing Price | ||||||
| 2006 |
First Quarter | 49.21 | 42.00 | 48.16 | ||||
| Second Quarter | 53.29 | 46.79 | 47.50 | |||||
| Third Quarter | 47.51 | 42.93 | 44.90 | |||||
| Fourth Quarter | 49.99 | 45.20 | 46.19 | |||||
| 2007 |
First Quarter | 53.43 | 45.89 | 51.60 | ||||
| Second Quarter | 55.85 | 51.25 | 54.19 | |||||
| Third Quarter | 59.64 | 51.89 | 59.64 | |||||
| Fourth Quarter | 60.00 | 51.93 | 53.54 | |||||
| 2008 |
First Quarter | 52.17 | 46.27 | 48.23 | ||||
| Second Quarter | 55.23 | 46.36 | 47.51 | |||||
| Third Quarter | 50.00 | 42.80 | 44.45 | |||||
| Fourth Quarter | 42.61 | 28.75 | 35.05 | |||||
| 2009 |
First Quarter | 37.00 | 26.19 | 30.85 | ||||
| Second Quarter | 38.08 | 30.60 | 37.34 | |||||
| Third Quarter | 44.45 | 34.86 | 42.71 | |||||
| Fourth Quarter | 51.02 | 41.53 | 47.99 | |||||
| 2010 |
First Quarter | 49.95 | 42.25 | 47.36 | ||||
| Second Quarter | 52.50 | 41.28 | 41.28 | |||||
| Third Quarter | 47.25 | 40.77 | 47.02 | |||||
| Fourth Quarter | 53.73 | 45.70 | 53.40 | |||||
| 2011 |
First Quarter | 56.15 | 53.02 | 53.72 | ||||
| Second Quarter (through the pricing date) | 58.41 | 52.60 | 56.99 | |||||
|
Capped Leveraged Index Return Notes® |
TS-15 |
Juniper Networks, Inc.
Juniper Networks, Inc. provides Internet infrastructure solutions for Internet service providers and other telecommunications service providers. The company offers network infrastructure solutions that includes IP routing, Ethernet switching, security and application acceleration solutions. This Basket Stock trades on the New York Stock Exchange under the symbol “JNPR.” Prior to October 29, 2009, this Basket Stock traded on The Nasdaq Stock Market under the symbol “JNPR.”
| High Closing Price |
Low Closing Price |
Period-End Closing Price | ||||||
| 2006 |
First Quarter | 22.38 | 17.06 | 19.12 | ||||
| Second Quarter | 20.30 | 14.55 | 15.99 | |||||
| Third Quarter | 17.34 | 12.20 | 17.28 | |||||
| Fourth Quarter | 21.56 | 16.77 | 18.94 | |||||
| 2007 |
First Quarter | 20.77 | 17.74 | 19.68 | ||||
| Second Quarter | 25.51 | 20.09 | 25.17 | |||||
| Third Quarter | 37.09 | 25.79 | 36.61 | |||||
| Fourth Quarter | 37.63 | 28.55 | 33.20 | |||||
| 2008 |
First Quarter | 32.47 | 24.26 | 25.00 | ||||
| Second Quarter | 29.01 | 22.18 | 22.18 | |||||
| Third Quarter | 26.99 | 21.00 | 21.07 | |||||
| Fourth Quarter | 19.99 | 13.84 | 17.51 | |||||
| 2009 |
First Quarter | 18.77 | 12.67 | 15.06 | ||||
| Second Quarter | 25.34 | 15.62 | 23.60 | |||||
| Third Quarter | 27.75 | 22.69 | 27.02 | |||||
| Fourth Quarter | 28.22 | 24.70 | 26.67 | |||||
| 2010 |
First Quarter | 30.88 | 24.49 | 30.68 | ||||
| Second Quarter | 31.98 | 22.82 | 22.82 | |||||
| Third Quarter | 31.26 | 23.00 | 30.35 | |||||
| Fourth Quarter | 37.90 | 30.30 | 36.92 | |||||
| 2011 |
First Quarter | 44.46 | 34.82 | 42.08 | ||||
| Second Quarter (through the pricing date) | 41.26 | 36.55 | 36.98 | |||||
Microsoft Corporation
Microsoft Corporation develops, manufactures, licenses, sells, and supports software products. The company offers operating system software, server application software, business and consumer applications software, software development tools, and Internet and intranet software. The company also develops video game consoles and digital music entertainment devices. This Basket Stock trades on the Nasdaq Global Select Market under the symbol “MSFT.”
| High Closing Price |
Low Closing Price |
Period-End Closing Price | ||||||
| 2006 |
First Quarter | 28.15 | 26.28 | 27.21 | ||||
| Second Quarter | 27.74 | 21.51 | 23.30 | |||||
| Third Quarter | 27.45 | 22.25 | 27.33 | |||||
| Fourth Quarter | 30.19 | 27.34 | 29.86 | |||||
| 2007 |
First Quarter | 31.21 | 26.72 | 27.87 | ||||
| Second Quarter | 31.11 | 27.74 | 29.47 | |||||
| Third Quarter | 31.51 | 27.81 | 29.46 | |||||
| Fourth Quarter | 37.06 | 29.47 | 35.60 | |||||
| 2008 |
First Quarter | 35.37 | 26.99 | 28.38 | ||||
| Second Quarter | 31.65 | 27.12 | 27.51 | |||||
| Third Quarter | 28.13 | 24.57 | 26.69 | |||||
| Fourth Quarter | 26.48 | 17.53 | 19.44 | |||||
| 2009 |
First Quarter | 20.76 | 15.15 | 18.37 | ||||
| Second Quarter | 24.07 | 18.61 | 23.77 | |||||
| Third Quarter | 25.94 | 22.39 | 25.89 | |||||
| Fourth Quarter | 31.37 | 24.64 | 30.49 | |||||
| 2010 |
First Quarter | 31.10 | 27.72 | 29.27 | ||||
| Second Quarter | 31.39 | 23.01 | 23.01 | |||||
| Third Quarter | 26.33 | 23.16 | 24.49 | |||||
| Fourth Quarter | 28.30 | 23.91 | 27.92 | |||||
| 2011 |
First Quarter | 28.83 | 24.78 | 25.36 | ||||
| Second Quarter (through the pricing date) | 26.72 | 24.15 | 24.67 | |||||
|
Capped Leveraged Index Return Notes® |
TS-16 |
Oracle Corporation
Oracle Corporation supplies software for enterprise information management. The company offers databases and relational servers, application development and decision support tools, and enterprise business applications. The company’s software runs on network computers, personal digital assistants, set-top devices, PCs, workstations, minicomputers, mainframes, and massively parallel computers. This Basket Stock trades on the Nasdaq Global Select Market under the symbol “ORCL.”
| High Closing Price |
Low Closing Price |
Period-End Closing Price | ||||||
| 2006 |
First Quarter | 13.99 | 12.20 | 13.69 | ||||
| Second Quarter | 14.93 | 13.18 | 14.49 | |||||
| Third Quarter | 18.23 | 14.10 | 17.74 | |||||
| Fourth Quarter | 19.66 | 17.10 | 17.14 | |||||
| 2007 |
First Quarter | 18.49 | 16.29 | 18.13 | ||||
| Second Quarter | 19.88 | 18.14 | 19.71 | |||||
| Third Quarter | 21.99 | 19.11 | 21.65 | |||||
| Fourth Quarter | 23.04 | 19.36 | 22.58 | |||||
| 2008 |
First Quarter | 23.07 | 18.44 | 19.56 | ||||
| Second Quarter | 23.18 | 19.84 | 21.00 | |||||
| Third Quarter | 23.52 | 18.10 | 20.31 | |||||
| Fourth Quarter | 19.86 | 15.40 | 17.73 | |||||
| 2009 |
First Quarter | 18.68 | 13.85 | 18.07 | ||||
| Second Quarter | 21.63 | 18.07 | 21.42 | |||||
| Third Quarter | 22.86 | 20.18 | 20.84 | |||||
| Fourth Quarter | 25.01 | 20.34 | 24.54 | |||||
| 2010 |
First Quarter | 26.04 | 23.06 | 25.69 | ||||
| Second Quarter | 26.51 | 21.46 | 21.46 | |||||
| Third Quarter | 27.50 | 21.55 | 26.85 | |||||
| Fourth Quarter | 31.76 | 26.90 | 31.30 | |||||
| 2011 |
First Quarter | 33.69 | 30.14 | 33.37 | ||||
| Second Quarter (through the pricing date) | 36.37 | 32.99 | 33.40 | |||||
QUALCOMM, Inc.
QUALCOMM, Inc. manufactures digital wireless communications equipment. The company licenses its code division multiple access (CDMA) and orthogonal frequency division multiplexing access intellectual property to other companies, and produces CDMA-based integrated circuits; and produces equipment and software used to track workers and assets; and software for wireless content enablement. This Basket Stock trades on the Nasdaq Global Select Market under the symbol “QCOM.”
| High Closing Price |
Low Closing Price |
Period-End Closing Price | ||||||
| 2006 |
First Quarter | 50.85 | 44.00 | 50.61 | ||||
| Second Quarter | 52.74 | 38.69 | 40.07 | |||||
| Third Quarter | 39.46 | 33.31 | 36.35 | |||||
| Fourth Quarter | 39.84 | 34.66 | 37.79 | |||||
| 2007 |
First Quarter | 43.73 | 37.15 | 42.66 | ||||
| Second Quarter | 46.38 | 41.02 | 43.39 | |||||
| Third Quarter | 45.35 | 36.09 | 42.26 | |||||
| Fourth Quarter | 43.38 | 37.29 | 39.35 | |||||
| 2008 |
First Quarter | 43.79 | 35.97 | 41.00 | ||||
| Second Quarter | 50.42 | 41.19 | 44.37 | |||||
| Third Quarter | 56.39 | 39.88 | 42.97 | |||||
| Fourth Quarter | 42.48 | 29.21 | 35.83 | |||||
| 2009 |
First Quarter | 39.54 | 32.78 | 38.91 | ||||
| Second Quarter | 46.34 | 39.36 | 45.2 | |||||
| Third Quarter | 48.45 | 43.06 | 44.98 | |||||
| Fourth Quarter | 46.86 | 40.68 | 46.26 | |||||
| 2010 |
First Quarter | 49.47 | 35.56 | 41.99 | ||||
| Second Quarter | 43.29 | 32.84 | 32.84 | |||||
| Third Quarter | 45.12 | 31.96 | 45.12 | |||||
| Fourth Quarter | 49.99 | 43.89 | 49.49 | |||||
| 2011 |
First Quarter | 59.58 | 50.21 | 54.83 | ||||
| Second Quarter (through the pricing date) | 58.17 | 52.25 | 57.17 | |||||
|
Capped Leveraged Index Return Notes® |
TS-17 |
Texas Instruments Incorporated
Texas Instruments Incorporated is a global semiconductor company that designs and supplies analog technologies, digital signal processing (DSP) and microcontroller (MCU) semiconductors. The company also operates materials and controls, and educational and productivity solutions businesses. The company has manufacturing or sales operations in countries around the world. This Basket Stock trades on the New York Stock Exchange under the symbol “TXN.”
| High Closing Price |
Low Closing Price |
Period-End Closing Price | ||||||
| 2006 |
First Quarter | 34.45 | 29.23 | 32.47 | ||||
| Second Quarter | 35.56 | 28.90 | 30.29 | |||||
| Third Quarter | 33.89 | 27.00 | 33.25 | |||||
| Fourth Quarter | 33.06 | 28.55 | 28.80 | |||||
| 2007 |
First Quarter | 32.59 | 28.32 | 30.10 | ||||
| Second Quarter | 37.78 | 29.90 | 37.63 | |||||
| Third Quarter | 39.18 | 32.32 | 36.59 | |||||
| Fourth Quarter | 36.81 | 30.41 | 33.40 | |||||
| 2008 |
First Quarter | 32.35 | 28.11 | 28.27 | ||||
| Second Quarter | 32.70 | 28.16 | 28.16 | |||||
| Third Quarter | 29.13 | 21.50 | 21.50 | |||||
| Fourth Quarter | 21.64 | 14.01 | 15.52 | |||||
| 2009 |
First Quarter | 17.38 | 13.77 | 16.51 | ||||
| Second Quarter | 21.66 | 16.25 | 21.30 | |||||
| Third Quarter | 25.14 | 20.42 | 23.69 | |||||
| Fourth Quarter | 26.85 | 22.49 | 26.06 | |||||
| 2010 |
First Quarter | 26.34 | 22.50 | 24.47 | ||||
| Second Quarter | 27.16 | 23.28 | 23.28 | |||||
| Third Quarter | 27.14 | 23.03 | 27.14 | |||||
| Fourth Quarter | 33.75 | 27.21 | 32.50 | |||||
| 2011 |
First Quarter | 36.56 | 32.67 | 34.56 | ||||
| Second Quarter (through the pricing date) | 35.90 | 34.08 | 34.32 | |||||
United Technologies Corporation
United Technologies Corporation provides technology products and support services to customers in the aerospace and building industries worldwide. The company’s products include aircraft engines, elevators and escalators, heating and air conditioning equipment, helicopters, aerospace systems, fuel cell systems, and fire and safety equipment. This Basket Stock trades on the New York Stock Exchange under the symbol “UTX.”
| High Closing Price |
Low Closing Price |
Period-End Closing Price | ||||||
| 2006 |
First Quarter | 59.28 | 54.47 | 57.97 | ||||
| Second Quarter | 66.15 | 57.14 | 63.42 | |||||
| Third Quarter | 64.61 | 57.96 | 63.35 | |||||
| Fourth Quarter | 66.79 | 62.06 | 62.52 | |||||
| 2007 |
First Quarter | 68.93 | 62.47 | 65.00 | ||||
| Second Quarter | 72.19 | 64.08 | 70.93 | |||||
| Third Quarter | 80.69 | 71.08 | 80.48 | |||||
| Fourth Quarter | 82.07 | 72.78 | 76.54 | |||||
| 2008 |
First Quarter | 76.28 | 66.23 | 68.82 | ||||
| Second Quarter | 75.16 | 61.15 | 61.70 | |||||
| Third Quarter | 67.42 | 56.66 | 60.06 | |||||
| Fourth Quarter | 59.12 | 43.22 | 53.60 | |||||
| 2009 |
First Quarter | 54.95 | 37.56 | 42.98 | ||||
| Second Quarter | 56.49 | 43.88 | 51.96 | |||||
| Third Quarter | 63.23 | 49.43 | 60.93 | |||||
| Fourth Quarter | 70.49 | 59.63 | 69.41 | |||||
| 2010 |
First Quarter | 74.13 | 65.40 | 73.61 | ||||
| Second Quarter | 76.93 | 63.22 | 64.91 | |||||
| Third Quarter | 73.39 | 64.29 | 71.23 | |||||
| Fourth Quarter | 79.52 | 70.53 | 78.72 | |||||
| 2011 |
First Quarter | 85.21 | 78.33 | 84.65 | ||||
| Second Quarter (through the pricing date) | 90.00 | 81.70 | 86.39 | |||||
|
Capped Leveraged Index Return Notes® |
TS-18 |
Validity of the LIRNs
In the opinion of McGuireWoods LLP, as counsel to BAC, when the LIRNs offered by this Note Prospectus have been completed and executed by BAC, and authenticated by the trustee in accordance with the provisions of the Senior Indenture, and delivered against payment therefor as contemplated by this Note Prospectus, such LIRNs will be legal, valid and binding obligations of BAC, subject to applicable bankruptcy, reorganization, insolvency, moratorium, fraudulent conveyance or other similar laws affecting the rights of creditors now or hereafter in effect, and to equitable principles that may limit the right to specific enforcement of remedies, and further subject to 12 U.S.C. §1818(b)(6)(D) (or any successor statute) and any bank regulatory powers now or hereafter in effect and to the application of principles of public policy. This opinion is given as of the date hereof and is limited to the Federal laws of the United States, the laws of the State of New York and the Delaware General Corporation Law (including the statutory provisions, all applicable provisions of the Delaware Constitution and reported judicial decisions interpreting the foregoing). In addition, this opinion is subject to customary assumptions about the trustee’s authorization, execution and delivery of the Senior Indenture, the validity, binding nature and enforceability of the Senior Indenture with respect to the trustee, the legal capacity of natural persons, the genuineness of signatures, the authenticity of all documents submitted to McGuireWoods LLP as originals, the conformity to original documents of all documents submitted to McGuireWoods LLP as photocopies, the authenticity of the originals of such copies and certain factual matters, all as stated in the letter of McGuireWoods LLP dated April 28, 2011, which has been filed as an exhibit to our Current Report on Form 8-K dated April 28, 2011.
|
Capped Leveraged Index Return Notes® |
TS-19 |
Summary Tax Consequences
You should consider the U.S. federal income tax consequences of an investment in the LIRNs, including the following:
| • | You agree with us (in the absence of an administrative determination, or judicial ruling to the contrary) to characterize and treat the LIRNs for all tax purposes as a single financial contract with respect to the Basket that requires you to pay us at inception an amount equal to the purchase price of the LIRNs and that entitles you to receive at maturity an amount in cash based upon the performance of the Basket. |
| • | Under this characterization and tax treatment of the LIRNs, upon receipt of a cash payment at maturity or upon a sale or exchange of the LIRNs prior to maturity, you generally will recognize capital gain or loss. This capital gain or loss generally will be long-term capital gain or loss if you held the LIRNs for more than one year. |
Certain U.S. Federal Income Taxation Considerations
Set forth below is a summary of certain U.S. federal income tax considerations relating to an investment in the LIRNs. The following summary is not complete and is qualified in its entirety by the discussion under the section entitled “U.S. Federal Income Tax Summary” beginning on page S-32 of product supplement STOCK LIRN-1, which you should carefully review prior to investing in the LIRNs.
General. Although there is no statutory, judicial, or administrative authority directly addressing the characterization of the LIRNs, we intend to treat the LIRNs for all tax purposes as a single financial contract with respect to the Basket that requires the investor to pay us at inception an amount equal to the purchase price of the LIRNs and that entitles the investor to receive at maturity an amount in cash based upon the performance of the Basket. Under the terms of the LIRNs, we and every investor in the LIRNs agree, in the absence of an administrative determination or judicial ruling to the contrary, to treat the LIRNs as described in the preceding sentence. This discussion assumes that the LIRNs constitute a single financial contract with respect to the Basket for U.S. federal income tax purposes. If the LIRNs did not constitute a single financial contract, the tax consequences described below would be materially different. The discussion in this section also assumes that there is a significant possibility of a significant loss of principal on an investment in the LIRNs.
This characterization of the LIRNs is not binding on the Internal Revenue Service (“IRS”) or the courts. No statutory, judicial, or administrative authority directly addresses the characterization of the LIRNs or any similar instruments for U.S. federal income tax purposes, and no ruling is being requested from the IRS with respect to their proper characterization and treatment. Due to the absence of authorities on point, significant aspects of the U.S. federal income tax consequences of an investment in the LIRNs are not certain, and no assurance can be given that the IRS or any court will agree with the characterization and tax treatment described in product supplement STOCK LIRN-1. Accordingly, you are urged to consult your tax advisor regarding all aspects of the U.S. federal income tax consequences of an investment in the LIRNs, including possible alternative characterizations.
Settlement at Maturity or Sale or Exchange Prior to Maturity. Assuming that the LIRNs are properly characterized and treated as single financial contracts with respect to the Basket for U.S. federal income tax purposes, upon receipt of a cash payment at maturity or upon a sale or exchange of the LIRNs prior to maturity, a U.S. Holder (as defined on page S-33 of product supplement STOCK LIRN-1) generally will recognize capital gain or loss equal to the difference between the amount realized and the U.S. Holder’s basis in the LIRNs. This capital gain or loss generally will be long-term capital gain or loss if the U.S. Holder held the LIRNs for more than one year. The deductibility of capital losses is subject to limitations.
Possible Future Tax Law Changes. From time to time, there may be legislative proposals or interpretive guidance addressing the tax treatment of financial instruments such as the LIRNs. We cannot predict the likelihood of any such legislation or guidance being adopted, or the ultimate impact on the LIRNs. For example, on December 7, 2007, the IRS released Notice 2008-2 (“Notice”) seeking comments from the public on the taxation of financial instruments currently taxed as “prepaid forward contracts.” This Notice addresses instruments such as the LIRNs. According to the Notice, the IRS and Treasury are considering whether a holder of an instrument such as the LIRNs should be required to accrue ordinary income on a current basis, regardless of whether any payments are made prior to maturity. It is not possible to determine what guidance the IRS and Treasury will ultimately issue, if any. Any such future guidance may affect the amount, timing, and character of income, gain, or loss in respect of the LIRNs, possibly with retroactive effect. The IRS and Treasury are also considering additional issues, including whether additional gain or loss from such instruments should be treated as ordinary or capital, whether foreign holders of such instruments should be subject to withholding tax on any deemed income accruals, whether Section 1260 of the Internal Revenue Code of 1986, as amended, concerning certain “constructive ownership transactions,” generally applies or should generally apply to such instruments, and whether any of these determinations depend on the nature of the underlying asset. We urge you to consult your own tax advisors concerning the impact and the significance of the above considerations. We intend to continue treating the LIRNs for U.S. federal income tax purposes in the manner described herein unless and until such time as we determine, or the IRS or Treasury determines, that some other treatment is more appropriate.
You should consult your own tax advisor concerning the U.S. federal income tax consequences to you of acquiring, owning, and disposing of the LIRNs, as well as any tax consequences arising under the laws of any state, local, foreign, or other tax jurisdiction and the possible effects of changes in U.S. federal or other tax laws. See the discussion under the section entitled “U.S. Federal Income Tax Summary” beginning on page S-32 of product supplement STOCK LIRN-1.
|
Capped Leveraged Index Return Notes® |
TS-20 |
Additional Terms
You should read this term sheet, together with the documents listed below, which together contain the terms of the LIRNs and supersede all prior or contemporaneous oral statements as well as any other written materials. You should carefully consider, among other things, the matters set forth under “Risk Factors” and “Additional Risk Factor” in the sections indicated on the cover of this term sheet. The LIRNs involve risks not associated with conventional debt securities. We urge you to consult your investment, legal, tax, accounting, and other advisors before you invest in the LIRNs.
You may access the following documents on the SEC Website at www.sec.gov as follows (or if such address has changed, by reviewing our filings for the relevant date on the SEC Website):
| § | Product supplement STOCK LIRN-1 dated May 3, 2011: |
http://www.sec.gov/Archives/edgar/data/70858/000119312511123502/d424b5.htm
| § | Series L MTN prospectus supplement dated April 21, 2009 and prospectus dated April 20, 2009: |
http://www.sec.gov/Archives/edgar/data/70858/000095014409003387/g18667b5e424b5.htm
Our Central Index Key, or CIK, on the SEC Website is 70858.
We have filed a registration statement (including a product supplement, a prospectus supplement, and a prospectus) with the SEC for the offering to which this term sheet relates. Before you invest, you should read the product supplement, the prospectus supplement, and the prospectus in that registration statement, and the other documents relating to this offering that we have filed with the SEC for more complete information about us and this offering. You may get these documents without cost by visiting EDGAR on the SEC Website at www.sec.gov. Alternatively, we, any agent, or any dealer participating in this offering will arrange to send you the Note Prospectus if you so request by calling MLPF&S toll-free at 1-866-500-5408.
Market-Linked Investments Classification
Market-Linked Investments come in four basic categories, each designed to meet a different set of investor risk profiles, time horizons, income requirements, and market views (bullish, bearish, moderate outlook, etc.). The following descriptions of these categories are meant solely for informational purposes and are not intended to represent any particular Market-Linked Investment or guarantee performance. Certain Market-Linked Investments may have overlapping characteristics.

Market Downside Protection Market-Linked Investments combine some of the capital preservation features of traditional bonds with the growth potential of equities and other asset classes. They offer full or partial market downside protection at maturity, while offering market exposure that may provide better returns than comparable fixed income securities. It is important to note that the market downside protection feature provides investors with protection only at maturity, subject to issuer credit risk. In addition, in exchange for full or partial protection, you forfeit dividends and full exposure to the linked asset’s upside. In some circumstances, this could result in a lower return than with a direct investment in the asset.

These short- to medium-term market-linked notes offer you a way to enhance your income stream, either through variable or fixed-interest coupons, an added payout at maturity based on the performance of the linked asset, or both. In exchange for receiving current income, you will generally forfeit upside potential on the linked asset. Even so, the prospect of higher interest payments and/or an additional payout may equate to a higher return potential than you may be able to find through other fixed-income securities. Enhanced Income Market-Linked Investments generally do not include market downside protection. The degree to which your principal is repaid at maturity is generally determined by the performance of the linked asset. Although enhanced income streams may help offset potential declines in the asset, you can still lose part or all of your original investment.

Market Access notes may offer exposure to certain market sectors, asset classes, and/or strategies that may not even be available through the other three categories of Market-Linked Investments. Subject to certain fees, the returns on Market Access Market- Linked Investments will generally correspond on a one-to-one basis with any increases or decreases in the value of the linked asset, similar to a direct investment. In some instances, they may also provide interim coupon payments. These investments do not include the market downside protection feature and, therefore, your principal remains at risk.

These short- to medium-term investments offer you a way to enhance exposure to a particular market view without taking on a similarly enhanced level of market downside risk. They can be especially effective in a flat to moderately positive market (or, in the case of bearish investments, a flat to moderately negative market). In exchange for the potential to receive better-than market returns on the linked asset, you must generally accept a degree of market downside risk and capped upside potential. As these investments are not market downside protected, and do not assure full repayment of principal at maturity, you need to be prepared for the possibility that you may lose all or part of your investment.
“Leveraged Index Return Notes®” and “LIRNs®” are our registered service marks.
|
Capped Leveraged Index Return Notes® |
TS-21 |