Filed Pursuant to Rule 433
Registration No. 333-158663
Subject to Completion
Preliminary Term Sheet dated July 22, 2011
The notes are being offered by Bank of America Corporation (“BAC”). The notes will have the terms specified in this term sheet as supplemented by the documents indicated below under “Additional Terms” (together, the “Note Prospectus”). Investing in the notes involves a number of risks. There are important differences between the notes and a conventional debt security, including different investment risks. See “Risk Factors” on page TS-6 of this term sheet and beginning on page S-8 of product supplement VCN-2. The notes:
|
Are Not FDIC Insured
|
Are Not Bank Guaranteed
|
May Lose Value
|
In connection with this offering, Merrill Lynch, Pierce, Fenner & Smith Incorporated (“MLPF&S”) is acting in its capacity as principal for your account.
None of the Securities and Exchange Commission (the “SEC”), any state securities commission, or any other regulatory body has approved or disapproved of these securities or determined if this Note Prospectus is truthful or complete. Any representation to the contrary is a criminal offense.
| Per Unit |
Total |
|||||||
| Public offering price(1) |
$10.000 | $ | ||||||
| Underwriting discount(1) |
$0.225 | $ | ||||||
| Proceeds, before expenses, to Bank of America Corporation |
$9.775 | $ | ||||||
| (1) | The public offering price and underwriting discount for any purchase of 500,000 units or more in a single transaction by an individual investor will be $9.95 per unit and $0.175 per unit, respectively. The public offering price and underwriting discount for any purchase by certain fee-based trusts and fee-based discretionary accounts managed by U.S. Trust operating through Bank of America, N.A. will be $9.775 per unit and $0.00 per unit, respectively. |
*Depending on the date the notes are priced for initial sale to the public (the “pricing date”), any reference in this term sheet to the month in which the pricing date, settlement date, coupon payment dates, coupon determination dates, or maturity date will occur is subject to change.
| Merrill Lynch & Co.
|

| |||
| August , 2011 |
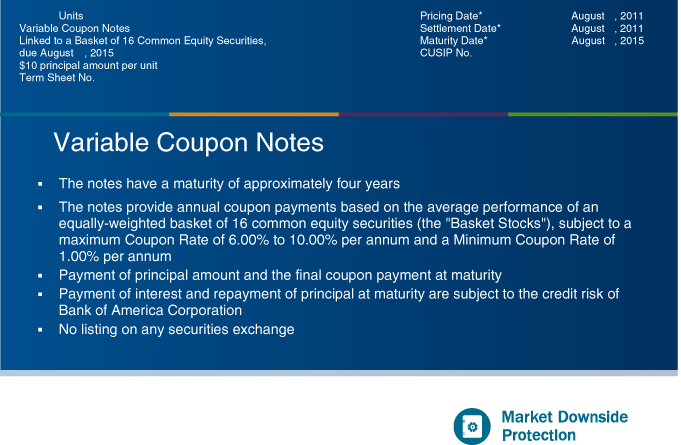
Units Pricing Date* August , 2011
Variable Coupon Notes Settlement Date* August, 2011
Linked to a Basket of 16 Common Equity Securities, Maturity Date* August, 2015
due August, 2015 CUSIP No.
$10 principal amount per unit
Term Sheet No.
Variable Coupon Notes
The notes have a maturity of approximately four years
The notes provide annual coupon payments based on the average performance of an equally-weighted basket of 16 common equity securities (the “Basket Stocks”), subject to a maximum Coupon Rate of 6.00% to 10.00% per annum and a Minimum Coupon Rate of 1.00% per annum
Payment of principal amount and the final coupon payment at maturity
Payment of interest and repayment of principal at maturity are subject to the credit risk of Bank of America Corporation
No listing on any securities exchange
Market Downside Protection

Summary
The Variable Coupon Notes Linked to a Basket of 16 Common Equity Securities, due August , 2015 (the “notes”) are our senior unsecured debt securities. The notes are not guaranteed or insured by the Federal Deposit Insurance Corporation or secured by collateral. The notes will rank equally with all of our other unsecured and unsubordinated debt, and all payments due on the notes, including any repayment of principal, will be subject to the credit risk of BAC.
The notes provide investors with annual interest payments based upon the performance of an equally-weighted basket (the “Basket”) of 16 common equity securities. The Basket consists of the following common equity securities:
| Basket Stock |
Ticker | Weight | Initial Share Price | |||||
| Aflac Incorporated |
AFL | 6.25 | % | |||||
| Altria Group, Inc. |
MO | 6.25 | % | |||||
| Apple, Inc. |
AAPL | 6.25 | % | |||||
| Barrick Gold Corporation |
ABX | 6.25 | % | |||||
| Chevron Corporation |
CVX | 6.25 | % | |||||
| Citigroup Inc. |
C | 6.25 | % | |||||
| Comcast Corporation |
CMCSA | 6.25 | % | |||||
| CVS Caremark Corporation |
CVS | 6.25 | % | |||||
| Eastman Chemical Company |
EMN | 6.25 | % | |||||
| Honeywell International Inc. |
HON | 6.25 | % | |||||
| Las Vegas Sands Corp. |
LVS | 6.25 | % | |||||
| Netflix, Inc. |
NFLX | 6.25 | % | |||||
| Potash Corporation of Saskatchewan Inc. |
POT | 6.25 | % | |||||
| Priceline.com Incorporated |
PCLN | 6.25 | % | |||||
| Prudential Financial, Inc. |
PRU | 6.25 | % | |||||
| Walgreen Co. |
WAG | 6.25 | % | |||||
The notes are not traditional debt securities, and investors may not earn interest on their investment above the minimum coupon of 1.00% per annum.
Capitalized terms used but not defined in this term sheet have the meanings set forth in product supplement VCN-2. Unless otherwise indicated or unless the context requires otherwise, all references in this document to “we,” “us,” “our,” or similar references are to BAC.
|
Variable Coupon Notes |
TS-2 |
|
Variable Coupon Notes |
TS-3 |
Hypothetical Coupon Rate Calculations
Examples
Set forth below are examples of the calculations of the hypothetical Coupon Rates (rounded to the nearest hundredth and expressed as percentages) determined on each of the Coupon Determination Dates, based upon the Minimum Coupon Rate of 1.00% per annum and a hypothetical Auto-Cap of 8.00% (the midpoint of the Auto-Cap range of 6.00% to 10.00%). The examples illustrate, for the hypothetical Initial Share Prices set forth in the table below (the Closing Prices of the Basket Stocks on July 18, 2011), and a range of hypothetical Annual Levels on each Coupon Determination Date:
| § | the hypothetical Stock Return and Performance Level of each Basket Stock; |
| § | the hypothetical Average Performance Level; and |
| § | the hypothetical Coupon Rate payable on the applicable Coupon Payment Date. |
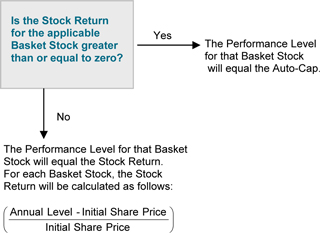
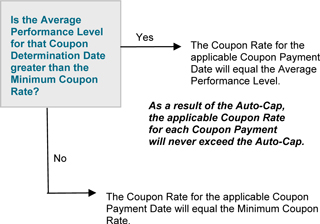
On the first Coupon Determination Date, the hypothetical Stock Return of each Basket Stock is less than zero. The Performance Level of each Basket Stock will equal its hypothetical Stock Return, resulting in a hypothetical Average Performance Level of -19.12%. However, because in no event will the Coupon Rate determined on any Coupon Determination Date be less than the Minimum Coupon Rate, the hypothetical Coupon Rate for August , 2012 is 1.00%.
On the second Coupon Determination Date, the hypothetical Stock Returns of two Basket Stocks are less than zero, and the hypothetical Stock Returns of the other fourteen Basket Stocks are greater than zero. Because of the Auto-Cap, the Performance Levels of each of the Basket Stocks with a Stock Return that is greater than zero will equal the Auto-Cap, and the Performance Levels of each of the Basket Stocks with a Stock Return that is less than zero will equal its hypothetical Stock Return. The hypothetical Average Performance Level is -3.31%. However, because in no event will the Coupon Rate determined on any Coupon Determination Date be less than the Minimum Coupon Rate, the hypothetical Coupon Rate for August , 2013 is 1.00%.
On the third Coupon Determination Date, the hypothetical Stock Return of each Basket Stock is greater than zero. Because of the Auto-Cap, the Performance Level of each Basket Stock will equal the Auto-Cap. Therefore, even though the hypothetical average Stock Return is 14.13%, the hypothetical Coupon Rate for August , 2014 is 8.00%.
On the fourth Coupon Determination Date, the hypothetical Stock Return of each Basket Stock is greater than zero. Because of the Auto-Cap, the Performance Level of the Basket Stocks with a Stock Return that is greater than zero will equal the Auto-Cap. Therefore, even though the hypothetical average Stock Return is 2.55%, the hypothetical Average Performance Level is 8.00%. As a result, the hypothetical Coupon Rate for August , 2015 is 8.00%.
These examples and the table below are for illustration only. The Coupon Rate on one or more Coupon Payment Dates may be limited to the Minimum Coupon Rate.
|
Variable Coupon Notes |
TS-4 |
| August , 2012 | August , 2013 | |||||||||||||||||||||||||||
| Initial Share Price |
Annual Level |
Stock Return | Performance Level |
Annual Level |
Stock Return | Performance Level |
||||||||||||||||||||||
| Aflac Incorporated |
44.38 | 33.29 | -24.99 | % | -24.99 | % | 8.88 | -79.99 | % | -79.99 | % | |||||||||||||||||
| Altria Group, Inc. |
26.57 | 20.46 | -23.01 | % | -23.01 | % | 26.87 | 1.11 | % | 8.00 | % | |||||||||||||||||
| Apple, Inc. |
369.92 | 295.94 | -20.00 | % | -20.00 | % | 377.32 | 2.00 | % | 8.00 | % | |||||||||||||||||
| Barrick Gold Corporation |
49.02 | 34.32 | -29.99 | % | -29.99 | % | 50.05 | 2.10 | % | 8.00 | % | |||||||||||||||||
| Chevron Corporation. |
106.00 | 91.16 | -14.00 | % | -14.00 | % | 15.90 | -85.00 | % | -85.00 | % | |||||||||||||||||
| Citigroup Inc. |
37.36 | 29.14 | -22.01 | % | -22.01 | % | 37.40 | 0.10 | % | 8.00 | % | |||||||||||||||||
| Comcast Corporation |
23.81 | 20.24 | -15.00 | % | -15.00 | % | 24.19 | 1.58 | % | 8.00 | % | |||||||||||||||||
| CVS Caremark Corporation |
36.60 | 26.72 | -26.99 | % | -26.99 | % | 36.97 | 1.01 | % | 8.00 | % | |||||||||||||||||
| Eastman Chemical Company |
99.22 | 86.32 | -13.00 | % | -13.00 | % | 101.85 | 2.65 | % | 8.00 | % | |||||||||||||||||
| Honeywell International Inc. |
56.46 | 50.81 | -10.01 | % | -10.01 | % | 57.79 | 2.35 | % | 8.00 | % | |||||||||||||||||
| Las Vegas Sands Corp. |
44.37 | 39.49 | -10.99 | % | -10.99 | % | 48.80 | 9.99 | % | 8.00 | % | |||||||||||||||||
| Netflix, Inc. |
277.31 | 210.75 | -24.00 | % | -24.00 | % | 279.67 | 0.85 | % | 8.00 | % | |||||||||||||||||
| Potash Corporation of Saskatchewan Inc. |
58.43 | 48.50 | -16.99 | % | -16.99 | % | 58.96 | 0.91 | % | 8.00 | % | |||||||||||||||||
| Priceline.com Incorporated |
514.12 | 431.86 | -16.00 | % | -16.00 | % | 525.95 | 2.30 | % | 8.00 | % | |||||||||||||||||
| Prudential Financial, Inc. |
59.64 | 48.90 | -18.00 | % | -18.00 | % | 60.82 | 1.99 | % | 8.00 | % | |||||||||||||||||
| Walgreen Co. |
41.53 | 32.81 | -21.00 | % | -21.00 | % | 42.36 | 2.00 | % | 8.00 | % | |||||||||||||||||
| Hypothetical Average Stock Return |
-19.12 | % | -8.38 | % | ||||||||||||||||||||||||
| Hypothetical Average Performance Level |
-19.12 | % | -3.31 | % | ||||||||||||||||||||||||
| Hypothetical Coupon Rate |
1.00 | % | 1.00 | % | ||||||||||||||||||||||||
| August , 2014 | August , 2015 | |||||||||||||||||||||||||||
| Initial Share Price |
Annual Level |
Stock Return | Performance Level |
Annual Level |
Stock Return | Performance Level |
||||||||||||||||||||||
| Aflac Incorporated |
44.38 | 49.27 | 11.01 | % | 8.00 | % | 46.60 | 5.00 | % | 8.00 | % | |||||||||||||||||
| Altria Group, Inc. |
26.57 | 31.36 | 18.01 | % | 8.00 | % | 26.71 | 0.51 | % | 8.00 | % | |||||||||||||||||
| Apple, Inc. |
369.92 | 419.86 | 13.50 | % | 8.00 | % | 377.32 | 2.00 | % | 8.00 | % | |||||||||||||||||
| Barrick Gold Corporation |
49.02 | 54.90 | 11.99 | % | 8.00 | % | 50.49 | 2.99 | % | 8.00 | % | |||||||||||||||||
| Chevron Corporation. |
106.00 | 117.12 | 10.50 | % | 8.00 | % | 109.70 | 3.50 | % | 8.00 | % | |||||||||||||||||
| Citigroup Inc. |
37.36 | 42.22 | 13.00 | % | 8.00 | % | 37.74 | 1.01 | % | 8.00 | % | |||||||||||||||||
| Comcast Corporation |
23.81 | 27.39 | 15.02 | % | 8.00 | % | 24.77 | 4.02 | % | 8.00 | % | |||||||||||||||||
| CVS Caremark Corporation |
36.60 | 41.72 | 13.99 | % | 8.00 | % | 37.51 | 2.49 | % | 8.00 | % | |||||||||||||||||
| Eastman Chemical Company |
99.22 | 110.13 | 11.00 | % | 8.00 | % | 103.68 | 4.50 | % | 8.00 | % | |||||||||||||||||
| Honeywell International Inc. |
56.46 | 63.52 | 12.50 | % | 8.00 | % | 59.57 | 5.51 | % | 8.00 | % | |||||||||||||||||
| Las Vegas Sands Corp. |
44.37 | 51.47 | 16.01 | % | 8.00 | % | 45.03 | 1.49 | % | 8.00 | % | |||||||||||||||||
| Netflix, Inc. |
277.31 | 324.45 | 17.00 | % | 8.00 | % | 279.39 | 0.75 | % | 8.00 | % | |||||||||||||||||
| Potash Corporation of Saskatchewan Inc. |
58.43 | 68.36 | 16.99 | % | 8.00 | % | 59.16 | 1.25 | % | 8.00 | % | |||||||||||||||||
| Priceline.com Incorporated |
514.12 | 591.24 | 15.00 | % | 8.00 | % | 515.41 | 0.25 | % | 8.00 | % | |||||||||||||||||
| Prudential Financial, Inc. |
59.64 | 69.18 | 16.00 | % | 8.00 | % | 60.98 | 2.25 | % | 8.00 | % | |||||||||||||||||
| Walgreen Co. |
41.53 | 47.55 | 14.49 | % | 8.00 | % | 42.88 | 3.25 | % | 8.00 | % | |||||||||||||||||
| Hypothetical Average Stock Return |
14.13 | % | 2.55 | % | ||||||||||||||||||||||||
| Hypothetical Average Performance Level |
8.00 | % | 8.00 | % | ||||||||||||||||||||||||
| Hypothetical Coupon Rate |
8.00 | % | 8.00 | % | ||||||||||||||||||||||||
|
Variable Coupon Notes |
TS-5 |
Risk Factors
There are important differences between the notes and a conventional debt security. An investment in the notes involves significant risks, including those listed below. You should carefully review the more detailed explanation of risks relating to the notes in the “Risk Factors” sections beginning on page S-8 of product supplement VCN-2 and page S-4 of the MTN prospectus supplement identified below under “Additional Terms.” We also urge you to consult your investment, legal, tax, accounting, and other advisors before you invest in the notes.
| § | The Coupon Rate on one or more Coupon Payment Dates may be limited to the Minimum Coupon Rate. |
| § | Your yield may be less than the yield on a conventional debt security of comparable maturity. |
| § | The Coupon Rate that will be applicable to each Coupon Payment Date is limited to the same rate as the Auto-Cap. |
| § | Due to the Auto-Cap, a significantly negative Stock Return of one or more Basket Stocks may not be offset by the positive stock return of one or more other Basket Stocks. |
| § | Your investment return, if any, may be less than a comparable investment directly in the Basket or the Basket Stocks. |
| § | You must rely on your own evaluation of the merits of an investment linked to the Basket Stocks. |
| § | Payments on the notes are subject to our credit risk, and changes in our credit ratings are expected to affect the value of the notes. |
| § | In seeking to provide you with what we believe to be competitive terms for the notes while providing MLPF&S with compensation for its services, we have considered the costs of developing, hedging, and distributing the notes described on page TS-7. The price at which you may sell the notes in any secondary market may be lower than the public offering price due to, among other things, the inclusion of these costs. |
| § | A trading market is not expected to develop for the notes. MLPF&S is not obligated to make a market for, or to repurchase, the notes. |
| § | The Coupon Payments will not be affected by all developments relating to the Basket Stocks. |
| § | Changes in the value of one or more of the Basket Stocks may be offset by changes in the value of one or more of the other Basket Stocks. |
| § | If you attempt to sell the notes prior to maturity, their market value, if any, will be affected by various factors that interrelate in complex ways, and their market value may be less than their Original Offering Price. |
| § | You will have no rights of a holder of any of the Basket Stocks, you will have no rights to receive any of the Basket Stocks, and you will not be entitled to dividends or other distributions by the issuers of the Basket Stocks. |
| § | Although we or our affiliates may from time to time hold one or more Basket Stocks, we do not control any company included in the Basket and are not responsible for any disclosure made by any other company. |
| § | Our business activities relating to the issuers of the Basket Stocks may create conflicts of interest with you. |
| § | The issuers of the Basket Stocks have no obligations relating to the notes and we will not perform any due diligence procedures with respect to these issuers. |
| § | Purchases and sales of the Basket Stocks by us and our affiliates may affect your return. |
| § | Our trading and hedging activities may create conflicts of interest with you. |
| § | Our hedging activities may affect your return on the notes and their market value. |
| § | The Annual Level of each Basket Stock determined on any Coupon Determination Date is not subject to adjustment for all corporate events. |
| § | There may be potential conflicts of interest involving the calculation agent. We have the right to appoint and remove the calculation agent. |
| § | You should consider the tax consequences of investing in the notes. See “Certain U.S. Federal Income Taxation Considerations” below and beginning on page S-29 of product supplement VCN-2. |
|
Variable Coupon Notes |
TS-6 |
Investor Considerations
Supplement to the Plan of Distribution; Role of MLPF&S and Conflicts of Interest
We may deliver the notes against payment therefor in New York, New York on a date that is greater than three business days following the pricing date. Under Rule 15c6-1 of the Securities Exchange Act of 1934, trades in the secondary market generally are required to settle in three business days, unless the parties to any such trade expressly agree otherwise. Accordingly, if the initial settlement of the notes occurs more than three business days from the pricing date, purchasers who wish to trade the notes more than three business days prior to the original issue date will be required to specify alternative settlement arrangements to prevent a failed settlement.
The notes will not be listed on any securities exchange. In the original offering of the notes, the notes will be sold in minimum investment amounts of 100 units.
MLPF&S, a broker-dealer subsidiary of BAC, is a member of the Financial Industry Regulatory Authority, Inc. (“FINRA”) and will participate as selling agent in the distribution of the notes. Accordingly, offerings of the notes will conform to the requirements of Rule 5121 applicable to FINRA members. MLPF&S may not make sales in this offering to any of its discretionary accounts without the prior written approval of the account holder.
Under our distribution agreement with MLPF&S, MLPF&S will purchase the notes from us as principal at the public offering price indicated on the cover of this term sheet, less the indicated underwriting discount. The public offering price includes, in addition to the underwriting discount, a charge of approximately $0.075 per unit. This charge reflects an estimated profit earned by MLPF&S from transactions through which the notes are structured and resulting obligations hedged. The fees charged reduce the economic terms of the notes. Actual profits or losses from these hedging transactions may be more or less than this amount. In entering into the hedging arrangements for the notes, we seek competitive terms and may enter into hedging transactions with a division of MLPF&S or one of our subsidiaries or affiliates. For further information regarding these charges, our trading and hedging activities and other conflicts of interest, see “Risk Factors,” beginning on page S-8 and “Use of Proceeds” on page S-17 in Product Supplement VCN-2.
MLPF&S will not receive an underwriting discount for notes sold to certain fee-based trusts and fee-based discretionary accounts managed by U.S. Trust operating through Bank of America, N.A.
If you place an order to purchase the notes, you are consenting to MLPF&S acting as a principal in effecting the transaction for your account.
MLPF&S may repurchase and resell the notes, with repurchases and resales being made at prices related to then-prevailing market prices or at negotiated prices. MLPF&S may act as principal or agent in these transactions; however it is not obligated to engage in any such transactions.
|
Variable Coupon Notes |
TS-7 |
The Basket Stocks
None of the issuers of the Basket Stocks has authorized or sanctioned the notes or participated in the preparation of this term sheet. Each of these issuers is subject to the informational requirements of the Exchange Act and files reports and other information with the SEC. Companies with securities registered under the Exchange Act are required to file periodically financial and other information required by the SEC. Information filed with the SEC can be inspected and copied at the Public Reference Section of the SEC, 100 F Street, N.E., Room 1580, Washington, D.C. 20549. Copies of this material also can be obtained from the Public Reference Section at prescribed rates. In addition, information filed electronically by each of the issuers of the Basket Stocks with the SEC can be reviewed through a website maintained by the SEC. The address of the SEC’s website is http://www.sec.gov.
This term sheet relates only to the notes and does not relate to the Basket Stocks. We are not offering or selling securities of any of the issuers of the Basket Stocks. The descriptions of the Basket Stocks in this section are derived from the publicly available documents described in the preceding paragraph. None of us or our affiliates has participated in the preparation of these documents, verified the accuracy or the completeness of the information concerning the Basket Stocks included in the publicly available documents or made any due diligence inquiry with respect to the Basket Stocks. We do not make any representation that the publicly available documents or any other publicly available information about the Basket Stocks are accurate or complete. There can be no assurance that events occurring prior or subsequent to the date of this term sheet (including events that would affect the accuracy or completeness of the publicly available documents described in the preceding paragraph) that might affect the value of any of the Basket Stocks have been or will be publicly disclosed. Because each Coupon Payment is related to the value of the Basket Stocks, those events, if any, also would affect the market value of the notes. We do not intend to furnish to you any additional information about the Basket Stocks. Neither we nor any of our affiliates makes any representation to you as to the future performance of any of the Basket Stocks.
We obtained the historical prices of the Basket Stocks shown below from the Bloomberg Financial® service, without independent verification. The historical value of any Basket Stock should not be taken as an indication of its future performance, and we cannot assure you that its Annual Level determined on any Coupon Determination Date will not decrease from its Initial Share Price.
You should make your own investigation into the Basket Stocks.
Historical Data on the Basket Stocks
The following tables set forth the high, low, and period-end closing prices of each of the Basket Stocks on its principal exchange from the first quarter of 2006 through July 18, 2011.
Aflac, Inc.
Aflac, Inc. is a general business holding company. The company, through its subsidiaries, provides supplemental insurance to individuals in the United States and Japan. The company’s products include accident and disability plans, cancer expense plans, short-term disability plans, sickness and hospital indemnity plans, hospital intensive care plans, and fixed-benefit dental plans. This Basket Stock trades on the New York Stock Exchange under the symbol “AFL.”
| High Closing Price |
Low Closing Price |
Period-End Closing Price | |||||||||||||||
| 2006 |
First Quarter | 49.30 | 45.13 | 45.13 | |||||||||||||
| Second Quarter | 49.15 | 44.55 | 46.35 | ||||||||||||||
| Third Quarter | 46.81 | 42.46 | 45.76 | ||||||||||||||
| Fourth Quarter | 46.00 | 43.65 | 46.00 | ||||||||||||||
| 2007 |
First Quarter | 49.26 | 45.64 | 47.06 | |||||||||||||
| Second Quarter | 53.59 | 47.34 | 51.40 | ||||||||||||||
| Third Quarter | 57.04 | 50.70 | 57.04 | ||||||||||||||
| Fourth Quarter | 62.90 | 56.47 | 62.63 | ||||||||||||||
| 2008 |
First Quarter | 65.55 | 58.72 | 64.95 | |||||||||||||
| Second Quarter | 68.22 | 62.80 | 62.80 | ||||||||||||||
| Third Quarter | 64.25 | 51.25 | 58.75 | ||||||||||||||
| Fourth Quarter | 58.02 | 30.38 | 45.84 | ||||||||||||||
| 2009 |
First Quarter | 46.28 | 11.49 | 19.36 | |||||||||||||
| Second Quarter | 37.66 | 18.75 | 31.09 | ||||||||||||||
| Third Quarter | 43.02 | 28.65 | 42.74 | ||||||||||||||
| Fourth Quarter | 47.14 | 40.58 | 46.25 | ||||||||||||||
| 2010 |
First Quarter | 54.82 | 45.95 | 54.29 | |||||||||||||
| Second Quarter | 56.56 | 40.48 | 42.67 | ||||||||||||||
| Third Quarter | 53.61 | 43.12 | 51.71 | ||||||||||||||
| Fourth Quarter | 57.85 | 51.45 | 56.43 | ||||||||||||||
| 2011 |
First Quarter | 59.28 | 50.45 | 52.78 | |||||||||||||
| Second Quarter | 57.00 | 44.30 | 46.68 | ||||||||||||||
| Third Quarter (through July 18, 2011) | 47.43 | 44.33 | 44.33 | ||||||||||||||
|
Variable Coupon Notes |
TS-8 |
Altria Group, Inc.
Altria Group, Inc. is a holding company. The company, through subsidiaries, manufactures and sells cigarettes and other tobacco products, including cigars and pipe tobacco. The company also holds an interest in a brewery company. This Basket Stock trades on the New York Stock Exchange under the symbol “MO.”
| High Closing Price |
Low Closing Price |
Period-End Closing Price | ||||||
| 2006 |
First Quarter | 17.70 | 16.40 | 16.40 | ||||
| Second Quarter | 17.10 | 15.90 | 17.00 | |||||
| Third Quarter | 19.55 | 16.97 | 17.72 | |||||
| Fourth Quarter | 19.96 | 17.51 | 19.86 | |||||
| 2007 |
First Quarter | 20.69 | 19.03 | 20.32 | ||||
| Second Quarter | 22.15 | 20.98 | 21.63 | |||||
| Third Quarter | 22.23 | 20.10 | 21.44 | |||||
| Fourth Quarter | 24.12 | 21.37 | 23.31 | |||||
| 2008 |
First Quarter | 24.43 | 21.58 | 22.20 | ||||
| Second Quarter | 22.77 | 20.00 | 20.56 | |||||
| Third Quarter | 21.71 | 19.35 | 19.84 | |||||
| Fourth Quarter | 20.55 | 14.45 | 15.06 | |||||
| 2009 |
First Quarter | 17.27 | 14.62 | 16.02 | ||||
| Second Quarter | 17.39 | 16.11 | 16.39 | |||||
| Third Quarter | 18.59 | 16.30 | 17.81 | |||||
| Fourth Quarter | 20.37 | 17.47 | 19.63 | |||||
| 2010 |
First Quarter | 20.82 | 19.37 | 20.52 | ||||
| Second Quarter | 21.70 | 19.57 | 20.04 | |||||
| Third Quarter | 24.25 | 20.24 | 24.02 | |||||
| Fourth Quarter | 26.15 | 23.78 | 24.62 | |||||
| 2011 |
First Quarter | 26.11 | 23.51 | 26.03 | ||||
| Second Quarter | 28.06 | 25.94 | 26.41 | |||||
| Third Quarter (through July 18, 2011) | 27.00 | 26.53 | 26.60 | |||||
Apple, Inc.
Apple Inc. designs, manufactures, and markets personal computers and related personal computing and mobile communication devices along with a variety of related software, services, peripherals, and networking solutions. The company sells its products worldwide through its online stores, its retail stores, its direct sales force, third-party wholesalers, and resellers. This Basket Stock trades on the Nasdaq Global Select Market under the symbol “APPL.”
| High Closing Price |
Low Closing Price |
Period-End Closing Price | ||||||
| 2006 |
First Quarter | 85.61 | 58.72 | 62.72 | ||||
| Second Quarter | 71.93 | 56.02 | 57.12 | |||||
| Third Quarter | 77.74 | 50.55 | 77.03 | |||||
| Fourth Quarter | 91.80 | 73.18 | 84.84 | |||||
| 2007 |
First Quarter | 97.13 | 83.27 | 92.91 | ||||
| Second Quarter | 125.09 | 90.24 | 122.04 | |||||
| Third Quarter | 154.50 | 117.05 | 153.54 | |||||
| Fourth Quarter | 199.83 | 153.76 | 198.08 | |||||
| 2008 |
First Quarter | 194.97 | 119.15 | 143.50 | ||||
| Second Quarter | 189.96 | 147.14 | 167.44 | |||||
| Third Quarter | 179.69 | 105.26 | 113.66 | |||||
| Fourth Quarter | 111.04 | 80.49 | 85.35 | |||||
| 2009 |
First Quarter | 109.87 | 78.20 | 105.12 | ||||
| Second Quarter | 144.67 | 108.69 | 142.43 | |||||
| Third Quarter | 186.15 | 135.40 | 185.37 | |||||
| Fourth Quarter | 211.64 | 180.76 | 210.86 | |||||
| 2010 |
First Quarter | 235.83 | 192.00 | 234.93 | ||||
| Second Quarter | 274.16 | 235.86 | 251.53 | |||||
| Third Quarter | 292.46 | 240.16 | 283.75 | |||||
| Fourth Quarter | 325.47 | 278.64 | 322.56 | |||||
| 2011 |
First Quarter | 363.13 | 326.72 | 348.45 | ||||
| Second Quarter | 353.10 | 315.32 | 335.67 | |||||
| Third Quarter (through July 18, 2011) | 373.80 | 343.23 | 373.80 | |||||
Barrick Gold Corporation
Barrick Gold Corporation is an international gold company with operating mines and development projects in the United States, Canada, South America, Australia, and Africa. This Basket Stock trades on the New York Stock Exchange under the symbol “ABX.”
| High Closing Price |
Low Closing Price |
Period-End Closing Price | |||||||||||||||
| 2006 |
First Quarter | 31.46 | 25.65 | 27.24 | |||||||||||||
| Second Quarter | 35.23 | 26.89 | 29.60 | ||||||||||||||
| Third Quarter | 34.04 | 28.28 | 30.72 | ||||||||||||||
| Fourth Quarter | 31.50 | 28.34 | 30.70 | ||||||||||||||
| 2007 |
First Quarter | 32.11 | 27.42 | 28.55 | |||||||||||||
| Second Quarter | 31.17 | 27.99 | 29.07 | ||||||||||||||
| Third Quarter | 40.94 | 29.60 | 40.28 | ||||||||||||||
| Fourth Quarter | 46.98 | 37.39 | 42.05 | ||||||||||||||
| 2008 |
First Quarter | 53.57 | 41.94 | 43.45 | |||||||||||||
| Second Quarter | 46.04 | 37.36 | 45.50 | ||||||||||||||
| Third Quarter | 50.39 | 26.60 | 36.74 | ||||||||||||||
| Fourth Quarter | 37.36 | 18.14 | 36.77 | ||||||||||||||
| 2009 |
First Quarter | 39.58 | 26.04 | 32.42 | |||||||||||||
| Second Quarter | 38.08 | 27.53 | 33.55 | ||||||||||||||
| Third Quarter | 40.04 | 31.48 | 37.90 | ||||||||||||||
| Fourth Quarter | 47.93 | 34.58 | 39.38 | ||||||||||||||
| 2010 |
First Quarter | 41.76 | 34.00 | 38.34 | |||||||||||||
| Second Quarter | 46.38 | 39.11 | 45.41 | ||||||||||||||
| Third Quarter | 47.22 | 40.03 | 46.29 | ||||||||||||||
| Fourth Quarter | 54.83 | 45.45 | 53.18 | ||||||||||||||
| 2011 |
First Quarter | 53.88 | 46.13 | 51.91 | |||||||||||||
| Second Quarter | 55.63 | 43.04 | 45.29 | ||||||||||||||
| Third Quarter (through July 18, 2011) | 49.03 | 44.78 | 49.03 | ||||||||||||||
|
Variable Coupon Notes |
TS-9 |
Chevron Corporation
Chevron Corporation is an integrated energy company with operations in countries located around the world. The company produces and transports crude oil and natural gas. The company also refines, markets, and distributes fuels as well as is involved in chemical operations, mining operations, power generation and energy services. This Basket Stock trades on the New York Stock Exchange under the symbol “CVX.”
| High Closing Price |
Low Closing Price |
Period-End Closing Price | |||||||||||||||
| 2006 |
First Quarter | 62.21 | 54.08 | 57.97 | |||||||||||||
| Second Quarter | 62.88 | 56.78 | 62.06 | ||||||||||||||
| Third Quarter | 67.85 | 60.88 | 64.86 | ||||||||||||||
| Fourth Quarter | 75.97 | 62.94 | 73.53 | ||||||||||||||
| 2007 |
First Quarter | 74.95 | 66.43 | 73.96 | |||||||||||||
| Second Quarter | 84.24 | 74.83 | 84.24 | ||||||||||||||
| Third Quarter | 94.84 | 80.76 | 93.58 | ||||||||||||||
| Fourth Quarter | 94.86 | 83.79 | 93.33 | ||||||||||||||
| 2008 |
First Quarter | 94.61 | 77.51 | 85.36 | |||||||||||||
| Second Quarter | 103.09 | 86.74 | 99.13 | ||||||||||||||
| Third Quarter | 99.08 | 77.50 | 82.48 | ||||||||||||||
| Fourth Quarter | 82.20 | 57.83 | 73.97 | ||||||||||||||
| 2009 |
First Quarter | 77.35 | 56.46 | 67.24 | |||||||||||||
| Second Quarter | 72.67 | 63.75 | 66.25 | ||||||||||||||
| Third Quarter | 72.64 | 61.40 | 70.43 | ||||||||||||||
| Fourth Quarter | 79.64 | 68.14 | 76.99 | ||||||||||||||
| 2010 |
First Quarter | 80.88 | 70.13 | 75.83 | |||||||||||||
| Second Quarter | 82.83 | 67.86 | 67.86 | ||||||||||||||
| Third Quarter | 81.28 | 67.31 | 81.05 | ||||||||||||||
| Fourth Quarter | 91.60 | 80.97 | 91.25 | ||||||||||||||
| 2011 |
First Quarter | 108.01 | 90.41 | 107.43 | |||||||||||||
| Second Quarter | 109.66 | 97.90 | 102.84 | ||||||||||||||
| Third Quarter (through July 18, 2011) | 106.59 | 104.09 | 106.23 | ||||||||||||||
Citigroup Inc.
Citigroup Inc. is a diversified financial services holding company that provides a broad range of financial services to consumer and corporate customers around the world. The company’s services include investment banking, retail brokerage, corporate banking, and cash management products and services. This Basket Stock trades on the New York Stock Exchange under the symbol “C.”
| High Closing Price |
Low Closing Price |
Period-End Closing Price | |||||||||||||||
| 2006 |
First Quarter | 492.90 | 450.50 | 472.30 | |||||||||||||
| Second Quarter | 503.70 | 474.10 | 482.40 | ||||||||||||||
| Third Quarter | 502.30 | 464.00 | 496.70 | ||||||||||||||
| Fourth Quarter | 564.10 | 493.80 | 557.00 | ||||||||||||||
| 2007 |
First Quarter | 552.50 | 487.50 | 513.40 | |||||||||||||
| Second Quarter | 552.00 | 510.50 | 512.90 | ||||||||||||||
| Third Quarter | 528.40 | 453.00 | 466.70 | ||||||||||||||
| Fourth Quarter | 483.20 | 292.90 | 294.40 | ||||||||||||||
| 2008 |
First Quarter | 296.90 | 186.20 | 214.20 | |||||||||||||
| Second Quarter | 268.10 | 167.60 | 167.60 | ||||||||||||||
| Third Quarter | 211.20 | 140.30 | 205.10 | ||||||||||||||
| Fourth Quarter | 230.00 | 37.70 | 67.10 | ||||||||||||||
| 2009 |
First Quarter | 74.60 | 10.20 | 25.30 | |||||||||||||
| Second Quarter | 40.20 | 26.80 | 29.70 | ||||||||||||||
| Third Quarter | 52.30 | 25.90 | 48.40 | ||||||||||||||
| Fourth Quarter | 50.00 | 32.00 | 33.10 | ||||||||||||||
| 2010 |
First Quarter | 43.10 | 31.50 | 40.50 | |||||||||||||
| Second Quarter | 49.70 | 36.30 | 37.60 | ||||||||||||||
| Third Quarter | 43.00 | 36.60 | 39.00 | ||||||||||||||
| Fourth Quarter | 48.10 | 39.50 | 47.30 | ||||||||||||||
| 2011 |
First Quarter | 51.30 | 43.90 | 44.20 | |||||||||||||
| Second Quarter | 46.00 | 36.81 | 41.64 | ||||||||||||||
| Third Quarter (through July 18, 2011) | 42.88 | 37.74 | 37.74 | ||||||||||||||
|
Variable Coupon Notes |
TS-10 |
Comcast Corporation
Comcast Corporation is a provider of video, high-speed Internet and phone services. The company offers a variety of entertainment, information and communications services to residential and commercial customers. The company is headquartered in Philadelphia, Pennsylvania. This Basket Stock trades on the Nasdaq Global Select Market under the symbol “CMCSA.”
| High Closing Price |
Low Closing Price |
Period-End Closing Price | |||||||||||||||
| 2006 |
First Quarter | 18.83 | 17.40 | 17.44 | |||||||||||||
| Second Quarter | 22.35 | 17.59 | 21.83 | ||||||||||||||
| Third Quarter | 24.57 | 20.69 | 24.57 | ||||||||||||||
| Fourth Quarter | 28.75 | 24.20 | 28.22 | ||||||||||||||
| 2007 |
First Quarter | 30.07 | 25.30 | 25.95 | |||||||||||||
| Second Quarter | 28.39 | 25.74 | 28.12 | ||||||||||||||
| Third Quarter | 29.02 | 23.67 | 24.18 | ||||||||||||||
| Fourth Quarter | 24.35 | 17.63 | 18.26 | ||||||||||||||
| 2008 |
First Quarter | 20.54 | 16.61 | 19.34 | |||||||||||||
| Second Quarter | 22.72 | 18.61 | 18.97 | ||||||||||||||
| Third Quarter | 22.28 | 18.01 | 19.63 | ||||||||||||||
| Fourth Quarter | 19.35 | 13.07 | 16.88 | ||||||||||||||
| 2009 |
First Quarter | 17.99 | 11.22 | 13.64 | |||||||||||||
| Second Quarter | 16.69 | 13.53 | 14.49 | ||||||||||||||
| Third Quarter | 17.56 | 13.26 | 16.89 | ||||||||||||||
| Fourth Quarter | 17.64 | 14.06 | 16.86 | ||||||||||||||
| 2010 |
First Quarter | 18.82 | 15.21 | 18.82 | |||||||||||||
| Second Quarter | 20.39 | 16.77 | 17.37 | ||||||||||||||
| Third Quarter | 19.56 | 17.00 | 18.08 | ||||||||||||||
| Fourth Quarter | 22.25 | 17.66 | 21.97 | ||||||||||||||
| 2011 |
First Quarter | 25.77 | 22.37 | 24.72 | |||||||||||||
| Second Quarter | 26.68 | 23.44 | 25.34 | ||||||||||||||
| Third Quarter (through July 18, 2011) | 25.97 | 23.94 | 23.94 | ||||||||||||||
CVS Caremark Corporation
CVS Caremark Corporation is an integrated pharmacy health care provider. The company’s offerings include pharmacy benefit management services, mail order, retail and specialty pharmacy, disease management programs, and retail clinics. The company operates drugstores throughout the U.S., the District of Columbia, and Puerto Rico. This Basket Stock trades on the New York Stock Exchange under the symbol “CVS.”
| High Closing Price |
Low Closing Price |
Period-End Closing Price | |||||||||||||||
| 2006 |
First Quarter | 30.57 | 26.35 | 29.87 | |||||||||||||
| Second Quarter | 31.25 | 27.69 | 30.70 | ||||||||||||||
| Third Quarter | 35.95 | 30.10 | 32.12 | ||||||||||||||
| Fourth Quarter | 32.15 | 27.19 | 30.91 | ||||||||||||||
| 2007 |
First Quarter | 34.67 | 30.79 | 34.14 | |||||||||||||
| Second Quarter | 39.08 | 34.29 | 36.45 | ||||||||||||||
| Third Quarter | 39.63 | 35.12 | 39.63 | ||||||||||||||
| Fourth Quarter | 42.25 | 37.15 | 39.75 | ||||||||||||||
| 2008 |
First Quarter | 41.25 | 35.49 | 40.51 | |||||||||||||
| Second Quarter | 44.12 | 39.48 | 39.57 | ||||||||||||||
| Third Quarter | 39.20 | 32.67 | 33.66 | ||||||||||||||
| Fourth Quarter | 33.77 | 24.42 | 28.74 | ||||||||||||||
| 2009 |
First Quarter | 29.80 | 23.98 | 27.49 | |||||||||||||
| Second Quarter | 32.98 | 28.10 | 31.87 | ||||||||||||||
| Third Quarter | 37.52 | 30.68 | 35.74 | ||||||||||||||
| Fourth Quarter | 38.01 | 28.87 | 32.21 | ||||||||||||||
| 2010 |
First Quarter | 37.07 | 31.07 | 36.56 | |||||||||||||
| Second Quarter | 37.37 | 29.32 | 29.32 | ||||||||||||||
| Third Quarter | 31.54 | 27.00 | 31.47 | ||||||||||||||
| Fourth Quarter | 35.00 | 29.65 | 34.77 | ||||||||||||||
| 2011 |
First Quarter | 35.71 | 32.24 | 34.32 | |||||||||||||
| Second Quarter | 38.80 | 34.77 | 37.58 | ||||||||||||||
| Third Quarter (through July 18, 2011) | 38.54 | 36.74 | 36.74 | ||||||||||||||
|
Variable Coupon Notes |
TS-11 |
Eastman Chemical Company
Eastman Chemical Company is an international chemical company which produces chemicals, fibers, and plastics. The company’s operations include coatings, adhesives, specialty polymers, and inks, fibers, performance chemicals and intermediates, performance polymers, and specialty plastics. This Basket Stock trades on the New York Stock Exchange under the symbol “EMN.”
| High Closing Price |
Low Closing Price |
Period-End Closing Price | |||||||||||||||
| 2006 |
First Quarter | 53.27 | 47.70 | 51.18 | |||||||||||||
| Second Quarter | 57.99 | 50.19 | 54.00 | ||||||||||||||
| Third Quarter | 54.46 | 49.19 | 54.02 | ||||||||||||||
| Fourth Quarter | 61.23 | 54.20 | 59.31 | ||||||||||||||
| 2007 |
First Quarter | 64.66 | 57.90 | 63.33 | |||||||||||||
| Second Quarter | 69.42 | 63.31 | 64.33 | ||||||||||||||
| Third Quarter | 71.23 | 63.49 | 66.73 | ||||||||||||||
| Fourth Quarter | 68.65 | 59.05 | 61.09 | ||||||||||||||
| 2008 |
First Quarter | 67.47 | 58.00 | 62.45 | |||||||||||||
| Second Quarter | 77.52 | 64.31 | 68.86 | ||||||||||||||
| Third Quarter | 68.80 | 53.27 | 55.06 | ||||||||||||||
| Fourth Quarter | 54.66 | 26.83 | 31.71 | ||||||||||||||
| 2009 |
First Quarter | 33.68 | 18.00 | 26.80 | |||||||||||||
| Second Quarter | 45.03 | 28.35 | 37.90 | ||||||||||||||
| Third Quarter | 55.15 | 35.21 | 53.54 | ||||||||||||||
| Fourth Quarter | 61.39 | 50.21 | 60.24 | ||||||||||||||
| 2010 |
First Quarter | 64.35 | 56.53 | 63.68 | |||||||||||||
| Second Quarter | 71.12 | 53.36 | 53.36 | ||||||||||||||
| Third Quarter | 74.00 | 51.63 | 74.00 | ||||||||||||||
| Fourth Quarter | 84.08 | 74.08 | 84.08 | ||||||||||||||
| 2011 |
First Quarter | 99.32 | 85.35 | 99.32 | |||||||||||||
| Second Quarter | 108.15 | 95.02 | 102.07 | ||||||||||||||
| Third Quarter (through July 18, 2011) | 105.67 | 99.60 | 99.60 | ||||||||||||||
|
Variable Coupon Notes |
TS-12 |
Honeywell International Inc.
Honeywell International Inc. is a worldwide diversified technology and manufacturing company providing aerospace products and services, control, sensing and security technologies, turbochargers, automotive products, specialty chemicals, electronic and advanced materials, process technology for refining and petrochemicals, and energy efficient products and solutions. This Basket Stock trades on the New York Stock Exchange under the symbol “HON.”
| High Closing Price |
Low Closing Price |
Period-End Closing Price | |||||||||||||||
| 2006 |
First Quarter | 42.85 | 35.84 | 42.77 | |||||||||||||
| Second Quarter | 44.16 | 37.62 | 40.30 | ||||||||||||||
| Third Quarter | 41.37 | 36.21 | 40.90 | ||||||||||||||
| Fourth Quarter | 45.46 | 41.35 | 45.24 | ||||||||||||||
| 2007 |
First Quarter | 48.31 | 44.13 | 46.06 | |||||||||||||
| Second Quarter | 58.87 | 46.15 | 56.28 | ||||||||||||||
| Third Quarter | 61.45 | 54.12 | 59.47 | ||||||||||||||
| Fourth Quarter | 61.77 | 53.19 | 61.57 | ||||||||||||||
| 2008 |
First Quarter | 60.48 | 53.95 | 56.42 | |||||||||||||
| Second Quarter | 62.43 | 49.14 | 50.28 | ||||||||||||||
| Third Quarter | 52.73 | 40.37 | 41.55 | ||||||||||||||
| Fourth Quarter | 39.68 | 23.67 | 32.83 | ||||||||||||||
| 2009 |
First Quarter | 36.04 | 23.23 | 27.86 | |||||||||||||
| Second Quarter | 35.79 | 28.31 | 31.40 | ||||||||||||||
| Third Quarter | 40.17 | 29.31 | 37.15 | ||||||||||||||
| Fourth Quarter | 41.31 | 35.60 | 39.20 | ||||||||||||||
| 2010 |
First Quarter | 45.27 | 36.87 | 45.27 | |||||||||||||
| Second Quarter | 48.52 | 39.03 | 39.03 | ||||||||||||||
| Third Quarter | 44.46 | 38.53 | 43.94 | ||||||||||||||
| Fourth Quarter | 53.72 | 43.61 | 53.16 | ||||||||||||||
| 2011 |
First Quarter | 59.71 | 53.48 | 59.71 | |||||||||||||
| Second Quarter | 62.00 | 55.53 | 59.59 | ||||||||||||||
| Third Quarter (through July 18, 2011) | 60.44 | 56.57 | 56.57 | ||||||||||||||
Google Inc.
Google Inc. is a global technology company that provides a web based search engine through its website. The company offers a wide range of search options, including web, image, groups, directory, and news searches. This Basket Stock trades on the Nasdaq Global Select Market under the symbol “GOOG.”
| High Closing Price |
Low Closing Price |
Period-End Closing Price | |||||||||||||||
| 2006 |
First Quarter | 471.84 | 337.06 | 390.00 | |||||||||||||
| Second Quarter | 440.50 | 370.02 | 419.33 | ||||||||||||||
| Third Quarter | 424.56 | 367.23 | 401.90 | ||||||||||||||
| Fourth Quarter | 509.65 | 401.44 | 460.48 | ||||||||||||||
| 2007 |
First Quarter | 505.00 | 438.68 | 458.16 | |||||||||||||
| Second Quarter | 530.26 | 458.00 | 523.38 | ||||||||||||||
| Third Quarter | 569.55 | 491.52 | 567.27 | ||||||||||||||
| Fourth Quarter | 741.79 | 579.03 | 691.48 | ||||||||||||||
| 2008 |
First Quarter | 685.33 | 413.62 | 440.47 | |||||||||||||
| Second Quarter | 594.90 | 446.84 | 526.42 | ||||||||||||||
| Third Quarter | 555.15 | 381.00 | 400.52 | ||||||||||||||
| Fourth Quarter | 411.72 | 257.44 | 307.65 | ||||||||||||||
| 2009 |
First Quarter | 378.77 | 282.75 | 348.06 | |||||||||||||
| Second Quarter | 444.32 | 354.09 | 421.59 | ||||||||||||||
| Third Quarter | 499.06 | 396.63 | 495.85 | ||||||||||||||
| Fourth Quarter | 622.73 | 484.58 | 619.98 | ||||||||||||||
| 2010 |
First Quarter | 626.75 | 526.43 | 567.01 | |||||||||||||
| Second Quarter | 595.30 | 444.95 | 444.95 | ||||||||||||||
| Third Quarter | 530.41 | 436.07 | 525.79 | ||||||||||||||
| Fourth Quarter | 627.16 | 522.35 | 593.97 | ||||||||||||||
| 2011 |
First Quarter | 639.63 | 557.10 | 586.21 | |||||||||||||
| Second Quarter | 591.80 | 474.88 | 506.38 | ||||||||||||||
| Third Quarter (through July 18, 2011) | 597.62 | 521.07 | 594.94 | ||||||||||||||
|
Variable Coupon Notes |
TS-13 |
Las Vegas Sands Corp.
Las Vegas Sands Corp. owns and operates casino resorts and convention centers. The company operates in United States, Macau and Singapore. Las Vegas Sand Corp’s casinos offer a wide range of gaming activities and entertainment as well as overnight accommodations, while its expo centers host a wide range of entertainment shows, expositions, and other activities. This Basket Stock trades on the New York Stock Exchange under the symbol “LVS.”
| High Closing Price |
Low Closing Price |
Period-End Closing Price | |||||||||||||||
| 2006 |
First Quarter | 56.72 | 38.68 | 56.66 | |||||||||||||
| Second Quarter | 77.86 | 55.00 | 77.86 | ||||||||||||||
| Third Quarter | 77.15 | 59.41 | 68.35 | ||||||||||||||
| Fourth Quarter | 97.00 | 67.77 | 89.48 | ||||||||||||||
| 2007 |
First Quarter | 108.59 | 81.02 | 86.61 | |||||||||||||
| Second Quarter | 90.74 | 72.83 | 76.39 | ||||||||||||||
| Third Quarter | 139.71 | 76.64 | 133.42 | ||||||||||||||
| Fourth Quarter | 144.56 | 103.05 | 103.05 | ||||||||||||||
| 2008 |
First Quarter | 100.32 | 71.85 | 73.64 | |||||||||||||
| Second Quarter | 81.50 | 47.10 | 47.44 | ||||||||||||||
| Third Quarter | 56.87 | 31.83 | 36.11 | ||||||||||||||
| Fourth Quarter | 31.32 | 3.23 | 5.93 | ||||||||||||||
| 2009 |
First Quarter | 8.48 | 1.42 | 3.01 | |||||||||||||
| Second Quarter | 11.34 | 3.74 | 7.86 | ||||||||||||||
| Third Quarter | 19.56 | 6.65 | 16.84 | ||||||||||||||
| Fourth Quarter | 18.28 | 13.17 | 14.94 | ||||||||||||||
| 2010 |
First Quarter | 21.90 | 15.37 | 21.15 | |||||||||||||
| Second Quarter | 27.04 | 19.85 | 22.14 | ||||||||||||||
| Third Quarter | 35.59 | 21.59 | 34.85 | ||||||||||||||
| Fourth Quarter | 52.80 | 35.19 | 45.95 | ||||||||||||||
| 2011 |
First Quarter | 50.60 | 36.34 | 42.22 | |||||||||||||
| Second Quarter | 47.51 | 37.82 | 42.21 | ||||||||||||||
| Third Quarter (through July 18, 2011) | 46.01 | 43.35 | 44.17 | ||||||||||||||
Netflix, Inc.
Netflix, Inc. is an online movie rental service. The company ships DVDs with no due dates or late fees, directly to the subscriber’s address. The company also provides background information on DVD releases, including critic reviews, member reviews and ratings, and personalized movie recommendations. This Basket Stock trades on the Nasdaq Global Select Market under the symbol “NFLX.”
| High Closing Price |
Low Closing Price |
Period-End Closing Price | |||||||||||||||
| 2006 |
First Quarter | 29.21 | 23.28 | 28.99 | |||||||||||||
| Second Quarter | 31.68 | 26.40 | 27.21 | ||||||||||||||
| Third Quarter | 27.24 | 18.57 | 22.78 | ||||||||||||||
| Fourth Quarter | 29.75 | 22.14 | 25.86 | ||||||||||||||
| 2007 |
First Quarter | 26.61 | 20.55 | 23.19 | |||||||||||||
| Second Quarter | 24.86 | 19.18 | 19.39 | ||||||||||||||
| Third Quarter | 21.94 | 16.10 | 20.72 | ||||||||||||||
| Fourth Quarter | 28.70 | 21.08 | 26.62 | ||||||||||||||
| 2008 |
First Quarter | 38.17 | 21.77 | 34.65 | |||||||||||||
| Second Quarter | 40.70 | 26.07 | 26.07 | ||||||||||||||
| Third Quarter | 32.97 | 26.73 | 30.88 | ||||||||||||||
| Fourth Quarter | 30.04 | 17.94 | 29.89 | ||||||||||||||
| 2009 |
First Quarter | 43.42 | 29.54 | 42.92 | |||||||||||||
| Second Quarter | 49.61 | 37.08 | 41.34 | ||||||||||||||
| Third Quarter | 47.73 | 38.70 | 46.17 | ||||||||||||||
| Fourth Quarter | 61.13 | 44.62 | 55.14 | ||||||||||||||
| 2010 |
First Quarter | 75.06 | 49.13 | 73.74 | |||||||||||||
| Second Quarter | 126.81 | 75.00 | 108.65 | ||||||||||||||
| Third Quarter | 170.63 | 98.02 | 162.16 | ||||||||||||||
| Fourth Quarter | 205.90 | 149.33 | 175.70 | ||||||||||||||
| 2011 |
First Quarter | 247.55 | 177.90 | 237.33 | |||||||||||||
| Second Quarter | 273.68 | 228.16 | 262.69 | ||||||||||||||
| Third Quarter (through July 18, 2011) | 298.73 | 267.96 | 279.00 | ||||||||||||||
|
Variable Coupon Notes |
TS-14 |
Potash Corporation of Saskatchewan Inc.
Potash Corporation of Saskatchewan Inc. produces potash, phosphate, and nitrogen to the agricultural and industrial industries worldwide. The company conducts operations in Canada, Chile, the United States, Brazil, and Trinidad. This Basket Stock trades on the New York Stock Exchange under the symbol “POT.”
| High Closing Price |
Low Closing Price |
Period-End Closing Price | |||||||||||||||
| 2006 |
First Quarter | 10.98 | 8.77 | 9.79 | |||||||||||||
| Second Quarter | 11.78 | 8.80 | 9.55 | ||||||||||||||
| Third Quarter | 11.73 | 9.21 | 11.58 | ||||||||||||||
| Fourth Quarter | 16.25 | 11.50 | 15.94 | ||||||||||||||
| 2007 |
First Quarter | 18.66 | 14.89 | 17.77 | |||||||||||||
| Second Quarter | 26.76 | 17.78 | 25.99 | ||||||||||||||
| Third Quarter | 35.23 | 25.11 | 35.23 | ||||||||||||||
| Fourth Quarter | 48.43 | 34.16 | 47.99 | ||||||||||||||
| 2008 |
First Quarter | 54.76 | 40.01 | 51.74 | |||||||||||||
| Second Quarter | 79.83 | 52.93 | 76.19 | ||||||||||||||
| Third Quarter | 76.17 | 43.90 | 44.00 | ||||||||||||||
| Fourth Quarter | 42.68 | 16.53 | 24.41 | ||||||||||||||
| 2009 |
First Quarter | 30.40 | 22.10 | 26.94 | |||||||||||||
| Second Quarter | 39.29 | 26.54 | 31.02 | ||||||||||||||
| Third Quarter | 33.19 | 28.04 | 30.11 | ||||||||||||||
| Fourth Quarter | 40.99 | 28.48 | 36.17 | ||||||||||||||
| 2010 |
First Quarter | 42.33 | 33.12 | 39.78 | |||||||||||||
| Second Quarter | 39.17 | 28.75 | 28.75 | ||||||||||||||
| Third Quarter | 50.16 | 28.20 | 48.01 | ||||||||||||||
| Fourth Quarter | 51.61 | 44.88 | 51.61 | ||||||||||||||
| 2011 |
First Quarter | 63.31 | 51.97 | 58.93 | |||||||||||||
| Second Quarter | 61.44 | 50.97 | 56.99 | ||||||||||||||
| Third Quarter (through July 18, 2011) | 59.20 | 56.04 | 58.77 | ||||||||||||||
Priceline.com Incorporated
Priceline.com Incorporated enables consumers to use the Internet to save money on a variety of products and services. The company’s product allows customers to name their own price on products or services and communicates that demand directly to participating sellers or to their private databases. Participants include domestic and international airlines, and hotel chains. This Basket Stock trades on the Nasdaq Global Select Market under the symbol “PCLN.”
| High Closing Price |
Low Closing Price |
Period-End Closing Price | |||||||||||||||
| 2006 |
First Quarter | 24.87 | 21.06 | 24.84 | |||||||||||||
| Second Quarter | 32.22 | 23.81 | 29.86 | ||||||||||||||
| Third Quarter | 36.79 | 25.91 | 36.79 | ||||||||||||||
| Fourth Quarter | 43.97 | 36.75 | 43.61 | ||||||||||||||
| 2007 |
First Quarter | 55.26 | 42.29 | 53.26 | |||||||||||||
| Second Quarter | 68.74 | 54.21 | 68.74 | ||||||||||||||
| Third Quarter | 89.95 | 61.56 | 88.75 | ||||||||||||||
| Fourth Quarter | 119.73 | 84.27 | 114.86 | ||||||||||||||
| 2008 |
First Quarter | 127.51 | 89.36 | 120.86 | |||||||||||||
| Second Quarter | 139.66 | 115.46 | 115.46 | ||||||||||||||
| Third Quarter | 117.20 | 66.84 | 68.43 | ||||||||||||||
| Fourth Quarter | 73.65 | 47.07 | 73.65 | ||||||||||||||
| 2009 |
First Quarter | 86.68 | 66.04 | 78.78 | |||||||||||||
| Second Quarter | 118.00 | 80.88 | 111.55 | ||||||||||||||
| Third Quarter | 168.24 | 103.75 | 165.82 | ||||||||||||||
| Fourth Quarter | 229.24 | 157.79 | 218.50 | ||||||||||||||
| 2010 |
First Quarter | 255.99 | 195.35 | 255.00 | |||||||||||||
| Second Quarter | 273.00 | 175.19 | 176.54 | ||||||||||||||
| Third Quarter | 349.93 | 176.41 | 348.34 | ||||||||||||||
| Fourth Quarter | 420.65 | 330.86 | 399.55 | ||||||||||||||
| 2011 |
First Quarter | 506.44 | 409.41 | 506.44 | |||||||||||||
| Second Quarter | 555.65 | 458.78 | 511.93 | ||||||||||||||
| Third Quarter (through July 18, 2011) | 552.15 | 516.50 | 516.50 | ||||||||||||||
|
Variable Coupon Notes |
TS-15 |
Prudential Financial, Inc.
Prudential Financial, Inc. provides financial services throughout the United States and several locations worldwide. The company offers a variety of products and services, including life insurance, mutual funds, annuities, pension and retirement related services and administration, asset management, securities brokerage, real estate brokerage, and relocation services. This Basket Stock trades on the New York Stock Exchange under the symbol “PRU.”
| High Closing Price |
Low Closing Price |
Period-End Closing Price | |||||||||||||||
| 2006 |
First Quarter | 77.48 | 73.19 | 75.81 | |||||||||||||
| Second Quarter | 78.89 | 74.43 | 77.70 | ||||||||||||||
| Third Quarter | 79.06 | 71.47 | 76.25 | ||||||||||||||
| Fourth Quarter | 86.84 | 76.03 | 85.86 | ||||||||||||||
| 2007 |
First Quarter | 93.10 | 85.69 | 90.26 | |||||||||||||
| Second Quarter | 103.17 | 90.21 | 97.23 | ||||||||||||||
| Third Quarter | 98.71 | 84.28 | 97.58 | ||||||||||||||
| Fourth Quarter | 101.09 | 89.46 | 93.04 | ||||||||||||||
| 2008 |
First Quarter | 91.36 | 67.36 | 78.25 | |||||||||||||
| Second Quarter | 82.21 | 59.74 | 59.74 | ||||||||||||||
| Third Quarter | 86.25 | 56.07 | 72.00 | ||||||||||||||
| Fourth Quarter | 64.80 | 13.73 | 30.26 | ||||||||||||||
| 2009 |
First Quarter | 35.11 | 11.29 | 19.02 | |||||||||||||
| Second Quarter | 46.00 | 20.50 | 37.22 | ||||||||||||||
| Third Quarter | 54.63 | 33.28 | 49.91 | ||||||||||||||
| Fourth Quarter | 52.82 | 44.64 | 49.76 | ||||||||||||||
| 2010 |
First Quarter | 60.50 | 47.02 | 60.50 | |||||||||||||
| Second Quarter | 65.82 | 53.66 | 53.66 | ||||||||||||||
| Third Quarter | 59.54 | 49.65 | 54.18 | ||||||||||||||
| Fourth Quarter | 59.95 | 50.68 | 58.71 | ||||||||||||||
| 2011 |
First Quarter | 67.32 | 58.32 | 61.58 | |||||||||||||
| Second Quarter | 64.62 | 57.77 | 63.59 | ||||||||||||||
| Third Quarter (through July 18, 2011) | 65.26 | 59.78 | 59.78 | ||||||||||||||
Walgreen Co.
Walgreen Co. operates retail drugstores that offer a wide variety of prescription and non-prescription drugs as well as general goods. The company operates stores in the United States, Puerto Rico and Guam. The company also offers health services, including primary and acute care, wellness, pharmacy and disease management services. This Basket Stock trades on the New York Stock Exchange under the symbol “WAG.”
| High Closing Price |
Low Closing Price |
Period-End Closing Price | ||||||
| 2006 |
First Quarter | 46.15 | 42.42 | 43.13 | ||||
| Second Quarter | 45.27 | 39.80 | 44.84 | |||||
| Third Quarter | 51.48 | 44.39 | 44.39 | |||||
| Fourth Quarter | 46.68 | 40.10 | 45.89 | |||||
| 2007 |
First Quarter | 47.77 | 43.91 | 45.89 | ||||
| Second Quarter | 46.67 | 43.49 | 43.54 | |||||
| Third Quarter | 47.93 | 43.60 | 47.24 | |||||
| Fourth Quarter | 40.18 | 35.81 | 38.08 | |||||
| 2008 |
First Quarter | 38.61 | 33.01 | 38.09 | ||||
| Second Quarter | 38.93 | 32.51 | 32.51 | |||||
| Third Quarter | 37.27 | 30.96 | 30.96 | |||||
| Fourth Quarter | 29.74 | 21.40 | 24.67 | |||||
| 2009 |
First Quarter | 28.16 | 21.50 | 25.96 | ||||
| Second Quarter | 31.72 | 26.50 | 29.40 | |||||
| Third Quarter | 37.47 | 28.70 | 37.47 | |||||
| Fourth Quarter | 40.37 | 36.61 | 36.72 | |||||
| 2010 |
First Quarter | 37.49 | 33.29 | 37.09 | ||||
| Second Quarter | 37.83 | 26.49 | 26.70 | |||||
| Third Quarter | 33.81 | 26.36 | 33.50 | |||||
| Fourth Quarter | 39.48 | 33.11 | 38.96 | |||||
| 2011 |
First Quarter | 43.34 | 39.21 | 40.14 | ||||
| Second Quarter | 45.18 | 40.83 | 42.46 | |||||
| Third Quarter (through July 18, 2011) | 44.14 | 41.67 | 41.67 | |||||
|
Variable Coupon Notes |
TS-16 |
Certain U.S. Federal Income Taxation Considerations
Set forth below is a summary of certain U.S. federal income tax considerations relating to an investment in the notes. The following summary is not complete and is qualified in its entirety by the discussion under the section entitled “U.S. Federal Income Tax Summary” beginning on page S-29 of product supplement VCN-2, which you should carefully review prior to investing in the notes. For purposes of that discussion, we intend to take the position that the notes will be treated as “contingent payment debt instruments” for U.S. federal income tax purposes, subject to taxation under the “noncontingent bond method,” and the balance of this discussion assumes that this characterization is proper and will be respected. Capitalized terms used and not defined herein have the meanings ascribed to them in product supplement VCN-2.
Under this characterization, the notes generally will be subject to the Treasury regulations governing contingent payment debt instruments. Under those regulations, a U.S. Holder will be required to report OID or interest income based on a “comparable yield” and a “projected payment schedule,” established by us for determining interest accruals and adjustments with respect to a note. A U.S. Holder who does not use the “comparable yield” and follow the “projected payment schedule” to calculate its OID and interest income on a note must timely disclose and justify the use of other estimates to the IRS.
A U.S. Holder will be required to recognize interest income equal to the amount of any “positive adjustment” for a note for the taxable year in which a contingent payment is paid (including a payment of interest at maturity). A positive adjustment is the excess of actual payments in respect of contingent payments over the projected amount of contingent payments. A U.S. Holder also will be required to account for any “negative adjustment” for a taxable year in which a contingent payment is paid. A negative adjustment is the excess of the projected amounts of contingent payments over actual payments in respect of the contingent payments. A net negative adjustment is the amount by which total negative adjustments in a taxable year exceed total positive adjustments in such taxable year. A net negative adjustment (1) will first reduce the amount of interest for the note that a U.S. Holder would otherwise be required to include in income in the taxable year, and (2) to the extent of any excess, will result in an ordinary loss equal to that portion of the excess as does not exceed the excess of (A) the amount of all previous interest inclusions under the note over (B) the total amount of the U.S. Holder’s net negative adjustments treated as ordinary loss on the note in prior taxable years. A net negative adjustment is not subject to the 2% floor limitation imposed on miscellaneous deductions under Section 67 of the Code. Any net negative adjustment in excess of the amounts described above in (1) and (2) will be carried forward to offset future interest income on the note or to reduce the amount realized on a sale, exchange, or redemption of the note and, in the case of a payment at maturity, should result in a capital loss. The deductibility of capital losses by a U.S. Holder is subject to limitations.
The following table assumes an expected issue date of August 18, 2011 and maturity date of August 18, 2015 for the notes and is based upon a hypothetical projected payment schedule and a hypothetical comparable yield equal to 3.0876% per annum (compounded annually), that we established for the notes, and shows the amounts of ordinary income from a note that an initial U.S. Holder that holds the note until maturity and pays taxes on a calendar year basis should be required to report each calendar year. The following tables are for illustrative purposes only. The actual tables will be completed on the pricing date and included in the final term sheet.
| Accrual Period |
Interest Deemed to Accrue per unit of the notes) |
Total Interest Deemed to Have Accrued from Original Issue Date (per $10.00 principal amount per unit of the notes) | ||||
| August 18, 2011 through December 31, 2011 |
$0.1132 | $0.1132 | ||||
| January 1, 2012 through December 31, 2012 |
$0.3088 | $0.4220 | ||||
| January 1, 2013 through December 31, 2013 |
$0.3088 | $0.7307 | ||||
| January 1, 2014 through December 31, 2014 |
$0.3088 | $1.0395 | ||||
| January 1, 2015 through August 18, 2015 |
$0.1956 | $1.2350 |
In addition, we have determined the hypothetical projected payment schedule for the notes as follows:
| Date |
Projected Payment | |
| August 18, 2012 |
$0.3088 | |
| August 18, 2013 |
$0.3088 | |
| August 18, 2014 |
$0.3088 | |
| August 18, 2015 |
$10.3088 |
You should be aware that these amounts are not calculated or provided for any purposes other than the determination of a U.S. Holder’s interest accruals and adjustments with respect to the notes for U.S. federal income tax purposes. By providing the table above and the projected payment schedule, we make no representations regarding the actual amounts of interest payments on the notes.
Upon a sale, exchange, or redemption of a note prior to maturity, a U.S. Holder generally will recognize taxable gain or loss equal to the difference between the amount realized on the sale, exchange, or redemption and the holder’s tax basis in the notes. A U.S. Holder’s tax basis in a note generally will equal the cost of that note, increased by the amount of OID previously accrued by the holder for that note (without regard to any positive or negative adjustments under the contingent payment debt regulations), and decreased by the amount of any projected payments for previous periods on the note. A U.S. Holder generally will treat any gain as interest income, and will treat any loss as ordinary loss to the extent of the excess of previous interest inclusions over the total negative adjustments previously taken into account as ordinary losses, and the balance as long-term or short-term capital loss depending upon the U.S. Holder’s holding period for the note.
You should consult your own tax advisor concerning the U.S. federal income tax consequences to you of acquiring, owning, and disposing of the notes, as well as any tax consequences arising under the laws of any state, local, foreign, or other tax jurisdiction and the possible effects of changes in U.S. federal or other tax laws. See the discussion under the section entitled “U.S. Federal Income Tax Summary” beginning on page S-29 of product supplement VCN-2.
|
Variable Coupon Notes |
TS-17 |
Additional Terms
You should read this term sheet, together with the documents listed below, which together contain the terms of the notes and supersede all prior or contemporaneous oral statements as well as any other written materials. You should carefully consider, among other things, the matters set forth under “Risk Factors” in the sections indicated on the cover of this term sheet. The notes involve risks not associated with conventional debt securities. We urge you to consult your investment, legal, tax, accounting, and other advisors before you invest in the notes.
You may access the following documents on the SEC Website at www.sec.gov as follows (or if such address has changed, by reviewing our filings for the relevant date on the SEC Website):
| § | Product supplement VCN-2 dated October 26, 2010: |
http://www.sec.gov/Archives/edgar/data/70858/000119312510236590/d424b5.htm
| § | Series L MTN prospectus supplement dated April 21, 2009 and prospectus dated April 20, 2009: |
http://www.sec.gov/Archives/edgar/data/70858/000095014409003387/g18667b5e424b5.htm
Our Central Index Key, or CIK, on the SEC Website is 70858.
We have filed a registration statement (including a product supplement, a prospectus supplement, and a prospectus) with the SEC for the offering to which this term sheet relates. Before you invest, you should read the product supplement, the prospectus supplement, and the prospectus in that registration statement, and the other documents relating to this offering that we have filed with the SEC for more complete information about us and this offering. You may get these documents without cost by visiting EDGAR on the SEC Website at www.sec.gov. Alternatively, we, any agent, or any dealer participating in this offering will arrange to send you the Note Prospectus if you so request by calling MLPF&S toll-free at 1-866-500-5408.

The following description is meant solely for informational purposes and is not intended to represent any particular Market Downside Protection Market-Linked Investment or guarantee any performance.
Market Downside Protection Market-Linked Investments combine some of the capital preservation features of traditional bonds with the growth potential of equities and other asset classes. They offer full or partial market downside protection at maturity, while offering market exposure that may provide better returns than comparable fixed income securities. It is important to note that the market downside protection feature provides investors with protection only at maturity, subject to issuer credit risk. In addition, in exchange for full or partial protection, you forfeit dividends and full exposure to the linked asset’s upside. In some circumstances, this could result in a lower return than with a direct investment in the asset.
|
Variable Coupon Notes |
TS-18 |