Filed Pursuant to Rule 433
Registration No. 333-180488
Subject to Completion
Preliminary Term Sheet dated June 22, 2012
The notes are being issued by Bank of America Corporation (“BAC”). There are important differences between the notes and a conventional debt security, including different investment risks. See “Risk Factors” on page TS-5 of this term sheet and beginning on page S-8 of product supplement STOCK LIRN-2.
None of the Securities and Exchange Commission (the “SEC”), any state securities commission, or any other regulatory body has approved or disapproved of these securities or determined if this Note Prospectus (as defined below) is truthful or complete. Any representation to the contrary is a criminal offense.
| Per Unit |
Total |
|||||||
| Public offering price (1) (2) |
$10.00 | $ | ||||||
| Underwriting discount (1) (2) |
$0.20 | $ | ||||||
| Proceeds, before expenses, to BAC |
$9.80 | $ | ||||||
| (1) | For any purchase of 500,000 units or more in a single transaction by an individual investor, the public offering price and the underwriting discount will be $9.95 per unit and $0.15 per unit, respectively. |
| (2) | For any purchase by certain fee-based trusts and discretionary accounts managed by U.S. Trust operating through Bank of America, N.A., the public offering price and underwriting discount will be $9.80 per unit and $0.00 per unit, respectively. |
The notes:
| Are Not FDIC Insured | Are Not Bank Guaranteed | May Lose Value |
Merrill Lynch & Co.
June , 2012
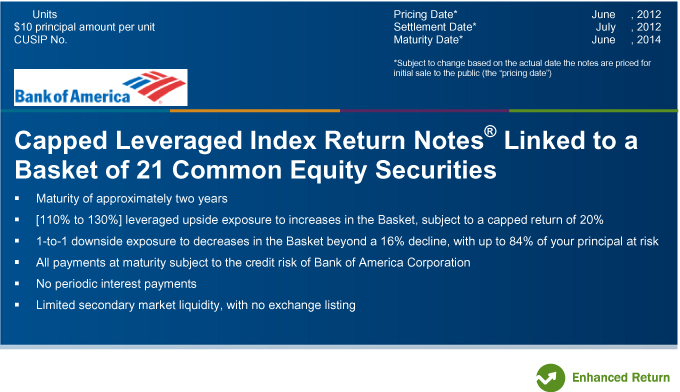
Units
$10 principal amount per unit
CUSIP No.
Pricing Date* June , 2012
Settlement Date* July , 2012
Maturity Date* June , 2014
*Subject to change based on the actual date the notes are priced for initial sale to the public (the “pricing date”)
Bank of America
Capped Leveraged Index Return Notes® Linked to a Basket of 21 Common Equity Securities
· Maturity of approximately two years
· [110 -130] leveraged upside exposure to increases in the Basket, subject to a capped return of 20%
· 1-to-1 downside exposure to decreases in the Basket beyond a 16% decline, with up to 84% of your principal at risk
· All payments at maturity subject to the credit risk of Bank of America Corporation
· No periodic interest payments
· Limited secondary market liquidity, with no exchange listing
| Capped Leveraged Index Return Notes® Linked to a Basket of 21 Common Equity Securities, due June , 2014 |

|
Summary
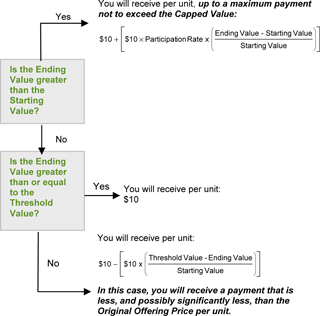
The Capped Leveraged Index Return Notes® Linked to a Basket of 21 Common Equity Securities, due June , 2014 (the “notes”) are our senior unsecured debt securities. The notes are not guaranteed or insured by the Federal Deposit Insurance Corporation or secured by collateral. The notes will rank equally with all of our other unsecured and unsubordinated debt. Any payments due on the notes, including any repayment of principal, will be subject to the credit risk of BAC. The notes provide you a leveraged return, subject to a cap, if the Ending Value (as determined below) of the Basket of 21 common equity securities (the “Basket”) is greater than the Starting Value. If the Ending Value is less than the Threshold Value, you will lose a portion, which could be significant, of the principal amount of your notes.
The terms and risks of the notes are contained in this term sheet and the documents listed below (together, the “Note Prospectus”). The documents have been filed as part of a registration statement with the SEC, which may, without cost, be accessed on the SEC website as indicated below or obtained from MLPF&S by calling 1-866-500-5408:
| § | Product supplement STOCK LIRN-2 dated April 20, 2012: |
http://www.sec.gov/Archives/edgar/data/70858/000119312512173397/d329459d424b5.htm
| § | Series L MTN prospectus supplement dated March 30, 2012 and prospectus dated March 30, 2012: |
http://sec.gov/Archives/edgar/data/70858/000119312512143855/d323958d424b5.htm
Before you invest, you should read the Note Prospectus, including this term sheet, for information about us and this offering. Any prior or contemporaneous oral statements and any other written materials you may have received are superseded by the Note Prospectus. Capitalized terms used but not defined in this term sheet have the meanings set forth in product supplement STOCK LIRN-2. Unless otherwise indicated or unless the context requires otherwise, all references in this document to “we,” “us,” “our,” or similar references are to BAC.
| Capped Leveraged Index Return Notes® | TS-2 |
| Capped Leveraged Index Return Notes® Linked to a Basket of 21 Common Equity Securities, due June , 2014 |
|
Investor Considerations
We urge you to consult your investment, legal, tax, accounting, and other advisors before you invest in the notes.
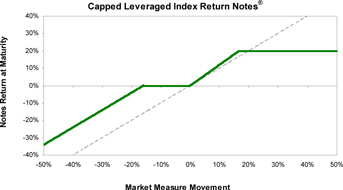
Hypothetical Payout Profile
The below graph is based on hypothetical numbers and values.
|
|
This graph reflects the returns on the notes, based on a Participation Rate of 120% (the midpoint of the Participation Rate range of [110% to 130%]), a Threshold Value of 84% of the Starting Value and a Capped Value of $12. The green line reflects the returns on the notes, while the dotted gray line reflects the returns of a direct investment in the Basket Components, excluding dividends.
This graph has been prepared for purposes of illustration only. |
| Capped Leveraged Index Return Notes® | TS-3 |
| Capped Leveraged Index Return Notes® Linked to a Basket of 21 Common Equity Securities, due June , 2014 |
|
Hypothetical Payments at Maturity
The following table and examples are for purposes of illustration only. They are based on hypothetical values and show hypothetical returns on the notes. The actual amount you receive and the resulting total rate of return will depend on the actual Ending Value, Capped Value, and the term of your investment.
The following table is based on the Starting Value of 100.00, the Threshold Value of 84.00, a Participation Rate of 120.00% and a Capped Value of $12.00 per unit. It illustrates the effect of a range of Ending Values on the Redemption Amount per unit of the notes and the total rate of return to holders of notes. The following examples do not take into account any tax consequences from investing in the notes.
| Ending Value |
Percentage Change from Value to the Ending Value |
Redemption |
Total Rate | |||||||||||||||
| 50.00 | -50.00 | % | $6.60 | -34.00 | % | |||||||||||||
| 60.00 | -40.00 | % | $7.60 | -24.00 | % | |||||||||||||
| 70.00 | -30.00 | % | $8.60 | -14.00 | % | |||||||||||||
| 80.00 | -20.00 | % | $9.60 | -4.00 | % | |||||||||||||
| 84.00 | (1) | -16.00 | % | $10.00 | 0.00 | % | ||||||||||||
| 90.00 | -10.00 | % | $10.00 | 0.00 | % | |||||||||||||
| 95.00 | -5.00 | % | $10.00 | 0.00 | % | |||||||||||||
| 100.00 | (2) | 0.00 | % | $10.00 | 0.00 | % | ||||||||||||
| 104.00 | 4.00 | % | $10.48 | 4.80 | % | |||||||||||||
| 110.00 | 10.00 | % | $11.20 | 12.00 | % | |||||||||||||
| 120.00 | 20.00 | % | $12.00 | (3) | 20.00 | % | ||||||||||||
| 130.00 | 30.00 | % | $12.00 | 20.00 | % | |||||||||||||
| 140.00 | 40.00 | % | $12.00 | 20.00 | % | |||||||||||||
| 150.00 | 50.00 | % | $12.00 | 20.00 | % | |||||||||||||
| (1) | The Threshold Value will be set to 84.00 on the pricing date. |
| (2) | The Starting Value will be set to 100.00 on the pricing date |
| (3) | The Redemption Amount per unit cannot exceed the Capped Value. |
For recent actual levels of the Market Measure, see “The Basket” section below. The Ending Value will not include any income generated by dividends paid on the Basket Components, which you would otherwise be entitled to receive if you invested in those stocks directly. In addition, all payments on the notes are subject to issuer credit risk.
Redemption Amount Calculation Examples
Example 1
The Ending Value is 70, or 70% of the Starting Value:
| Starting Value: | 100 | |||
| Ending Value: | 70 | |||
| Threshold Value: | 84 |
| $10 – |
[ | $10 × | ( | 70 – 84 | ) | ] | = $8.60 | Redemption Amount per unit | ||||||||||
| 100 |
Example 2
The Ending Value is 95, or 95% of the Starting Value:
| Starting Value: | 100 | |||
| Ending Value: | 95 | |||
| Threshold Value: | 84 |
Redemption Amount (per unit) = $10.00, the Original Offering Price, since the Ending Value is less than the Starting Value but equal to or greater than the Threshold Value.
Example 3
The Ending Value is 104, or 104% of the Starting Value:
| Starting Value: | 100 | |||
| Ending Value: | 104 |
| $10 + |
[ | $10 × 120% × | ( | 104 – 100 | ) | ] | = $10.48 Redemption Amount per unit | |||||||||||
| 100 | ||||||||||||||||||
Example 4
The Ending Value is 140, or 140% of the Starting Value:
| Starting Value: | 100 | |||
| Ending Value: | 140 |
| $10 + |
[ | $10 × 120% × | ( | 140 – 100 | ) | ] | = $14.80, however, because the Redemption Amount for the notes cannot exceed the Capped Value, the Redemption Amount will be $12.00 per unit | |||||||||||
| 100 | ||||||||||||||||||
| Capped Leveraged Index Return Notes® | TS-4 |
| Capped Leveraged Index Return Notes® Linked to a Basket of 21 Common Equity Securities, due June , 2014 |
|
Risk Factors
There are important differences between the notes and a conventional debt security. An investment in the notes involves significant risks, including those listed below. You should carefully review the more detailed explanation of risks relating to the notes in the “Risk Factors” sections beginning on page S-8 of product supplement STOCK LIRN-2, page S-5 of the MTN prospectus supplement, and page 8 of the prospectus identified above under “Summary.” We also urge you to consult your investment, legal, tax, accounting, and other advisors before you invest in the notes.
| § | Depending on the performance of the Basket as measured shortly before the maturity date, your investment may result in a loss; there is no guaranteed return of principal. |
| § | Your yield may be less than the yield you could earn by owning a conventional debt security of comparable maturity. |
| § | Payments on the notes are subject to our credit risk, and actual or perceived changes in our creditworthiness are expected to affect the value of the notes. If we become insolvent or are unable to pay our obligations, you may lose your entire investment. |
| § | Your investment return, if any, is limited to the return represented by the Capped Value and may be less than a comparable investment directly in the Basket Components. |
| § | If you attempt to sell the notes prior to maturity, their market value may be lower than the price you paid for the notes due to, among other things, the inclusion of fees charged for developing, hedging and distributing the notes, as described on page TS-19 and various credit, market and economic factors that interrelate in complex and unpredictable ways. |
| § | A trading market is not expected to develop for the notes. MLPF&S is not obligated to make a market for, or to repurchase, the notes. |
| § | Changes in the prices of the Basket Components may offset each other. |
| § | Our business activities as a full service financial institution, including our commercial and investment banking activities, our hedging and trading activities (including trades in shares of the Basket Components) and any hedging and trading activities we engage in for our clients’ accounts, may affect the market value of the notes and their return and may create conflicts of interest with you. |
| § | You will have no rights of a holder of the Basket Components, and you will not be entitled to receive shares of the Basket Components or dividends or other distributions by the issuers of the Basket Components. |
| § | While we or our affiliates may from time to time own shares of the Basket Components, we do not control any company included in the Basket, and are not responsible for any disclosure made by any other company. |
| § | The Redemption Amount will not be adjusted for all corporate events that could affect a Basket Component. See “Description of LIRNs — Anti-Dilution Adjustments” beginning on page S-23 of product supplement STOCK LIRN-2. |
| § | There may be potential conflicts of interest involving the calculation agent. We have the right to appoint and remove the calculation agent. |
| § | The U.S. federal income tax consequences of the notes are uncertain, and may be adverse to a holder of the notes. See “Summary Tax Consequences” below and “U.S. Federal Income Tax Summary” beginning on page S-34 of product supplement STOCK LIRN-2. |
| Capped Leveraged Index Return Notes® | TS-5 |
| Capped Leveraged Index Return Notes® Linked to a Basket of 21 Common Equity Securities, due June , 2014 |
|
The Basket
The Basket is designed to allow investors to participate in the percentage changes in the prices of the Basket Components from the Starting Value to the Ending Value of the Basket. The Basket Components are described in the section “The Basket Components” below. Each Basket Component will be assigned an initial weight on the pricing date, as set forth in the table below.
For more information on the calculation of the value of the Basket, please see the section entitled “Description of LIRNs — Basket Market Measures” beginning on page S-28 of product supplement STOCK LIRN-2.
If June 12, 2012 were the pricing date, for each Basket Component, the Initial Component Weight, the closing price, the hypothetical Component Ratio and the initial contribution to the Basket value would be as follows:
| Basket Component |
Bloomberg Symbol |
Initial Component Weight |
Closing Price(1)(2) |
Component Ratio(1)(3) |
Initial Basket Value Contribution | |||||
| Amazon.com, Inc. |
AMZN | 4.7619% | 216.42 | 0.02200307 |
4.7619 | |||||
| Apple Inc. |
AAPL | 4.7619% | 576.16 | 0.00826490 |
4.7619 | |||||
| Chevron Corporation |
CVX | 4.7619% | 100.74 | 0.04726921 |
4.7619 | |||||
| Chipotle Mexican Grill, Inc. |
CMG | 4.7619% | 400.19 | 0.01189911 |
4.7619 | |||||
| The Coca-Cola Company |
KO | 4.7619% | 75.20 | 0.06332314 |
4.7619 | |||||
| Colgate-Palmolive Company |
CL | 4.7619% | 100.05 | 0.04759520 |
4.7619 | |||||
| Ecopetrol SA |
EC | 4.7619% | 57.87 | 0.08228616 |
4.7619 | |||||
| Exxon Mobil Corporation |
XOM | 4.7619% | 81.26 | 0.05860079 |
4.7619 | |||||
| Gilead Sciences, Inc. |
GILD | 4.7619% | 49.42 | 0.09635573 |
4.7619 | |||||
| International Business Machines Corporation |
IBM | 4.7619% | 194.55 | 0.02447648 |
4.7619 | |||||
| Johnson & Johnson |
JNJ | 4.7619% | 63.08 | 0.07548985 |
4.7619 | |||||
| LKQ Corporation |
LKQ | 4.7619% | 35.47 | 0.13425148 |
4.7619 | |||||
| Marathon Oil Corporation |
MRO | 4.7619% | 24.76 | 0.19232229 |
4.7619 | |||||
| McDonald’s Corporation |
MCD | 4.7619% | 87.51 | 0.05441550 |
4.7619 | |||||
| Microsoft Corporation |
MSFT | 4.7619% | 29.29 | 0.16257767 |
4.7619 | |||||
| PepsiCo, Inc. |
PEP | 4.7619% | 68.40 | 0.06961842 |
4.7619 | |||||
| The Procter & Gamble Company |
PG | 4.7619% | 62.76 | 0.07587476 |
4.7619 | |||||
| QUALCOMM Incorporated |
QCOM | 4.7619% | 59.40 | 0.08016667 |
4.7619 | |||||
| Raytheon Company |
RTN | 4.7619% | 52.37 | 0.09092801 |
4.7619 | |||||
| Signature Bank Corp |
SBNY | 4.7619% | 59.99 | 0.07937823 |
4.7619 | |||||
| TransDigm Group Incorporated |
TDG | 4.7619% | 126.84 | 0.03754257 |
4.7619 | |||||
| Starting Value | 100.00 |
| (1) | The actual closing price of each Basket Component and the resulting actual Component Ratios will be determined on the pricing date, subject to adjustment as more fully described below. The actual closing price and Component Ratio of each Basket Component will be set forth in the final term sheet that will be made available in connection with sales of the notes. |
| (2) | These were the closing prices of the Basket Components on June 12, 2012. |
| (3) | Each hypothetical Component Ratio equals the Initial Component Weight of the relevant Basket Component (as a percentage) multiplied by 100, and then divided by the closing price of that Basket Component on June 12, 2012 and rounded to eight decimal places. |
The calculation agent will calculate the value of the Basket on each calculation day during the Maturity Valuation Period by summing the products of the closing price for each Basket Component (multiplied by its Price Multiplier) on that calculation day and the Component Ratio applicable to that Basket Component. If a Market Disruption Event occurs as to any Basket Component on a scheduled calculation day, the closing price of that Basket Component will be determined as more fully described beginning on page S-29 of product supplement STOCK LIRN-2 in the section “Description of LIRNs — Basket Market Measures — Computation of the Basket.”
If a Market Disruption Event occurs on the pricing date as to any Basket Component, the calculation agent will establish the closing price of that Basket Component on the pricing date (the “Basket Component Closing Value”), and thus its Component Ratio, based on the closing price of that Basket Component on the first trading day following the pricing date on which no Market Disruption Event occurs with respect to that Basket Component. If a Market Disruption Event occurs with respect to that Basket Component on the pricing date and on each day to and including the second scheduled trading day following the pricing date, the calculation agent (not later than the close of business in New York, New York on the second scheduled trading day following the pricing date) will estimate the Basket Component Closing Value, and thus the applicable Component Ratio, in a manner that the calculation agent considers commercially reasonable under the circumstances. The final term sheet will set forth the Basket Component Closing Value, a brief statement of the facts relating to the establishment of the Basket Component Closing Value (including the applicable Market Disruption Event(s)), and the applicable Component Ratio.
| Capped Leveraged Index Return Notes® | TS-6 |
| Capped Leveraged Index Return Notes® Linked to a Basket of 21 Common Equity Securities, due June , 2014 |
|
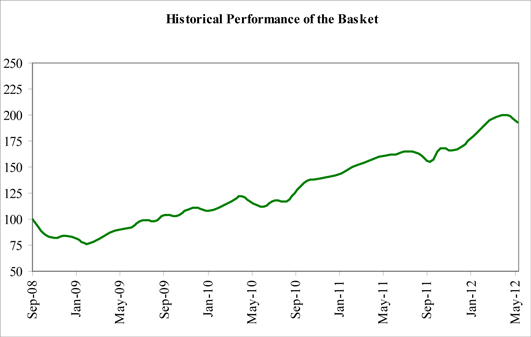
While actual historical information on the Basket will not exist before the pricing date, the following graph sets forth the hypothetical historical monthly performance of the Basket from September 2008 through May 2012. The graph is based upon actual month-end historical levels of the Basket Components, hypothetical Component Ratios determined as of September 30, 2008, and a Basket value of 100.00 as of that date. This hypothetical historical data on the Basket is not necessarily indicative of the future performance of the Basket or what the value of the notes may be. Any historical upward or downward trend in the value of the Basket during any period set forth below is not an indication that the value of the Basket is more or less likely to increase or decrease at any time over the term of the notes.
| Capped Leveraged Index Return Notes® | TS-7 |
| Capped Leveraged Index Return Notes® Linked to a Basket of 21 Common Equity Securities, due June , 2014 |
|
The Basket Components
We have derived the following information about the Underlying Companies from publicly available documents that they have published. We have not independently verified the following information.
Because each Basket Component is registered under the Securities Exchange Act of 1934, the Underlying Companies are required to file periodically certain financial and other information specified by the SEC. Information provided to or filed with the SEC by the Underlying Companies can be located at the Public Reference Section of the SEC, 100 F Street, N.E., Room 1580, Washington, D.C. 20549 or through the SEC’s web site at http://www.sec.gov by reference to the applicable CIK number set forth below.
This term sheet relates only to the notes and does not relate to any securities of the Underlying Companies. Neither we nor any of our affiliates have participated or will participate in the preparation of the Underlying Companies’ publicly available documents. Neither we nor any of our affiliates have made any due diligence inquiry with respect to the Underlying Companies in connection with the offering of the notes. Neither we nor any of our affiliates make any representation that the publicly available documents or any other publicly available information regarding the Underlying Companies are accurate or complete. Furthermore, there can be no assurance that all events occurring prior to the date of this term sheet, including events that would affect the accuracy or completeness of these publicly available documents that would affect the trading price of the Basket Components, have been or will be publicly disclosed. Subsequent disclosure of any events or the disclosure of or failure to disclose material future events concerning the Underlying Companies could affect the value of the Basket Components and therefore could affect your return on the notes. The selection of the Basket Components is not a recommendation to buy or sell shares of the Basket Components.
The tables set forth below shows the quarterly high and low Closing Market Prices of the shares of each Basket Components on its primary exchange from the first quarter of 2007 (or the first quarter when it was listed) through June 12, 2012. We obtained this historical data from Bloomberg L.P. We have not independently verified the accuracy or completeness of the information obtained from Bloomberg L.P.
Amazon.com, Inc.
Amazon.com, Inc. is an online retailer that offers a wide range of products. The company’s products include books, music, videotapes, computers, electronics, home and garden, and numerous other products. It offers personalized shopping services, Web-based credit card payment, and direct shipping to customers. This Basket Component trades on The NASDAQ Global Select Market (“NASDAQ”) under the symbol “AMZN.” The company’s CIK number is 18724.
| High ($) | Low ($) | |||||
| 2007 |
First quarter | 41.51 | 36.43 | |||
| Second quarter | 73.65 | 40.42 | ||||
| Third quarter | 93.45 | 68.73 | ||||
| Fourth quarter | 100.82 | 77.00 | ||||
| 2008 |
First quarter | 96.25 | 62.43 | |||
| Second quarter | 84.51 | 71.99 | ||||
| Third quarter | 88.09 | 63.35 | ||||
| Fourth quarter | 69.58 | 35.03 | ||||
| 2009 |
First quarter | 75.58 | 48.44 | |||
| Second quarter | 87.56 | 73.50 | ||||
| Third quarter | 93.85 | 75.63 | ||||
| Fourth quarter | 142.25 | 88.67 | ||||
| 2010 |
First quarter | 136.55 | 116.00 | |||
| Second quarter | 150.09 | 108.61 | ||||
| Third quarter | 160.73 | 109.14 | ||||
| Fourth quarter | 184.76 | 153.03 | ||||
| 2011 |
First quarter | 191.25 | 160.97 | |||
| Second quarter | 206.07 | 178.34 | ||||
| Third quarter | 241.69 | 177.79 | ||||
| Fourth quarter | 246.71 | 173.10 | ||||
| 2012 |
First quarter | 205.44 | 175.93 | |||
| Second quarter (through June 12, 2012) | 231.90 | 185.50 | ||||
| Capped Leveraged Index Return Notes® | TS-8 |
| Capped Leveraged Index Return Notes® Linked to a Basket of 21 Common Equity Securities, due June , 2014 |
|
Apple Inc.
Apple Inc. designs, manufactures, and markets personal computers and related personal computing and mobile communication devices, along with a variety of related software, services, peripherals, and networking solutions. The company sells its products worldwide through its online stores, its retail stores, its direct sales force, third-party wholesalers, and resellers. This Basket Component trades on NASDAQ under the symbol “AAPL.” The company’s CIK number is 320193.
| High ($) | Low ($) | |||||
| 2007 |
First quarter | 97.13 | 83.27 | |||
| Second quarter | 125.09 | 90.24 | ||||
| Third quarter | 154.50 | 117.05 | ||||
| Fourth quarter | 199.83 | 153.76 | ||||
| 2008 |
First quarter | 194.97 | 119.15 | |||
| Second quarter | 189.96 | 147.14 | ||||
| Third quarter | 179.69 | 105.26 | ||||
| Fourth quarter | 111.04 | 80.49 | ||||
| 2009 |
First quarter | 109.87 | 78.20 | |||
| Second quarter | 144.67 | 108.69 | ||||
| Third quarter | 186.15 | 135.40 | ||||
| Fourth quarter | 211.64 | 180.76 | ||||
| 2010 |
First quarter | 235.83 | 192.00 | |||
| Second quarter | 274.16 | 235.86 | ||||
| Third quarter | 292.46 | 240.16 | ||||
| Fourth quarter | 325.47 | 278.64 | ||||
| 2011 |
First quarter | 363.13 | 326.72 | |||
| Second quarter | 353.10 | 315.32 | ||||
| Third quarter | 413.45 | 343.23 | ||||
| Fourth quarter | 422.24 | 363.50 | ||||
| 2012 |
First quarter | 617.62 | 411.23 | |||
| Second quarter (through June 12, 2012) | 636.23 | 530.12 | ||||
Chevron Corporation
Chevron Corporation is an integrated energy company with operations in countries located around the world. The company produces and transports crude oil and natural gas. It also refines, markets, and distributes fuels as well as is involved in chemical operations, mining operations, power generation and energy services. This Basket Component trades on the New York Stock Exchange (the “NYSE”) under the symbol “CVX.” The company’s CIK number is 93410.
| High ($) | Low ($) | |||||
| 2007 |
First quarter | 74.95 | 66.43 | |||
| Second quarter | 84.24 | 74.83 | ||||
| Third quarter | 94.84 | 80.76 | ||||
| Fourth quarter | 94.86 | 83.79 | ||||
| 2008 |
First quarter | 94.61 | 77.51 | |||
| Second quarter | 103.09 | 86.74 | ||||
| Third quarter | 99.08 | 77.50 | ||||
| Fourth quarter | 82.20 | 57.83 | ||||
| 2009 |
First quarter | 77.35 | 56.46 | |||
| Second quarter | 72.67 | 63.75 | ||||
| Third quarter | 72.64 | 61.40 | ||||
| Fourth quarter | 79.64 | 68.14 | ||||
| 2010 |
First quarter | 80.88 | 70.13 | |||
| Second quarter | 82.83 | 67.86 | ||||
| Third quarter | 81.28 | 67.31 | ||||
| Fourth quarter | 91.60 | 80.97 | ||||
| 2011 |
First quarter | 108.01 | 90.41 | |||
| Second quarter | 109.66 | 97.90 | ||||
| Third quarter | 109.43 | 90.01 | ||||
| Fourth quarter | 109.64 | 89.88 | ||||
| 2012 |
First quarter | 111.19 | 102.85 | |||
| Second quarter (through June 12, 2012) | 108.30 | 96.41 | ||||
| Capped Leveraged Index Return Notes® | TS-9 |
| Capped Leveraged Index Return Notes® Linked to a Basket of 21 Common Equity Securities, due June , 2014 |
|
Chipotle Mexican Grill, Inc.
Chipotle Mexican Grill, Inc. owns and operates quick serve Mexican restaurants. The company operates restaurants throughout the United States. This Basket Component trades on the NYSE under the symbol “CMG.” The company’s CIK number is 1058090.
| High ($) | Low ($) | |||||
| 2007 |
First quarter | 65.03 | 55.00 | |||
| Second quarter | 87.81 | 62.74 | ||||
| Third quarter | 119.26 | 78.54 | ||||
| Fourth quarter | 152.36 | 117.12 | ||||
| 2008 |
First quarter | 146.67 | 90.57 | |||
| Second quarter | 119.73 | 82.62 | ||||
| Third quarter | 83.84 | 55.49 | ||||
| Fourth quarter | 64.63 | 38.69 | ||||
| 2009 |
First quarter | 70.75 | 47.42 | |||
| Second quarter | 88.90 | 67.17 | ||||
| Third quarter | 97.05 | 76.85 | ||||
| Fourth quarter | 93.25 | 79.74 | ||||
| 2010 |
First quarter | 115.27 | 86.43 | |||
| Second quarter | 152.92 | 114.48 | ||||
| Third quarter | 176.67 | 129.60 | ||||
| Fourth quarter | 258.82 | 172.96 | ||||
| 2011 |
First quarter | 272.95 | 217.67 | |||
| Second quarter | 308.19 | 260.41 | ||||
| Third quarter | 336.14 | 273.20 | ||||
| Fourth quarter | 343.52 | 292.70 | ||||
| 2012 |
First quarter | 424.70 | 339.74 | |||
| Second quarter (through June 12, 2012) | 440.40 | 392.13 | ||||
The Coca-Cola Company
The Coca-Cola Company manufactures, markets, and distributes soft drink concentrates and syrups. The company also distributes and markets juice and juice-drink products. It distributes its products to retailers and wholesalers in the United States and internationally. This Basket Component trades on the NYSE under the symbol “KO.” The company’s CIK number is 21344.
| High ($) | Low ($) | |||||
| 2007 |
First quarter | 48.74 | 45.89 | |||
| Second quarter | 53.61 | 48.52 | ||||
| Third quarter | 57.47 | 52.09 | ||||
| Fourth quarter | 64.09 | 57.19 | ||||
| 2008 |
First quarter | 65.56 | 57.40 | |||
| Second quarter | 61.44 | 51.84 | ||||
| Third quarter | 55.41 | 49.60 | ||||
| Fourth quarter | 54.16 | 41.01 | ||||
| 2009 |
First quarter | 45.90 | 37.85 | |||
| Second quarter | 49.76 | 42.24 | ||||
| Third quarter | 53.76 | 48.12 | ||||
| Fourth quarter | 59.11 | 53.12 | ||||
| 2010 |
First quarter | 57.13 | 52.65 | |||
| Second quarter | 55.32 | 50.08 | ||||
| Third quarter | 59.10 | 50.03 | ||||
| Fourth quarter | 65.77 | 58.88 | ||||
| 2011 |
First quarter | 66.35 | 61.60 | |||
| Second quarter | 68.46 | 64.93 | ||||
| Third quarter | 71.23 | 63.96 | ||||
| Fourth quarter | 70.16 | 64.74 | ||||
| 2012 |
First quarter | 74.01 | 66.99 | |||
| Second quarter (through June 12, 2012) | 77.47 | 71.94 | ||||
| Capped Leveraged Index Return Notes® | TS-10 |
| Capped Leveraged Index Return Notes® Linked to a Basket of 21 Common Equity Securities, due June , 2014 |
|
Colgate-Palmolive Company
Colgate-Palmolive Company is a consumer products company that markets its products throughout the world. The company’s products include toothpaste, toothbrushes, shampoos, deodorants, bar and liquid soaps, dishwashing liquid, and laundry products, as well as pet nutrition products for cats and dogs. This Basket Component trades on the NYSE under the symbol “CL.” The company’s CIK number is 21665.
| High ($) | Low ($) | |||||
| 2007 |
First quarter | 68.87 | 65.10 | |||
| Second quarter | 68.15 | 64.44 | ||||
| Third quarter | 71.62 | 64.91 | ||||
| Fourth quarter | 80.64 | 71.38 | ||||
| 2008 |
First quarter | 80.98 | 73.50 | |||
| Second quarter | 78.89 | 68.21 | ||||
| Third quarter | 79.99 | 68.56 | ||||
| Fourth quarter | 76.76 | 54.77 | ||||
| 2009 |
First quarter | 69.32 | 55.05 | |||
| Second quarter | 71.76 | 57.29 | ||||
| Third quarter | 76.55 | 71.02 | ||||
| Fourth quarter | 86.32 | 75.82 | ||||
| 2010 |
First quarter | 85.46 | 79.07 | |||
| Second quarter | 85.81 | 76.93 | ||||
| Third quarter | 84.59 | 73.84 | ||||
| Fourth quarter | 81.18 | 73.75 | ||||
| 2011 |
First quarter | 81.21 | 75.93 | |||
| Second quarter | 89.11 | 79.90 | ||||
| Third quarter | 93.96 | 80.18 | ||||
| Fourth quarter | 93.92 | 86.48 | ||||
| 2012 |
First quarter | 97.78 | 88.25 | |||
| Second quarter (through June 12, 2012) | 101.32 | 96.17 | ||||
Ecopetrol SA
Ecopetrol SA is an integrated oil company. The company owns interests in oil producing fields in the central area, south, west and north of Colombia as well as refineries, ports for fuel exports and imports on both coasts and the transportation network of pipelines and polyducts throughout the Colombian territory. This Basket Component, which is an ADR, trades on the NYSE under the symbol “EC.”
| High ($) | Low ($) | |||||
| 2008 |
Third quarter | 27.25 | 23.52 | |||
| Fourth quarter | 24.50 | 15.04 | ||||
| 2009 |
First quarter | 19.50 | 15.31 | |||
| Second quarter | 24.90 | 17.24 | ||||
| Third quarter | 28.77 | 23.64 | ||||
| Fourth quarter | 30.00 | 23.96 | ||||
| 2010 |
First quarter | 28.73 | 23.60 | |||
| Second quarter | 29.58 | 26.00 | ||||
| Third quarter | 42.36 | 28.84 | ||||
| Fourth quarter | 51.92 | 40.17 | ||||
| 2011 |
First quarter | 43.81 | 39.54 | |||
| Second quarter | 46.00 | 39.66 | ||||
| Third quarter | 45.53 | 39.31 | ||||
| Fourth quarter | 44.70 | 38.47 | ||||
| 2012 |
First quarter | 61.86 | 44.97 | |||
| Second quarter (through June 12, 2012) | 67.48 | 57.31 | ||||
| Capped Leveraged Index Return Notes® | TS-11 |
| Capped Leveraged Index Return Notes® Linked to a Basket of 21 Common Equity Securities, due June , 2014 |
|
Exxon Mobil Corporation
Exxon Mobil Corporation operates petroleum and petrochemicals businesses on a worldwide basis. The company’s operations include exploration and production of oil and gas, electric power generation, and coal and minerals operations. It also manufactures and markets fuels, lubricants, and chemicals. This Basket Component trades on the NYSE under the symbol “XOM.” The company’s CIK number is 34088.
| High ($) | Low ($) | |||||
| 2007 |
First quarter | 76.24 | 69.86 | |||
| Second quarter | 86.36 | 76.16 | ||||
| Third quarter | 93.44 | 80.67 | ||||
| Fourth quarter | 95.05 | 84.11 | ||||
| 2008 |
First quarter | 93.83 | 81.44 | |||
| Second quarter | 94.56 | 84.91 | ||||
| Third quarter | 88.35 | 73.25 | ||||
| Fourth quarter | 83.14 | 62.35 | ||||
| 2009 |
First quarter | 81.64 | 62.22 | |||
| Second quarter | 74.05 | 64.75 | ||||
| Third quarter | 72.75 | 65.12 | ||||
| Fourth quarter | 76.47 | 66.58 | ||||
| 2010 |
First quarter | 70.30 | 64.35 | |||
| Second quarter | 69.29 | 57.07 | ||||
| Third quarter | 62.72 | 56.57 | ||||
| Fourth quarter | 73.42 | 62.19 | ||||
| 2011 |
First quarter | 87.07 | 74.55 | |||
| Second quarter | 88.00 | 76.78 | ||||
| Third quarter | 85.22 | 68.03 | ||||
| Fourth quarter | 85.28 | 71.15 | ||||
| 2012 |
First quarter | 87.49 | 83.53 | |||
| Second quarter (through June 12, 2012) | 87.07 | 77.60 | ||||
Gilead Sciences, Inc.
Gilead Sciences, Inc. is a research-based biopharmaceutical company that discovers, develops, and commercializes therapeutics to advance the care of patients suffering from life-threatening diseases. The company’s primary areas of focus include HIV/AIDS, liver disease and serious cardiovascular and respiratory conditions. This Basket Component trades on NASDAQ under the symbol “GILD.” The company’s CIK number is 882095.
| High ($) | Low ($) | |||||
| 2007 |
First quarter | 38.25 | 31.37 | |||
| Second quarter | 42.11 | 38.26 | ||||
| Third quarter | 41.12 | 35.67 | ||||
| Fourth quarter | 47.74 | 41.21 | ||||
| 2008 |
First quarter | 51.53 | 42.92 | |||
| Second quarter | 56.64 | 49.96 | ||||
| Third quarter | 57.10 | 42.44 | ||||
| Fourth quarter | 51.33 | 37.47 | ||||
| 2009 |
First quarter | 52.80 | 43.71 | |||
| Second quarter | 48.37 | 41.44 | ||||
| Third quarter | 49.81 | 44.24 | ||||
| Fourth quarter | 47.49 | 42.55 | ||||
| 2010 |
First quarter | 49.45 | 43.26 | |||
| Second quarter | 46.35 | 32.91 | ||||
| Third quarter | 36.51 | 31.86 | ||||
| Fourth quarter | 40.33 | 35.36 | ||||
| 2011 |
First quarter | 42.51 | 36.58 | |||
| Second quarter | 42.81 | 38.84 | ||||
| Third quarter | 43.21 | 35.34 | ||||
| Fourth quarter | 42.79 | 36.26 | ||||
| 2012 |
First quarter | 56.03 | 41.86 | |||
| Second quarter (through June 12, 2012) | 52.72 | 45.40 | ||||
| Capped Leveraged Index Return Notes® | TS-12 |
| Capped Leveraged Index Return Notes® Linked to a Basket of 21 Common Equity Securities, due June , 2014 |
|
International Business Machines Corporation
International Business Machines Corporation provides computer solutions through the use of advanced information technology. The company’s solutions include technologies, systems, products, services, software, and financing. It offers its products through its global sales and distribution organization, as well as through a variety of third party distributors and resellers. This Basket Component trades on the NYSE under the symbol “IBM.” The company’s CIK number is 51143.
| High ($) | Low ($) | |||||
| 2007 |
First quarter | 100.82 | 90.90 | |||
| Second quarter | 107.99 | 94.29 | ||||
| Third quarter | 118.19 | 105.01 | ||||
| Fourth quarter | 119.60 | 100.65 | ||||
| 2008 |
First quarter | 119.06 | 97.50 | |||
| Second quarter | 129.71 | 114.81 | ||||
| Third quarter | 130.00 | 111.47 | ||||
| Fourth quarter | 110.13 | 71.74 | ||||
| 2009 |
First quarter | 98.78 | 81.98 | |||
| Second quarter | 109.40 | 97.61 | ||||
| Third quarter | 122.11 | 100.19 | ||||
| Fourth quarter | 132.57 | 117.90 | ||||
| 2010 |
First quarter | 134.14 | 121.88 | |||
| Second quarter | 132.68 | 122.10 | ||||
| Third quarter | 135.48 | 121.86 | ||||
| Fourth quarter | 146.92 | 135.25 | ||||
| 2011 |
First quarter | 166.05 | 147.05 | |||
| Second quarter | 172.87 | 162.33 | ||||
| Third quarter | 185.21 | 157.54 | ||||
| Fourth quarter | 194.56 | 173.29 | ||||
| 2012 |
First quarter | 208.65 | 179.16 | |||
| Second quarter (through June 12, 2012) | 209.50 | 188.54 | ||||
Johnson & Johnson
Johnson & Johnson manufactures health care products and provides related services for the consumer, pharmaceutical, and medical devices and diagnostics markets. The company sells products such as skin and hair care products, acetaminophen products, pharmaceuticals, diagnostic equipment, and surgical equipment in countries located around the world. This Basket Component trades on the NYSE under the symbol “JNJ.” The company’s CIK number is 200406.
| High ($) | Low ($) | |||||
| 2007 |
First quarter | 67.76 | 60.00 | |||
| Second quarter | 65.12 | 60.10 | ||||
| Third quarter | 65.70 | 59.77 | ||||
| Fourth quarter | 68.40 | 63.91 | ||||
| 2008 |
First quarter | 68.31 | 61.33 | |||
| Second quarter | 68.26 | 63.57 | ||||
| Third quarter | 72.22 | 64.64 | ||||
| Fourth quarter | 67.79 | 55.33 | ||||
| 2009 |
First quarter | 60.65 | 46.60 | |||
| Second quarter | 56.96 | 50.65 | ||||
| Third quarter | 61.79 | 55.98 | ||||
| Fourth quarter | 64.96 | 58.93 | ||||
| 2010 |
First quarter | 65.36 | 62.37 | |||
| Second quarter | 66.03 | 58.00 | ||||
| Third quarter | 62.43 | 57.02 | ||||
| Fourth quarter | 64.76 | 61.55 | ||||
| 2011 |
First quarter | 63.35 | 57.66 | |||
| Second quarter | 67.29 | 59.46 | ||||
| Third quarter | 67.92 | 60.20 | ||||
| Fourth quarter | 66.02 | 61.27 | ||||
| 2012 |
First quarter | 65.96 | 64.30 | |||
| Second quarter (through June 12, 2012) | 66.21 | 61.78 | ||||
| Capped Leveraged Index Return Notes® | TS-13 |
| Capped Leveraged Index Return Notes® Linked to a Basket of 21 Common Equity Securities, due June , 2014 |
|
LKQ Corporation
LKQ Corporation procures salvage vehicles, primarily at auctions, using locally based and centralized procurement systems. The company dismantles these vehicles for recycled products, and then sells recycled original equipment manufacturer products to automobile collision and mechanical repair shops and, indirectly, insurance companies and extended warranty companies. This Basket Component trades on NASDAQ under the symbol “LKQ.” The company’s CIK number is 1065696.
| High ($) | Low ($) | |||||
| 2007 |
First quarter | 11.40 | 10.01 | |||
| Second quarter | 12.88 | 10.90 | ||||
| Third quarter | 17.55 | 12.17 | ||||
| Fourth quarter | 22.62 | 16.94 | ||||
| 2008 |
First quarter | 23.91 | 17.70 | |||
| Second quarter | 22.86 | 16.90 | ||||
| Third quarter | 21.45 | 16.26 | ||||
| Fourth quarter | 16.00 | 8.88 | ||||
| 2009 |
First quarter | 15.05 | 10.83 | |||
| Second quarter | 17.55 | 14.30 | ||||
| Third quarter | 19.12 | 15.56 | ||||
| Fourth quarter | 20.01 | 16.90 | ||||
| 2010 |
First quarter | 20.76 | 18.15 | |||
| Second quarter | 21.57 | 17.50 | ||||
| Third quarter | 21.01 | 17.99 | ||||
| Fourth quarter | 23.18 | 20.42 | ||||
| 2011 |
First quarter | 26.05 | 22.35 | |||
| Second quarter | 26.65 | 23.04 | ||||
| Third quarter | 27.66 | 20.79 | ||||
| Fourth quarter | 30.53 | 22.83 | ||||
| 2012 |
First quarter | 33.47 | 30.74 | |||
| Second quarter (through June 12, 2012) | 36.44 | 29.41 | ||||
Marathon Oil Corporation
Marathon Oil Corporation is an independent international energy company engaged in exploration and production, oil sands mining and integrated gas. The company’s operations are focused in North America, Africa and Europe. This Basket Component trades on the NYSE under the symbol “MRO.” The company’s CIK number is 101778.
| High ($) | Low ($) | |||||
| 2007 |
First quarter | 31.13 | 25.32 | |||
| Second quarter | 40.22 | 30.29 | ||||
| Third quarter | 39.48 | 29.89 | ||||
| Fourth quarter | 38.00 | 32.38 | ||||
| 2008 |
First quarter | 37.57 | 27.46 | |||
| Second quarter | 33.42 | 27.27 | ||||
| Third quarter | 32.04 | 22.75 | ||||
| Fourth quarter | 23.56 | 11.89 | ||||
| 2009 |
First quarter | 18.13 | 12.70 | |||
| Second quarter | 20.28 | 16.44 | ||||
| Third quarter | 20.57 | 17.02 | ||||
| Fourth quarter | 21.41 | 18.50 | ||||
| 2010 |
First quarter | 19.94 | 17.02 | |||
| Second quarter | 20.71 | 18.33 | ||||
| Third quarter | 21.24 | 18.34 | ||||
| Fourth quarter | 22.48 | 20.08 | ||||
| 2011 |
First quarter | 32.36 | 22.67 | |||
| Second quarter | 32.88 | 29.78 | ||||
| Third quarter | 34.07 | 21.58 | ||||
| Fourth quarter | 29.34 | 20.27 | ||||
| 2012 |
First quarter | 35.06 | 30.47 | |||
| Second quarter (through June 12, 2012) | 32.23 | 23.84 | ||||
| Capped Leveraged Index Return Notes® | TS-14 |
| Capped Leveraged Index Return Notes® Linked to a Basket of 21 Common Equity Securities, due June , 2014 |
|
McDonald’s Corporation
McDonald’s Corporation franchises and operates fast-food restaurants in the global restaurant industry. The company’s restaurants serve a variety of value-priced menu products in countries around the world. This Basket Component trades on the NYSE under the symbol “MCD.” The company’s CIK number is 63908.
| High ($) | Low ($) | |||||||||||
| 2007 |
First quarter |
46.05 | 42.91 | |||||||||
| Second quarter |
52.50 | 44.82 | ||||||||||
| Third quarter |
55.45 | 47.56 | ||||||||||
| Fourth quarter |
63.13 | 55.95 | ||||||||||
| 2008 |
First quarter |
58.17 | 50.75 | |||||||||
| Second quarter |
61.17 | 55.40 | ||||||||||
| Third quarter |
65.95 | 57.19 | ||||||||||
| Fourth quarter |
63.66 | 51.55 | ||||||||||
| 2009 |
First quarter |
63.75 | 50.86 | |||||||||
| Second quarter |
60.99 | 52.40 | ||||||||||
| Third quarter |
58.82 | 54.23 | ||||||||||
| Fourth quarter |
64.53 | 56.61 | ||||||||||
| 2010 |
First quarter |
67.35 | 61.45 | |||||||||
| Second quarter |
71.52 | 65.87 | ||||||||||
| Third quarter |
76.08 | 66.11 | ||||||||||
| Fourth quarter |
80.34 | 74.92 | ||||||||||
| 2011 |
First quarter |
76.73 | 72.67 | |||||||||
| Second quarter |
84.57 | 75.99 | ||||||||||
| Third quarter |
90.79 | 82.11 | ||||||||||
| Fourth quarter |
100.81 | 85.83 | ||||||||||
| 2012 |
First quarter |
101.74 | 95.55 | |||||||||
| Second quarter (through June 12, 2012) |
99.40 | 86.32 | ||||||||||
Microsoft Corporation
Microsoft Corporation develops, manufactures, licenses, sells, and supports software products. The company offers operating system software, server application software, business and consumer applications software, software development tools, and Internet and intranet software. It also develops video game consoles and digital music entertainment devices. This Basket Component trades on NASDAQ under the symbol “MSFT.” The company’s CIK number is 789019.
| High ($) | Low ($) | |||||||||||
| 2007 |
First quarter |
31.21 | 26.72 | |||||||||
| Second quarter |
31.11 | 27.74 | ||||||||||
| Third quarter |
31.51 | 27.81 | ||||||||||
| Fourth quarter |
37.06 | 29.47 | ||||||||||
| 2008 |
First quarter |
35.37 | 26.99 | |||||||||
| Second quarter |
31.65 | 27.12 | ||||||||||
| Third quarter |
28.13 | 24.57 | ||||||||||
| Fourth quarter |
26.48 | 17.53 | ||||||||||
| 2009 |
First quarter |
20.76 | 15.15 | |||||||||
| Second quarter |
24.07 | 18.61 | ||||||||||
| Third quarter |
25.94 | 22.39 | ||||||||||
| Fourth quarter |
31.37 | 24.64 | ||||||||||
| 2010 |
First quarter |
31.10 | 27.72 | |||||||||
| Second quarter |
31.39 | 23.01 | ||||||||||
| Third quarter |
26.33 | 23.16 | ||||||||||
| Fourth quarter |
28.30 | 23.91 | ||||||||||
| 2011 |
First quarter |
28.83 | 24.78 | |||||||||
| Second quarter |
26.72 | 23.69 | ||||||||||
| Third quarter |
28.07 | 23.98 | ||||||||||
| Fourth quarter |
27.31 | 24.30 | ||||||||||
| 2012 |
First quarter |
32.85 | 26.83 | |||||||||
| Second quarter (through June 12, 2012) |
32.42 | 28.45 | ||||||||||
| Capped Leveraged Index Return Notes® | TS-15 |
| Capped Leveraged Index Return Notes® Linked to a Basket of 21 Common Equity Securities, due June , 2014 |
|
PepsiCo, Inc.
PepsiCo, Inc. operates worldwide beverage, snack and food businesses. The company manufacture or uses contract manufacturers, market and sell a variety of grain-based snacks, carbonated and non-carbonated beverages and foods in countries throughout the world. This Basket Component trades on the NYSE under the symbol “PEP.” The company’s CIK number is 77476.
| High ($) | Low ($) | |||||||||||
| 2007 |
First quarter |
65.38 | 62.16 | |||||||||
| Second quarter |
69.48 | 62.99 | ||||||||||
| Third quarter |
73.26 | 64.67 | ||||||||||
| Fourth quarter |
78.69 | 70.40 | ||||||||||
| 2008 |
First quarter |
79.57 | 66.73 | |||||||||
| Second quarter |
72.13 | 63.59 | ||||||||||
| Third quarter |
73.19 | 64.40 | ||||||||||
| Fourth quarter |
71.64 | 50.29 | ||||||||||
| 2009 |
First quarter |
55.97 | 45.81 | |||||||||
| Second quarter |
55.37 | 47.89 | ||||||||||
| Third quarter |
59.86 | 54.68 | ||||||||||
| Fourth quarter |
64.23 | 58.46 | ||||||||||
| 2010 |
First quarter |
66.86 | 58.96 | |||||||||
| Second quarter |
66.94 | 60.77 | ||||||||||
| Third quarter |
66.89 | 61.52 | ||||||||||
| Fourth quarter |
68.11 | 63.89 | ||||||||||
| 2011 |
First quarter |
66.91 | 62.31 | |||||||||
| Second quarter |
71.78 | 65.09 | ||||||||||
| Third quarter |
70.52 | 59.99 | ||||||||||
| Fourth quarter |
66.57 | 60.29 | ||||||||||
| 2012 |
First quarter |
66.76 | 62.28 | |||||||||
| Second quarter (through June 12, 2012) |
69.33 | 64.85 | ||||||||||
The Procter & Gamble Company
The Procter & Gamble Company manufactures and markets consumer products in countries throughout the world. The company provides products in the laundry and cleaning, paper, beauty care, food and beverage, and health care segments. Its products are sold primarily through mass merchandisers, grocery stores, membership club stores, drug stores, and neighborhood stores. This Basket Component trades on the NYSE under the symbol “PG.” The company’s CIK number is 80424.
| High ($) | Low ($) | |||||||||||
| 2007 |
First quarter |
66.09 | 61.17 | |||||||||
| Second quarter |
64.31 | 61.03 | ||||||||||
| Third quarter |
70.51 | 61.03 | ||||||||||
| Fourth quarter |
74.67 | 68.75 | ||||||||||
| 2008 |
First quarter |
72.60 | 64.68 | |||||||||
| Second quarter |
71.14 | 60.49 | ||||||||||
| Third quarter |
73.15 | 61.98 | ||||||||||
| Fourth quarter |
71.44 | 57.37 | ||||||||||
| 2009 |
First quarter |
62.80 | 44.18 | |||||||||
| Second quarter |
54.02 | 47.25 | ||||||||||
| Third quarter |
58.16 | 51.11 | ||||||||||
| Fourth quarter |
63.19 | 56.62 | ||||||||||
| 2010 |
First quarter |
64.53 | 59.84 | |||||||||
| Second quarter |
63.94 | 59.79 | ||||||||||
| Third quarter |
63.08 | 59.34 | ||||||||||
| Fourth quarter |
65.24 | 59.96 | ||||||||||
| 2011 |
First quarter |
66.70 | 59.73 | |||||||||
| Second quarter |
67.46 | 61.67 | ||||||||||
| Third quarter |
64.95 | 58.51 | ||||||||||
| Fourth quarter |
66.97 | 61.00 | ||||||||||
| 2012 |
First quarter |
67.90 | 62.77 | |||||||||
| Second quarter (through June 12, 2012) |
67.56 | 61.17 | ||||||||||
| Capped Leveraged Index Return Notes® | TS-16 |
| Capped Leveraged Index Return Notes® Linked to a Basket of 21 Common Equity Securities, due June , 2014 |
|
QUALCOMM Incorporated
QUALCOMM Incorporated manufactures digital wireless communications equipment. The company licenses its code division multiple access (CDMA) and orthogonal frequency division multiplexing access intellectual property to other companies, and produces CDMA-based integrated circuits, and produces equipment and software used to track workers and assets, and software for wireless content enablement. This Basket Component trades on NASDAQ under the symbol “QCOM.” The company’s CIK number is 804328.
| High ($) | Low ($) | |||||||||||
| 2007 |
First quarter |
43.73 | 37.15 | |||||||||
| Second quarter |
46.38 | 41.02 | ||||||||||
| Third quarter |
45.35 | 36.09 | ||||||||||
| Fourth quarter |
43.38 | 37.29 | ||||||||||
| 2008 |
First quarter |
43.79 | 35.97 | |||||||||
| Second quarter |
50.42 | 41.19 | ||||||||||
| Third quarter |
56.39 | 39.88 | ||||||||||
| Fourth quarter |
42.48 | 29.21 | ||||||||||
| 2009 |
First quarter |
39.54 | 32.78 | |||||||||
| Second quarter |
46.34 | 39.36 | ||||||||||
| Third quarter |
48.45 | 43.06 | ||||||||||
| Fourth quarter |
46.86 | 40.68 | ||||||||||
| 2010 |
First quarter |
49.47 | 35.56 | |||||||||
| Second quarter |
43.29 | 32.84 | ||||||||||
| Third quarter |
45.12 | 31.96 | ||||||||||
| Fourth quarter |
49.99 | 43.89 | ||||||||||
| 2011 |
First quarter |
59.58 | 50.21 | |||||||||
| Second quarter |
58.59 | 52.25 | ||||||||||
| Third quarter |
59.36 | 46.40 | ||||||||||
| Fourth quarter |
57.40 | 47.65 | ||||||||||
| 2012 |
First quarter |
68.59 | 55.27 | |||||||||
| Second quarter (through June 12, 2012) |
68.32 | 55.12 | ||||||||||
Raytheon Company
Raytheon Company is a technology company specializing in defense, homeland security and other government markets throughout the world. The company provides electronics, mission systems integration and other capabilities in the areas of sensing, effects, and command, control, communications and intelligence systems, as well as mission support services. This Basket Component trades on the NYSE under the symbol “RTN.” The company’s CIK number is 1047122.
| High ($) | Low ($) | |||||||||||
| 2007 |
First quarter |
55.37 | 51.10 | |||||||||
| Second quarter |
56.91 | 52.71 | ||||||||||
| Third quarter |
64.54 | 52.76 | ||||||||||
| Fourth quarter |
65.33 | 60.70 | ||||||||||
| 2008 |
First quarter |
67.11 | 59.82 | |||||||||
| Second quarter |
66.63 | 56.00 | ||||||||||
| Third quarter |
61.71 | 53.51 | ||||||||||
| Fourth quarter |
54.00 | 43.40 | ||||||||||
| 2009 |
First quarter |
52.67 | 33.57 | |||||||||
| Second quarter |
48.27 | 38.47 | ||||||||||
| Third quarter |
48.33 | 42.08 | ||||||||||
| Fourth quarter |
53.44 | 45.18 | ||||||||||
| 2010 |
First quarter |
57.67 | 50.73 | |||||||||
| Second quarter |
60.01 | 48.39 | ||||||||||
| Third quarter |
49.64 | 43.21 | ||||||||||
| Fourth quarter |
48.33 | 44.45 | ||||||||||
| 2011 |
First quarter |
52.51 | 46.09 | |||||||||
| Second quarter |
51.49 | 47.93 | ||||||||||
| Third quarter |
50.11 | 38.83 | ||||||||||
| Fourth quarter |
49.07 | 39.50 | ||||||||||
| 2012 |
First quarter |
52.96 | 47.99 | |||||||||
| Second quarter (through June 12, 2012) |
54.30 | 49.30 | ||||||||||
| Capped Leveraged Index Return Notes® | TS-17 |
| Capped Leveraged Index Return Notes® Linked to a Basket of 21 Common Equity Securities, due June , 2014 |
|
Signature Bank Corp
Signature Bank Corp is a full service commercial bank that serves privately owned business clients and their owners and senior managers. The bank offers business and personal banking products and services, as well as investment, brokerage, asset management and insurance products through its subsidiary, Signature Securities Group Corp. This Basket Component trades on NASDAQ under the symbol “SBNY.” The company’s CIK number is 1288784.
| High ($) | Low ($) | |||||||||||
| 2007 |
First quarter |
33.99 | 29.73 | |||||||||
| Second quarter |
34.84 | 30.79 | ||||||||||
| Third quarter |
37.43 | 30.64 | ||||||||||
| Fourth quarter |
37.55 | 32.21 | ||||||||||
| 2008 |
First quarter |
36.53 | 23.26 | |||||||||
| Second quarter |
29.74 | 24.42 | ||||||||||
| Third quarter |
37.00 | 23.14 | ||||||||||
| Fourth quarter |
35.99 | 25.42 | ||||||||||
| 2009 |
First quarter |
29.17 | 19.65 | |||||||||
| Second quarter |
29.84 | 24.96 | ||||||||||
| Third quarter |
31.39 | 26.63 | ||||||||||
| Fourth quarter |
32.77 | 28.05 | ||||||||||
| 2010 |
First quarter |
39.05 | 31.45 | |||||||||
| Second quarter |
42.39 | 36.53 | ||||||||||
| Third quarter |
40.12 | 36.14 | ||||||||||
| Fourth quarter |
51.18 | 38.41 | ||||||||||
| 2011 |
First quarter |
56.40 | 48.01 | |||||||||
| Second quarter |
58.32 | 53.61 | ||||||||||
| Third quarter |
60.69 | 46.40 | ||||||||||
| Fourth quarter |
61.60 | 44.73 | ||||||||||
| 2012 |
First quarter |
65.21 | 57.65 | |||||||||
| Second quarter (through June 12, 2012) |
66.56 | 58.41 | ||||||||||
TransDigm Group Incorporated
TransDigm Group Incorporated, through subsidiaries, manufactures aircraft components. The company produces ignition systems and components, gear pumps, mechanical/electromechanical actuators and controls, NiCad batteries/chargers, power conditioning devices, hold-open rods and locking devices, engineered connectors and latches, cockpit security devices, and AC/DC electric motors. This Basket Component trades on the NYSE under the symbol “TDG.” The company’s CIK number is 1260221.
| High ($) | Low ($) | |||||||||||
| 2007 |
First quarter |
36.90 | 25.35 | |||||||||
| Second quarter |
42.41 | 34.80 | ||||||||||
| Third quarter |
47.00 | 36.90 | ||||||||||
| Fourth quarter |
50.19 | 42.55 | ||||||||||
| 2008 |
First quarter |
45.56 | 35.62 | |||||||||
| Second quarter |
43.74 | 33.59 | ||||||||||
| Third quarter |
38.57 | 31.81 | ||||||||||
| Fourth quarter |
35.50 | 24.24 | ||||||||||
| 2009 |
First quarter |
39.75 | 30.63 | |||||||||
| Second quarter |
40.49 | 32.02 | ||||||||||
| Third quarter |
49.81 | 36.20 | ||||||||||
| Fourth quarter |
50.07 | 39.18 | ||||||||||
| 2010 |
First quarter |
53.77 | 47.50 | |||||||||
| Second quarter |
56.86 | 48.85 | ||||||||||
| Third quarter |
63.56 | 50.07 | ||||||||||
| Fourth quarter |
72.39 | 61.00 | ||||||||||
| 2011 |
First quarter |
83.83 | 73.75 | |||||||||
| Second quarter |
91.19 | 77.55 | ||||||||||
| Third quarter |
93.94 | 73.83 | ||||||||||
| Fourth quarter |
98.51 | 77.38 | ||||||||||
| 2012 |
First quarter |
118.79 | 93.13 | |||||||||
| Second quarter (through June 12, 2012) |
129.38 | 111.93 | ||||||||||
| Capped Leveraged Index Return Notes® | TS-18 |
| Capped Leveraged Index Return Notes® Linked to a Basket of 21 Common Equity Securities, due June , 2014 |
|
Supplement to the Plan of Distribution
We may deliver the notes against payment therefor in New York, New York on a date that is greater than three business days following the pricing date. Under Rule 15c6-1 of the Securities Exchange Act of 1934, trades in the secondary market generally are required to settle in three business days, unless the parties to any such trade expressly agree otherwise. Accordingly, if the initial settlement of the notes occurs more than three business days from the pricing date, purchasers who wish to trade the notes more than three business days prior to the original issue date will be required to specify alternative settlement arrangements to prevent a failed settlement.
The notes will not be listed on any securities exchange. In the original offering of the notes, the notes will be sold in minimum investment amounts of 100 units.
MLPF&S will not receive an underwriting discount for notes sold to certain fee-based trusts and fee-based discretionary accounts managed by U.S. Trust operating through Bank of America, N.A.
If you place an order to purchase the notes, you are consenting to MLPF&S acting as a principal in effecting the transaction for your account.
MLPF&S may repurchase and resell the notes, with repurchases and resales being made at prices related to then-prevailing market prices or at negotiated prices. MLPF&S may act as principal or agent in these market-making transactions; however it is not obligated to engage in any such transactions.
Role of MLPF&S and Conflicts of Interest
MLPF&S, a broker-dealer subsidiary of BAC, is a member of the Financial Industry Regulatory Authority, Inc. (“FINRA”) and will participate as selling agent in the distribution of the notes. Accordingly, offerings of the notes will conform to the requirements of Rule 5121 applicable to FINRA members. MLPF&S may not make sales in this offering to any of its discretionary accounts without the prior written approval of the account holder.
Under our distribution agreement with MLPF&S, MLPF&S will purchase the notes from us as principal at the public offering price indicated on the cover of this term sheet, less the indicated underwriting discount. The public offering price includes, in addition to the underwriting discount, a charge of approximately $0.075 per unit, reflecting an estimated profit earned by MLPF&S from transactions through which the notes are structured and resulting obligations hedged. Actual profits or losses from these hedging transactions may be more or less than this amount. In entering into the hedging arrangements for the notes, we seek competitive terms and may enter into hedging transactions with MLPF&S or another of our affiliates.
All charges related to the notes, including the underwriting discount and the hedging related costs and charges, reduce the economic terms of the notes. For further information regarding these charges, our trading and hedging activities and conflicts of interest, see “Risk Factors — General Risks Relating to LIRNs” beginning on page S-8 and “Use of Proceeds” on page S-17 of product supplement STOCK LIRN-2.
| Capped Leveraged Index Return Notes® | TS-19 |
| Capped Leveraged Index Return Notes® Linked to a Basket of 21 Common Equity Securities, due June , 2014 |
|
Summary Tax Consequences
You should consider the U.S. federal income tax consequences of an investment in the notes, including the following:
| • | There is no statutory, judicial, or administrative authority directly addressing the characterization of the notes. |
| • | You agree with us (in the absence of an administrative determination, or judicial ruling to the contrary) to characterize and treat the notes for all tax purposes as a single financial contract with respect to the Market Measure. |
| • | Under this characterization and tax treatment of the notes, a U.S. Holder (as defined beginning on page 62 of the prospectus) generally will recognize capital gain or loss upon maturity or upon a sale or exchange of the notes prior to maturity. This capital gain or loss generally will be long-term capital gain or loss if you held the notes for more than one year. |
| • | No assurance can be given that the IRS or any court will agree with this characterization and tax treatment. |
You should consult your own tax advisor concerning the U.S. federal income tax consequences to you of acquiring, owning, and disposing of the notes, as well as any tax consequences arising under the laws of any state, local, foreign, or other tax jurisdiction and the possible effects of changes in U.S. federal or other tax laws. You should review carefully the discussion under the section entitled “U.S. Federal Income Tax Summary” beginning on page S-34 of product supplement STOCK LIRN-2.
Where You Can Find More Information
We have filed a registration statement (including a product supplement, a prospectus supplement, and a prospectus) with the SEC for the offering to which this term sheet relates. Before you invest, you should read the Note Prospectus, including this term sheet, and the other documents that we have filed with the SEC, for more complete information about us and this offering. You may get these documents without cost by visiting EDGAR on the SEC website at www.sec.gov. Alternatively, we, any agent, or any dealer participating in this offering will arrange to send you these documents if you so request by calling MLPF&S toll-free at 1-866-500-5408.
Market-Linked Investments Classification

MLPF&S classifies certain market-linked investments (the “Market-Linked Investments”) into categories, each with different investment characteristics. The following description is meant solely for informational purposes and is not intended to represent any particular Enhanced Return Market-Linked Investment or guarantee any performance.
Enhanced Return Market-Linked Investments are short- to medium-term investments that offer you a way to enhance exposure to a particular market view without taking on a similarly enhanced level of market downside risk. They can be especially effective in a flat to moderately positive market (or, in the case of bearish investments, a flat to moderately negative market). In exchange for the potential to receive better-than market returns on the linked asset, you must generally accept market downside risk and capped upside potential. As these investments are not market downside protected, and do not assure full repayment of principal at maturity, you need to be prepared for the possibility that you may lose all or part of your investment.
“Leveraged Index Return Notes®” and “LIRNs®” are our registered service marks.
| Capped Leveraged Index Return Notes® | TS-20 |