Filed Pursuant to Rule 433
Registration No. 333-180488
Subject to Completion
Preliminary Term Sheet dated March 1, 2013
The notes are being issued by Bank of America Corporation (“BAC”). There are important differences between the notes and a conventional debt security, including different investment risks and certain additional costs. See “Risk Factors” and “Additional Risk Factor” on page TS-7 of this term sheet and “Risk Factors” beginning on page S-8 of product supplement STOCK SUN-2.
The estimated initial value of the notes at the time the terms of the notes are set will be less than the public offering price. See “Summary” on the following page, “Risk Factors” on page TS-7 of this term sheet and “Structuring the Notes” on page TS-23 of this term sheet for additional information. The actual value of your notes at any time will reflect many factors and cannot be predicted with accuracy.
None of the Securities and Exchange Commission (the “SEC”), any state securities commission, or any other regulatory body has approved or disapproved of these securities or determined if this Note Prospectus (as defined below) is truthful or complete. Any representation to the contrary is a criminal offense.
| Per Unit |
Total |
|||||||||
| Public offering price (1) (2) |
$10.00 | $ | ||||||||
| Underwriting discount (1) (2) |
$0.20 | $ | ||||||||
| Proceeds, before expenses, to BAC |
$9.80 | $ | ||||||||
| (1) | For any purchase of 500,000 units or more in a single transaction by an individual investor, the public offering price and the underwriting discount will be $9.95 per unit and $0.15 per unit, respectively. |
| (2) | For any purchase by certain fee-based trusts and discretionary accounts managed by U.S. Trust operating through Bank of America, N.A., the public offering price and underwriting discount will be $9.80 per unit and $0.00 per unit, respectively. |
The notes:
| Are Not FDIC Insured | Are Not Bank Guaranteed | May Lose Value |
Merrill Lynch & Co.
March , 2013
Units $10 principal amount per unit CUSIP No. Pricing Date* March , 2013 Settlement Date* April , 2013 Maturity Date* March , 2016 *Subject to change based on the actual date the notes are priced for initial sale to the public (the “pricing date”) Autocallable Market-Linked Step Up Notes Linked to a Basket of 23 Common Equity Securities Maturity of approximately three years if not called prior to maturity The Basket will be comprised of the common equity securities of 23 different companies (the “Basket Stocks”) Automatic call of the notes per unit at $10 plus the applicable Call Premium ($0.85 on the first Observation Date and $1.70 on the second Observation Date) if the Basket is flat or increases above 100% of the Starting Value on the relevant Observation Date The Observation Dates will occur approximately one year and two years after the pricing date If the notes are not called, at maturity: a return of [20% to 26%] if the Basket is flat or increases up to the Step Up Value a return equal to the percentage increase in the level of the Basket if the Basket increases above the Step Up Value 1-to-1 downside exposure to decreases in the level of the Basket, with up to 100% of your principal at risk All payments are subject to the credit risk of Bank of America Corporation No periodic interest payments Limited secondary market liquidity, with no exchange listing bank of America Enhanced Return
| Autocallable Market-Linked Step Up Notes Linked to a Basket of 23 Common Equity Securities, due March , 2016 |

|
Summary
The Autocallable Market-Linked Step Up Notes Linked to a Basket of 23 Common Equity Securities, due March , 2016 (the “notes”) are our senior unsecured debt securities. The notes are not guaranteed or insured by the Federal Deposit Insurance Corporation or secured by collateral. The notes will rank equally with all of our other unsecured and unsubordinated debt. Any payments due on the notes, including any repayment of principal, will be subject to the credit risk of BAC. The notes will be automatically called at the applicable Call Amount if the Observation Level of the Market Measure, which is an equally weighted basket of 23 Common Equity Securities (the “Basket”), is equal to or greater than the Call Level on the relevant Observation Date. If not called, at maturity, the notes provide you with a Step Up Payment if the Ending Value of the Basket is equal to or greater than its Starting Value, but is not greater than the Step Up Value. If the Ending Value is greater than the Step Up Value, you will participate on a 1-for-1 basis in the increase in the level of the Basket above the Starting Value. If the Ending Value is less than the Starting Value, you will lose all or a portion of the principal amount of your notes. The amounts that we will pay on the notes will be based on the performance of the Basket and calculated based on the $10 per unit Original Offering Price. See “Terms of the Notes” below.
Payments on the notes depend on our credit risk and on the performance of the Basket. The economic terms of the notes (including the Step Up Payment) are based on the rate we would pay to borrow funds through the issuance of market-linked notes and the terms of certain related hedging arrangements. The implied borrowing rate for market-linked notes is typically lower than the rate we would pay when we issue conventional fixed or floating rate debt securities. This difference in borrowing rate, as well as the underwriting discount and the hedging related charge described below, will reduce the economic terms of the notes to you and the estimated initial value of the notes.
Due to these factors, the public offering price you pay to purchase the notes will be greater than the estimated initial value of the notes determined immediately at the time the terms of the notes are set. The notes are subject to an automatic call, and the estimated initial value is based on an assumed tenor of the notes. This estimated initial value is expected to be between $9.62 and $9.67 per unit. The estimated initial value will be calculated shortly before pricing and will be set forth in the final term sheet made available to investors in the notes. For more information about the estimated initial value and the structuring of the notes, see “Structuring the Notes” on page TS-23.
Terms of the Notes
| Issuer:
|
Bank of America Corporation (“BAC”)
|
Call Settlement Dates:
|
On or about five business days following the applicable Observation Date, subject to postponement if the related Observation Date is postponed, as described below.
| |||||
| Original Offering Price:
|
$10.00 per unit
|
Call Premium:
|
$0.85 per unit if called on March , 2014 (which represents a return of 8.50% over the Original Offering Price) and $1.70 per unit if called on March , 2015 (which represents a return of 17.00% over the Original Offering Price).
| |||||
| Term:
|
Approximately three years
|
Ending Value:
|
The value of the Basket on the scheduled calculation day. The calculation day is subject to postponement in the event of Market Disruption Events, as described beginning on page S-22 of product supplement STOCK SUN-2.
| |||||
| Market Measure:
|
An equally weighted basket of the common equity securities of 23 different companies as described on page TS-11 below (each a “Basket Stock” and collectively the “Basket Stocks”).
|
Step Up Value:
|
[120% to 126%] of the Starting Value. The actual Step Up Value will be determined on the pricing date.
| |||||
| Starting Value:
|
The Starting Value will be set to 100.00 on the pricing date.
|
Step Up Payment:
|
[$2.00 to $2.60] per unit, which represents a return of [20% to 26%] over the Original Offering Price. The actual Step Up Payment will be determined on the pricing date.
| |||||
| Observation Level:
|
The value of the Basket on the applicable Observation Date.
|
Threshold Value:
|
100% of the Starting Value
| |||||
| Observation Dates:
|
March , 2014 and March , 2015, subject to postponement in the event of Market Disruption Events, as described on page TS-7.
|
Calculation Day:
|
The fifth scheduled trading day immediately preceding the maturity date.
| |||||
| Call Level:
|
100% of the Starting Value
|
Fees and Charges:
|
The underwriting discount of $0.20 per unit as listed on the cover page and the hedging related charge of $0.075 per unit described in “Structuring the Notes” on page TS-23.
| |||||
| Call Amounts (per Unit):
|
$10.85 if called on March , 2014 and $11.70 if called on March , 2015.
|
Calculation Agent:
|
Merrill Lynch, Pierce, Fenner & Smith Incorporated (“MLPF&S”), a subsidiary of BAC.
|
| Autocallable Market-Linked Step Up Notes | TS-2 |
| Autocallable Market-Linked Step Up Notes Linked to a Basket of 23 Common Equity Securities, due March , 2016 |
|
Determining Payment on the Notes
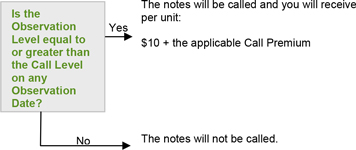
Automatic Call Provision
The notes will be called automatically on an Observation Date if the Observation Level on that Observation Date is equal to or greater than the Call Level. If the notes are called, you will receive $10 per unit plus the applicable Call Premium.
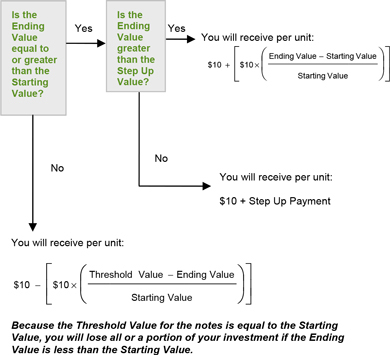
Redemption Amount Determination
If the notes are not automatically called, on the maturity date, you will receive a cash payment per unit determined as follows:
| Autocallable Market-Linked Step Up Notes | TS-3 |
| Autocallable Market-Linked Step Up Notes Linked to a Basket of 23 Common Equity Securities, due March , 2016 |
|
The terms and risks of the notes are contained in this term sheet and in the following:
| § | Product supplement STOCK SUN-2 dated March 1, 2013: |
http://www.sec.gov/Archives/edgar/data/70858/000119312513088016/d495572d424b5.htm
| § | Series L MTN prospectus supplement dated March 30, 2012 and prospectus dated March 30, 2012: |
http://www.sec.gov/Archives/edgar/data/70858/000119312512143855/d323958d424b5.htm
These documents (together, the “Note Prospectus”) have been filed as part of a registration statement with the SEC, which may, without cost, be accessed on the SEC website as indicated above or obtained from MLPF&S by calling 1-866-500-5408. Before you invest, you should read the Note Prospectus, including this term sheet, for information about us and this offering. Any prior or contemporaneous oral statements and any other written materials you may have received are superseded by the Note Prospectus. Capitalized terms used but not defined in this term sheet have the meanings set forth in product supplement STOCK SUN-2. Unless otherwise indicated or unless the context requires otherwise, all references in this document to “we,” “us,” “our,” or similar references are to BAC.
Investor Considerations
We urge you to consult your investment, legal, tax, accounting, and other advisors before you invest in the notes.
| Autocallable Market-Linked Step Up Notes | TS-4 |
| Autocallable Market-Linked Step Up Notes Linked to a Basket of 23 Common Equity Securities, due March , 2016 |
|
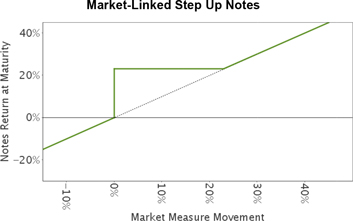
Hypothetical Payout Profile and Examples of Payments at Maturity
The below graph is based on hypothetical numbers and values. These hypothetical values would only apply if the notes are not called on any Observation Date, and show a payout profile at maturity.
|
This graph reflects the returns on the notes, based on a Step Up Payment of $2.30 (the midpoint of the Step Up Payment range of [$2.00 to $2.60]), a Step Up Value of 123% of the Starting Value (the midpoint of the Step Up Value range of [120% to 126%]) and the Threshold Value of 100% of the Starting Value. The green line reflects the returns on the notes, while the dotted gray line reflects the returns of a direct investment in the Basket Stocks, excluding dividends.
This graph has been prepared for purposes of illustration only. |
The following table and examples are for purposes of illustration only. They are based on hypothetical values and show hypothetical returns on the notes. They illustrate the calculation of the Redemption Amount and total rate of return based on the Starting Value and Threshold Value of 100, a hypothetical Step Up Value of 123, a hypothetical Step Up Payment of $2.30 per unit and a range of hypothetical Ending Values. The actual amount you receive and the resulting total rate of return will depend on the actual Ending Value, Step Up Value, Step Up Payment, whether the notes are called on an Observation Date, and whether you hold the notes until maturity. The following examples do not take into account any tax consequences from investing in the notes.
For recent actual levels of the Market Measure, see “The Basket” section below. The Ending Value will not include any income generated by dividends paid on the Basket Stocks, which you would otherwise be entitled to receive if you invested in those stocks directly. In addition, all payments on the notes are subject to issuer credit risk.
| Ending Value |
Percentage Change from Value to the Ending Value |
Redemption |
Total Rate | |||||||||||||||
| 60.00 | -40.00 | % | $6.00 | -40.00 | % | |||||||||||||
| 70.00 | -30.00 | % | $7.00 | -30.00 | % | |||||||||||||
| 80.00 | -20.00 | % | $8.00 | -20.00 | % | |||||||||||||
| 90.00 | -10.00 | % | $9.00 | -10.00 | % | |||||||||||||
| 94.00 | -6.00 | % | $9.40 | -6.00 | % | |||||||||||||
| 97.00 | -3.00 | % | $9.70 | -3.00 | % | |||||||||||||
| 100.00 | (1) | 0.00 | % | $12.30 | (2) | 23.00 | % | |||||||||||
| 103.00 | 3.00 | % | $12.30 | 23.00 | % | |||||||||||||
| 106.00 | 6.00 | % | $12.30 | 23.00 | % | |||||||||||||
| 110.00 | 10.00 | % | $12.30 | 23.00 | % | |||||||||||||
| 120.00 | 20.00 | % | $12.30 | 23.00 | % | |||||||||||||
| 123.00 | (3) | 23.00 | % | $12.30 | 23.00 | % | ||||||||||||
| 130.00 | 30.00 | % | $13.00 | 30.00 | % | |||||||||||||
| 140.00 | 40.00 | % | $14.00 | 40.00 | % | |||||||||||||
| 150.00 | 50.00 | % | $15.00 | 50.00 | % | |||||||||||||
| 160.00 | 60.00 | % | $16.00 | 60.00 | % | |||||||||||||
| (1) | The Starting Value and Threshold Value will be set to 100 on the pricing date. |
| (2) | This amount represents the sum of the Original Offering Price and the hypothetical Step Up Payment of $2.30. |
| (3) | This is the hypothetical Step Up Value. |
| Autocallable Market-Linked Step Up Notes | TS-5 |
| Autocallable Market-Linked Step Up Notes Linked to a Basket of 23 Common Equity Securities, due March , 2016 |
|
Redemption Amount Calculation Examples
Example 1
The Ending Value is 90, or 90% of the Starting Value:
| Starting Value: | 100 | |
| Threshold Value: | 100 | |
| Ending Value: | 90 |
|
$10 – |
[ | $10 × | ( | 100 – 90 | ) | ] | = $9.00 Redemption Amount per unit | |||||||||||
| 100 |
Example 2
The Ending Value is 110, or 110% of the Starting Value:
| Starting Value: | 100 | |
| Step Up Value: | 123 | |
| Ending Value: | 110 |
| $10 + $2.30 = $12.30 | Redemption Amount per unit, the Original Offering Price plus the Step Up Payment, since the Ending Value is equal to or greater than the Starting Value, but less than the Step Up Value. |
Example 3
The Ending Value is 150, or 150% of the Starting Value:
| Starting Value: | 100 | |
| Step Up Value: | 123 | |
| Ending Value: | 150 |
| $10 + |
[ | $10 × | ( | 150 – 100 | ) | ] | = $15.00 Redemption Amount per unit | |||||||||||
| 100 |
| Autocallable Market-Linked Step Up Notes | TS-6 |
| Autocallable Market-Linked Step Up Notes Linked to a Basket of 23 Common Equity Securities, due March , 2016 |
|
Risk Factors
There are important differences between the notes and a conventional debt security. An investment in the notes involves significant risks, including those listed below. You should carefully review the more detailed explanation of risks relating to the notes in the “Risk Factors” sections beginning on page S-8 of product supplement STOCK SUN-2, page S-5 of the MTN prospectus supplement, and page 8 of the prospectus identified above under “Summary.” We also urge you to consult your investment, legal, tax, accounting, and other advisors before you invest in the notes.
| § | Depending on the performance of the Basket as measured shortly before the maturity date, your investment may result in a loss; there is no guaranteed return of principal. |
| § | Your return on the notes may be less than the yield you could earn by owning a conventional fixed or floating rate debt security of comparable maturity. |
| § | Payments on the notes are subject to our credit risk, and actual or perceived changes in our creditworthiness are expected to affect the value of the notes. If we become insolvent or are unable to pay our obligations, you may lose your entire investment. |
| § | The public offering price you pay for the notes will exceed their estimated initial value. The estimated initial value of the notes that will be provided in the final term sheet is an estimate only, calculated to reflect the costs and charges included in the notes and the implied borrowing rate at the time the terms of the notes are set, and is provided for informational purposes only. The estimated initial value does not represent a minimum price at which we, MLPF&S or any of our affiliates would be willing to purchase your notes in any secondary market (if any exists) at any time. The value of your notes at any time after issuance will vary based on many factors, including changes in market conditions, and cannot be predicted with accuracy. |
| § | A trading market is not expected to develop for the notes. Neither we nor MLPF&S is obligated to make a market for, or to repurchase, the notes. There is no assurance that any party will be willing to purchase your notes at any price in any secondary market. |
| § | If you attempt to sell the notes prior to maturity, their market value may be lower than the price you paid for them and lower than their estimated initial value. This is due to, among other things, changes in the level of the Basket, the implied borrowing rate we pay to issue market-linked notes, and the inclusion in the public offering price of the underwriting discount and the hedging related charge, all as further described in “Structuring the Notes” on page TS-23. These factors, together with various credit, market and economic factors over the term of the notes, are expected to reduce the price at which you may be able to sell the notes in any secondary market and will affect the value of the notes in complex and unpredictable ways. |
| § | Our business activities as a full service financial institution, including our commercial and investment banking activities, our hedging and trading activities (including trades in shares of the Basket Stocks) and any hedging and trading activities we engage in for our clients’ accounts, may affect the market value of the notes and their return and may create conflicts of interest with you. |
| § | Changes in the prices of the Basket Stocks may offset each other. |
| § | You will have no rights of a holder of the Basket Stocks, and you will not be entitled to receive shares of the Basket Stocks or dividends or other distributions by the issuers of the Basket Stocks. |
| § | While we or our affiliates may from time to time own shares of the Basket Stocks, we do not control any company included in the Basket, and are not responsible for any disclosure made by any other company. |
| § | The Redemption Amount will not be adjusted for all corporate events that could affect a Basket Stock. See “Description of the Notes — Anti-Dilution Adjustments” beginning on page S-21 of product supplement STOCK SUN-2. |
| § | There may be potential conflicts of interest involving the calculation agent. We have the right to appoint and remove the calculation agent. |
| § | The U.S. federal income tax consequences of the notes are uncertain, and may be adverse to a holder of the notes. See “Summary Tax Consequences” below and “U.S. Federal Income Tax Summary” beginning on page S-33 of product supplement STOCK SUN-2. |
Additional Risk Factor
If the notes are called, your return will be limited to the applicable Call Premium. If the Observation Level of the Basket on an Observation Date is equal to or greater than the Call Level, we will automatically call the notes. If the notes are automatically called, the amount payable on the notes will be the applicable Call Amount, regardless of the extent of the increase in the level of the Basket.
| Autocallable Market-Linked Step Up Notes | TS-7 |
| Autocallable Market-Linked Step Up Notes Linked to a Basket of 23 Common Equity Securities, due March , 2016 |
|
Additional Terms of the Notes
If a Market Disruption Event occurs on an Observation Date, or if a scheduled Observation Date is not a trading day for any Basket Stock, the calculation agent will establish the Closing Market Price of that Basket Stock, and thus the Observation Level, based on the Closing Market Price of that Basket Stock on the first trading day following the scheduled Observation Date on which no Market Disruption Event occurs with respect to that Basket Stock. However, the Closing Market Price of that Basket Stock will be determined (or, if not determinable, estimated) by the calculation agent in a manner which the calculation agent considers commercially reasonable under the circumstances on a date no later than the tenth scheduled trading day after the originally scheduled Observation Date, regardless of the occurrence of a Market Disruption Event on that scheduled trading day. If an Observation Date is postponed, the relevant Call Settlement Date, if applicable, will be on or about the fifth business day following the Observation Date as postponed. For a Basket Stock that is not affected by a Market Disruption Event on the applicable Observation Date, the Closing Market Price of that Basket Stock will be its Closing Market Price on the applicable Observation Date.
| Autocallable Market-Linked Step Up Notes | TS-8 |
| Autocallable Market-Linked Step Up Notes Linked to a Basket of 23 Common Equity Securities, due March , 2016 |
|
The Basket
The Basket is designed to allow investors to participate in the percentage changes of the Basket from the Starting Value to the Ending Value. The Basket Stocks are described in the section “The Basket Stocks” below. Each Basket Stock will be assigned an initial weight on the pricing date, as set forth in the table below.
For more information on the calculation of the value of the Basket, please see the section entitled “Description of the Notes — Basket Market Measures” on page S-27 of product supplement STOCK-SUN-2.
If February 26, 2013 were the pricing date, for each Basket Stock, the Initial Component Weight, the Closing Market Price, the hypothetical Component Ratio and the initial contribution to the Basket value would be as follows:
| Basket Stock |
Ticker |
Initial Component Weight |
Closing Price(1)(2) |
Component Ratio(1)(3) |
Initial Basket Value Contribution | |||||
| Abbott Laboratories |
ABT | 4.3478% | 34.06 | 0.12765197 | 4.3478 | |||||
| AbbVie Inc. |
ABBV | 4.3478% | 37.09 | 0.11722367 | 4.3478 | |||||
| Actavis, Inc. |
ACT | 4.3478% | 84.67 | 0.05135025 | 4.3478 | |||||
| Amazon.com, Inc. |
AMZN | 4.3478% | 259.36 | 0.01676357 | 4.3478 | |||||
| Apple Inc. |
AAPL | 4.3478% | 448.90 | 0.00968551 | 4.3478 | |||||
| Celgene Corporation |
CELG | 4.3478% | 99.45 | 0.04371871 | 4.3478 | |||||
| Colgate-Palmolive Company |
CL | 4.3478% | 113.91 | 0.03816896 | 4.3478 | |||||
| Eastman Chemical Company |
EMN | 4.3478% | 68.57 | 0.06340712 | 4.3478 | |||||
| Eli Lilly and Company |
LLY | 4.3478% | 54.43 | 0.07987922 | 4.3478 | |||||
| Exxon Mobil Corporation |
XOM | 4.3478% | 88.51 | 0.04912243 | 4.3478 | |||||
| Intel Corporation |
INTC | 4.3478% | 20.58 | 0.21126463 | 4.3478 | |||||
| International Business Machines Corporation |
IBM | 4.3478% | 199.14 | 0.02183301 | 4.3478 | |||||
| Johnson & Johnson |
JNJ | 4.3478% | 75.75 | 0.05739704 | 4.3478 | |||||
| Marathon Oil Corporation |
MRO | 4.3478% | 32.86 | 0.13231364 | 4.3478 | |||||
| Merck & Co., Inc. |
MRK | 4.3478% | 42.42 | 0.10249472 | 4.3478 | |||||
| National Oilwell Varco, Inc. |
NOV | 4.3478% | 66.84 | 0.06504827 | 4.3478 | |||||
| Novo Nordisk A/S |
NVO | 4.3478% | 175.15 | 0.02482344 | 4.3478 | |||||
| Philip Morris International Inc. |
PM | 4.3478% | 91.60 | 0.04746535 | 4.3478 | |||||
| QUALCOMM Incorporated |
QCOM | 4.3478% | 65.27 | 0.06661293 | 4.3478 | |||||
| Starbucks Corporation |
SBUX | 4.3478% | 53.28 | 0.08160334 | 4.3478 | |||||
| The Coca-Cola Company |
KO | 4.3478% | 38.11 | 0.11408623 | 4.3478 | |||||
| The Hershey Company |
HSY | 4.3478% | 81.62 | 0.05326913 | 4.3478 | |||||
| The Procter & Gamble Company |
PG | 4.3478% | 76.08 | 0.05714808 | 4.3478 | |||||
|
| ||||||||||
| Starting Value |
100.00 | |||||||||
| (1) | The actual Closing Market Price of each Basket Stock and the resulting actual Component Ratios will be determined on the pricing date, subject to adjustment as more fully described below. The actual Closing Market Price and Component Ratio of each Basket Stock will be set forth in the final term sheet that will be made available in connection with sales of the notes. |
| (2) | These were the Closing Market Prices of the Basket Stocks on February 26, 2013. |
| (3) | Each hypothetical Component Ratio equals the Initial Component Weight of the relevant Basket Stock (as a percentage) multiplied by 100, and then divided by the Closing Market Price of that Basket Stock on February 26, 2013 and rounded to eight decimal places. |
The calculation agent will calculate the value of the Basket by summing the products of the Closing Market Price for each Basket Stock (multiplied by its Price Multiplier) on the calculation day and the Component Ratio applicable to that Basket Stock. The Price Multiplier for each Basket Stock will initially be 1, and is subject to adjustment as described in the product supplement. If a Market Disruption Event occurs as to any Basket Stock on the scheduled calculation day, the Closing Market Price of that Basket Stock will be determined as more fully described in the section entitled “Description of the Notes—Ending Value” beginning on page S-20 of product supplement STOCK SUN-2.
| Autocallable Market-Linked Step Up Notes | TS-9 |
| Autocallable Market-Linked Step Up Notes Linked to a Basket of 23 Common Equity Securities, due March , 2016 |
|
If a Market Disruption Event occurs on the pricing date as to any Basket Stock, the calculation agent will establish the Closing Market Price of that Basket Stock (the “Basket Stock Closing Value”), and thus its Component Ratio, based on the Closing Market Price of that Basket Stock on the first trading day following the pricing date on which no Market Disruption Event occurs with respect to that Basket Stock. If a Market Disruption Event occurs with respect to that Basket Stock on the pricing date and on each day to and including the second scheduled trading day following the pricing date, the calculation agent (not later than the close of business in New York, New York on the second scheduled trading day following the pricing date) will estimate the Basket Stock Closing Value, and thus the applicable Component Ratio, in a manner that the calculation agent considers commercially reasonable under the circumstances. The final term sheet will set forth the Basket Component Closing Value, a brief statement of the facts relating to the establishment of the Basket Component Closing Value (including the applicable Market Disruption Event(s)), and the applicable Component Ratio. For a Basket Stock that is not affected by a Market Disruption Event on the pricing date, the Closing Market Price of such Basket Stock will be its Closing Market Price on the pricing day.
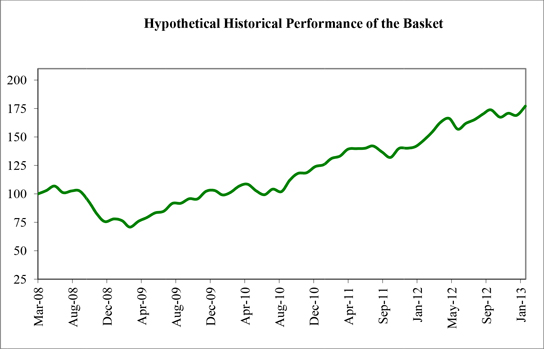
While actual historical information on the Basket will not exist before the pricing date, the following graph sets forth the hypothetical historical monthly performance of the Basket from March 2008 through January 2013. The graph is based upon actual month-end historical levels of the Basket Stocks, hypothetical Component Ratios determined as of March 31, 2008, and a Basket value of 100.00 as of that date. This hypothetical historical data on the Basket is not necessarily indicative of the future performance of the Basket or what the value of the notes may be. Any historical upward or downward trend in the value of the Basket during any period set forth below is not an indication that the value of the Basket is more or less likely to increase or decrease at any time over the term of the notes.
The shares of AbbVie Inc. were not publicly traded prior to December 10, 2012. As a result, instead of the securities of this Basket Stock, the Basket values represented by the following graph from March 31, 2008 to December 10, 2012 include a fixed Initial Basket Value Contribution of 4.3478.
| Autocallable Market-Linked Step Up Notes | TS-10 |
| Autocallable Market-Linked Step Up Notes Linked to a Basket of 23 Common Equity Securities, due March , 2016 |
|
The Basket Stocks
We have derived the following information about the Underlying Companies from publicly available documents that they have published. We have not independently verified the following information.
Because each Basket Stock is registered under the Securities Exchange Act of 1934, the Underlying Companies are required to file periodically certain financial and other information specified by the SEC. Information provided to or filed with the SEC by the Underlying Companies can be located at the Public Reference Section of the SEC, 100 F Street, N.E., Room 1580, Washington, D.C. 20549 or through the SEC’s web site at http://www.sec.gov by reference to the applicable CIK number set forth below.
This term sheet relates only to the notes and does not relate to any securities of the Underlying Companies. Neither we nor any of our affiliates have participated or will participate in the preparation of the Underlying Companies’ publicly available documents. Neither we nor any of our affiliates have made any due diligence inquiry with respect to the Underlying Companies in connection with the offering of the notes. Neither we nor any of our affiliates make any representation that the publicly available documents or any other publicly available information regarding the Underlying Companies are accurate or complete. Furthermore, there can be no assurance that all events occurring prior to the date of this term sheet, including events that would affect the accuracy or completeness of these publicly available documents that would affect the trading price of the Basket Stocks, have been or will be publicly disclosed. Subsequent disclosure of any events or the disclosure of or failure to disclose material future events concerning the Underlying Companies could affect the value of the Basket Stocks and therefore could affect your return on the notes. The selection of the Basket Stocks is not a recommendation to buy or sell shares of the Basket Stocks.
The tables set forth below shows the quarterly high and low Closing Market Prices of the shares of the Basket Stocks on their primary exchange from the first quarter of 2008 through February 26, 2013. We obtained this historical data from Bloomberg L.P. We have not independently verified the accuracy or completeness of the information obtained from Bloomberg L.P. These historical trading prices may have been adjusted to reflect certain corporate actions such as stock splits and reverse stock splits.
Abbot Laboratories
Abbott Laboratories discovers, develops, manufactures, and sells a broad and diversified line of health care products and services. The company’s products include pharmaceuticals, nutritional, diagnostics, and vascular products. Abbott markets its products worldwide through affiliates and distributors. This Basket Stock trades on the New York Stock Exchange (the “NYSE”) under the symbol “ABT”. The company’s CIK number is 001800.
| High ($) | Low ($) | |||||
| 2008 |
First Quarter | 28.95 | 24.21 | |||
| Second Quarter | 26.96 | 24.13 | ||||
| Third Quarter | 28.62 | 25.93 | ||||
| Fourth Quarter | 28.18 | 23.66 | ||||
| 2009 |
First Quarter | 27.39 | 21.28 | |||
| Second Quarter | 22.98 | 19.87 | ||||
| Third Quarter | 23.67 | 20.88 | ||||
| Fourth Quarter | 26.10 | 23.29 | ||||
| 2010 |
First Quarter | 26.91 | 25.12 | |||
| Second Quarter | 25.39 | 21.94 | ||||
| Third Quarter | 25.12 | 22.23 | ||||
| Fourth Quarter | 25.68 | 22.24 | ||||
| 2011 |
First Quarter | 23.48 | 21.61 | |||
| Second Quarter | 25.84 | 23.62 | ||||
| Third Quarter | 25.62 | 22.44 | ||||
| Fourth Quarter | 26.95 | 24.00 | ||||
| 2012 |
First Quarter | 29.34 | 25.91 | |||
| Second Quarter | 30.85 | 28.47 | ||||
| Third Quarter | 33.43 | 30.59 | ||||
| Fourth Quarter | 34.51 | 30.09 | ||||
| 2013 |
First Quarter (through February 26, 2013) | 35.08 | 32.05 | |||
| Autocallable Market-Linked Step Up Notes | TS-11 |
| Autocallable Market-Linked Step Up Notes Linked to a Basket of 23 Common Equity Securities, due March , 2016 |
|
AbbVie Inc.
AbbVie Inc. researches and develops pharmaceutical products. The company produces pharmaceutical drugs for specialty therapeutic areas such as immunology, chronic kidney disease, hepatitis C, women’s health, oncology, and neuroscience. The company also offers treatments for diseases including multiple sclerosis, Parkinson’s, and Alzheimer’s disease. This Basket Stock trades on the NYSE under the symbol “ABBV”. The company’s CIK number is 1551152.
| High ($) | Low ($) | |||||
| 2012 |
Fourth Quarter* | 35.35 | 33.00 | |||
| 2013 |
First Quarter (through February 26, 2013) | 38.78 | 33.71 | |||
| * | The shares of AbbVie Inc. were not publicly traded prior to December 10, 2012. As a result there is limited trading history for the fourth quarter of 2012 and no trading history prior to that period. |
Actavis Inc.
Actavis Inc. is a generic drug manufacturer providing health care to consumers across the United States. This Basket Stock trades on the NYSE under the symbol “ACT”. The company’s CIK number is 884629.
| High ($) | Low ($) | |||||
| 2008 |
First Quarter | 29.34 | 25.72 | |||
| Second Quarter | 31.14 | 26.68 | ||||
| Third Quarter | 30.78 | 26.97 | ||||
| Fourth Quarter | 28.97 | 20.76 | ||||
| 2009 |
First Quarter | 31.11 | 23.74 | |||
| Second Quarter | 33.88 | 28.84 | ||||
| Third Quarter | 37.00 | 33.00 | ||||
| Fourth Quarter | 40.12 | 33.94 | ||||
| 2010 |
First Quarter | 42.15 | 37.69 | |||
| Second Quarter | 44.94 | 40.57 | ||||
| Third Quarter | 44.92 | 39.86 | ||||
| Fourth Quarter | 51.95 | 43.14 | ||||
| 2011 |
First Quarter | 57.38 | 50.59 | |||
| Second Quarter | 68.73 | 56.51 | ||||
| Third Quarter | 72.10 | 60.04 | ||||
| Fourth Quarter | 70.52 | 59.65 | ||||
| 2012 |
First Quarter | 67.06 | 55.89 | |||
| Second Quarter | 76.16 | 65.85 | ||||
| Third Quarter | 85.16 | 74.69 | ||||
| Fourth Quarter | 90.85 | 82.72 | ||||
| 2013 |
First Quarter (through February 26, 2013) | 87.99 | 83.10 | |||
| Autocallable Market-Linked Step Up Notes | TS-12 |
| Autocallable Market-Linked Step Up Notes Linked to a Basket of 23 Common Equity Securities, due March , 2016 |
|
Amazon.com, Inc.
Amazon.com, Inc. is an online retailer that offers a wide range of products. The company’s products include books, music, videotapes, computers, electronics, home and garden, and numerous other products. The company offers personalized shopping services, Web-based credit card payment, and direct shipping to customers. This Basket Stock trades on the Nasdaq Global Select Market (the “NASDAQ”) under the symbol “AMZN”. The company’s CIK number is 1018724.
| High ($) | Low ($) | |||||
| 2008 |
First Quarter | 96.25 | 62.43 | |||
| Second Quarter | 84.51 | 71.99 | ||||
| Third Quarter | 88.09 | 63.35 | ||||
| Fourth Quarter | 69.58 | 35.03 | ||||
| 2009 |
First Quarter | 75.58 | 48.44 | |||
| Second Quarter | 87.56 | 73.50 | ||||
| Third Quarter | 93.85 | 75.63 | ||||
| Fourth Quarter | 142.25 | 88.67 | ||||
| 2010 |
First Quarter | 136.55 | 116.00 | |||
| Second Quarter | 150.09 | 108.61 | ||||
| Third Quarter | 160.73 | 109.14 | ||||
| Fourth Quarter | 184.76 | 153.03 | ||||
| 2011 |
First Quarter | 191.25 | 160.97 | |||
| Second Quarter | 206.07 | 178.34 | ||||
| Third Quarter | 241.69 | 177.79 | ||||
| Fourth Quarter | 246.71 | 173.10 | ||||
| 2012 |
First Quarter | 205.44 | 175.93 | |||
| Second Quarter | 231.90 | 185.50 | ||||
| Third Quarter | 261.68 | 215.36 | ||||
| Fourth Quarter | 261.50 | 220.64 | ||||
| 2013 |
First Quarter (through February 26, 2013) | 283.99 | 257.21 | |||
Apple Inc.
Apple Inc. designs, manufactures, and markets personal computers and related personal computing and mobile communication devices along with a variety of related software, services, peripherals, and networking solutions. The company sells its products worldwide through its online stores, its retail stores, its direct sales force, third-party wholesalers, and resellers. This Basket Stock trades on the NASDAQ under the symbol “AAPL”. The company’s CIK number is 320193.
| High ($) | Low ($) | |||||
| 2008 |
First Quarter | 194.97 | 119.15 | |||
| Second Quarter | 189.96 | 147.14 | ||||
| Third Quarter | 179.69 | 105.26 | ||||
| Fourth Quarter | 111.04 | 80.49 | ||||
| 2009 |
First Quarter | 109.87 | 78.20 | |||
| Second Quarter | 144.67 | 108.69 | ||||
| Third Quarter | 186.15 | 135.40 | ||||
| Fourth Quarter | 211.64 | 180.76 | ||||
| 2010 |
First Quarter | 235.83 | 192.00 | |||
| Second Quarter | 274.16 | 235.86 | ||||
| Third Quarter | 292.46 | 240.16 | ||||
| Fourth Quarter | 325.47 | 278.64 | ||||
| 2011 |
First Quarter | 363.13 | 326.72 | |||
| Second Quarter | 353.10 | 315.32 | ||||
| Third Quarter | 413.45 | 343.23 | ||||
| Fourth Quarter | 422.24 | 363.50 | ||||
| 2012 |
First Quarter | 617.62 | 411.23 | |||
| Second Quarter | 636.23 | 530.12 | ||||
| Third Quarter | 702.10 | 574.88 | ||||
| Fourth Quarter | 671.74 | 508.97 | ||||
| 2013 |
First Quarter (through February 26, 2013) | 549.03 | 439.88 | |||
| Autocallable Market-Linked Step Up Notes | TS-13 |
| Autocallable Market-Linked Step Up Notes Linked to a Basket of 23 Common Equity Securities, due March , 2016 |
|
Celgene Corporation
Celgene Corporation is a global biopharmaceutical company. The company focuses on the discovery, development, and commercialization of therapies designed to treat cancer and immune-inflammatory related diseases. This Basket Stock trades on the NASDAQ under the symbol “CELG”. The company’s CIK number is 816284.
| High ($) | Low ($) | |||||||||||
| 2008 |
First Quarter | 61.82 | 46.30 | |||||||||
| Second Quarter | 65.64 | 56.90 | ||||||||||
| Third Quarter | 77.01 | 56.00 | ||||||||||
| Fourth Quarter | 65.23 | 47.25 | ||||||||||
| 2009 |
First Quarter | 56.49 | 39.95 | |||||||||
| Second Quarter | 48.33 | 38.01 | ||||||||||
| Third Quarter | 57.79 | 46.02 | ||||||||||
| Fourth Quarter | 57.32 | 50.21 | ||||||||||
| 2010 |
First Quarter | 65.02 | 54.77 | |||||||||
| Second Quarter | 63.40 | 50.82 | ||||||||||
| Third Quarter | 58.46 | 49.02 | ||||||||||
| Fourth Quarter | 62.95 | 55.55 | ||||||||||
| 2011 |
First Quarter | 60.02 | 49.50 | |||||||||
| Second Quarter | 60.95 | 55.35 | ||||||||||
| Third Quarter | 65.56 | 51.85 | ||||||||||
| Fourth Quarter | 68.01 | 60.22 | ||||||||||
| 2012 |
First Quarter | 78.50 | 67.22 | |||||||||
| Second Quarter | 80.29 | 59.45 | ||||||||||
| Third Quarter | 77.27 | 62.95 | ||||||||||
| Fourth Quarter | 82.08 | 71.30 | ||||||||||
| 2013 |
First Quarter (through February 26, 2013) | 101.65 | 81.10 | |||||||||
Colgate-Palmolive Company
Colgate-Palmolive Company is a consumer products company that markets its products throughout the world. The company’s products include toothpaste, toothbrushes, shampoos, deodorants, bar and liquid soaps, dishwashing liquid, and laundry products, as well as pet nutrition products for cats and dogs. This Basket Stock trades on the NYSE under the symbol “CL”. The company’s CIK number is 021665.
| High ($) | Low ($) | |||||||||||
| 2008 |
First Quarter | 80.98 | 73.50 | |||||||||
| Second Quarter | 78.89 | 68.21 | ||||||||||
| Third Quarter | 79.99 | 68.56 | ||||||||||
| Fourth Quarter | 76.76 | 54.77 | ||||||||||
| 2009 |
First Quarter | 69.32 | 55.05 | |||||||||
| Second Quarter | 71.76 | 57.29 | ||||||||||
| Third Quarter | 76.55 | 71.02 | ||||||||||
| Fourth Quarter | 86.32 | 75.82 | ||||||||||
| 2010 |
First Quarter | 85.46 | 79.07 | |||||||||
| Second Quarter | 85.81 | 76.93 | ||||||||||
| Third Quarter | 84.59 | 73.84 | ||||||||||
| Fourth Quarter | 81.18 | 73.75 | ||||||||||
| 2011 |
First Quarter | 81.21 | 75.93 | |||||||||
| Second Quarter | 89.11 | 79.90 | ||||||||||
| Third Quarter | 93.96 | 80.18 | ||||||||||
| Fourth Quarter | 93.92 | 86.48 | ||||||||||
| 2012 |
First Quarter | 97.78 | 88.25 | |||||||||
| Second Quarter | 104.10 | 96.17 | ||||||||||
| Third Quarter | 107.49 | 102.10 | ||||||||||
| Fourth Quarter | 110.62 | 103.53 | ||||||||||
| 2013 |
First Quarter (through February 26, 2013) | 114.01 | 106.08 | |||||||||
| Autocallable Market-Linked Step Up Notes | TS-14 |
| Autocallable Market-Linked Step Up Notes Linked to a Basket of 23 Common Equity Securities, due March , 2016 |
|
Eastman Chemical Company
Eastman Chemical Company is an international chemical company which produces chemicals, fibers, and plastics. The company’s operations include coatings, adhesives, specialty polymers, and inks, fibers, performance chemicals and intermediates, performance polymers, and specialty plastics. This Basket Stock trades on the NYSE under the symbol “EMN”. The company’s CIK number is 915389.
| High ($) | Low ($) | |||||||||||
| 2008 |
First Quarter | 33.74 | 29.00 | |||||||||
| Second Quarter | 38.76 | 32.16 | ||||||||||
| Third Quarter | 34.40 | 26.64 | ||||||||||
| Fourth Quarter | 27.33 | 13.42 | ||||||||||
| 2009 |
First Quarter | 16.84 | 9.00 | |||||||||
| Second Quarter | 22.52 | 14.18 | ||||||||||
| Third Quarter | 27.58 | 17.61 | ||||||||||
| Fourth Quarter | 30.70 | 25.11 | ||||||||||
| 2010 |
First Quarter | 32.18 | 28.27 | |||||||||
| Second Quarter | 35.56 | 26.68 | ||||||||||
| Third Quarter | 37.00 | 25.82 | ||||||||||
| Fourth Quarter | 42.04 | 37.04 | ||||||||||
| 2011 |
First Quarter | 49.66 | 42.68 | |||||||||
| Second Quarter | 54.08 | 47.51 | ||||||||||
| Third Quarter | 52.84 | 33.31 | ||||||||||
| Fourth Quarter | 41.92 | 34.23 | ||||||||||
| 2012 |
First Quarter | 54.96 | 40.09 | |||||||||
| Second Quarter | 54.39 | 43.26 | ||||||||||
| Third Quarter | 58.64 | 47.47 | ||||||||||
| Fourth Quarter | 68.05 | 53.65 | ||||||||||
| 2013 |
First Quarter (through February 26, 2013) | 74.78 | 68.00 | |||||||||
Eli Lilly and Company
Eli Lilly and Company discovers, develops, manufactures, and sells pharmaceutical products for humans and animals. The company’s products are sold in countries around the world. The company’s products include neuroscience products, endocrine products, anti-infectives, cardiovascular agents, oncology products, and animal health products. This Basket Stock trades on the NYSE under the symbol “LLY”. The company’s CIK number is 059478.
| High ($) | Low ($) | |||||||||||
| 2008 |
First Quarter | 57.18 | 47.77 | |||||||||
| Second Quarter | 53.06 | 45.61 | ||||||||||
| Third Quarter | 49.25 | 43.92 | ||||||||||
| Fourth Quarter | 43.69 | 29.91 | ||||||||||
| 2009 |
First Quarter | 40.57 | 27.47 | |||||||||
| Second Quarter | 35.95 | 31.88 | ||||||||||
| Third Quarter | 35.15 | 32.40 | ||||||||||
| Fourth Quarter | 37.51 | 32.47 | ||||||||||
| 2010 |
First Quarter | 37.41 | 33.95 | |||||||||
| Second Quarter | 36.92 | 32.25 | ||||||||||
| Third Quarter | 37.77 | 33.12 | ||||||||||
| Fourth Quarter | 38.06 | 33.66 | ||||||||||
| 2011 |
First Quarter | 35.84 | 33.63 | |||||||||
| Second Quarter | 39.15 | 34.99 | ||||||||||
| Third Quarter | 39.32 | 34.49 | ||||||||||
| Fourth Quarter | 41.75 | 35.58 | ||||||||||
| 2012 |
First Quarter | 41.80 | 38.49 | |||||||||
| Second Quarter | 42.91 | 39.18 | ||||||||||
| Third Quarter | 47.64 | 41.98 | ||||||||||
| Fourth Quarter | 53.81 | 45.91 | ||||||||||
| 2013 |
First Quarter (through February 26, 2013) | 54.43 | 49.51 | |||||||||
| Autocallable Market-Linked Step Up Notes | TS-15 |
| Autocallable Market-Linked Step Up Notes Linked to a Basket of 23 Common Equity Securities, due March , 2016 |
|
Exxon Mobil Corporation
Exxon Mobil Corporation operates petroleum and petrochemicals businesses on a worldwide basis. The company’s operations include exploration and production of oil and gas, electric power generation, and coal and minerals operations. The company also manufactures and markets fuels, lubricants, and chemicals. This Basket Stock trades on the NYSE under the symbol “XOM”. The company’s CIK number is 034088.
| High ($) | Low ($) | |||||||||||
| 2008 |
First Quarter | 93.83 | 81.44 | |||||||||
| Second Quarter | 94.56 | 84.91 | ||||||||||
| Third Quarter | 88.35 | 73.25 | ||||||||||
| Fourth Quarter | 83.14 | 62.35 | ||||||||||
| 2009 |
First Quarter | 81.64 | 62.22 | |||||||||
| Second Quarter | 74.05 | 64.75 | ||||||||||
| Third Quarter | 72.75 | 65.12 | ||||||||||
| Fourth Quarter | 76.47 | 66.58 | ||||||||||
| 2010 |
First Quarter | 70.30 | 64.35 | |||||||||
| Second Quarter | 69.29 | 57.07 | ||||||||||
| Third Quarter | 62.72 | 56.57 | ||||||||||
| Fourth Quarter | 73.42 | 62.19 | ||||||||||
| 2011 |
First Quarter | 87.07 | 74.55 | |||||||||
| Second Quarter | 88.00 | 76.78 | ||||||||||
| Third Quarter | 85.22 | 68.03 | ||||||||||
| Fourth Quarter | 85.28 | 71.15 | ||||||||||
| 2012 |
First Quarter | 87.49 | 83.53 | |||||||||
| Second Quarter | 87.07 | 77.60 | ||||||||||
| Third Quarter | 92.30 | 83.11 | ||||||||||
| Fourth Quarter | 93.48 | 85.10 | ||||||||||
| 2013 |
First Quarter (through February 26, 2013) | 91.76 | 87.70 | |||||||||
Intel Corporation
Intel Corporation designs, manufactures, and sells computer components and related products. The company’s major products include microprocessors, chipsets, embedded processors and microcontrollers, flash memory products, graphics products, network and communications products, systems management software, conferencing products, and digital imaging products. This Basket Stock trades on the NASDAQ under the symbol “INTC”. The company’s CIK number is 050863.
| High ($) | Low ($) | |||||||||||
| 2008 |
First Quarter | 25.35 | 18.61 | |||||||||
| Second Quarter | 25.00 | 20.69 | ||||||||||
| Third Quarter | 24.52 | 17.27 | ||||||||||
| Fourth Quarter | 18.52 | 12.23 | ||||||||||
| 2009 |
First Quarter | 15.82 | 12.08 | |||||||||
| Second Quarter | 16.64 | 15.00 | ||||||||||
| Third Quarter | 20.32 | 15.94 | ||||||||||
| Fourth Quarter | 20.83 | 18.50 | ||||||||||
| 2010 |
First Quarter | 22.68 | 19.01 | |||||||||
| Second Quarter | 24.21 | 19.45 | ||||||||||
| Third Quarter | 21.78 | 17.72 | ||||||||||
| Fourth Quarter | 21.91 | 18.87 | ||||||||||
| 2011 |
First Quarter | 22.14 | 19.82 | |||||||||
| Second Quarter | 23.87 | 19.49 | ||||||||||
| Third Quarter | 23.23 | 19.20 | ||||||||||
| Fourth Quarter | 25.66 | 20.62 | ||||||||||
| 2012 |
First Quarter | 28.19 | 24.54 | |||||||||
| Second Quarter | 29.18 | 25.04 | ||||||||||
| Third Quarter | 26.88 | 22.51 | ||||||||||
| Fourth Quarter | 22.84 | 19.36 | ||||||||||
| 2013 |
First Quarter (through February 26, 2013) | 22.68 | 20.23 | |||||||||
| Autocallable Market-Linked Step Up Notes | TS-16 |
| Autocallable Market-Linked Step Up Notes Linked to a Basket of 23 Common Equity Securities, due March , 2016 |
|
International Business Machines Corporation
International Business Machines Corporation (IBM) provides computer solutions through the use of advanced information technology. The company’s solutions include technologies, systems, products, services, software, and financing. The company offers its products through its global sales and distribution organization, as well as through a variety of third party distributors and resellers. This Basket Stock trades on the NYSE under the symbol “IBM”. The company’s CIK number is 051143.
| High ($) | Low ($) | |||||
| 2008 |
First Quarter | 119.06 | 97.50 | |||
| Second Quarter | 129.71 | 114.81 | ||||
| Third Quarter | 130.00 | 111.47 | ||||
| Fourth Quarter | 110.13 | 71.74 | ||||
| 2009 |
First Quarter | 98.78 | 81.98 | |||
| Second Quarter | 109.40 | 97.61 | ||||
| Third Quarter | 122.11 | 100.19 | ||||
| Fourth Quarter | 132.57 | 117.90 | ||||
| 2010 |
First Quarter | 134.14 | 121.88 | |||
| Second Quarter | 132.68 | 122.10 | ||||
| Third Quarter | 135.48 | 121.86 | ||||
| Fourth Quarter | 146.92 | 135.25 | ||||
| 2011 |
First Quarter | 166.05 | 147.05 | |||
| Second Quarter | 172.87 | 162.33 | ||||
| Third Quarter | 185.21 | 157.54 | ||||
| Fourth Quarter | 194.56 | 173.29 | ||||
| 2012 |
First Quarter | 208.65 | 179.16 | |||
| Second Quarter | 209.50 | 188.54 | ||||
| Third Quarter | 207.45 | 183.09 | ||||
| Fourth Quarter | 211.00 | 185.51 | ||||
| 2013 |
First Quarter (through February 26, 2013) | 205.18 | 192.32 | |||
Johnson & Johnson
Johnson & Johnson manufactures health care products and provides related services for the consumer, pharmaceutical, and medical devices and diagnostics markets. The company sells products such as skin and hair care products, acetaminophen products, pharmaceuticals, diagnostic equipment, and surgical equipment in countries located around the world. This Basket Stock trades on the NYSE under the symbol “JNJ”. The company’s CIK number is 200406.
| High ($) | Low ($) | |||||
| 2008 |
First Quarter | 68.31 | 61.33 | |||
| Second Quarter | 68.26 | 63.57 | ||||
| Third Quarter | 72.22 | 64.64 | ||||
| Fourth Quarter | 67.79 | 55.33 | ||||
| 2009 |
First Quarter | 60.65 | 46.60 | |||
| Second Quarter | 56.96 | 50.65 | ||||
| Third Quarter | 61.79 | 55.98 | ||||
| Fourth Quarter | 64.96 | 58.93 | ||||
| 2010 |
First Quarter | 65.36 | 62.37 | |||
| Second Quarter | 66.03 | 58.00 | ||||
| Third Quarter | 62.43 | 57.02 | ||||
| Fourth Quarter | 64.76 | 61.55 | ||||
| 2011 |
First Quarter | 63.35 | 57.66 | |||
| Second Quarter | 67.29 | 59.46 | ||||
| Third Quarter | 67.92 | 60.20 | ||||
| Fourth Quarter | 66.02 | 61.27 | ||||
| 2012 |
First Quarter | 65.96 | 64.30 | |||
| Second Quarter | 67.56 | 61.78 | ||||
| Third Quarter | 69.53 | 67.21 | ||||
| Fourth Quarter | 72.52 | 67.97 | ||||
| 2013 |
First Quarter (through February 26, 2013) | 76.96 | 70.74 | |||
| Autocallable Market-Linked Step Up Notes | TS-17 |
| Autocallable Market-Linked Step Up Notes Linked to a Basket of 23 Common Equity Securities, due March , 2016 |
|
Marathon Oil Corporation
Marathon Oil Corporation is an independent international energy company engaged in exploration and production, oil sands mining and integrated gas. The company’s operations are focused in North America, Africa and Europe. This Basket Stock trades on the NYSE under the symbol “MRO”. The company’s CIK number is 101778.
| High ($) | Low ($) | |||||
| 2008 |
First Quarter | 37.57 | 27.46 | |||
| Second Quarter | 33.42 | 27.27 | ||||
| Third Quarter | 32.04 | 22.75 | ||||
| Fourth Quarter | 23.56 | 11.89 | ||||
| 2009 |
First Quarter | 18.13 | 12.70 | |||
| Second Quarter | 20.28 | 16.44 | ||||
| Third Quarter | 20.57 | 17.02 | ||||
| Fourth Quarter | 21.41 | 18.50 | ||||
| 2010 |
First Quarter | 19.94 | 17.02 | |||
| Second Quarter | 20.71 | 18.33 | ||||
| Third Quarter | 21.24 | 18.34 | ||||
| Fourth Quarter | 22.48 | 20.08 | ||||
| 2011 |
First Quarter | 32.36 | 22.67 | |||
| Second Quarter | 32.88 | 29.78 | ||||
| Third Quarter | 34.07 | 21.58 | ||||
| Fourth Quarter | 29.34 | 20.27 | ||||
| 2012 |
First Quarter | 35.06 | 30.47 | |||
| Second Quarter | 32.23 | 23.32 | ||||
| Third Quarter | 31.09 | 24.09 | ||||
| Fourth Quarter | 31.93 | 29.30 | ||||
| 2013 |
First Quarter (through February 26, 2013) | 35.71 | 31.59 | |||
Merck & Co., Inc.
Merck & Co., Inc. is a global health care company that delivers health solutions through its prescription medicines, vaccines, biologic therapies, animal health, and consumer care products, which it markets directly and through its joint ventures. The company has operations in pharmaceutical, animal health, and consumer care. This Basket Stock trades on the NYSE under the symbol “MRK”. The company’s CIK number is 310158.
| High ($) | Low ($) | |||||
| 2008 |
First Quarter | 60.55 | 37.95 | |||
| Second Quarter | 41.71 | 34.68 | ||||
| Third Quarter | 38.45 | 30.34 | ||||
| Fourth Quarter | 32.09 | 23.56 | ||||
| 2009 |
First Quarter | 31.00 | 20.99 | |||
| Second Quarter | 27.96 | 22.97 | ||||
| Third Quarter | 32.95 | 26.45 | ||||
| Fourth Quarter | 38.00 | 30.67 | ||||
| 2010 |
First Quarter | 41.03 | 36.20 | |||
| Second Quarter | 37.71 | 31.82 | ||||
| Third Quarter | 37.34 | 34.22 | ||||
| Fourth Quarter | 37.42 | 34.10 | ||||
| 2011 |
First Quarter | 37.35 | 31.08 | |||
| Second Quarter | 37.58 | 33.07 | ||||
| Third Quarter | 36.31 | 29.81 | ||||
| Fourth Quarter | 37.90 | 31.35 | ||||
| 2012 |
First Quarter | 39.26 | 37.31 | |||
| Second Quarter | 41.75 | 37.18 | ||||
| Third Quarter | 45.23 | 41.21 | ||||
| Fourth Quarter | 47.96 | 40.64 | ||||
| 2013 |
First Quarter (through February 26, 2013) | 43.66 | 40.85 | |||
| Autocallable Market-Linked Step Up Notes | TS-18 |
| Autocallable Market-Linked Step Up Notes Linked to a Basket of 23 Common Equity Securities, due March , 2016 |
|
National Oilwell Varco Inc.
National Oilwell Varco Inc. is a worldwide provider of equipment and components used in oil and gas drilling and production operations, oilfield services, and supply chain integration services to the upstream oil and gas industry. This Basket Stock trades on the NYSE under the symbol “NOV”. The company’s CIK number is 1021860.
| High ($) | Low ($) | |||||||||||
| 2008 |
First Quarter | 76.81 | 51.49 | |||||||||
| Second Quarter | 91.55 | 60.17 | ||||||||||
| Third Quarter | 90.43 | 45.61 | ||||||||||
| Fourth Quarter | 47.06 | 17.86 | ||||||||||
| 2009 |
First Quarter | 33.64 | 22.35 | |||||||||
| Second Quarter | 40.08 | 29.27 | ||||||||||
| Third Quarter | 44.38 | 29.55 | ||||||||||
| Fourth Quarter | 49.82 | 40.89 | ||||||||||
| 2010 |
First Quarter | 47.56 | 39.92 | |||||||||
| Second Quarter | 46.45 | 33.02 | ||||||||||
| Third Quarter | 44.85 | 33.24 | ||||||||||
| Fourth Quarter | 67.25 | 43.94 | ||||||||||
| 2011 |
First Quarter | 82.26 | 63.72 | |||||||||
| Second Quarter | 81.46 | 65.40 | ||||||||||
| Third Quarter | 83.31 | 51.22 | ||||||||||
| Fourth Quarter | 75.73 | 50.23 | ||||||||||
| 2012 |
First Quarter | 87.18 | 70.75 | |||||||||
| Second Quarter | 80.67 | 60.00 | ||||||||||
| Third Quarter | 84.83 | 64.40 | ||||||||||
| Fourth Quarter | 82.03 | 64.87 | ||||||||||
| 2013 |
First Quarter (through February 26, 2013) | 74.14 | 66.26 | |||||||||
Novo Nordisk A/S
Novo Nordisk A/S develops, produces, and markets pharmaceutical products. The company focuses on diabetes care and offers insulin delivery systems and other diabetes products. The company also works in areas such as haemostatis management, growth disorders, and hormone replacement therapy. The company offers educational and training materials. The company markets worldwide. This Basket Stock is an American Depositary Receipt, and trades on the NYSE under the symbol “NVO”. The company’s CIK number is 353278.
| High ($) | Low ($) | |||||||||||
| 2008 |
First Quarter | 70.68 | 57.93 | |||||||||
| Second Quarter | 73.03 | 61.46 | ||||||||||
| Third Quarter | 66.76 | 51.08 | ||||||||||
| Fourth Quarter | 57.71 | 44.02 | ||||||||||
| 2009 |
First Quarter | 55.78 | 43.14 | |||||||||
| Second Quarter | 55.42 | 41.97 | ||||||||||
| Third Quarter | 65.67 | 53.51 | ||||||||||
| Fourth Quarter | 69.33 | 61.60 | ||||||||||
| 2010 |
First Quarter | 79.13 | 64.35 | |||||||||
| Second Quarter | 85.32 | 74.02 | ||||||||||
| Third Quarter | 99.24 | 81.13 | ||||||||||
| Fourth Quarter | 112.57 | 90.99 | ||||||||||
| 2011 |
First Quarter | 127.96 | 110.78 | |||||||||
| Second Quarter | 131.43 | 117.02 | ||||||||||
| Third Quarter | 127.27 | 97.31 | ||||||||||
| Fourth Quarter | 115.26 | 94.58 | ||||||||||
| 2012 |
First Quarter | 144.71 | 115.46 | |||||||||
| Second Quarter | 151.88 | 130.75 | ||||||||||
| Third Quarter | 160.83 | 144.17 | ||||||||||
| Fourth Quarter | 170.11 | 145.18 | ||||||||||
| 2013 |
First Quarter (through February 26, 2013) | 194.30 | 165.40 | |||||||||
| Autocallable Market-Linked Step Up Notes | TS-19 |
| Autocallable Market-Linked Step Up Notes Linked to a Basket of 23 Common Equity Securities, due March , 2016 |
|
Phillip Morris International Inc.
Philip Morris International Inc., through its subsidiaries, affiliates and their licensees, produces, sells, distributes, and markets a wide range of branded cigarettes and tobacco products in markets outside of the United States of America. The company’s portfolio comprises both international and local brands. This Basket Stock trades on the NYSE under the symbol “PM”. The company’s CIK number is 1413329.
| High ($) | Low ($) | |||||||||||
| 2008 |
First Quarter | 51.75 | 49.15 | |||||||||
| Second Quarter | 53.63 | 48.00 | ||||||||||
| Third Quarter | 55.95 | 46.80 | ||||||||||
| Fourth Quarter | 50.78 | 36.63 | ||||||||||
| 2009 |
First Quarter | 44.47 | 32.34 | |||||||||
| Second Quarter | 44.60 | 36.09 | ||||||||||
| Third Quarter | 49.40 | 42.34 | ||||||||||
| Fourth Quarter | 51.55 | 47.36 | ||||||||||
| 2010 |
First Quarter | 52.89 | 45.51 | |||||||||
| Second Quarter | 52.95 | 43.17 | ||||||||||
| Third Quarter | 56.32 | 46.45 | ||||||||||
| Fourth Quarter | 60.82 | 55.29 | ||||||||||
| 2011 |
First Quarter | 65.70 | 56.02 | |||||||||
| Second Quarter | 71.75 | 64.92 | ||||||||||
| Third Quarter | 72.35 | 62.38 | ||||||||||
| Fourth Quarter | 79.10 | 61.76 | ||||||||||
| 2012 |
First Quarter | 88.61 | 73.26 | |||||||||
| Second Quarter | 90.31 | 81.91 | ||||||||||
| Third Quarter | 93.38 | 86.67 | ||||||||||
| Fourth Quarter | 93.74 | 82.39 | ||||||||||
| 2013 |
First Quarter (through February 26, 2013) | 93.42 | 85.83 | |||||||||
QUALCOMM Incorporated
QUALCOMM Incorporated manufactures digital wireless communications equipment. The company licenses its code division multiple access (CDMA) and orthogonal frequency division multiplexing access intellectual property to other companies, and produces CDMA-based integrated circuits, and produces equipment and software used to track workers and assets, and software for wireless content enablement. This Basket Stock trades on the NASDAQ under the symbol “QCOM”. The company’s CIK number is 804328.
| High ($) | Low ($) | |||||||||||
| 2008 |
First Quarter | 43.79 | 35.97 | |||||||||
| Second Quarter | 50.42 | 41.19 | ||||||||||
| Third Quarter | 56.39 | 39.88 | ||||||||||
| Fourth Quarter | 42.48 | 29.21 | ||||||||||
| 2009 |
First Quarter | 39.54 | 32.78 | |||||||||
| Second Quarter | 46.34 | 39.36 | ||||||||||
| Third Quarter | 48.45 | 43.06 | ||||||||||
| Fourth Quarter | 46.86 | 40.68 | ||||||||||
| 2010 |
First Quarter | 49.47 | 35.56 | |||||||||
| Second Quarter | 43.29 | 32.84 | ||||||||||
| Third Quarter | 45.12 | 31.96 | ||||||||||
| Fourth Quarter | 49.99 | 43.89 | ||||||||||
| 2011 |
First Quarter | 59.58 | 50.21 | |||||||||
| Second Quarter | 58.59 | 52.25 | ||||||||||
| Third Quarter | 59.36 | 46.40 | ||||||||||
| Fourth Quarter | 57.40 | 47.65 | ||||||||||
| 2012 |
First Quarter | 68.59 | 55.27 | |||||||||
| Second Quarter | 68.32 | 53.55 | ||||||||||
| Third Quarter | 65.08 | 53.73 | ||||||||||
| Fourth Quarter | 64.35 | 57.43 | ||||||||||
| 2013 |
First Quarter (through February 26, 2013) | 67.18 | 63.45 | |||||||||
| Autocallable Market-Linked Step Up Notes | TS-20 |
| Autocallable Market-Linked Step Up Notes Linked to a Basket of 23 Common Equity Securities, due March , 2016 |
|
Starbucks Corporation
Starbucks Corporation retails, roasts, and provides its own brand of specialty coffee. The company operates retail locations worldwide and sells whole bean coffees through its sales group, direct response business, supermarkets, and on the Internet. The company also produces and sells bottled coffee drinks and a line of ice creams. This Basket Stock trades on the NASDAQ under the symbol “SBUX”. The company’s CIK number is 829224.
| High ($) | Low ($) | |||||
| 2008 |
First Quarter | 20.45 | 16.80 | |||
| Second Quarter | 18.60 | 15.66 | ||||
| Third Quarter | 16.93 | 13.58 | ||||
| Fourth Quarter | 14.80 | 7.17 | ||||
| 2009 |
First Quarter | 12.39 | 8.27 | |||
| Second Quarter | 15.30 | 11.17 | ||||
| Third Quarter | 20.76 | 12.97 | ||||
| Fourth Quarter | 23.80 | 18.75 | ||||
| 2010 |
First Quarter | 25.56 | 21.70 | |||
| Second Quarter | 28.12 | 24.24 | ||||
| Third Quarter | 26.28 | 22.86 | ||||
| Fourth Quarter | 32.93 | 25.69 | ||||
| 2011 |
First Quarter | 37.97 | 31.53 | |||
| Second Quarter | 39.49 | 34.86 | ||||
| Third Quarter | 41.16 | 34.05 | ||||
| Fourth Quarter | 46.45 | 36.20 | ||||
| 2012 |
First Quarter | 56.26 | 45.34 | |||
| Second Quarter | 61.67 | 51.27 | ||||
| Third Quarter | 54.20 | 43.16 | ||||
| Fourth Quarter | 54.58 | 44.98 | ||||
| 2013 |
First Quarter (through February 26, 2013) | 56.86 | 53.21 | |||
The Coca-Cola Company
The Coca-Cola Company manufactures, markets, and distributes soft drink concentrates and syrups. The company also distributes and markets juice and juice-drink products. The company distributes its products to retailers and wholesalers in the United States and internationally. This Basket Stock trades on the NYSE under the symbol “KO”. The company’s CIK number is 021344.
| High ($) | Low ($) | |||||
| 2008 |
First Quarter | 32.78 | 28.70 | |||
| Second Quarter | 30.72 | 25.92 | ||||
| Third Quarter | 27.71 | 24.80 | ||||
| Fourth Quarter | 27.08 | 20.51 | ||||
| 2009 |
First Quarter | 22.95 | 18.93 | |||
| Second Quarter | 24.88 | 21.12 | ||||
| Third Quarter | 26.88 | 24.06 | ||||
| Fourth Quarter | 29.56 | 26.56 | ||||
| 2010 |
First Quarter | 28.57 | 26.33 | |||
| Second Quarter | 27.66 | 25.04 | ||||
| Third Quarter | 29.55 | 25.02 | ||||
| Fourth Quarter | 32.89 | 29.44 | ||||
| 2011 |
First Quarter | 33.18 | 30.80 | |||
| Second Quarter | 34.23 | 32.47 | ||||
| Third Quarter | 35.62 | 31.98 | ||||
| Fourth Quarter | 35.08 | 32.37 | ||||
| 2012 |
First Quarter | 37.01 | 33.50 | |||
| Second Quarter | 39.10 | 35.97 | ||||
| Third Quarter | 40.56 | 37.14 | ||||
| Fourth Quarter | 38.58 | 35.97 | ||||
| 2013 |
First Quarter (through February 26, 2013) | 38.91 | 36.84 | |||
| Autocallable Market-Linked Step Up Notes | TS-21 |
| Autocallable Market-Linked Step Up Notes Linked to a Basket of 23 Common Equity Securities, due March , 2016 |
|
The Hershey Company
The Hershey Company manufactures chocolate and sugar confectionery products. The company’s principal products include chocolate and sugar confectionery products, gum and mint refreshment products, and pantry items, such as baking ingredients, toppings and beverages. This Basket Stock trades on the NYSE under the symbol “HSY”. The company’s CIK number is 047111.
| High ($) | Low ($) | |||||
| 2008 |
First Quarter | 38.89 | 34.04 | |||
| Second Quarter | 40.23 | 32.48 | ||||
| Third Quarter | 42.73 | 32.66 | ||||
| Fourth Quarter | 40.00 | 32.81 | ||||
| 2009 |
First Quarter | 37.84 | 30.75 | |||
| Second Quarter | 37.45 | 33.86 | ||||
| Third Quarter | 41.80 | 36.48 | ||||
| Fourth Quarter | 40.88 | 35.29 | ||||
| 2010 |
First Quarter | 43.52 | 36.18 | |||
| Second Quarter | 51.76 | 43.06 | ||||
| Third Quarter | 51.61 | 45.49 | ||||
| Fourth Quarter | 51.62 | 45.89 | ||||
| 2011 |
First Quarter | 54.79 | 46.37 | |||
| Second Quarter | 57.71 | 53.92 | ||||
| Third Quarter | 60.00 | 54.59 | ||||
| Fourth Quarter | 62.00 | 55.36 | ||||
| 2012 |
First Quarter | 61.94 | 59.49 | |||
| Second Quarter | 72.03 | 59.81 | ||||
| Third Quarter | 73.16 | 70.09 | ||||
| Fourth Quarter | 74.64 | 68.85 | ||||
| 2013 |
First Quarter (through February 26, 2013) | 81.73 | 73.51 | |||
The Procter & Gamble Company
The Procter & Gamble Company manufactures and markets consumer products in countries throughout the world. The company provides products in the laundry and cleaning, paper, beauty care, food and beverage, and health care segments. The company’s products are sold primarily through mass merchandisers, grocery stores, membership club stores, drug stores, and neighborhood stores. This Basket Stock trades on the NYSE under the symbol “PG”. The company’s CIK number is 080424.
| High ($) | Low ($) | |||||
| 2008 |
First Quarter | 72.60 | 64.68 | |||
| Second Quarter | 71.14 | 60.49 | ||||
| Third Quarter | 73.15 | 61.98 | ||||
| Fourth Quarter | 71.44 | 57.37 | ||||
| 2009 |
First Quarter | 62.80 | 44.18 | |||
| Second Quarter | 54.02 | 47.25 | ||||
| Third Quarter | 58.16 | 51.11 | ||||
| Fourth Quarter | 63.19 | 56.62 | ||||
| 2010 |
First Quarter | 64.53 | 59.84 | |||
| Second Quarter | 63.94 | 59.79 | ||||
| Third Quarter | 63.08 | 59.34 | ||||
| Fourth Quarter | 65.24 | 59.96 | ||||
| 2011 |
First Quarter | 66.70 | 59.73 | |||
| Second Quarter | 67.46 | 61.67 | ||||
| Third Quarter | 64.95 | 58.51 | ||||
| Fourth Quarter | 66.97 | 61.00 | ||||
| 2012 |
First Quarter | 67.90 | 62.77 | |||
| Second Quarter | 67.56 | 59.27 | ||||
| Third Quarter | 69.76 | 61.19 | ||||
| Fourth Quarter | 70.76 | 66.32 | ||||
| 2013 |
First Quarter (through February 26, 2013) | 77.38 | 68.51 | |||
| Autocallable Market-Linked Step Up Notes | TS-22 |
| Autocallable Market-Linked Step Up Notes Linked to a Basket of 23 Common Equity Securities, due March , 2016 |
|
Supplement to the Plan of Distribution; Conflicts of Interest
Under our distribution agreement with MLPF&S, MLPF&S will purchase the notes from us as principal at the public offering price indicated on the cover of this term sheet, less the indicated underwriting discount.
MLPF&S, a broker-dealer subsidiary of BAC, is a member of the Financial Industry Regulatory Authority, Inc. (“FINRA”) and will participate as selling agent in the distribution of the notes. Accordingly, offerings of the notes will conform to the requirements of Rule 5121 applicable to FINRA members. MLPF&S may not make sales in this offering to any of its discretionary accounts without the prior written approval of the account holder.
We may deliver the notes against payment therefor in New York, New York on a date that is greater than three business days following the pricing date. Under Rule 15c6-1 of the Securities Exchange Act of 1934, trades in the secondary market generally are required to settle in three business days, unless the parties to any such trade expressly agree otherwise. Accordingly, if the initial settlement of the notes occurs more than three business days from the pricing date, purchasers who wish to trade the notes more than three business days prior to the original issue date will be required to specify alternative settlement arrangements to prevent a failed settlement.
The notes will not be listed on any securities exchange. In the original offering of the notes, the notes will be sold in minimum investment amounts of 100 units. If you place an order to purchase the notes, you are consenting to MLPF&S acting as a principal in effecting the transaction for your account.
MLPF&S will not receive an underwriting discount for notes sold to certain fee-based trusts and fee-based discretionary accounts managed by U.S. Trust operating through Bank of America, N.A.
The value of the notes shown on your account statement will be based on MLPF&S’s estimate of the value of the notes if MLPF&S or another of our affiliates were to make a market in the notes, which it is not obligated to do. That estimate will be based upon the price that MLPF&S may pay for the notes in light of then-prevailing market conditions, our creditworthiness and transaction costs. At certain times, this price may be higher than or lower than the estimated initial value of the notes. For a short initial period after the issuance of the notes, at MLPF&S’s discretion, any purchase price paid by MLPF&S in the secondary market may be, in certain circumstances, closer to the amount that you paid for the notes than to their estimated initial value. However, neither we nor any of our affiliates is obligated to purchase your notes at any price, or at a price that exceeds their estimated initial value.
MLPF&S may repurchase and resell the notes, with repurchases and resales being made at prices related to then-prevailing market prices or at negotiated prices, and these will include MLPF&S’s trading commissions and mark-ups. MLPF&S may act as principal or agent in these market-making transactions; however it is not obligated to engage in any such transactions.
Structuring the Notes
The notes are our debt securities, the return on which is linked to the level of the Basket. As is the case for all of our debt securities, including our market-linked notes, the economic terms of the notes reflect our actual or perceived creditworthiness at the time of pricing. In addition, because market-linked notes result in increased operational, funding and liability management costs to us, we typically borrow the funds under these notes at a rate that is more favorable to us than the rate that we might pay for a conventional fixed or floating rate debt security and is generally lower by an amount ranging from 0.25% to 0.50% per annum (equivalent to $0.05 to $0.11 per unit) at the time we commence the offering of our market-linked notes. This generally relatively lower implied borrowing rate, which is reflected in the economic terms of the notes, along with the fees and charges associated with market-linked notes, typically results in the estimated initial value of the notes at the time the terms of the notes are set being less than their public offering price.
The amounts that we will pay on the notes will be based on the performance of the Basket and calculated based on the $10 per unit Original Offering Price. In order to meet these payment obligations, at the time we issue the notes, we may choose to enter into certain hedging arrangements (which may include call options, put options or other derivatives) with MLPF&S or one of its affiliates. The terms of these hedging arrangements are determined by seeking bids from market participants, including MLPF&S and its affiliates, and take into account a number of factors, including our creditworthiness, interest rate movements, the volatility of the Basket, the tenor of the note and the tenor of the hedging arrangements. The economic terms of the notes depend in part on the terms of these hedging arrangements.
MLPF&S has advised us that the hedging arrangements will include a hedging related charge of approximately $0.075 per unit, reflecting an estimated profit to be credited to MLPF&S from these transactions. Since hedging entails risk and may be influenced by unpredictable market forces, additional profits and losses from these hedging arrangements may be realized by the hedge providers.
The lower implied borrowing rate, the underwriting discount and the hedging-related costs and charges, reduce the economic terms of the notes to you and result in the estimated initial value for the notes (estimated at the time the terms of the notes are set) being less than the public offering price for the notes. For further information, see “Risk Factors — General Risks Relating to the Notes” beginning on page S-8 and “Use of Proceeds” on page S-16 of product supplement STOCK SUN-2.
| Autocallable Market-Linked Step Up Notes | TS-23 |
| Autocallable Market-Linked Step Up Notes Linked to a Basket of 23 Common Equity Securities, due March , 2016 |
|
Summary Tax Consequences
You should consider the U.S. federal income tax consequences of an investment in the notes, including the following:
| • | There is no statutory, judicial, or administrative authority directly addressing the characterization of the notes. |
| • | You agree with us (in the absence of an administrative determination, or judicial ruling to the contrary) to characterize and treat the notes for all tax purposes as a callable single financial contract with respect to the Market Measure. |
| • | Under this characterization and tax treatment of the notes, a U.S. Holder (as defined beginning on page 62 of the prospectus) generally will recognize capital gain or loss upon maturity or upon a sale, exchange, or redemption of the notes prior to maturity. This capital gain or loss generally will be long-term capital gain or loss if you held the notes for more than one year. |
| • | No assurance can be given that the IRS or any court will agree with this characterization and tax treatment. |
You should consult your own tax advisor concerning the U.S. federal income tax consequences to you of acquiring, owning, and disposing of the notes, as well as any tax consequences arising under the laws of any state, local, foreign, or other tax jurisdiction and the possible effects of changes in U.S. federal or other tax laws. You should review carefully the discussion under the section entitled “U.S. Federal Income Tax Summary” beginning on page S-33 of product supplement STOCK SUN-2.
Where You Can Find More Information
We have filed a registration statement (including a product supplement, a prospectus supplement, and a prospectus) with the SEC for the offering to which this term sheet relates. Before you invest, you should read the Note Prospectus, including this term sheet, and the other documents that we have filed with the SEC, for more complete information about us and this offering. You may get these documents without cost by visiting EDGAR on the SEC website at www.sec.gov. Alternatively, we, any agent, or any dealer participating in this offering will arrange to send you these documents if you so request by calling MLPF&S toll-free at 1-866-500-5408.
Market-Linked Investments Classification

MLPF&S classifies certain market-linked investments (the “Market-Linked Investments”) into categories, each with different investment characteristics. The following description is meant solely for informational purposes and is not intended to represent any particular Enhanced Return Market-Linked Investment or guarantee any performance.
Enhanced Return Market-Linked Investments are short- to medium-term investments that offer you a way to enhance exposure to a particular market view without taking on a similarly enhanced level of market downside risk. They can be especially effective in a flat to moderately positive market (or, in the case of bearish investments, a flat to moderately negative market). In exchange for the potential to receive better-than market returns on the linked asset, you must generally accept market downside risk and capped upside potential. As these investments are not market downside protected, and do not assure full repayment of principal at maturity, you need to be prepared for the possibility that you may lose all or part of your investment.
| Autocallable Market-Linked Step Up Notes | TS-24 |