UNITED STATES
SECURITIES AND EXCHANGE COMMISSION
Washington, D.C. 20549
FORM 10-K
| |
|
|
(Mark One) |
|
|
þ
|
|
ANNUAL REPORT PURSUANT TO SECTION 13 OR 15(d) OF THE SECURITIES
EXCHANGE ACT OF 1934 |
|
|
For the fiscal year ended December 30, 2005 |
|
|
|
OR
|
|
|
|
o
|
|
TRANSITION REPORT PURSUANT TO SECTION 13 OR 15(d) OF THE
SECURITIES EXCHANGE ACT OF 1934 |
|
|
For the transition period from
to |
|
|
Commission file number 1-7182 |
Merrill Lynch & Co., Inc.
(Exact name of Registrant as specified in its charter)
| |
|
|
| Delaware
|
|
13-2740599 |
| (State or other jurisdiction of incorporation or organization)
|
|
(I.R.S. Employer Identification No.) |
| |
|
|
| 4 World Financial Center, New York, New York
|
|
10080 |
| (Address of principal executive offices)
|
|
(Zip Code) |
| |
|
|
Registrant’s telephone number, including area code: (212) 449-1000
|
| |
|
|
| Securities registered pursuant to Section 12(b) of the Act: |
|
|
| |
|
|
| Title of Each Class
|
|
Name of Each Exchange on Which Registered |
| Common Stock, par value
$1.331/3
and attached Rights to Purchase Series A Junior Preferred Stock
|
|
New York Stock Exchange; Chicago Stock Exchange; Pacific Exchange;
London
Stock Exchange; and Tokyo Stock Exchange |
| |
|
|
| Depositary Shares representing
1/1200th share
of Floating Rate Non-Cumulative Preferred Stock, Series 1; Depositary Shares representing
1/1200th share of
Floating Rate Non-Cumulative Preferred Stock, Series 2; Depositary Shares representing
1/1200th share
of 6.375% Non- Cumulative Preferred Stock, Series 3; Depositary Shares representing
1/1200th share
of Floating Rate Non-Cumulative Preferred Stock, Series 4; Top
Ten Yield MITTS®
Securities due August 15, 2006; and S&P 500® Inflation
Adjusted MITTS Securities due September 24, 2007
|
|
New York Stock Exchange |
See the full list of securities listed on the American Stock Exchange on the pages directly
following this cover.
Securities registered pursuant to Section 12(g) of the Act:
See the full list of securities registered pursuant to Section 12(g) of the Act on the
pages directly following this cover.
Indicate by check mark if the Registrant is a well-known seasoned issuer, as defined in Rule 405
of the Securities Act. Yes þ No o
Indicate by check mark if the Registrant is not required to file reports pursuant to Section 13
or Section 15(d) of the Exchange Act. Yes o No
þ
Indicate by check mark whether the Registrant (1) has filed all reports required to be
filed by Section 13 or 15(d) of the Securities Exchange Act of 1934 during the preceding 12 months
(or for such shorter period that the Registrant was required to file such reports),
and (2) has been subject to such filing requirements for the past 90 days. Yes
þ No o
Indicate by check mark if disclosure of delinquent filers pursuant to Item 405 of
Regulation S-K is not contained herein, and will not be contained, to the best of the
Registrant’s knowledge, in definitive proxy or information statements incorporated by reference
in Part III of this Form 10-K or any amendment to this Form 10-K.
o
Indicate by check mark whether the Registrant is a large accelerated filer, an accelerated
filer, or a non-accelerated filer. See definition of “accelerated filer and large accelerated
filer” in Rule 12b-2 of the Exchange Act. (Check one):
| |
|
|
|
|
Large accelerated filer þ
|
|
Accelerated filer o
|
|
Non-accelerated filer o |
Indicate by check mark whether the Registrant is a shell company (as defined in Rule 12b-2
of the Exchange Act). Yes o No þ
As of the close of business on July 1, 2005, the aggregate market value of the voting
stock, comprising the Common Stock and the Exchangeable Shares, held by non-affiliates of the
Registrant was approximately $55.2 billion.
As of the close of business on February 17, 2006, there were 945,917,006 shares of
Common Stock and 2,706,603 Exchangeable Shares outstanding. The Exchangeable Shares, which were
issued by Merrill Lynch & Co., Canada Ltd. in connection with the merger with Midland Walwyn
Inc., are exchangeable at any time into Common Stock on a one-for-one basis and entitle holders
to dividend, voting and other rights equivalent to Common Stock.
Documents Incorporated By Reference: Portions of the Merrill Lynch Proxy
Statement to be filed for its 2006 Annual Meeting of Shareholders to be held April 28, 2006
are incorporated by reference in this Form 10-K in response to Part III.
Pages 1
through 18, on which appeared a portion of Merrill Lynch & Co., Inc.’s 2005 Annual Report to
Shareholders, are not filed with, incorporated by reference in or otherwise to be deemed a part
of this Annual Report on Form 10-K.
Securities registered pursuant to Section 12(b) of the Act and listed on the American Stock
Exchange are as follows:
Accelerated Return
NotesSM Linked to the S&P 500 Index due August 24, 2007; Strategic Return
Notes® Linked to the Industrial 15 Index due August 3, 2009; Accelerated Return Notes
Linked
to the S&P 500 Index due August 24, 2007; Accelerated Return Notes Linked to the Nikkei-225®
Index due March 5, 2007; Accelerated Return Bear Market
NotesSM Linked to the PHLX Housing
Sector Index due March 22, 2007; 8% Monthly Income Strategic Return Notes Linked to the CBOE
S&P 500 BuyWrite Index due January 3, 2011; Accelerated Return Notes Linked to the Russell
2000®
due February 28, 2007; Nikkei
225® Market Indexed Target Term Securities® due June 5,
2009; 8% Monthly Income Strategic Return Notes Linked to the CBOE DJIA BuyWrite Index due
November 9, 2010; Convertible Securities Exchangeable into Pharmaceutical HOLDRs®
due September 7,
2010; Accelerated Return Notes Linked to the Nikkei 225® Index due November 7,
2006; Strategic Return Notes Linked to the Industrial 15 Index due August 9, 2010; 8%
Monthly Income Strategic Return Notes Linked to the CBOE S&P 500 BuyWrite Index due June 7,
2010; MITTS Securities based upon the Russell 2000 Index due March 30, 2009; Nikkei® 225
Securities due March 30, 2009; S&P 500 MITTS Securities due June 29, 2009; MITTS
Securities based upon the Dow Jones Industrial AverageSM due August 7, 2009; S&P 500
MITTS Securities due September 4, 2009; EuroFund MITTS Securities due February 28, 2006;
S&P 500 MITTS Securities due March 27, 2006; Consumer Staples Select Sector SPDR Fund MITTS
Securities due April 19, 2006; Select Sector SPDR® Fund Growth Portfolio MITTS
Securities due May 25, 2006; Major 11 International MITTS Securities due May 26, 2006;
MITTS Securities based upon the Dow Jones Industrial Average due June 26, 2006; Russell 2000
MITTS Securities due July 21, 2006; Nikkei 225 MITTS Securities due August 4, 2006; S&P
500 MITTS Securities due August 4, 2006; Energy Select Sector SPDR Fund MITTS Securities
due September 20, 2006; Medium-Term Notes, Series B, 0.25% Callable and Exchangeable
Stock-Linked Notes due May 10, 2006; Medium-Term Notes, Series B, 1% Callable and
Exchangeable Stock-Linked Notes due July 20, 2006; 1% Convertible Securities Exchangeable
into McDonald’s Corporation common stock due May 28, 2009; Callable MITTS Securities due
October 5, 2007 based upon Semiconductor HOLDRS®; Callable MITTS Securities due September 13,
2007 based upon Broadband HOLDRS; Callable Nasdaq-100® MITTS Securities due August 3,
2007; Callable MITTS Securities due May 4, 2009 Linked to the S&P 500 Index; Callable MITTS
Securities due May 4, 2009 Linked to the Amex Biotechnology Index; Callable MITTS Securities
due June 1, 2009 Linked to the Amex Defense Index; Callable MITTS Securities due August 3,
2007 based upon Biotech HOLDRS; Medium-Term Notes, Series B, Nikkei 225 MITTS Securities
due March 30, 2007; Callable MITTS Securities due March 5, 2007 based upon Internet
HOLDRS; Medium-Term Notes, Series B, 0.25% Callable and Exchangeable Stock-Linked Notes due
January 7, 2008 (Linked to the performance of Wells Fargo & Company); Nikkei 225 MITTS
Securities due June 27, 2007; Strategic Return Notes Linked to the Industrial 15 Index due
February 1, 2007; Strategic Return Not
es Linked to the Biotech-Pharmaceutical Index due
February 8, 2007; Strategic Return Notes Linked to the Select Ten Index due March 1,
2007; Strategic Return Notes Linked to the Oil and Natural Gas Index due March 28, 2007;
Strategic Return Notes Linked to the Industrial 15 Index due May 3, 2007; Strategic
Return Notes Linked to the Select Ten Index due May 3, 2007; Strategic Return Notes Linked
to the Select European 50 Index due June 11, 2007; Strategic Return Notes Linked
to the Select Ten Index due June 28, 2007; Strategic Return Notes Linked to the
Industrial 15 Index due August 30, 2007; Strategic Return Notes Linked to the Select Ten
Index
due October 25, 2007; Strategic Return Notes Linked to the Biotech-Pharmaceutical
Index due November 1, 2007; Strategic Return Notes Linked to the Select Ten Index due May 30,
2006; Strategic Return Notes Linked to the Industrial 15 Index due June 26,
2006; Strategic Return Notes Linked to the Institutional Holdings Index due June 28,
2006; Strategic Return Notes Linked to the Select Ten Index due July 31, 2006; Strategic
Return Notes Linked to the Select Ten Index due November 2, 2006; Convertible Securities
Exchangeable into Exxon Mobil Corporation Common Stock due October 3, 2008; Convertible
Securities Exchangeable into The Coca-Cola Company Common Stock due September 30, 2008;
Strategic Return Notes Linked to the Select Utility Index due February 25, 2009; and
Strategic Return Notes Linked to the Select Utility Index due September 28, 2009.
Securities registered pursuant to Section 12(g) of the Act are as follows:
S&P 500 MITTS Securities due June 29, 2007; S&P 500 MITTS Securities due November 20,
2007; S&P 500 MITTS Securities due August 29, 2008; MITTS Securities based upon the Dow Jones
Industrial Average due September 29, 2008; MITTS Securities based upon the Dow Jones
Industrial Average due January 16, 2009; Market Recovery Notes Linked to the Nasdaq-100
Index; Strategic Return Notes Linked to the Select Ten Index due February 28, 2008; S&P
500 MITTS Securities due June 3, 2010; S&P 500 MITTS Securities due September 3, 2008;
S&P 500 MITTS Securities due August 5, 2010; Dow Jones Industrial Average MITTS Securities
due December 27, 2010; Nikkei 225 MITTS Securities due March 8, 2011; Nikkei 225 MITTS
Securities due September 30, 2010; Strategic Return Notes Linked to the Select Ten Index
due June 27, 2008; Strategic Return Notes Linked to the Industrial 15 Index due October 31,
2008; Strategic Return Notes Linked to the Select Ten Index due September 30,
2008; Strategic Return Notes Linked to the Industrial 15 Index due August 5, 2008;
Strategic Return Notes Linked to the Select Ten Index due March 2, 2009; 97% Protected
Notes Linked to the performance of the Dow Jones Industrial Average due March 28, 2011;
97% Protected Notes Linked to the Dow Jones Industrial Average due March 28, 2011;
Strategic Return Notes Linked to the Select Ten Index due March 2, 2009; Strategic Return
Notes Linked to the Industrial 15 Index due March 30, 2009; 97% Protected Notes Linked
to Global Equity Basket due February 14, 2012; Strategic Return Notes Linked to
the Select Ten Index due June 4, 2009; Medium-Term Notes, Series C, S&P 500 MITTS
Securities due August 31, 2011; Medium-Term Notes, Series C, Accelerated Return Notes Linked
to the Russell 2000 Index due June 30, 2006; Accelerated Return Notes Linked to the
Nasdaq 100® Index due August 3, 2007; Leveraged Index Return Notes Linked to the Nikkei
225 Index due March 2, 2009; 9% Callable Stock Return Income DEbt SecuritiesSM due May 22,
2006; and S&P 500 MITTS due June 7, 2010.
Table of Contents

Selected Financial Data
| |
|
|
|
|
|
|
|
|
|
|
|
|
|
|
|
|
|
|
|
|
| |
|
Year Ended Last Friday in December |
|
| |
2005 |
|
|
2004 |
|
|
2003 |
|
|
2002 |
|
|
2001 |
|
| (dollars in millions, except per share amounts) |
(52 weeks) |
|
|
(53 weeks) |
|
|
(52 weeks) |
|
|
(52 weeks) |
|
|
(52 weeks) |
|
| |
|
|
|
|
|
|
|
|
|
|
|
|
|
|
|
|
|
|
|
|
|
Results of Operations |
|
|
|
|
|
|
|
|
|
|
|
|
|
|
|
|
|
|
|
|
Total Revenues |
|
$ |
47,783 |
|
|
$ |
32,619 |
|
|
$ |
27,924 |
|
|
$ |
28,361 |
|
|
$ |
39,019 |
|
Less Interest Expense |
|
|
21,774 |
|
|
|
10,560 |
|
|
|
8,024 |
|
|
|
9,990 |
|
|
|
17,471 |
|
| |
|
|
Net Revenues |
|
|
26,009 |
|
|
|
22,059 |
|
|
|
19,900 |
|
|
|
18,371 |
|
|
|
21,548 |
|
Non-Interest Expenses |
|
|
18,778 |
|
|
|
16,223 |
|
|
|
14,680 |
|
|
|
16,059 |
|
|
|
21,789 |
|
| |
|
|
Earnings (Loss) Before Income Taxes |
|
|
7,231 |
|
|
|
5,836 |
|
|
|
5,220 |
|
|
|
2,312 |
|
|
|
(241 |
) |
Income Tax Expense |
|
|
2,115 |
|
|
|
1,400 |
|
|
|
1,384 |
|
|
|
604 |
|
|
|
99 |
|
| |
|
|
Net Earnings (Loss) |
|
$ |
5,116 |
|
|
$ |
4,436 |
|
|
$ |
3,836 |
|
|
$ |
1,708 |
|
|
$ |
(340 |
) |
| |
|
|
Net Earnings (Loss) Applicable to
Common Stockholders(1) |
|
$ |
5,046 |
|
|
$ |
4,395 |
|
|
$ |
3,797 |
|
|
$ |
1,670 |
|
|
$ |
(378 |
) |
| |
|
|
|
|
|
|
|
|
|
|
|
|
|
|
|
|
|
|
|
|
|
|
|
Financial Position |
|
|
|
|
|
|
|
|
|
|
|
|
|
|
|
|
|
|
|
|
Total Assets |
|
$ |
681,015 |
|
|
$ |
628,098 |
|
|
$ |
480,233 |
|
|
$ |
440,252 |
|
|
$ |
431,173 |
|
Short-Term Borrowings(2) |
|
$ |
301,405 |
|
|
$ |
259,804 |
|
|
$ |
191,184 |
|
|
$ |
180,213 |
|
|
$ |
178,154 |
|
Long-Term Borrowings |
|
$ |
132,409 |
|
|
$ |
119,513 |
|
|
$ |
85,178 |
|
|
$ |
79,788 |
|
|
$ |
77,273 |
|
Long-Term debt issued to
TOPrSSM partnerships |
|
$ |
3,092 |
|
|
$ |
3,092 |
|
|
$ |
3,203 |
|
|
$ |
3,188 |
|
|
$ |
3,181 |
|
Total Stockholders’ Equity |
|
$ |
35,600 |
|
|
$ |
31,370 |
|
|
$ |
28,884 |
|
|
$ |
24,081 |
|
|
$ |
20,787 |
|
| |
|
|
|
|
|
|
|
|
|
|
|
|
|
|
|
|
|
|
|
|
|
|
|
Common Share Data |
|
|
|
|
|
|
|
|
|
|
|
|
|
|
|
|
|
|
|
|
(in thousands, except per share amounts) |
|
|
|
|
|
|
|
|
|
|
|
|
|
|
|
|
|
|
|
|
Earnings (Loss) Per Share: |
|
|
|
|
|
|
|
|
|
|
|
|
|
|
|
|
|
|
|
|
Basic |
|
$ |
5.66 |
|
|
$ |
4.81 |
|
|
$ |
4.22 |
|
|
$ |
1.94 |
|
|
$ |
(0.45 |
) |
| |
|
|
Diluted |
|
$ |
5.16 |
|
|
$ |
4.38 |
|
|
$ |
3.87 |
|
|
$ |
1.77 |
|
|
$ |
(0.45 |
) |
| |
|
|
Weighted-Average Shares Outstanding: |
|
|
|
|
|
|
|
|
|
|
|
|
|
|
|
|
|
|
|
|
Basic |
|
|
890,744 |
|
|
|
912,935 |
|
|
|
900,711 |
|
|
|
862,318 |
|
|
|
838,683 |
|
Diluted |
|
|
977,736 |
|
|
|
1,003,779 |
|
|
|
980,947 |
|
|
|
947,282 |
|
|
|
838,683 |
|
Shares Outstanding at Year-End(3) |
|
|
915,602 |
|
|
|
928,037 |
|
|
|
945,911 |
|
|
|
867,291 |
|
|
|
843,474 |
|
Book Value Per Share |
|
$ |
35.82 |
|
|
$ |
32.99 |
|
|
$ |
29.96 |
|
|
$ |
27.07 |
|
|
$ |
23.95 |
|
Dividends Paid Per Share |
|
$ |
0.76 |
|
|
$ |
0.64 |
|
|
$ |
0.64 |
|
|
$ |
0.64 |
|
|
$ |
0.64 |
|
| |
|
|
|
|
|
|
|
|
|
|
|
|
|
|
|
|
|
|
|
|
|
|
|
Financial Ratios |
|
|
|
|
|
|
|
|
|
|
|
|
|
|
|
|
|
|
|
|
Pre-Tax Profit Margin |
|
|
27.8 |
% |
|
|
26.5 |
% |
|
|
26.2 |
% |
|
|
12.6 |
% |
|
|
N/M |
|
Common Dividend Payout Ratio |
|
|
13.4 |
% |
|
|
13.3 |
% |
|
|
15.2 |
% |
|
|
33.0 |
% |
|
|
N/M |
|
Return on Average Assets |
|
|
0.7 |
% |
|
|
0.8 |
% |
|
|
0.8 |
% |
|
|
0.4 |
% |
|
|
N/M |
|
Return on Average Common
Stockholders’ Equity |
|
|
16.0 |
% |
|
|
14.9 |
% |
|
|
14.8 |
% |
|
|
7.5 |
% |
|
|
N/M |
|
| |
|
|
|
|
|
|
|
|
|
|
|
|
|
|
|
|
|
|
|
|
|
|
|
Other Statistics |
|
|
|
|
|
|
|
|
|
|
|
|
|
|
|
|
|
|
|
|
Full-Time Employees: |
|
|
|
|
|
|
|
|
|
|
|
|
|
|
|
|
|
|
|
|
U.S. |
|
|
43,200 |
|
|
|
40,200 |
|
|
|
38,200 |
|
|
|
40,000 |
|
|
|
43,400 |
|
Non-U.S. |
|
|
11,400 |
|
|
|
10,400 |
|
|
|
9,900 |
|
|
|
10,900 |
|
|
|
13,700 |
|
| |
|
|
Total(4) |
|
|
54,600 |
|
|
|
50,600 |
|
|
|
48,100 |
|
|
|
50,900 |
|
|
|
57,100 |
|
| |
|
|
Private Client Financial Advisors |
|
|
15,160 |
|
|
|
14,140 |
|
|
|
13,530 |
|
|
|
14,010 |
|
|
|
16,350 |
|
Client Assets (dollars in billions) |
|
$ |
1,764 |
|
|
$ |
1,597 |
|
|
$ |
1,507 |
|
|
$ |
1,311 |
|
|
$ |
1,556 |
|
| |
|
|
|
| (1) |
|
Net earnings (loss) less preferred stock dividends. |
| (2) |
|
Consists of Payables under repurchase agreements and securities loaned transactions, Commercial
paper and other short-term borrowings, and Deposits. |
| (3) |
|
Does not include 2,708; 2,783; 2,900; 3,911; and 4,195 shares exchangeable into common stock at
year-end 2005, 2004, 2003, 2002, and 2001, respectively. See Note 11 to the Consolidated Financial
Statements. |
| (4) |
|
Excludes 200; 100; 200; 1,500; and 3,500 full-time employees on salary continuation severance
at year-end 2005, 2004, 2003, 2002, and 2001, respectively. |
20
Merrill Lynch 2005 Annual Report
Management’s Discussion and Analysis of Financial Condition and Results of Operations
Forward-Looking Statements
Certain statements in this report may be considered forward-looking, including those about
management expectations, strategic objectives, growth opportunities, business prospects,
anticipated financial results, the impact of off balance sheet arrangements, significant
contractual obligations, anticipated results of litigation and regulatory investigations and
proceedings, and other similar matters. These forward-looking statements represent only Merrill
Lynch & Co., Inc.’s (“ML & Co.” and, together with its subsidiaries, “Merrill Lynch”) beliefs
regarding future performance, which is inherently uncertain. There are a variety of factors, many
of which are beyond Merrill Lynch’s control, which affect its operations, performance, business
strategy and results and could cause its actual results and experience to differ materially from
the expectations and objectives expressed in any forward-looking statements. These factors include,
but are not limited to, actions and initiatives taken by both current and potential competitors,
general economic conditions, the effects of current, pending and future legislation, regulation and
regulatory actions, and the other risks and uncertainties detailed in this report. See Risk Factors
that Could Affect Our Business. Accordingly, readers are cautioned not to place undue reliance on
forward-looking statements, which speak only as of the dates on which they are made. Merrill Lynch
does not undertake to update forward-looking statements to reflect the impact of circumstances or
events that arise after the dates they are made. The reader should, however, consult further
disclosures Merrill Lynch may make in future filings of its Annual Report on Form 10-K, Quarterly
Reports on Form 10-Q and Current Reports on Form 8-K.
Available Information
ML & Co. files annual, quarterly and current reports, proxy statements and other information
with the Securities and Exchange Commission (“SEC”). You may read and copy any document we file
with the SEC at the SEC’s Public Reference Room at 100 F Street, NE, Room 1580, Washington, DC
20549. Please call the SEC at 1-800-SEC-0330 for information on the Public Reference Room. The SEC
maintains an internet site that contains annual, quarterly and current reports, proxy and
information statements and other information that issuers (including Merrill Lynch) file
electronically with the SEC. The SEC’s internet site is www.sec.gov.
ML & Co.’s internet address is www.ml.com, and the investor relations section of our website can be
accessed directly at www.ir.ml.com. ML & Co. makes available, free of charge, our proxy statements,
Annual Reports on Form 10-K, Quarterly Reports on Form 10-Q, Current
Reports on Form 8-K and
amendments to those reports filed or furnished pursuant to Section 13(a) or 15(d) of the Securities
Exchange Act of 1934. These reports are available through our website as soon as reasonably
practicable after such reports are electronically filed with, or furnished to, the SEC. Also posted
on our website are corporate governance materials including Merrill Lynch’s Guidelines for Business
Conduct, Code of Ethics for Financial Professionals, Director Independence Standards, Corporate
Governance Guidelines and charters for the committees of our Board of Directors. In addition, our
website includes information on purchases and sales of our equity securities by our executive
officers and directors, as well as disclosures relating to certain non-GAAP financial measures (as
defined in the SEC’s Regulation G) that we may make public orally, telephonically, by webcast, by
broadcast or by similar means from time to time.
We will post on our website amendments to our Guidelines for Business Conduct and Code of Ethics
and any waivers that are required to be disclosed by the rules of either the SEC or the New York
Stock Exchange. The information on Merrill Lynch’s website is not incorporated by reference into
this Report. Shareholders may obtain printed copies of these documents, free of charge, upon
written request to Judith A. Witterschein, Corporate Secretary, Merrill Lynch & Co., Inc., 222
Broadway, 17th Floor, New York, NY 10038 or by email at corporate_secretary@ml.com.
Overview
Merrill Lynch was formed in 1914 and became a publicly traded company on June 23, 1971. In
1973, Merrill Lynch created the holding company, ML & Co., a Delaware corporation that, through its
subsidiaries, provides broker-dealer, investment banking, financing, wealth management, advisory,
asset management, insurance, lending, and related products and services on a global basis.
Merrill Lynch conducts business from various locations throughout the world. Merrill Lynch’s world
headquarters is located in the World Financial Center in New York City, and its other principal
United States business and operational centers are located in New Jersey and Florida. Merrill Lynch
has a presence in 35 countries and territories outside the United States, and its major geographic
regions of operations include the United States; Europe, the Middle East and Africa (“EMEA”); the
Pacific Rim; Canada; and Latin America.
Merrill Lynch’s activities are conducted through three business segments:
| • |
|
Global Markets and Investment Banking Group (“GMI”), Merrill Lynch’s institutional business
segment, provides equity, debt and commodities trading, capital market services, investment banking
and advisory services to corporations, financial institutions, and |
| |
|
governments around the world. GMI’s Global Markets division facilitates client transactions and is
a market maker in securities, derivatives, currencies, commodities and other financial instruments
to satisfy client demands, and in connection with proprietary trading activities. Global Markets
also provides clients with financing, securities clearing, settlement, and custody services and
also engages in principal investments and private equity investing. GMI’s Investment Banking
division provides a wide range of origination and strategic advisory services for issuer clients,
including underwriting and placement of public and private equity, debt and related securities, as
well as lending and other financing activities for clients globally. These services also include
advising clients on strategic issues, valuation, mergers, acquisitions and restructurings. In 2005,
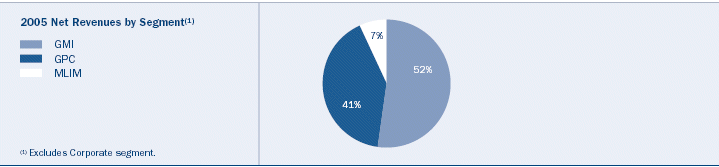
GMI generated 52% of Merrill Lynch’s net revenues and 65% of Merrill Lynch’s pre-tax earnings.
GMI’s growth strategy entails a program of significant investments in personnel and technology to
gain further scale in certain asset classes and geographies. |
| |
| • |
|
Global Private Client (“GPC”), Merrill Lynch’s full-service retail wealth management segment,
provides brokerage, investment advisory and financial planning services, offering a broad range of
both proprietary and third-party wealth management products and services globally to individuals,
small- to mid-size businesses, and employee benefit plans. The largest portion of this business is
offered through the Advisory Division, where services are delivered by Merrill Lynch Financial
Advisors (“FAs”) through a global network of branch offices. GPC’s offerings include commission and
fee-based investment accounts; banking, cash management, and credit services, including consumer
and small business lending and credit cards; trust and generational planning; retirement services;
and insurance products. In 2005, GPC generated 41% of Merrill Lynch’s net revenues and 28% of
Merrill Lynch’s pre-tax earnings. GPC’s growth priorities include the hiring of additional FAs,
client segmentation, annuitization of revenues through fee-based products, diversification of
revenues through adding products and services, investments in technology to enhance productivity
and efficiency, and disciplined expansion into additional geographic areas globally. |
| |
| • |
|
Merrill Lynch Investment Managers (“MLIM”), Merrill Lynch’s asset management segment, offers a
wide range of investment management capabilities to retail and institutional investors through
proprietary and third-party distribution channels globally. Asset management capabilities include
equity, fixed income, money market, index, enhanced index and alternative investments, which are
offered through vehicles such as mutual funds, privately managed accounts, and retail and
institutional separate accounts. In 2005, MLIM generated 7% of Merrill Lynch’s net revenues and
pre-tax earnings. MLIM’s growth priorities include driving strong relative long-term investment
performance and broadening the distribution of its products through multiple channels, while
maintaining discipline on expenses. MLIM is committed to increasing sales in both the proprietary
and non-proprietary channels in the United States, as well as non-U.S. regions. On February 15,
2006, Merrill Lynch entered into an agreement with BlackRock, Inc. (“BlackRock”), to combine the
MLIM business with BlackRock. See Note 2 to the Consolidated Financial Statements for further
information. |
Merrill Lynch also provides a variety of research services on a global basis through its Global
Securities Research and Economics Group. These services are at the core of the value proposition
offered to institutional and individual client sales forces and their customers, and are an
integral component of the product offering in GMI and GPC. This group distributes research focusing
on four main disciplines globally: fundamental equity research, fixed income and equity-linked
research, equity strategy and economic analyses, and wealth management strategy which leverages
macroeconomic and other research views to produce investment ideas. Merrill Lynch consistently
ranks among the leading research providers in the industry, and its analysts and other
professionals in 18 countries cover approximately 2,650 companies.
Merrill Lynch is a Consolidated Supervised Entity (“CSE”) and is subject to group-wide supervision
by the SEC. As such, Merrill Lynch computes allowable capital and allowances thereto; permits the
SEC to examine the books and records of the holding company and any affiliate that does not have a
principal regulator; and has adopted various additional SEC reporting, record-keeping, and
notification requirements. Merrill Lynch is in compliance with applicable CSE standards. Being a
CSE has imposed additional costs, although not material to date, and has introduced new
requirements to monitor capital adequacy. In respect of the European Union (“EU”) Financial
Conglomerates (“or Financial Groups”) Directive, the U.K. Financial Services Authority (“FSA”) has
determined that the SEC undertakes equivalent consolidated supervision for Merrill Lynch.
Risk Factors that Could Affect Our Business
In the course of conducting its business operations, Merrill Lynch could be exposed to a
variety of risks that are inherent to the financial services business. A summary of some of the
significant risks that could affect Merrill Lynch’s financial condition and results of operations
is included below. Some of these risks are managed in accordance with established risk management
policies and procedures, most of which are described in the Risk Management section of the
Management’s Discussion and Analysis.
22
Merrill Lynch 2005 Annual Report
Market Risk
Merrill Lynch’s various businesses may be adversely impacted by global market and economic
conditions that may cause fluctuations in interest rates, exchange rates, equity and commodity
prices and credit spreads.
The financial services industry and the global financial markets are influenced by numerous
unpredictable factors including economic conditions, monetary and fiscal policies, the liquidity of
global markets, availability and cost of capital, international and regional political events, acts
of war or terrorism and investor sentiment. Changes in these factors may result in volatility in
interest rates, exchange rates, equity and commodity prices, and credit spreads. Merrill Lynch has
a large and increasing amount of trading and investment positions, which include proprietary
trading positions in fixed income, currency, commodities and equity securities, as well as in real
estate, private equity and other investments. Merrill Lynch may incur losses as a result of
increased market volatility, as these fluctuations may adversely impact the valuation of its
trading and investment positions. Conversely, a decline in volatility may adversely affect the
results in Merrill Lynch’s trading businesses, which depend on market volatility to create client
and proprietary trading opportunities.
Credit Risk
Merrill Lynch may incur losses from its credit exposure related to trading, lending, and other
business activities.
Merrill Lynch is exposed to the potential for credit-related losses that can occur as a result of
an individual, counterparty or issuer being unable or unwilling to honor its contractual
obligations. These credit exposures exist within lending relationships, commitments, letters of
credit, derivatives, foreign exchange and other transactions. These exposures may arise, for
example, from a decline in the financial condition of a counterparty, from a decrease in the value
of securities of third parties held by Merrill Lynch as collateral, from entering into swap or
other derivative contracts under which counterparties have long-term obligations to make payments
to Merrill Lynch, and from extending credit to clients through loans or other arrangements. An
increase in Merrill Lynch’s credit exposure could have an adverse effect on its business and
profitability if credit losses exceed credit provisions.
Operational Risk
Merrill Lynch may incur losses from inadequate or failed internal processes, people and systems
or from external events.
Merrill Lynch may incur losses arising from its exposure to operational risk. Financial services
firms, including Merrill Lynch, are exposed to the risk of loss resulting from inadequate or failed
internal processes, people and systems or from external events. Such operational risks may include,
for example, exposure to natural or man-made disasters, mistakes made in the confirmation or
settlement of transactions or from improper recording, evaluating or accounting for transactions.
Merrill Lynch could suffer financial loss, disruption of its business, liability to clients,
regulatory intervention or reputational damage, which would affect its business and financial
condition.
Liquidity Risk
Merrill Lynch’s business and financial condition may be adversely impacted by an inability to
borrow funds or sell assets to meet maturing obligations.
Financial services firms, including Merrill Lynch, are exposed to liquidity risk, which is the
potential inability to repay short-term borrowings with new borrowings or assets that can be
quickly converted into cash while meeting other obligations and continuing to operate as a going
concern. Merrill Lynch’s liquidity may be impaired due to circumstances that it may be unable to
control, such as general market disruptions or an operational problem that affects its trading
clients, third parties or itself. Merrill Lynch’s ability to sell assets may also be impaired if
other market participants are seeking to sell similar assets at the same time. The inability of
Merrill Lynch to borrow funds or sell assets to meet maturing obligations, a negative change in its
credit ratings, which would have an adverse effect on its ability to borrow funds, or regulatory
capital restrictions imposed on the free flows of funds between Merrill Lynch and its affiliates
may have a negative effect on its business and financial condition.
Litigation Risk
Legal proceedings could adversely affect Merrill Lynch’s operating results and financial
condition for a particular period and impact its credit ratings.
Merrill Lynch has been named as a defendant in various legal actions, including arbitrations, class
actions, and other litigation arising in connection with its activities as a global diversified
financial services institution. Some of the legal actions against Merrill Lynch include claims for
substantial compensatory and/or punitive damages or claims for indeterminate amounts of damages. In
some cases, the issuers who would otherwise be the primary defendants are bankrupt or otherwise in
financial distress. Given the number of these matters, some are likely to result in adverse
judgments, penalties, injunctions, fines, or other relief. Merrill Lynch is also involved in
investigations and/or proceedings by governmental and self-regulatory agencies. The number of these
investigations has also increased in recent years with regard to many firms, including Merrill
Lynch.
Merrill Lynch may explore potential settlements before a case is taken through trial because of
uncertainty and risks inherent in the litigation process. In accordance with Statement of Financial
Accounting Standards (“SFAS”) No. 5, Accounting for Contingencies, Merrill Lynch will accrue a
liability when it is probable that a liability has been incurred and the amount of the loss can be
reasonably estimated. In many lawsuits and arbitrations, disclosed in Other Information (Unaudited)
— Legal Proceedings, including almost all of the class action lawsuits, it is not possible to
determine whether a liability has been incurred or to estimate the ultimate or minimum amount of
that liability until the case is close to resolution, in which case no accrual is made until that
time. In view of the inherent difficulty of predicting the outcome of such matters, particularly in
cases in which claimants seek substantial or indeterminate damages, Merrill Lynch cannot predict
what the eventual loss or range of loss related to such matters will be, which may be material to
its operating results or cash flows for any particular period and may impact its credit ratings.
Regulatory and Legislative Risks
Many of Merrill Lynch’s businesses are highly regulated and could be adversely impacted by
regulatory and legislative initiatives around the world.
Merrill Lynch’s businesses may be adversely affected by regulatory and legislative initiatives
imposed by various U.S. and non-U.S. regulatory and exchange authorities, such as federal and state
securities regulators including the SEC, the FSA, self-regulatory organizations including The
New York Stock Exchange, Inc. (“NYSE”) and the National Association of Securities Dealers, Inc.
(“NASD”), and industry participants that continue to review and, in many cases, adopt changes to
their established rules and policies. Such changes have occurred in areas such as corporate
governance, anti-money laundering, privacy, research analyst conflicts of interest and
qualifications, practices related to the issuance of securities, mutual fund trading, disclosure
practices and auditor independence.
Competitive Environment
Competitive pressures in the financial services industry in which Merrill Lynch operates could
adversely affect its business and results of operations.
Merrill Lynch competes globally for individual and institutional clients on the basis of price, the
range of products that it offers, the quality of its services, its financial resources, and product
and service innovation. The financial services industry continues to be affected by an intensifying
competitive environment, as demonstrated by the introduction of new technology platforms,
consolidation through mergers, increased competition from new and established industry participants
and diminishing margins in many mature products and services. Merrill Lynch competes with U.S. and
non-U.S. commercial banks and other broker-dealers in brokerage, underwriting, trading, financing
and advisory businesses. For example, the financial services industry in general, including Merrill
Lynch, has experienced intense price competition in brokerage, as the ability to execute trades
electronically, through the internet and through other alternative trading systems has pressured
trading commissions and spreads. Merrill Lynch competes for investment funds with mutual fund
management companies, insurance companies, finance and investment advisory companies, banks, trust
companies and other institutions. Many of Merrill Lynch’s non-U.S. competitors may have competitive
advantages in their home markets. In addition, Merrill Lynch’s business is substantially dependent
on its continuing ability to compete effectively to attract and retain qualified employees,
including successful Financial Advisors, investment bankers, trading professionals and other
revenue-producing or support personnel.
For further information on Risks refer to Note 6 to the Consolidated Financial Statements.
Critical Accounting Policies and Estimates
Use of Estimates
In presenting the Consolidated Financial Statements, management makes estimates regarding:
| • |
|
Valuations of assets and liabilities requiring fair value estimates including: |
| |
• |
|
Trading inventory and investment securities; |
| |
| |
• |
|
Private equity investments; |
| |
| |
• |
|
Loans and allowance for loan losses; |
| • |
|
The outcome of litigation; |
| |
| • |
|
The realization of deferred tax assets and tax reserves; |
| |
| • |
|
Assumptions and cash flow projections used in determining whether variable interest entities
(“VIEs”) should be consolidated and the determination of the qualifying status of special purpose
entities (“QSPEs”); |
| |
| |
|
The carrying amount of goodwill and other intangible assets; |
| |
| • |
|
Valuation of employee stock options; |
24
Merrill Lynch 2005 Annual Report
| • |
|
Insurance reserves and recovery of insurance deferred acquisition costs; and |
| |
| • |
|
Other matters that affect the reported amounts and disclosure of contingencies in the financial
statements. |
Estimates, by their nature, are based on judgment and available information. Therefore, actual
results could differ from those estimates and could have a material impact on the Consolidated
Financial Statements, and it is possible that such changes could occur in the near term. For more
information regarding the specific methodologies used in determining estimates, refer to Use of
Estimates in Note 1 to the Consolidated Financial Statements.
The following is a summary of Merrill Lynch’s critical accounting policies and estimates.
Valuation of Financial Instruments
Proper valuation of financial instruments is a critical component of Merrill Lynch’s financial
statement preparation. Fair values for exchange-traded securities and certain exchange-traded
derivatives, principally futures and certain options, are based on quoted market prices. Fair
values for over-the-counter (“OTC”) derivative financial instruments, principally forwards,
options, and swaps, represent amounts estimated to be received from or paid to a third party in
settlement of these instruments. These derivatives are valued using pricing models based on the net
present value of estimated future cash flows, and directly observed prices from exchange-traded
derivatives, other OTC trades, or external pricing services, while taking into account the
counterparty’s credit ratings, or Merrill Lynch’s own credit ratings as appropriate.
New and/or complex instruments may have immature or limited markets. As a result, the pricing
models used for valuation often incorporate significant estimates and assumptions, which may impact
the level of precision in the Consolidated Financial Statements. For long-dated and illiquid
contracts, extrapolation methods are applied to observed market data in order to estimate inputs
and assumptions that are not directly observable. This enables Merrill Lynch to mark-to-market all
positions consistently when only a subset of prices is directly observable. Values for OTC
derivatives are verified using observed information about the costs of hedging the risk and other
trades in the market. As the markets for these products develop, Merrill Lynch continually refines
its pricing models based on experience to correlate more closely to the market risk of these
instruments. Obtaining the fair value for OTC derivative contracts requires the use of management
judgment and estimates. At the inception of the contract, unrealized gains for these instruments
are not recognized unless significant inputs to the valuation model are observable in the market.
Merrill Lynch holds investments that may have quoted market prices but that are subject to
restrictions (e.g., consent of the issuer or other investors to sell) that may limit Merrill
Lynch’s ability to realize the quoted market price. Accordingly, Merrill Lynch estimates the fair
value of these securities based on management’s best estimate, which incorporates pricing models
based on projected cash flows, earnings multiples, comparisons based on similar market transactions
and/or review of underlying financial conditions and other market factors.
Valuation adjustments are an integral component of the mark-to-market process and may be taken
where either the sheer size of the trade or other specific features of the trade or particular
market (such as counterparty credit quality, concentration or market liquidity) requires adjustment
to the values derived by the pricing models.
Because valuation may involve significant estimation where readily observable prices are not
available, a categorization of Merrill Lynch’s financial instruments based on liquidity of the
instrument and the amount of estimation required in determining its value as recorded in the
Consolidated Financial Statements is provided below. In preparing the categorization, certain
estimates have been made regarding the allocation of netting adjustments permitted under FASB
Interpretation No. (“FIN”) 39, Offsetting of Amounts Related to Certain Contracts, and other
adjustments.
Assets and liabilities recorded on the Consolidated Balance Sheets can be broadly categorized as
follows:
Category 1. Highly liquid cash and derivative instruments, primarily carried at fair value, for
which quoted market prices are readily available (for example, exchange-traded equity securities,
certain listed options, and U.S. Government securities).
Category 2. Liquid instruments, primarily carried at fair value, including:
| |
a) |
|
Cash instruments for which quoted prices are available but which trade less frequently such that
there may not be complete pricing transparency for these instruments across all market cycles (for
example, corporate and municipal bonds and certain physical commodities); |
| |
| |
b) |
|
Derivative instruments that are valued using a model, where inputs to the model are directly
observable in the market (for example, U.S. dollar interest rate swaps); and |
| |
| |
c) |
|
Instruments that are priced with reference to financial instruments whose parameters can be
directly observed (for example, certain trading loans). |
Category 3. Less liquid instruments that are valued using management’s best estimate of fair value,
and instruments which are valued using a model, where either the inputs to the model and/or the
models themselves require significant judgment by management (for example, private equity
investments, long-dated or complex derivatives such as certain foreign exchange options and credit
default swaps, distressed debt and commodity derivatives, such as long-dated options on gas and
power and weather derivatives).
At December 30, 2005 and December 31, 2004, certain assets and liabilities on the Consolidated
Balance Sheets can be categorized using the above classification scheme as follows:
| |
|
|
|
|
|
|
|
|
|
|
|
|
|
|
|
|
| (dollars in millions) |
|
|
|
|
|
|
|
|
|
|
|
|
| 2005 |
|
Category 1 |
|
|
Category 2 |
|
|
Category 3 |
|
|
Total |
|
| |
Assets |
|
|
|
|
|
|
|
|
|
|
|
|
|
|
|
|
Trading assets, excluding contractual agreements |
|
$ |
56,556 |
|
|
$ |
63,344 |
|
|
$ |
2,594 |
|
|
$ |
122,494 |
|
Contractual agreements |
|
|
5,008 |
|
|
|
18,177 |
|
|
|
3,031 |
|
|
|
26,216 |
|
Investment securities |
|
|
6,115 |
|
|
|
54,805 |
|
|
|
8,353 |
|
|
|
69,273 |
|
Liabilities |
|
|
|
|
|
|
|
|
|
|
|
|
|
|
|
|
Trading liabilities, excluding contractual agreements |
|
$ |
48,688 |
|
|
$ |
11,248 |
|
|
$ |
242 |
|
|
$ |
60,178 |
|
Contractual agreements |
|
|
4,623 |
|
|
|
17,490 |
|
|
|
6,642 |
|
|
|
28,755 |
|
| |
2004 |
|
|
|
|
|
|
|
|
|
|
|
|
|
|
|
|
| |
Assets |
|
|
|
|
|
|
|
|
|
|
|
|
|
|
|
|
Trading assets, excluding contractual agreements |
|
$ |
72,272 |
|
|
$ |
63,714 |
|
|
$ |
2,716 |
|
|
$ |
138,702 |
|
Contractual agreements |
|
|
5,240 |
|
|
|
27,137 |
|
|
|
3,498 |
|
|
|
35,875 |
|
Investment securities |
|
|
7,868 |
|
|
|
64,142 |
|
|
|
6,450 |
|
|
|
78,460 |
|
Liabilities |
|
|
|
|
|
|
|
|
|
|
|
|
|
|
|
|
Trading liabilities, excluding contractual agreements |
|
$ |
51,763 |
|
|
$ |
10,827 |
|
|
$ |
1,269 |
|
|
$ |
63,859 |
|
Contractual agreements |
|
|
5,090 |
|
|
|
26,387 |
|
|
|
4,257 |
|
|
|
35,734 |
|
| |
In addition, other trading-related assets recorded in the Consolidated Balance Sheets at
year-end 2005 and 2004 include $255.5 billion and $173.4 billion, respectively, of receivables
under resale agreements and receivables under securities borrowed transactions. Trading-related
liabilities recorded in the Consolidated Balance Sheets at year-end 2005 and 2004 include $217.5
billion and $176.1 billion, respectively, of payables under repurchase agreements and payables
under securities loaned transactions. These securities financing transactions are recorded at their
contractual amounts, which approximate fair value, and for which little or no estimation is
required by management.
Litigation
Merrill Lynch has been named as a defendant in various legal actions, including arbitrations,
class actions, and other litigation arising in connection with its activities as a global
diversified financial services institution. Merrill Lynch is also involved in investigations and/or
proceedings by governmental and self-regulatory agencies. In accordance with SFAS No. 5, Accounting
for Contingencies, Merrill Lynch will accrue a liability when it is probable that a liability has
been incurred and the amount of the loss can be reasonably estimated. In many lawsuits and
arbitrations, including class action lawsuits, it is not possible to determine whether a liability
has been incurred or to estimate the ultimate or minimum amount of that liability until the case is
close to resolution, in which case no accrual is made until that time. In view of the inherent
difficulty of predicting the outcome of such matters, particularly in cases in which claimants seek
substantial or indeterminate damages, Merrill Lynch cannot predict what the eventual loss or range
of loss related to such matters will be. See Note 12 to the Consolidated Financial Statements and
Other Information (Unaudited) – Legal Proceedings for further information.
Variable Interest Entities
In the normal course of business, Merrill Lynch enters into a variety of transactions with
VIEs. The applicable accounting guidance requires Merrill Lynch to perform a qualitative and/or
quantitative analysis of each new VIE at inception to determine whether it is the primary
beneficiary of the VIE and therefore must consolidate the VIE. In performing this analysis, Merrill
Lynch makes assumptions regarding future performance of assets held by the VIE, taking into account
estimates of credit risk, estimates of the fair value of assets, timing of cash flows, and other
significant factors. Although a VIE’s actual results may differ from projected outcomes, a revised
consolidation analysis is generally not required subsequent to the initial assessment. If a VIE
meets the conditions to be considered a QSPE, it is typically not required to be consolidated by
Merrill Lynch. A QSPE’s activities must be significantly limited. A servicer of the assets held by
a QSPE may have discretion in restructuring or working out assets held by the QSPE as long as the
discretion is significantly limited and the parameters of that discretion are fully described in
the legal documents that established the QSPE. Determining whether the activities of a QSPE and its
servicer meet these conditions requires the use of judgment by management.
26
Merrill Lynch 2005 Annual Report
Income Taxes
Merrill Lynch is under examination by the Internal Revenue Service (“IRS”) and other tax
authorities in major countries such as Japan and the United Kingdom, and states in which Merrill
Lynch has significant business operations, such as New York. The tax years under examination vary
by jurisdiction. An IRS examination covering the years 2001-2003 is expected to be completed in
2006. There are carryback claims from these years of approximately $250 million
to $300 million, which will undergo Joint Committee review. A tax benefit would be
recorded to the extent that Merrill Lynch is successful in obtaining the tax benefit from these
carryback claims. IRS audits have also commenced for the 2004 and 2005 tax years. In the second
quarter of 2005, Merrill Lynch paid a tax assessment from the Tokyo Regional Tax Bureau for the
years 1998-2002. The assessment reflected the Japanese tax authority’s view that certain income on
which Merrill Lynch previously paid income tax to other international jurisdictions, primarily the
United States, should have been allocated to Japan. Merrill Lynch is taking steps to file a request
for reinvestigation of this assessment, including seeking clarification from international
authorities on the appropriate allocation of income among multiple jurisdictions to prevent double
taxation. Merrill Lynch regularly assesses the likelihood of additional assessments in each of the
tax jurisdictions resulting from these examinations. Tax reserves have been established, which
Merrill Lynch believes to be adequate in relation to the potential for additional assessments.
However, there is a reasonable possibility that additional amounts may be incurred. The estimated
additional possible amounts are no more than $150 million. Merrill Lynch will adjust the level of
reserves when there is more information available, or when an event occurs requiring a change to
the reserves. The reassessment of tax reserves could have a material impact on Merrill Lynch’s
effective tax rate in the period in which it occurs.
Business Environment(1)
Global financial market conditions improved during 2005, despite rising U.S. short-term
interest rates and energy prices. Non-U.S. stock markets outperformed those of the United States.
The U.S. dollar strengthened against most major currencies, hitting two-year highs against the euro
and the yen. Fixed income markets remained active, and the yield curve flattened throughout the
year, at times becoming inverted. Long-term interest rates, as measured by the yield on the 10-year
U.S. Treasury bond, began 2005 at 4.22% and moved as low as 3.89% by mid-year, only to rebound and
end the year at 4.39%. The U.S. Federal Reserve System’s Federal Open Market Committee raised the
federal funds rate eight times during the year from 2.25% to 4.25%.
In 2005, U.S. equity markets did not perform as well as the rest of the world. Major U.S. equity
indices declined during the first half of the year but recovered this decline during the second
half of 2005. The Dow Jones Industrial Average ended the year essentially unchanged from 2004. Both
the Standard & Poor’s 500 Index and the Nasdaq Composite Index finished the year with modest gains
of 3% and 1%, respectively.
Global equity indices rallied in the latter part of the year, primarily due to strong economic
growth and rising corporate profits. The Dow Jones World Index, excluding the United States, rose
14% during the year. European stocks performed particularly well in 2005 as the Dow Jones Stoxx 50
index and the FTSE 100 index rose 21% and 17%, respectively. As a result of surging oil prices, the
best performances in Western Europe were those of Norway and Austria, as Norway’s OSE All Share
index and Austria’s ATX index grew 52% and 51%, respectively. In Eastern Europe, Russia’s benchmark
index rose 63% also due to escalating oil and gas prices. Japan’s economic recovery led to a 40%
rise in the Nikkei Stock Average, making it one of the top-performing markets. The Dow Jones
Asia-Pacific index rose 22% led by South Korea, India and Japan. Emerging markets maintained their
strong performances as Brazil’s Bovespa Index rose 28% and Mexico’s Bolsa Index rose 38% for the
year.
U.S. Equity trading volumes for 2005 were generally higher than 2004. On the NYSE both the dollar
volume of shares and the number of shares increased compared to the prior year. On the Nasdaq, the
dollar volume of shares rose, while the number of shares declined compared to 2004. U.S. equity
market volatility declined compared to prior year levels as measured by the VIX and QQV volatility
indices.
In 2005, global debt and equity underwriting volumes increased to $6.5 trillion, up 13% for the
year. Despite the rise in short-term interest rates during the year, debt issuances increased by
14% to $6.0 trillion. Global debt underwriting fees were $5.0 billion, down 23% from year-ago
levels, while global equity underwriting fees declined by 7% to $8.8 billion. The value of Global
Initial Public Offerings (“IPOs”) increased by 18% as non-U.S. regions outperformed the United
States.
Global merger and acquisition activity increased significantly with the total value of announced
deals rising 39% to $2.7 trillion, making 2005 the most active year since 2000. In the United
States, the value of announced deals rose 33% to $1.1 trillion for the year. The total value of
global completed merger and acquisition activity was $2.2 trillion, 35% higher than 2004. In the
United States, the value of completed deals rose 14% to $887 billion.
Merrill Lynch continually evaluates its businesses for profitability, performance, and client
service to ensure alignment with its long-term strategic objectives under varying market and
competitive conditions. The strategy of maintaining long-term client relationships, closely
monitoring costs and risks, diversifying revenue sources, and growing fee-based and recurring
revenues all continue as objectives to mitigate the effects of a volatile market environment on
Merrill Lynch’s business as a whole.
(1) Debt and equity underwriting and merger and acquisition statistics were obtained from
Thomson Financial Securities Data.
Results of Operations
| |
|
|
|
|
|
|
|
|
|
|
|
|
| (dollars in millions, except per share amounts) |
|
2005 |
|
|
2004 |
|
|
2003 |
|
| |
Net revenues |
|
|
|
|
|
|
|
|
|
|
|
|
Asset management and portfolio service fees |
|
$ |
6,031 |
|
|
$ |
5,440 |
|
|
$ |
4,698 |
|
Commissions |
|
|
5,371 |
|
|
|
4,874 |
|
|
|
4,299 |
|
Investment banking |
|
|
3,594 |
|
|
|
3,268 |
|
|
|
2,643 |
|
Principal transactions |
|
|
3,583 |
|
|
|
2,248 |
|
|
|
3,065 |
|
Revenues from consolidated investments |
|
|
438 |
|
|
|
346 |
|
|
|
70 |
|
Other |
|
|
2,195 |
|
|
|
1,454 |
|
|
|
1,492 |
|
| |
|
|
Subtotal |
|
|
21,212 |
|
|
|
17,630 |
|
|
|
16,267 |
|
Interest and dividend revenues |
|
|
26,571 |
|
|
|
14,989 |
|
|
|
11,657 |
|
Less interest expense |
|
|
21,774 |
|
|
|
10,560 |
|
|
|
8,024 |
|
| |
|
|
Net interest profit |
|
|
4,797 |
|
|
|
4,429 |
|
|
|
3,633 |
|
| |
|
|
Total net revenues |
|
|
26,009 |
|
|
|
22,059 |
|
|
|
19,900 |
|
| |
|
|
Non-interest expenses |
|
|
|
|
|
|
|
|
|
|
|
|
Compensation and benefits |
|
|
12,441 |
|
|
|
10,663 |
|
|
|
9,886 |
|
Communications and technology |
|
|
1,608 |
|
|
|
1,461 |
|
|
|
1,457 |
|
Occupancy and related depreciation |
|
|
938 |
|
|
|
893 |
|
|
|
889 |
|
Brokerage, clearing, and exchange fees |
|
|
842 |
|
|
|
773 |
|
|
|
676 |
|
Professional fees |
|
|
727 |
|
|
|
715 |
|
|
|
598 |
|
Advertising and market development |
|
|
599 |
|
|
|
533 |
|
|
|
429 |
|
Expenses of consolidated investments |
|
|
258 |
|
|
|
231 |
|
|
|
68 |
|
Office supplies and postage |
|
|
210 |
|
|
|
203 |
|
|
|
197 |
|
Other |
|
|
1,155 |
|
|
|
751 |
|
|
|
627 |
|
Net recoveries related to September 11 |
|
|
– |
|
|
|
– |
|
|
|
(147 |
) |
| |
|
|
Total non-interest expenses |
|
|
18,778 |
|
|
|
16,223 |
|
|
|
14,680 |
|
| |
|
|
Earnings before income taxes |
|
$ |
7,231 |
|
|
$ |
5,836 |
|
|
$ |
5,220 |
|
| |
|
|
Net earnings |
|
$ |
5,116 |
|
|
$ |
4,436 |
|
|
$ |
3,836 |
|
| |
|
|
Earnings per common share |
|
|
|
|
|
|
|
|
|
|
|
|
Basic |
|
$ |
5.66 |
|
|
$ |
4.81 |
|
|
$ |
4.22 |
|
Diluted |
|
|
5.16 |
|
|
|
4.38 |
|
|
|
3.87 |
|
| |
|
|
Return on average common stockholders’ equity |
|
|
16.0 |
% |
|
|
14.9 |
% |
|
|
14.8 |
% |
| |
|
|
Pre-tax profit margin |
|
|
27.8 |
% |
|
|
26.5 |
% |
|
|
26.2 |
% |
| |
|
|
Compensation and benefits as a percentage of net revenues |
|
|
47.8 |
% |
|
|
48.3 |
% |
|
|
49.7 |
% |
Non-compensation expenses as a percentage of net revenues |
|
|
24.4 |
% |
|
|
25.2 |
% |
|
|
24.1 |
% |
Book value per share |
|
$ |
35.82 |
|
|
$ |
32.99 |
|
|
$ |
29.96 |
|
| |
Consolidated Results of Operations
Merrill Lynch’s net earnings per diluted share were a record $5.16 in 2005 compared to $4.38 in
2004. Net earnings were a record $5.1 billion in 2005, up 15% from 2004 on net revenues of $26.0
billion, which increased 18% from 2004. Net earnings in 2004 were $4.4 billion, up 16% from $3.8
billion in 2003. Net earnings in 2003 included $91 million of after-tax September 11-related net
insurance recoveries ($147 million pre-tax) and after-tax net benefits from restructuring and other
charges of $3 million ($20 million of pre-tax expense). The 2005 results reflect the impact of a
litigation-related subsequent event as described in Note 2 to the Consolidated Financial
Statements.
In 2005, the return on average common stockholders’ equity was 16.0%, and the pre-tax profit margin
was a record 27.8%. In 2004, the return on average common stockholders’ equity was 14.9%, and the
pre-tax profit margin was 26.5%. In 2003, the return on average common stockholders’ equity was
14.8%, and the pre-tax profit margin was 26.2%.
28
Merrill Lynch 2005 Annual Report
The following chart illustrates the composition of net revenues by category in 2005:
Asset management and portfolio service fees primarily consist of (i) fees earned from the
management and administration of retail mutual funds and separately managed accounts for retail
investors, as well as institutional funds such as pension assets, (ii) performance fees earned on
certain separately managed accounts and institutional money management arrangements, (iii)
servicing fees related to these accounts and (iv) annual account fees and certain other
account-related fees. Asset management and portfolio service fees were $6.0 billion, up 11% from
2004. The increase in portfolio service fees reflects the impact of net inflows into asset-priced
accounts, and the increase in asset management fees reflects the impact of net inflows of
higher-yielding assets as well as higher equity market values.
Commissions revenues primarily arise from agency transactions in listed and OTC equity securities
and commodities, insurance products and options. Commissions revenues also include distribution
fees for promoting and distributing mutual funds (“12b-1 fees”), as well as contingent deferred
sales charges earned when a shareholder redeems shares prior to the required holding period.
Commissions revenues were $5.4 billion, up 10% from 2004, due primarily to a global increase in
client transaction volumes, particularly in listed equities and mutual funds.
Principal transactions revenues include realized gains and losses from the purchase and sale of
securities, such as equity securities, fixed income securities, including government bonds and
municipal securities, in which Merrill Lynch acts as principal, as well as unrealized gains and
losses on trading assets and liabilities, including commodities, derivatives, and loans. Principal
transactions revenues were $3.6 billion, 59% higher than a year ago, due primarily to increased
revenues from trading of debt and equity products, as well as the addition of the commodities
business, which was acquired in November 2004.
Net interest profit is a function of (i) the level and mix of total assets and liabilities,
including trading assets owned, deposits, financing and lending transactions and trading strategies
associated with the institutional securities business, and (ii) the prevailing level, term
structure and volatility of interest rates. Net interest profit is an integral component of trading
activity. Net interest profit was $4.8 billion, up 8% from 2004, due primarily to the impact of
rising short-term interest rates on deposit spreads earned.
Investment banking revenues include (i) origination revenues representing fees earned from the
underwriting of debt, equity and equity-linked securities, as well as loan syndication and
commitment fees and (ii) strategic advisory services revenues including merger and acquisition and
other investment banking advisory fees. Investment banking revenues were $3.6 billion, up 10% from
2004, driven primarily by increased merger and acquisition advisory revenues as well as higher debt
origination fees.
Revenues from consolidated investments include revenues from consolidated investments which are
less than 100% owned. Revenues from consolidated investments were $438 million, up from $346
million in 2004, reflecting higher investment gains.
Other revenues include realized investment gains and losses, equity income from unconsolidated
subsidiaries, distributions on cost method investments, fair value adjustments on private equity
investments made by non-broker-dealer subsidiaries that are held for capital appreciation and/or
current income, gains related to the sale of mortgages, write-downs of certain available-for-sale
securities, and translation gains and losses on foreign denominated assets and liabilities. Other
revenues were $2.2 billion in 2005, up from $1.5 billion in 2004 due primarily to revenues of $541
million in the principal investing and private equity businesses. This amount excludes revenues
from consolidated investments. These revenues included fair value adjustments resulting from the
recapitalization of equity investments and the sale through an IPO of an equity investment. These
revenues were partially offset by lower gains on the sales of mortgages as compared to a year ago.
Net revenues in 2004 were $22.1 billion, 11% higher than in 2003. Asset management and portfolio
service fees in 2004 were $5.4 billion, up 16%, due primarily to higher portfolio service fees
arising from higher average equity market values in 2004, increased investment and fund management
fees and an increased proportion of higher yielding assets. Commission revenues in 2004 were $4.9
billion, up 13% due primarily to a global increase in client transaction volumes, particularly in
listed equities and mutual funds. Principal transactions revenues in 2004 decreased 27%, to $2.2
billion, due to significantly lower debt and debt derivatives trading revenues as compared to 2003,
which benefited from a more favorable interest rate and credit environment. Net interest profit in
2004 was $4.4 billion, up 22% due primarily to increased secured lending activity and increases in
short-term interest rates, partially offset by increased credit provisions related to small- and
middle-market lending in GPC. Investment banking revenues of $3.3 billion in 2004 increased 24%
from 2003 due to increased transaction volumes as market conditions improved. Revenues from
consolidated investments were $346 million, up from $70 million in 2003 reflecting the full-year
impact of entities consolidated in late 2003, as well as the impact of entities consolidated in
2004.
Compensation and benefits expenses were $12.4 billion in 2005, up 17% from a year-ago, reflecting
higher incentive compensation accruals associated with increased net revenues, as well as higher
staffing levels. Compensation and benefits expenses were 47.8% of net revenues for 2005, as
compared to 48.3% a year ago. The compensation ratio depends on the absolute level of net revenues,
the business mix underlying those revenues and industry compensation trends.
Non-compensation expenses were $6.3 billion in 2005, up 14% from 2004. Communications and
technology costs were $1.6 billion, up 10%, due primarily to higher system consulting costs related
to investments for growth, including acquisitions, and higher market information and communications
costs. Advertising and market development expenses were $599 million, up 12% from 2004, due
primarily to higher travel expenses associated with increased activity levels and increased sales
promotion and advertising costs. Other expenses were $1,155 million, up from $751 million in 2004,
primarily reflecting higher litigation provisions.
Compensation and benefits expenses were $10.7 billion in 2004, an increase of 8% from 2003. The
increase was due primarily to higher incentive compensation expenses resulting from increased net
revenues and increased staffing levels. Compensation and benefits expenses were 48.3% of net
revenues in 2004, compared to 49.7% of net revenues in 2003.
Non-compensation expenses were $5.6 billion in 2004, 16% higher than 2003. Brokerage, clearing and
exchange fees were $773 million in 2004, up 14% from 2003 due in part to the acquisition of a
clearing business. Professional fees were $715 million in 2004, up 20% from 2003, due principally
to higher legal, consulting and recruiting fees. Advertising and market development expenses were
$533 million, up 24% from 2003, due primarily to increased travel expenses, sales promotion costs
and deal-related expenses. Expenses of consolidated investments were $231 million, up from $68
million in 2003, reflecting the full-year impact of entities consolidated in late 2003 and entities
consolidated in 2004. Other expenses were $751 million in 2004, up 20% from 2003, principally due
to higher litigation provisions.
Income Taxes
Merrill Lynch’s 2005 income tax provision was $2.1 billion, representing a 29.2% effective tax
rate compared with 24.0% in 2004. The 2005 effective tax rate increased from the prior year
reflecting the net impact of the business mix, tax settlements, and the $97 million of tax expense
($113 million of tax expense recorded in the fourth quarter, less a $16 million tax benefit
recorded in the second quarter) associated with the foreign earnings repatriation of $1.8 billion.
The 2004 effective tax rate decreased from the 2003 rate of 26.5% and reflected the mix of U.S. and
foreign-sourced income, and utilization and the reversal of the $281 million Japanese valuation
allowance, primarily related to the Japan private client business that was restructured in 2001.
Deferred tax assets and liabilities are recorded for the effects of temporary differences between
the tax basis of an asset or liability and its reported amount in the Consolidated Financial
Statements. Merrill Lynch assesses its ability to realize deferred tax assets within each
jurisdiction, primarily based on a strong earnings history and other factors as discussed in SFAS
No. 109, Accounting for Income Taxes. During the last 10 years, average annual pre-tax earnings
were $3.7 billion. Accordingly, management believes that it is more likely than not that remaining
deferred tax assets, net of the remaining related valuation allowance, will be realized. See Note
15 to the Consolidated Financial Statements for further information.
Business Segments
The following discussion provides details of the operating performance for each of Merrill
Lynch’s three business segments, as well as details of products and services offered. The
discussion also includes details of net revenues by segment. Certain prior year amounts have been
reclassified to conform to the current year presentation.
30
Merrill Lynch 2005 Annual Report
Merrill Lynch reports its results in three business segments: GMI, GPC, and MLIM. GMI provides
full service global markets and origination capabilities, products and services to corporate,
institutional, and government clients around the world. GPC provides wealth management products and
services globally to individuals, small- to mid-size businesses, and employee benefit plans. MLIM
manages financial assets for individual, institutional and corporate clients.
Certain MLIM and GMI products are distributed through GPC distribution channels, and, to a lesser
extent, certain MLIM products are distributed through GMI. Revenues and expenses associated with
these inter-segment activities are recognized in each segment and eliminated at the corporate
level. In addition, revenue and expense sharing agreements for joint activities between segments
are in place, and the results of each segment reflect the agreed-upon apportionment of revenues and
expenses associated with these activities. The following segment results represent the information
that is relied upon by management in its decision-making processes. These results exclude items
reported in the Corporate segment. Business segment results are reclassified to reflect
reallocations of revenues and expenses that result from changes in Merrill Lynch’s business
strategy and organizational structure. See Note 3 to the Consolidated Financial Statements for
further information.
Global Markets and Investment Banking
GMI provides equity, debt and commodities trading, capital markets services, investment banking and
advisory services to issuer and investor clients around the world. The Global Markets division
combines the debt, equity and commodities sales and trading activities for investor clients, while
the Investment Banking division provides a wide range of origination and strategic advisory
services for issuer clients. Global Markets makes a market in securities, derivatives, currencies,
and other financial instruments to satisfy client demands, and in connection with proprietary
trading activities. Global Markets is a leader in the global distribution of fixed income, currency
and energy commodity products and derivatives. Global Markets has one of the largest equity trading
operations in the world and is a leader in the origination and distribution of equity and related
products. Further, Global Markets provides clients with financing, securities clearing, settlement,
and custody services and also engages in principal investments and private equity investing.
Investment Banking raises capital for its clients through underwritings and private placements of
equity, debt and related securities, and loan syndications. Investment Banking also offers advisory
services to clients on strategic issues, valuation, mergers, acquisitions and restructurings.
Global Markets
Global Markets revenues are reported in two major categories, Debt Markets and Equity Markets,
based on asset class. Global Markets’ business lines include the following:
Debt Markets
| • |
|
Global Credit, Real Estate and Structured Products Group – responsible on a global basis for
asset-based lending, securitization and secured commercial real estate lending, collateralized
mortgage obligations and asset-backed securities trading, and securitizations related to these
transactions, as well as equity investments in real estate and other secured assets; and credit
trading of money market instruments, investment grade debt, credit derivatives, structured credit
products, syndicated loans, high-yield debt, distressed debt, and emerging markets debt; |
| |
| • |
|
Global Rates and Foreign Exchange Group – responsible on a global basis for sales and trading
activities for interest rate derivatives, currency, complex options, United States government and
other Federal agency securities, obligations of other sovereigns, municipal securities,
pass-through mortgage obligations trading, and debt financial futures and options; |
| |
| • |
|
Global Commodities Group – responsible for energy and weather risk management, as well as
marketing and trading of natural gas, power, oil, coal and other energy related products on a
global basis; and |
| |
| • |
|
Debt Markets Strategic Risk Trading and Global Hybrid Exotics – responsible for strategic risk
trading in Global Debt Markets, with a primary focus on interest rate and foreign exchange trading.
This group is also focused on hybrid exotic capabilities, including structured product trading
across all asset classes. |
Equity Markets
| • |
|
Global Equity Trading Group – responsible for cash equity trading and trading activities in
equity-linked derivatives, exchange-traded options, convertibles and financial futures on a global
basis; also includes equity financing and services, including prime brokerage, stock loan, money
manager services and clearing, settlement and custody functions; and |
| |
| • |
|
Global Private Equity – manages assets primarily for its own account and for that of certain
investment partnerships of Merrill Lynch employees. |
Investment Banking
GMI’s Global Investment Banking structure includes the following businesses:
| • |
|
Country/Sector Coverage – responsible for all origination and advisory activities, across
countries and sectors, on behalf of issuer clients; |
| |
| • |
|
Corporate Finance – responsible for structured product capabilities, financial product
development and commodities origination; |
| |
| • |
|
Equity Capital Markets – responsible for all capital related activities for issuer clients
generated in the equity markets, including convertibles and equity derivative products; |
| |
| • |
|
Debt Capital Markets – responsible for all capital related activities for issuer clients
generated in the high grade debt markets including derivative products, liability management,
private placements, money markets, and structured transactions; |
| |
| • |
|
Leveraged Finance – responsible for all financing activities for non-investment grade issuer
clients, including high yield bond and syndicated loans; |
| |
| • |
|
Mergers and Acquisitions – responsible for advising corporate clients regarding strategic
alternatives, divestitures, mergers and acquisition activities; and |
| |
| • |
|
Executive Client Coverage Group – senior client relationship managers who focus exclusively on
strengthening relationships and maximizing opportunities with key clients. |
2005 Developments
GMI’s 2005 results included increased contributions from key areas of investment such as
commodities, equity derivatives, principal investing, private equity, prime brokerage and
investment banking coverage.
During 2005, GMI made key hires and substantial investments in technology to expand its trading
capabilities and capitalize on opportunities and add to client revenue streams. GMI experienced
solid revenue growth from these activities in 2005 and expects additional growth in 2006.
Significant investments have also been made in the principal investing and private equity
businesses, pursuant to which GMI both advises and invests alongside its clients. Investments have
also been made to expand the technology infrastructure in prime brokerage and portfolio trading,
which led to a greater share of the NYSE program trading volume in 2005. During the year, the
commodity business expanded its scope by beginning to trade oil and coal, and commenced trading in
Asia. In 2006, GMI will continue to execute to realize the potential on the investments made. In
2006, GMI plans to continue to broaden the scope of the commodities business in terms of product,
geography, and linkage to the broader client franchise. In 2006, GMI also plans to focus on
expanding its structured product capabilities to meet the needs of investors and for distribution
through both proprietary and third-party retail channels globally. Additionally, GMI will continue
to invest in mortgage finance and trading, municipals, prime brokerage and portfolio trading. GMI
also will continue to focus on building its presence outside of the United States, especially in
emerging markets where there is strong potential for future growth.
GMI completed the acquisition of the Chicago-based options, stock and futures clearing firm, Pax
Clearing Corporation (“Pax Clearing”) in 2005. This transaction augmented the equity financing and
services business and enhanced the quality of service provided to clients. GMI also fully
integrated the 2004 purchase of an energy trading business. As a result, Merrill Lynch is now
ranked as one of the top firms for trading and marketing natural gas and electric power. These
investments have resulted in growth in the number of GMI employees in 2005, bringing in new
expertise and adding scale in the asset classes and geographies targeted for growth.
In the fourth quarter of 2005, Merrill Lynch announced that it is increasing its stake in the joint
venture, DSP Merrill Lynch, India’s leading investment bank, to further expand the capabilities of
that platform and capitalize on the opportunities in that market. In addition, Merrill Lynch has
taken steps towards establishing a joint venture with a domestic securities firm in China that will
allow Merrill Lynch to participate in the ongoing development of the Chinese capital markets.
32
Merrill Lynch 2005 Annual Report
GMI’s Results of Operations
| |
|
|
|
|
|
|
|
|
|
|
|
|
| (dollars in millions) |
|
2005 |
|
|
2004 |
|
|
2003 |
|
| |
Global Markets |
|
|
|
|
|
|
|
|
|
|
|
|
Debt |
|
$ |
6,324 |
|
|
$ |
5,213 |
|
|
$ |
5,051 |
|
Equity |
|
|
4,381 |
|
|
|
3,036 |
|
|
|
2,845 |
|
| |
|
|
Total Global Markets net revenues |
|
|
10,705 |
|
|
|
8,249 |
|
|
|
7,896 |
|
| |
|
|
Investment banking |
|
|
|
|
|
|
|
|
|
|
|
|
Origination |
|
|
|
|
|
|
|
|
|
|
|
|
Debt |
|
|
1,330 |
|
|
|
1,135 |
|
|
|
846 |
|
Equity |
|
|
952 |
|
|
|
1,001 |
|
|
|
715 |
|
Strategic Advisory Services |
|
|
882 |
|
|
|
678 |
|
|
|
560 |
|
| |
|
|
Total Investment Banking net revenues |
|
|
3,164 |
|
|
|
2,814 |
|
|
|
2,121 |
|
| |
|
|
Total net revenues |
|
|
13,869 |
|
|
|
11,063 |
|
|
|
10,017 |
|
| |
|
|
Non-interest expenses |
|
|
8,841 |
|
|
|
7,194 |
|
|
|
6,246 |
|
| |
|
|
Pre-tax earnings |
|
$ |
5,028 |
|
|
$ |
3,869 |
|
|
$ |
3,771 |
|
| |
|
|
Pre-tax profit margin |
|
|
36.3 |
% |
|
|
35.0 |
% |
|
|
37.6 |
% |
Total full-time employees |
|
|
13,400 |
|
|
|
12,000 |
|
|
|
10,300 |
|
| |
GMI’s 2005 net revenues were $13.9 billion, up 25% from the prior year, and pre-tax earnings
increased 30% from 2004 to $5.0 billion. GMI’s pre-tax profit margin was 36.3%, up from 35.0% in
the prior year. GMI’s growth in net revenues and pre-tax earnings were a result of increased
revenues in all three of GMI’s major business lines – Debt Markets, Equity Markets and Investment
Banking. Geographically, Europe contributed the most to the increases in net revenues and pre-tax
earnings.
In 2004, GMI’s pre-tax earnings were $3.9 billion, 3% higher than in 2003, on net revenues that
increased 10%, to $11.1 billion. During 2003, GMI recognized $155 million in September 11-related
business interruption insurance recoveries for forgone pre-tax profits. These insurance
reimbursements were recorded as reductions of non-interest expenses. GMI’s increased net revenues
and pre-tax earnings in 2004 were due principally to strong revenue growth in investment banking,
improved cash equity trading results, and growth in the global principal investments and secured
financing business. Geographically, the United States and the Pacific Rim contributed to the
increases in net revenues and pre-tax earnings.
A detailed discussion of GMI’s net revenues follows:
Debt Markets
Debt Markets net revenues include principal transactions and net interest profit (which should be
viewed in aggregate to assess trading results), commissions, revenues from principal investments,
fair value adjustments on private equity investments made by non-broker dealer subsidiaries that
are held for capital appreciation and/or current income, and other revenues. In 2005, Debt Markets
net revenues of $6.3 billion increased 21% from 2004, as net revenues increased for all major
products. The largest increase in net revenues was recorded by the global principal investing and
secured finance business (which primarily includes principal investing in and financing of
distressed assets and real estate, as well as mortgage and asset-backed securitization and trading
activities), followed by the commodities business, which was acquired in 2004, and the trading of
credit products. Debt Markets net revenues in 2005 included principal investing gains, including a
single gain of approximately $152 million, which was recorded in other revenues on the Consolidated
Statements of Earnings, primarily associated with the change in the fair value of an equity
principal investment upon its recapitalization. Given the event-driven nature of many principal
investments, revenue realization and trends in the principal investing business may be uneven. In
addition, revenues from equity method investments were $104 million in 2005 compared to $220
million for 2004. This year-over-year reduction was due to the change in accounting treatment for
an investment from the equity method to the cost method following the adoption of Emerging Issues
Task Force (“EITF”) Issue No. 02-14, Whether the Equity Method of Accounting Applies When an
Investor Does Not Have an Investment in Voting Stock of an Investee but Exercises Significant
Influence Through Other Means. Net revenues related to equity method investments are included in
other revenues on the Consolidated Statements of Earnings.
In 2004, Debt Markets net revenues were $5.2 billion, 3% higher than 2003, driven primarily by
increased revenues from the global principal investments and secured financing business, and the
addition of the commodities trading business in late 2004. These increases were partially offset by
lower revenues from credit products and interest rate trading compared to the strong 2003 results.
Equity Markets
Equity Markets net revenues include commissions, principal transactions and net interest profit,
(which should be viewed in aggregate to assess trading results), revenues from equity method
investments, fair value adjustments on private equity investments made by non-broker-dealer
subsidiaries that are held for capital appreciation and/or current income, and other revenues.
Equity Markets net revenues of $4.4 billion increased 44% from 2004 driven by increased revenues
from private equity, cash and equity-linked trading, and the equity financing and services
business, which includes prime brokerage and clearing, and reflects the acquisition of Pax
Clearing. During 2005, Merrill Lynch recognized approximately $443 million of revenues related to
fair value adjustments on private equity investments, including adjustments resulting from the
recapitalization of private equity investments and the sale through an IPO of a private equity
investment. In addition, Equity Markets net revenues in 2005 included $321 million of revenues from
equity method investments compared to $182 million during 2004.
In 2004, Equity Markets net revenues increased 7% from 2003 to $3.0 billion. This increase was due
principally to higher revenues from the cash equity trading business, as trading volumes increased
in 2004.
Investment Banking
Investment Banking net revenues increased 12% in 2005 to $3.2 billion as increased strategic
advisory services and debt origination revenues were partially offset by lower equity origination
revenues. Investment Banking net revenues increased 33% in 2004 to $2.8 billion, reflecting a more
favorable environment and investments made to better position the origination effort in key
industry sectors and regions.
Origination
Origination revenues represent fees earned from the underwriting of debt, equity and equity-linked
securities as well as loan syndication fees.
Origination revenues in 2005 were $2.3 billion, up 7% from 2004, driven by higher debt underwriting
revenues, which increased 17% from 2004, partially offset by equity underwriting revenues which
declined 5% from 2004. The increase in debt origination revenues reflects higher revenues from
syndicated lending activities as well as increased overall debt origination activity during the
year. Total origination revenues were $2.1 billion in 2004, up 37% from 2003, reflecting increased
debt and equity underwriting revenues. Debt origination revenues increased 34% from 2003,
reflecting higher margin transactions and a favorable market environment for debt origination with
narrowing credit spreads and low interest rates. Equity origination revenues increased 40% from
2003 due primarily to an increased volume of IPOs and a significant improvement in the market
environment for equity origination.
Strategic Advisory Services
Strategic advisory services revenues, which include merger and acquisition and other advisory fees,
were $882 million in 2005, up 30% due to an increase in transaction volumes. In 2004, strategic
advisory services revenues increased 21% to $678 million, as global completed mergers and
acquisitions volume increased substantially and Merrill Lynch’s market share of completed
transactions increased.
Global Private Client
GPC provides a full range of advice-based wealth management products and services to assist clients
in managing all aspects of their financial profile through the Total MerrillSM platform.
GPC’s offerings include commission and fee-based investment accounts; banking, cash management, and
credit services, including consumer and small business lending and credit cards; trust and
generational planning; retirement services; and insurance products. GPC serves individual investors
and small- and middle-market corporations and institutions through approximately 15,160 FAs in over
700 offices around the world as of year-end 2005.
Advisory Division
Brokerage and advisory financial services are provided in the United States to GPC clients
principally through the Financial Advisor network. Outside the United States, Merrill Lynch
provides comprehensive brokerage and investment services and related products through a network of
offices located in 26 countries. Banking and trust services, as well as asset management services,
are also offered to private clients in many countries.
To be more responsive to client needs and enhance the quality of its clients’ experience, Merrill
Lynch offers a multi-channel service model that more closely aligns its FAs with clients based on
levels of investable assets. The Advisory Division’s FAs are focused primarily on clients with more
than $100,000, but less than $10 million of investable assets. Private Wealth Advisors who have
completed a rigorous accreditation program focus primarily on clients with more than $10 million of
investable assets. GPC’s Financial Advisory Center, a team-based service platform with access by
telephone and internet, is focused primarily on U.S. clients with less than $100,000 of investable
assets. GPC also uses International Financial Advisory Centers to more effectively serve non-U.S.
clients with lower levels of investable assets.
34
Merrill Lynch 2005 Annual Report
Merrill Lynch provides electronic brokerage services through Merrill Lynch Direct®,
an internet-based brokerage service for U.S. clients preferring a self-directed approach to
investing. Merrill Lynch Direct® offers online equity and fixed income trading, mutual
funds, access to Merrill Lynch and other research and a variety of online investing tools.
Individual clients access the full range of GPC brokerage and advisory services through the
CMA® account. At the end of 2005, there were approximately 2.3 million CMA®
accounts with aggregate assets of approximately $674 billion. Small- and medium-sized businesses
obtain a wide range of securities account and cash management services through the Working Capital
Management Account® (“WCMA account”) and related services. The WCMA account combines
business checking, investment and electronic funds transfer services into one account for
participating business clients. At the end of 2005, there were almost 111,000 WCMA accounts with
aggregate assets of more than $116 billion.
To help align products and services to each client’s specific investment requirements and goals,
GPC offers a choice of traditional commission-based investment accounts, a variety of asset-priced
brokerage and investment advisory services and self-directed online accounts. Assets in GPC
accounts totaled $1.5 trillion at December 30, 2005, an 8% increase from December 31, 2004, due
primarily to market appreciation and, to a lesser extent, net new money.
Banking, Trust and Insurance Services
Through the Beyond Banking® account, a Merrill Lynch client in the United States has
access to a special securities account product designed for everyday transactions, savings and cash
management that combines Visa, check writing and ATM access with available advice and guidance. GPC
also makes mortgage and small business loans to clients through Merrill Lynch’s banks.
GPC securities brokerage clients provide deposits to Merrill Lynch’s banking entities which are
used by these entities for lending and investment activities. GPC also recognizes revenue from a
number of different business lines including residential mortgage financing, small and mid-size
business lending and securities based lending. GPC also sells life insurance and annuity products
and provides personal trust, employee benefit trust and custodial services for its clients. These
activities are conducted through various Merrill Lynch bank, trust and insurance subsidiaries and
are more fully described in the Activities of Principal Subsidiaries section.
Retirement Services
The Merrill Lynch Retirement Group is responsible for approximately $363 billion in retirement
assets for approximately 6.2 million individuals. This group provides a wide variety of investment
and custodial services to individuals in the United States through Individual Retirement Accounts
(“IRAs”) or through one of approximately 31,000 workplace-based retirement programs covered by the
group. Merrill Lynch also provides investment, administration, communications and consulting
services to corporations and their employees for their retirement programs. These programs include
equity award and executive services, 401(k), pension, profit-sharing and non-qualified deferred
compensation plans, as well as other retirement benefit plans. In addition, Merrill Lynch offers
Merrill Lynch Advice Access®, an investment advisory service for individuals in
retirement plans that provides plan participants with the option of obtaining advice through their
local FA, an advisor at the Financial Advisory Center or through Merrill Lynch’s Benefits
Online® website.
2005 Developments
GPC continued to focus on organic and inorganic growth initiatives during 2005, continuing to drive
operating leverage through a strategy of revenue and product diversification, annuitization, client
segmentation, growth in FA headcount, and investments to improve productivity. Over 1,000 FAs were
added during 2005, and productivity per FA increased over 2004. The growth in FAs came through
GPC’s recruiting efforts, its acquisition of The Advest Group, Inc., (“Advest”) and the continued
low rate of turnover among GPC’s most productive FAs. GPC continues to make investments to
carefully expand both within and outside the United States, where substantial opportunity for
growth exists in a number of markets.
GPC continued to make progress in diversifying revenues by increasing fee-based and recurring
revenue sources. Fee-based revenue and net interest profit and related hedges as a percentage of
GPC’s total net revenues rose to 66% despite a year-over-year increase in transactional and
origination revenues. GPC fee-based revenues from asset-priced and managed account products,
including Merrill Lynch Consults® and Unlimited AdvantageSM, rose 11% in
2005.
The rollout of the Wealth Management Technology Platform (“WMTP”) to more than 23,000 U.S. users,
including FAs, Client Associates, and the Financial Advisory Center’s Investor Services Advisors,
commenced in 2004 and was substantially completed in 2005. WMTP is a fully integrated workstation
that incorporates a comprehensive suite of market data and financial planning tools. This
deployment resulted in higher infrastructure expense in 2005 and is expected to similarly impact
future periods.
In 2005, Merrill Lynch completed its acquisition of the U.S. retirement business of AMVESCAP Plc;
entered into a definitive agreement to establish a private banking and wealth management joint
venture in Japan with Mitsubishi UFJ Financial Group; and completed its acquisition of Advest for
approximately $400 million.
GPC’s Results of Operations
| |
|
|
|
|
|
|
|
|
|
|
|
|
| (dollars in millions) |
|
2005 |
|
|
2004 |
|
|
2003 |
|
| |
Fee-based revenues |
|
$ |
5,340 |
|
|
$ |
4,801 |
|
|
$ |
4,068 |
|
Transactional and origination revenues |
|
|
3,311 |
|
|
|
3,293 |
|
|
|
3,042 |
|
Net interest profit and related hedges(1) |
|
|
1,801 |
|
|
|
1,293 |
|
|
|
1,301 |
|
Other revenues |
|
|
312 |
|
|
|
440 |
|
|
|
487 |
|
| |
|
|
Total net revenues |
|
|
10,764 |
|
|
|
9,827 |
|
|
|
8,898 |
|
| |
|
|
Non-interest expenses |
|
|
8,587 |
|
|
|
7,954 |
|
|
|
7,369 |
|
| |
|
|
Pre-tax earnings |
|
$ |
2,177 |
|
|
$ |
1,873 |
|
|
$ |
1,529 |
|
| |
|
|
Pre-tax profit margin |
|
|
20.2 |
% |
|
|
19.1 |
% |
|
|
17.2 |
% |
Total full-time employees |
|
|
33,000 |
|
|
|
31,000 |
|
|
|
30,200 |
|
Total Financial Advisors |
|
|
15,160 |
|
|
|
14,140 |
|
|
|
13,530 |
|
| |
|
|
|
| (1) |
|
Includes interest component of non-qualifying derivatives which are included in other
revenues on the Consolidated Statements of Earnings. |
GPC generated $2.2 billion of pre-tax earnings in 2005, up 16% from 2004 on net revenues that
increased 10% to $10.8 billion. Compared with 2004, higher asset values and strong annuitized net
asset inflows led to increased fee-based revenues, which were supplemented by higher net interest
profit and partially offset by lower mortgage-related revenues. The pre-tax margin was 20.2%
compared to 19.1% in 2004. Non-interest expenses were 8% higher, principally reflecting increased
compensation costs associated with higher revenues and growth in FA headcount.
GPC’s 2004 pre-tax earnings were $1.9 billion, up 22% compared to 2003, on net revenues that
increased 10% to $9.8 billion. GPC’s 2004 pre-tax profit margin of 19.1% increased from 17.2% in
2003 and was driven by increased net revenues and expense discipline. Higher asset values and
annuitized asset flows drove an 18% increase in fee-based revenues, and a more active market
environment led to growth in GPC’s transactional and origination revenues.
Total assets in GPC accounts increased 8% from 2004, to $1.5 trillion. Net inflows into annuitized
products rose 25% from 2004 to $44.6 billion, and total net new money was $46.2 billion in 2005, up
94% from 2004.
Fee-based Revenues
Fee-based revenues are comprised of portfolio service fees which are primarily derived from
accounts that charge an annual fee based on net asset value, such as Merrill Lynch
Consults®, a separate account product, and Unlimited AdvantageSM, as well as
fees from insurance products, taxable and tax-exempt money market funds, and alternative investment
products. Also included in fee-based revenues are fixed annual account fees and other
account-related fees, and commissions related to distribution fees on mutual funds.
GPC generated $5.3 billion of fee-based revenues in 2005, up 11% from 2004. This increase reflected
growth in client assets due to higher market valuations and annuitized net asset inflows. This
asset growth resulted in higher portfolio service fees and increased distribution fees related to
mutual fund sales. In 2004, fee-based revenues totaled $4.8 billion, up 18% from 2003, reflecting
market-driven increases in asset levels, higher portfolio service fees, and increased distribution
fees related to mutual fund sales.
The value of assets in GPC accounts and assets in asset-priced accounts at year-end 2005, 2004, and
2003 follows. Assets in asset-priced accounts are those assets in clients’ brokerage accounts for
which fees are determined based on the value of assets in the account.
| |
|
|
|
|
|
|
|
|
|
|
|
|
| (dollars in billions) |
|
2005 |
|
|
2004 |
|
|
2003 |
|
| |
Assets in GPC accounts |
|
|
|
|
|
|
|
|
|
|
|
|
U.S. |
|
$ |
1,356 |
|
|
$ |
1,244 |
|
|
$ |
1,164 |
|
Non-U.S. |
|
|
117 |
|
|
|
115 |
|
|
|
103 |
|
| |
|
|
Total |
|
$ |
1,473 |
|
|
$ |
1,359 |
|
|
$ |
1,267 |
|
| |
|
|
Assets in asset-priced accounts |
|
$ |
284 |
|
|
$ |
257 |
|
|
$ |
226 |
|
As a percentage of total assets in GPC accounts |
|
|
19.3 |
% |
|
|
18.9 |
% |
|
|
17.8 |
% |
| |
36
Merrill Lynch 2005 Annual Report
Transactional and Origination Revenues
Transactional and origination revenues include certain commission revenues, such as those that
arise from agency transactions in listed and OTC equity securities, insurance products, and mutual
funds. Also included are principal transactions revenues which primarily represent bid-offer
revenues on government bonds and municipal securities, as well as new issue revenues which include
selling concessions on newly issued debt and equity securities, including shares of closed-end
funds.
Transactional and origination revenues were $3.3 billion in 2005, essentially unchanged from 2004
as a marginal increase in transaction-related revenues was offset by lower origination revenues. In
2004, transactional and origination revenues totaled $3.3 billion, up 8% from 2003, primarily
reflecting increased transactions resulting from more active markets. Increased commissions
revenues on equity securities and insurance products and higher equity new issue revenues were the
largest contributors.
Net Interest Profit and Related Hedges
Net interest profit (interest revenues less interest expenses) and related hedges includes GPC’s
allocation of the interest spread earned in Merrill Lynch’s banks for deposits, as well as interest
earned on margin, small- and middle-market business and other loans, corporate funding allocations,
and the interest component of non-qualifying derivatives.
GPC’s net interest profit and related hedges were $1.8 billion in 2005, up 39% from 2004. This
increase primarily reflects higher margins on deposits resulting from rising short-term interest
rates and lower provisions associated with the small- and middle-market business loan portfolio.
GPC’s net interest profit and related hedges were $1.3 billion in 2004, down 1% from 2003. Higher
net interest revenues resulting from increases in short-term interest rates were more than offset
by increased credit provisions associated with secured business loans extended to small- and
middle-market businesses.
Other Revenues
GPC’s other revenues were $312 million in 2005, down from $440 million in 2004 on lower
mortgage-related revenues which were driven in part by lower variable rate mortgage originations.
Other revenues in 2004 were down 10% from 2003, also reflecting lower mortgage lending-related
revenue.
Merrill Lynch Investment Managers
MLIM and its affiliates are among the world’s largest asset managers with approximately $539
billion of assets under management at the end of 2005. Firmwide assets under management, including
$5 billion of assets managed by GPC, totaled approximately $544 billion.
With portfolio managers located in the United States, the United Kingdom, Japan and Australia, MLIM
manages a wide array of taxable and tax-exempt fixed-income, equity and balanced mutual funds and
segregated accounts for a diverse global clientele, as well as a wide assortment of index-based
equity and alternative investment products.
MLIM’s clients include institutions, pension funds, high-net-worth individuals and retail
investors. MLIM’s product distribution is managed through five channels: proprietary retail (GPC);
Americas non-proprietary retail; Americas institutional; EMEA Pacific third-party retail; and EMEA
Pacific institutional. MLIM also distributes certain of its products through GMI. MLIM maintains a
significant sales and marketing presence both inside and outside the United States that is focused
on acquiring and maintaining institutional investment management relationships by marketing its
services to institutional investors both directly and through pension consultants, and establishing
third-party distribution relationships.
At the end of 2005, MLIM provided global advisory services for mutual funds, unit investment trusts
and other non-U.S. equivalent products totaling approximately $245 billion. MLIM’s non-U.S. mutual
fund ranges are based in a number of domiciles and cover a range of asset classes, including cash,
fixed income and equities. In the United States, the primary retail offering is the Merrill Lynch
family of funds. The primary retail fund range offered outside the United States is Merrill Lynch
International Investment Funds (“MLIIF”), which is authorized for distribution in more than 30
jurisdictions worldwide.
MLIM manages separate accounts for high-net-worth retail investors as well as assets for
governments, pension funds, endowments and other institutional investors in a wide variety of
active and passive strategies covering both equity and fixed income assets. At the end of 2005,
MLIM managed a total of approximately $44 billion in separate accounts and $250 billion in
institutional accounts.
MLIM also offers a wide assortment of alternative investment products such as structured products,
real estate funds, hedge funds, hedge funds of funds, private equity funds of funds, managed
futures funds and exchange traded funds. These products are sold to both U.S. and non-U.S.
high-net-worth retail and institutional investors. At the end of 2005, assets under management
included approximately $13.8 billion of client capital committed to, and approximately $10.6
billion invested in, alternative investment products.
2005 Developments
During 2005, MLIM continued with its strategy of maintaining strong investment performance to drive
sales globally. MLIM is committed to increasing sales in both its proprietary and non-proprietary
channels in the United States. On February 15, 2006, Merrill Lynch announced that it had reached an
agreement to combine MLIM with BlackRock in exchange for an economic interest in the combined
investment management firm of 49.8%. Refer to Note 2 to the Consolidated Financial Statements for
further information.
MLIM continued to focus on driving strong relative long-term investment performance and broadening
the distribution of its products through multiple channels, while maintaining discipline on
expenses. Current industry standards typically measure investment results for institutional
accounts against a benchmark (such as the S&P 500 Index) and investment results for retail mutual
funds against competitor results ranked by quartile within investment category as reported by
third-party organizations, such as Lipper or Standard & Poor’s. More than 70% of MLIM’s global
assets under management were above benchmark or category median for the 3- and 5-year periods
ending December 2005.
In September 2005, MLIM acquired the pension business of Royal Philips Electronics (“Philips”),
adding approximately $18 billion to its assets under management.
MLIM’s Results of Operations
| |
|
|
|
|
|
|
|
|
|
|
|
|
| (dollars in millions) |
|
2005 |
|
|
2004 |
|
|
2003 |
|
| |
Asset management fees |
|
$ |
1,573 |
|
|
$ |
1,413 |
|
|
$ |
1,233 |
|
Commissions |
|
|
105 |
|
|
|
116 |
|
|
|
132 |
|
Other revenues |
|
|
129 |
|
|
|
51 |
|
|
|
(3 |
) |
| |
|
|
Total net revenues |
|
|
1,807 |
|
|
|
1,580 |
|
|
|
1,362 |
|
| |
|
|
Non-interest expenses |
|
|
1,221 |
|
|
|
1,120 |
|
|
|
1,101 |
|
| |
|
|
Pre-tax earnings |
|
$ |
586 |
|
|
$ |
460 |
|
|
$ |
261 |
|
| |
|
|
Pre-tax profit margin |
|
|
32.4 |
% |
|
|
29.1 |
% |
|
|
19.2 |
% |
Total full-time employees |
|
|
2,600 |
|
|
|
2,500 |
|
|
|
2,600 |
|
| |
MLIM’s 2005 net revenues were $1.8 billion, up 14% from 2004, due primarily to higher average
long-term asset values as well as increases in performance fees and an improvement in the fee
profile of assets under management. Pre-tax earnings were $586 million, up 27% from 2004, driven
principally by higher net revenues and continued expense discipline as non-compensation expenses
were essentially unchanged from 2004. MLIM’s pre-tax profit margin was 32.4% in 2005, up from 29.1%
in 2004.
Pre-tax earnings for MLIM were $460 million in 2004, up 76% from 2003. Net revenues grew 16%, to
$1.6 billion, due primarily to increased asset values related to market appreciation, as well as
the positive impact of currency translation. As short-term interest rates increased, investors
moved assets out of retail money market funds to higher-yielding products. MLIM’s pre-tax profit
margin was 29.1% in 2004, up from 19.2% in 2003, reflecting continued expense discipline, as
non-interest expenses increased only 2% from 2003.
Asset Management Fees
Asset management fees primarily consist of fees earned from the management and administration of
retail mutual funds and separately managed accounts for retail investors, as well as institutional
funds such as pension assets. Asset management fees also include performance fees, which are
generated in some cases by separately managed accounts and institutional money management
arrangements.
Asset management fees were $1.6 billion, up 11% from 2004 due to higher average equity market
values and an improvement in the fee profile of assets under management. In 2004, asset management
fees were $1.4 billion, up 15% from 2003 as average asset values increased and the fee profile of
assets under management improved.
Firmwide assets under management for each of the last three years were comprised of the following:
| |
|
|
|
|
|
|
|
|
|
|
|
|
| (dollars in billions) |
|
2005 |
|
|
2004 |
|
|
2003 |
|
| |
Assets Under Management |
|
|
|
|
|
|
|
|
|
|
|
|
Institutional |
|
$ |
250 |
|
|
$ |
240 |
|
|
$ |
253 |
|
Retail |
|
|
245 |
|
|
|
218 |
|
|
|
207 |
|
Separate Accounts(1) |
|
|
49 |
|
|
|
43 |
|
|
|
40 |
|
| |
|
|
Total |
|
$ |
544 |
|
|
$ |
501 |
|
|
$ |
500 |
|
| |
|
|
|
| (1) |
|
Represents segregated portfolios for individuals, small corporations, and institutions and
includes $5 billion of accounts managed by GPC in 2005 and 2004. |
38
Merrill Lynch 2005 Annual Report
At the end of 2005, firmwide assets under management totaled $544 billion, with $539 billion
managed by MLIM and its affiliates and $5 billion managed by GPC. Compared with 2004, firmwide
assets under management increased 9%, due principally to positive market movement, the addition of
$18 billion of assets from the acquisition of Philips’ pension business, and net new money inflows
of $5 billion.
An analysis of changes in firmwide assets under management from year-end 2004 to 2005 is as
follows:
| |
|
|
|
|
|
|
|
|
|
|
|
|
|
|
|
|
|
|
|
|
|
|
|
|
|
|
Net Changes Due To |
|
|
|
|
| |
|
Year-end |
|
|
|
|
|
|
Asset |
|
|
|
|
|
|
Year-end |
|
| (dollars in billions) |
|
2004(1) |
|
|
New Money |
|
|
Appreciation |
|
|
Other(2) |
|
|
2005(1) |
|
| |
Assets Under Management |
|
$ |
501 |
|
|
$ |
5 |
|
|
$ |
33 |
|
|
$ |
5 |
|
|
$ |
544 |
|
| |
|
|
|
| (1) |
|
Includes $5 billion of assets managed by GPC. |
| (2) |
|
Includes $18 billion of new assets from the acquisition of Philips’ pension business, the
impact of foreign exchange movement, reinvested dividends and other changes. |
Commissions
Commissions for MLIM principally consist of distribution fees and contingent deferred sales charges
(“CDSC”) related to mutual funds. The distribution fees represent revenues earned for promoting and
distributing mutual funds, and the CDSC represents fees earned when a shareholder redeems shares
prior to the required holding period. Commission revenues were $105 million in 2005, down 9% from
2004. Commission revenues declined to $116 million in 2004, down 12% from 2003. These reductions
reflect the decline over time in sales of rear-load shares.
Other Revenues
Other revenues primarily include net interest profit, investment gains and losses and revenues from
consolidated investments. Other revenues totaled $129 million in 2005, up from $51 million in 2004
reflecting increased investment gains. Other revenues in 2003 were $(3) million and included
investment losses.
Consolidated Balance Sheets
Overview
Management continually monitors and evaluates the size and composition of the Consolidated
Balance Sheets. The following table summarizes the year-end and average balance sheets for 2005 and
2004:
| |
|
|
|
|
|
|
|
|
|
|
|
|
|
|
|
|
| (dollars in billions) |
Dec. 30, 2005 |
|
|
2005 Average(1) |
|
|
Dec. 31, 2004 |
|
|
2004 Average(1) |
|
| |
Assets |
|
|
|
|
|
|
|
|
|
|
|
|
|
|
|
|
Trading-Related |
|
|
|
|
|
|
|
|
|
|
|
|
|
|
|
|
Securities financing assets |
|
$ |
272.3 |
|
|
$ |
268.3 |
|
|
$ |
185.3 |
|
|
$ |
181.5 |
|
Trading assets |
|
|
148.7 |
|
|
|
182.9 |
|
|
|
174.6 |
|
|
|
157.0 |
|
Other trading-related receivables |
|
|
54.3 |
|
|
|
60.9 |
|
|
|
51.8 |
|
|
|
46.4 |
|
| |
|
|
|
|
|
475.3 |
|
|
|
512.1 |
|
|
|
411.7 |
|
|
|
384.9 |
|
| |
|
|
Non-Trading-Related |
|
|
|
|
|
|
|
|
|
|
|
|
|
|
|
|
Cash |
|
|
26.5 |
|
|
|
38.7 |
|
|
|
38.6 |
|
|
|
24.5 |
|
Investment securities |
|
|
69.3 |
|
|
|
71.2 |
|
|
|
78.5 |
|
|
|
82.6 |
|
Loans, notes, and mortgages, net |
|
|
66.0 |
|
|
|
60.6 |
|
|
|
53.3 |
|
|
|
54.8 |
|
Other non-trading assets |
|
|
43.9 |
|
|
|
47.8 |
|
|
|
46.0 |
|
|
|
42.9 |
|
| |
|
|
|
|
|
205.7 |
|
|
|
218.3 |
|
|
|
216.4 |
|
|
|
204.8 |
|
| |
|
|
Total assets |
|
$ |
681.0 |
|
|
$ |
730.4 |
|
|
$ |
628.1 |
|
|
$ |
589.7 |
|
| |
|
|
Liabilities |
|
|
|
|
|
|
|
|
|
|
|
|
|
|
|
|
Trading-Related |
|
|
|
|
|
|
|
|
|
|
|
|
|
|
|
|
Securities financing liabilities |
|
$ |
234.3 |
|
|
$ |
272.7 |
|
|
$ |
188.0 |
|
|
$ |
186.8 |
|
Trading liabilities |
|
|
88.9 |
|
|
|
105.7 |
|
|
|
99.6 |
|
|
|
93.2 |
|
Other trading-related payables |
|
|
56.9 |
|
|
|
63.8 |
|
|
|
56.0 |
|
|
|
51.2 |
|
| |
|
|
|
|
|
380.1 |
|
|
|
442.2 |
|
|
|
343.6 |
|
|
|
331.2 |
|
| |
|
|
Non-Trading-Related |
|
|
|
|
|
|
|
|
|
|
|
|
|
|
|
|
Commercial paper and other short-term borrowings |
|
|
3.9 |
|
|
|
6.5 |
|
|
|
4.0 |
|
|
|
5.8 |
|
Deposits |
|
|
80.0 |
|
|
|
79.2 |
|
|
|
79.7 |
|
|
|
77.8 |
|
Long-term borrowings |
|
|
132.4 |
|
|
|
122.4 |
|
|
|
119.5 |
|
|
|
100.3 |
|
Long-term debt issued to TOPrSSM partnerships |
|
|
3.1 |
|
|
|
3.1 |
|
|
|
3.1 |
|
|
|
3.1 |
|
Other non-trading liabilities |
|
|
45.9 |
|
|
|
43.8 |
|
|
|
46.8 |
|
|
|
41.8 |
|
| |
|
|
|
|
|
265.3 |
|
|
|
255.0 |
|
|
|
253.1 |
|
|
|
228.8 |
|
| |
|
|
Total liabilities |
|
|
645.4 |
|
|
|
697.2 |
|
|
|
596.7 |
|
|
|
560.0 |
|
| |
|
|
Total stockholders’ equity |
|
|
35.6 |
|
|
|
33.2 |
|
|
|
31.4 |
|
|
|
29.7 |
|
| |
|
|
Total liabilities and stockholders’ equity |
|
$ |
681.0 |
|
|
$ |
730.4 |
|
|
$ |
628.1 |
|
|
$ |
589.7 |
|
| |
|
|
|
| (1) |
|
Averages represent management’s daily balance sheet estimates, which may not fully reflect
netting and other adjustments included in period-end balances. Balances for certain assets and
liabilities are not revised on a daily basis. |
The discussion that follows analyzes the changes in year-end financial statement balances and
yearly average balances of the major asset and liability categories.
Trading-Related Assets and Liabilities
Trading-related balances primarily consist of securities financing transactions, trading assets
and liabilities, and certain interest receivable/payable balances that result from trading
activities. At December 30, 2005, total trading-related assets and liabilities were $475.3 billion
and $380.1 billion, respectively. Average trading-related assets and liabilities for 2005 were
$512.1 billion and $442.2 billion, respectively.
The increases in trading-related assets and liabilities in 2005 primarily reflect higher levels of
securities financing activity, which includes increased client matched-book transactions. Merrill
Lynch continued to expand its prime brokerage businesses during the year, which resulted in
increases in securities financing transactions and other trading-related receivables.
Although trading-related balances comprise a significant portion of the Consolidated Balance
Sheets, the magnitude of these balances does not necessarily result in an increase in risk. The
market and credit risks associated with trading-related balances are
40
Merrill Lynch 2005 Annual Report
mitigated through various hedging strategies, as discussed in the following section. See Note 6
to the Consolidated Financial Statements for descriptions of market and credit risks.
Merrill Lynch reduces a significant portion of the credit risk associated with trading-related
assets by requiring counterparties to post cash or securities as collateral in accordance with
collateral maintenance policies. Conversely, Merrill Lynch may be required to post cash or
securities to counterparties in accordance with similar policies.
Securities Financing Transactions
Securities financing transactions include resale and repurchase agreements, securities borrowed and
loaned transactions, securities received as collateral, and obligations to return securities
received as collateral. Repurchase agreements and, to a lesser extent, securities loaned
transactions are used to fund a portion of trading assets. Likewise, Merrill Lynch uses resale
agreements and securities borrowed transactions to obtain the securities needed for delivery on
short positions. These transactions are typically short-term in nature, with a significant portion
entered into on an overnight or open basis.
Merrill Lynch also enters into these transactions to meet clients’ needs, which are known as
matched-book transactions. These matched-book repurchase and resale agreements or securities
borrowed and loaned transactions are entered into with different clients using the same underlying
securities, generating a spread between the interest revenue on the resale agreements or securities
borrowed transactions and the interest expense on the repurchase agreements or securities loaned
transactions. Exposures on these transactions are limited by collateral maintenance policies and
the typically short-term nature of the transactions.
Securities financing assets at 2005 year-end were $272.3 billion, up 47% from 2004 year-end, and
securities financing liabilities were $234.3 billion at 2005 year-end, up 25% from year-end 2004.
Average securities financing assets in 2005 were $268.3 billion, up 48% from the 2004 average.
Average securities financing liabilities in 2005 were $272.7 billion, up 46% from the 2004 average.
Trading Assets and Liabilities
Trading inventory principally represents securities purchased (“long positions”), securities sold
but not yet purchased (“short positions”), the fair value of derivative contracts, and commodities
and related contracts. See Note 1 to the Consolidated Financial Statements for related accounting
policies. These positions primarily arise from market-making, hedging, and proprietary activities.
Merrill Lynch acts as a market maker in a wide range of securities, resulting in a significant
amount of trading inventory that is required to facilitate client transaction flow. Merrill Lynch
also maintains proprietary trading inventory in seeking to profit from existing or projected market
opportunities.
Merrill Lynch uses both “cash instruments” (e.g., securities) and derivatives to manage trading
inventory market risks. As a result of these hedging techniques, a significant portion of trading
assets and liabilities represents hedges of other trading positions. Long positions in U.S.
Government securities, for example, may be used to hedge short positions in interest rate futures
contracts. These hedging techniques, which are generally initiated at the trading unit level, are
supplemented by corporate risk management policies and procedures (see the Risk Management section
for a description of risk management policies and procedures).
Trading assets at year-end 2005 were $148.7 billion, down 15% from 2004, and trading liabilities at
year-end 2005 were $88.9 billion, down 11% from 2004. Average trading assets in 2005 were $182.9
billion, up 16% from the 2004 average. Average trading liabilities in 2005 were $105.7 billion, up
13% from the 2004 average.
Other Trading-Related Receivables and Payables
Securities trading may lead to various customer or broker-dealer receivable and payable balances.
Broker-dealer receivable and payable balances may also result from recording trading inventory on a
trade date basis. Certain receivable and payable balances also arise when customers or
broker-dealers fail to pay for securities purchased or fail to deliver securities sold,
respectively. These receivables are generally collateralized by the securities that the customer or
broker-dealer purchased but did not receive. Customer receivables also include certain commodities
transactions, margin loans and similar loan arrangements collateralized by customer-owned
securities held by Merrill Lynch. Collateral policies significantly limit Merrill Lynch’s credit
exposure to customers and broker-dealers. Merrill Lynch, in accordance with regulatory
requirements, will sell securities that have not been paid for, or purchase securities sold but not
delivered, after a relatively short period of time, or will require additional margin collateral,
as necessary. These measures reduce market risk exposure related to these balances.
Interest receivable and payable balances related to trading inventory are principally short-term in
nature. Interest balances for resale and repurchase agreements and securities borrowed and loaned
transactions are considered when determining the collateral requirements related to these
transactions.
Other trading-related receivables at year-end 2005 were $54.3 billion, up 5% from 2004, and other
trading-related payables were $56.9 billion at year-end 2005, up 2% from 2004. Average other
trading-related receivables in 2005 were $60.9 billion, up 31% from the 2004 average. Average other
trading-related payables were $63.8 billion in 2005, up 25% from the 2004 average.
Non-Trading-Related Assets and Liabilities
Non-trading-related balances primarily consist of cash; investment securities; loans, notes,
and mortgages; short- and long-term borrowings; and other non-trading assets and liabilities. At
December 30, 2005, total non-trading-related assets and liabilities were $205.7 billion and $265.3
billion, respectively. Average non-trading-related assets for 2005 were $218.3 billion, and average
non-trading-related liabilities were $255.0 billion.
Cash
Cash includes cash, cash equivalents and securities segregated for regulatory purposes or deposited
with clearing organizations. Cash at year-end 2005 was $26.5 billion, down 31% from 2004. Average
cash in 2005 was $38.7 billion, up 58% from the 2004 average.
Investment Securities
Investment securities principally consist of debt securities, including those that are held for
investment and liquidity and collateral management purposes; equity securities; private equity
investments, including investments in partnerships and joint ventures; and other investments.
Investment securities were $69.3 billion at year-end 2005, down 12% from 2004. Average investment
securities were $71.2 billion in 2005, down 14% from the 2004 average. See Note 5 to the
Consolidated Financial Statements for further information.
Loans, Notes, and Mortgages, net
Merrill Lynch’s portfolio of loans, notes, and mortgages includes corporate and institutional
loans, residential and commercial mortgages, asset-based loans and other loans to individuals and
other businesses. Merrill Lynch maintains collateral to mitigate risk of loss in the event of
default on some of these extensions of credit in the form of securities, liens on real estate,
perfected security interests in other assets of the borrower or other loan parties, and guarantees.
Merrill Lynch also economically hedges certain portions of commercial loans by purchasing credit
default swaps. Loans, notes, and mortgages were $66.0 billion at year-end 2005, up 24% from 2004 as
a result of strong market demand driven by favorable borrower fundamentals and business growth.
Average loans, notes, and mortgages in 2005 were $60.6 billion, up 11% from the 2004 average. These
amounts do not include loans held for trading purposes, which are included in trading assets. See
Note 8 to the Consolidated Financial Statements for additional information.
Short- and Long-Term Borrowings
Portions of trading and non-trading assets are funded through deposits, long-term borrowings, and
commercial paper (see the Capital and Funding section for further information on funding sources).
Commercial paper and other short-term borrowings were $3.9 billion at 2005 year-end, down 2% from
2004 year-end. The average commercial paper and other short-term borrowings balance in 2005 was
$6.5 billion, up 12% from the 2004 average. Deposits were $80.0 billion at 2005 year-end,
essentially unchanged from 2004 year-end. Average deposits in 2005 were $79.2 billion, up 2% from
the 2004 average. Long-term borrowings, including long-term debt issued to Trust Originated
Preferred SecuritiesSM (“TOPrSSM”) partnerships, were $135.5 billion at
year-end 2005, up 11% from 2004 year-end. Average long-term borrowings, including long-term debt
issued to TOPrSSM partnerships, in 2005 were $125.5 billion, up 21% from the 2004
average. For capital management purposes, Merrill Lynch views TOPrSSM as a component of
equity capital although the long-term debt issued to TOPrSSM partnerships is recorded as
a liability for accounting purposes.
Major components of the changes in long-term borrowings, including long-term debt issued to
TOPrSSM partnerships, for 2005 and 2004 are as follows:
| |
|
|
|
|
|
|
|
|
| (dollars in billions) |
|
2005 |
|
|
2004 |
|
| |
Beginning of year |
|
$ |
122.6 |
|
|
$ |
88.4 |
|
Issuance and resale |
|
|
49.7 |
|
|
|
50.5 |
|
Settlement and repurchase |
|
|
(31.2 |
) |
|
|
(23.2 |
) |
Other(1) |
|
|
(5.6 |
) |
|
|
6.9 |
|
| |
|
|
End of year(2) |
|
$ |
135.5 |
|
|
$ |
122.6 |
|
| |
|
|
|
| (1) |
|
Primarily foreign exchange movements. |
| (2) |
|
See Note 9 to the Consolidated Financial Statements for the long-term borrowings maturity
schedule. |
42
Merrill Lynch 2005 Annual Report
Total borrowings, which includes long-term borrowings, including long-term debt issued to
TOPrSSM partnerships, and commercial paper and other short-term borrowings, outstanding
at year-end 2005 and 2004 were issued in the following currencies:
| |
|
|
|
|
|
|
|
|
|
|
|
|
|
|
|
|
| (USD equivalent in millions) |
|
2005 |
|
|
|
|
|
|
2004 |
|
|
|
|
|
| |
USD |
|
$ |
86,080 |
|
|
|
61 |
% |
|
$ |
80,068 |
|
|
|
63 |
% |
EUR |
|
|
27,313 |
|
|
|
20 |
|
|
|
22,446 |
|
|
|
18 |
|
JPY |
|
|
11,225 |
|
|
|
8 |
|
|
|
11,542 |
|
|
|
9 |
|
GBP |
|
|
8,269 |
|
|
|
6 |
|
|
|
6,970 |
|
|
|
6 |
|
CAD |
|
|
2,377 |
|
|
|
2 |
|
|
|
1,717 |
|
|
|
1 |
|
AUD |
|
|
2,329 |
|
|
|
2 |
|
|
|
1,906 |
|
|
|
1 |
|
Other |
|
|
1,810 |
|
|
|
1 |
|
|
|
1,935 |
|
|
|
2 |
|
| |
|
|
Total |
|
$ |
139,403 |
|
|
|
100 |
% |
|
$ |
126,584 |
|
|
|
100 |
% |
| |
Other Non-Trading Assets and Liabilities
Other non-trading assets, which include separate accounts assets, equipment and facilities,
goodwill and other intangible assets, other non-interest receivables ($13.9 billion in 2005 and
$12.5 billion in 2004) and other assets, were $43.9 billion at year-end 2005, down 5% from 2004.
Average other non-trading assets in 2005 were $47.8 billion, up 11% from the 2004 average. Separate
accounts assets are related to Merrill Lynch’s insurance businesses and represent segregated funds
that are invested for certain policyholders and other customers. The assets of each account are
legally segregated and are generally not subject to claims that arise from any other business of
Merrill Lynch.
Other non-trading liabilities, which include liabilities of insurance subsidiaries, separate
accounts liabilities, and other non-interest payables ($26.8 billion in 2005 and $25.0 billion in
2004), were $45.9 billion at year-end 2005, down 2% from 2004. Average other non-trading
liabilities were $43.8 billion in 2005, up 5% from the 2004 average. Separate accounts liabilities
represent Merrill Lynch’s obligations to its customers related to separate accounts assets.
Stockholders’ Equity
Stockholders’ equity at December 30, 2005 was $35.6 billion, up 13% from December 31, 2004.
This increase primarily resulted from net earnings, preferred stock issuances and the net effect of
employee stock transactions, partially offset by common stock repurchases and dividends.
At December 30, 2005, total common shares outstanding, excluding shares exchangeable into common
stock, were 915.6 million, 1% lower than the 928.0 million shares outstanding at December 31, 2004.
The decrease reflected common stock repurchases, partially offset by shares issued to employees.
Total shares exchangeable into common stock at year-end 2005 issued in connection with the 1998
merger with Midland Walwyn Inc., were 2.7 million, compared with 2.8 million at year-end 2004. For
additional information, see Note 11 to the Consolidated Financial Statements.
Off Balance Sheet Arrangements
As a part of its normal operations, Merrill Lynch enters into various off balance sheet
arrangements that may require future payments. The table below outlines the significant off balance
sheet arrangements, as well as the future expiration as of December 30, 2005:
| |
|
|
|
|
|
|
|
|
|
|
|
|
|
|
|
|
|
|
|
|
| |
|
Expiration |
|
| (dollars in millions) |
|
Total |
|
|
Less than 1 Year |
|
|
1–3 Years |
|
|
3+–5 Years |
|
|
Over 5 Years |
|
| |
Liquidity facilities with SPEs(1) |
|
$ |
25,871 |
|
|
$ |
25,453 |
|
|
$ |
397 |
|
|
$ |
21 |
|
|
$ |
– |
|
Liquidity and default facilities with
SPEs(2) |
|
|
7,114 |
|
|
|
6,064 |
|
|
|
806 |
|
|
|
– |
|
|
|
244 |
|
Residual value guarantees(3) |
|
|
1,061 |
|
|
|
60 |
|
|
|
19 |
|
|
|
478 |
|
|
|
504 |
|
Standby letters of credit and other |
|
|
|
|
|
|
|
|
|
|
|
|
|
|
|
|
|
|
|
|
guarantees(4)(5)(6) |
|
|
3,291 |
|
|
|
1,313 |
|
|
|
384 |
|
|
|
886 |
|
|
|
708 |
|
| |
|
|
|
| (1) |
|
Amounts relate primarily to facilities provided to municipal bond securitization SPEs. |
| (2) |
|
Amounts relate to liquidity facilities and credit default protection provided to municipal bond
securitization SPEs and an asset-backed commercial paper conduit (“Conduit”) sponsored by Merrill
Lynch. |
| (3) |
|
Includes residual value guarantees associated with the Hopewell campus and aircraft leases of
$322 million. |
| (4) |
|
Includes $244 million of reimbursement agreements with the Mortgage 100SM program. |
| (5) |
|
Includes guarantees related to principal-protected mutual funds. |
| (6) |
|
Includes certain indemnifications related to foreign tax planning strategies. |
Merrill Lynch provides guarantees to Special Purpose Entities (“SPEs”) in the form of liquidity
facilities, credit default protection and residual value guarantees for equipment leasing entities.
The liquidity facilities and credit default protection relate primarily to municipal bond
securitization SPEs and the Conduit. To protect against declines in value of the assets held by the
SPEs for which Merrill Lynch provides either liquidity facilities or default protection, Merrill
Lynch generally economically hedges its exposure through derivative positions that principally
offset the risk of loss of these guarantees. The residual value guarantees are related to leasing
SPEs where either Merrill Lynch or a third-party is the lessee and reimbursement agreements issued
in conjunction with sales of loans originated under its Mortgage 100SM program. Merrill
Lynch also makes guarantees to counterparties in the form of standby letters of credit and, at
December 30, 2005, held $487 million of marketable securities as collateral to secure these
guarantees. In conjunction with certain principal-protected mutual funds and managed mutual funds,
Merrill Lynch guarantees the return of the initial principal investment at the termination date of
the fund. Merrill Lynch also provides indemnifications related to the U.S. tax treatment of certain
foreign tax planning transactions. The maximum exposure to loss associated with these transactions
is $164 million; however, Merrill Lynch believes that the likelihood of loss with respect to these
arrangements is remote.
The amounts in the preceding table do not necessarily represent expected future cash flow
requirements. Refer to Note 7 and Note 12 to the Consolidated Financial Statements for a further
discussion of these arrangements.
Contractual Obligations and Commitments
Contractual Obligations
In the normal course of business, Merrill Lynch enters into various contractual obligations
that may require future cash payments. The accompanying table summarizes Merrill Lynch’s
contractual obligations by remaining maturity at December 30, 2005. Excluded from this table are
obligations recorded on the Consolidated Balance Sheets that are: (i) generally short-term in
nature, including securities financing transactions, trading liabilities, including contractual
agreements, commercial paper and other short-term borrowings and other payables; (ii) deposits;
(iii) obligations that are related to Merrill Lynch’s insurance subsidiaries, including liabilities
of insurance subsidiaries, which are subject to significant variability; and (iv) separate accounts
liabilities, which fund separate accounts assets.
| |
|
|
|
|
|
|
|
|
|
|
|
|
|
|
|
|
|
|
|
|
| |
|
Expiration |
|
| (dollars in millions) |
|
Total |
|
|
Less than 1 Year |
|
|
1–3 Years |
|
|
3+–5 Years |
|
|
Over 5 Years |
|
| |
Long-term borrowings(1) |
|
|
$135,501 |
|
|
|
$22,771 |
|
|
|
$40,560 |
|
|
|
$37,669 |
|
|
|
$34,501 |
|
Operating lease commitments |
|
|
3,348 |
|
|
|
569 |
|
|
|
1,036 |
|
|
|
814 |
|
|
|
929 |
|
Purchasing and other commitments |
|
|
5,777 |
|
|
|
4,100 |
|
|
|
820 |
|
|
|
298 |
|
|
|
559 |
|
| |
|
|
|
| (1) |
|
Includes long-term debt issued to TOPrSSM partnerships. |
Merrill Lynch issues U.S. and non-U.S. dollar-denominated long-term borrowings with both
variable and fixed interest rates, as part of its overall funding strategy. For further information
on funding and long-term borrowings, see the Capital and Funding section and Note 9 to the
Consolidated Financial Statements. In the normal course of business, Merrill Lynch enters into
various noncancellable long-term operating lease agreements, various purchasing commitments,
commitments to extend credit and other commitments. For detailed information regarding these
commitments, see Note 12 to the Consolidated Financial Statements.
Commitments
At December 30, 2005, Merrill Lynch commitments had the following expirations:
| |
|
|
|
|
|
|
|
|
|
|
|
|
|
|
|
|
|
|
|
|
| |
|
Expiration |
|
| (dollars in millions) |
|
Total |
|
|
Less than 1 Year |
|
|
1–3 Years |
|
|
3+–5 Years |
|
|
Over 5 Years |
|
| |
Commitments to extend credit |
|
|
$67,137 |
|
|
|
$33,885 |
|
|
|
$9,754 |
|
|
|
$17,134 |
|
|
|
$6,364 |
|
Commitments to enter into resale
agreements |
|
|
3,478 |
|
|
|
3,459 |
|
|
|
19 |
|
|
|
– |
|
|
|
– |
|
| |
44
Merrill Lynch 2005 Annual Report
Capital and Funding
The primary objectives of Merrill Lynch’s capital structure and funding policies are to support
the successful execution of Merrill Lynch’s business strategies while ensuring:
| • |
|
sufficient equity capital to support existing businesses and future growth plans and |
| |
| • |
|
liquidity across market cycles
and through periods of financial stress. |
Capital
At December 30, 2005, equity capital, as defined by Merrill Lynch, was comprised of $32.9
billion of common equity, $2.7 billion of preferred stock, and $2.5 billion of long-term debt
issued to TOPrSSM partnerships (net of related investments). Equity capital is Merrill
Lynch’s view of capital available to support its businesses and differs from stockholders’ equity
as defined by U.S. generally accepted accounting principles, which does not include long-term debt
issued to TOPrSSM partnerships, net of related investments.
Merrill Lynch regularly reviews overall equity capital needs to ensure that its equity capital base
can support the estimated risks and needs of its businesses, the regulatory and legal capital
requirements of its subsidiaries, and standards pursuant to the CSE rules. Merrill Lynch determines
the appropriateness of its equity capital composition, taking into account that its preferred stock
and TOPrSSM are perpetual. In the event that capital is generated beyond estimated
needs, Merrill Lynch returns capital to shareholders through share repurchases and dividends.
To determine equity capital needs to cover potential losses arising from market and credit risks,
Merrill Lynch uses statistically based risk models, developed in conjunction with its risk
management practices. Models and other tools used to estimate risks are continually modified as
risk analytics are refined. The assumptions used in analytical models are reviewed regularly to
ensure that they provide a reasonable and conservative assessment of risks to Merrill Lynch across
a stress market cycle.
Merrill Lynch also assesses the need for equity capital to support business risks that may not be
adequately measured through these risk models, such as legal and other operational risks. When
deemed prudent or when required by regulations, Merrill Lynch purchases insurance to protect
against some risks. Merrill Lynch also considers equity capital that may be required to support
normal business growth and strategic initiatives.
Merrill Lynch’s capital adequacy planning also takes into account the regulatory environment in
which Merrill Lynch operates. Many regulated businesses require various minimum levels of capital.
See Note 16 to the Consolidated Financial Statements for further information. Merrill Lynch’s
broker-dealer, banking, and insurance activities are subject to regulatory requirements that may
restrict the free flow of funds to affiliates. Regulatory approval may be required for paying
dividends in excess of certain established levels and making affiliated investments.
Merrill Lynch continued to grow its equity capital base in 2005 primarily through net earnings,
additional preferred stock issuances and the net effect of employee stock transactions, partially
offset by common stock repurchases and dividends. Equity capital of $38.1 billion at December 30,
2005 was 12% higher than at December 31, 2004.
During 2005, Merrill Lynch issued $2.1 billion, net of underwriting fees, of floating and fixed
rate, non-cumulative, perpetual preferred stock and at December 30, 2005, Merrill Lynch, Pierce,
Fenner & Smith Incorporated (“MLPF&S”) held approximately $100 million of Merrill Lynch preferred
stock as a result of market-making activities. Refer to Note 11 to the Consolidated Financial
Statements for additional information.
On April 18, 2005, the Board of Directors declared a 25% increase in the regular quarterly dividend
to 20 cents per common share, from 16 cents per common share. On January 18, 2006, the Board of
Directors declared an additional 25% increase in the regular quarterly dividend to 25 cents per
common share.
In 2004 and 2005, Merrill Lynch authorized three share repurchase programs to provide greater
flexibility to return capital to shareholders. For the year ended December 31, 2004, Merrill Lynch
repurchased a cumulative total of 54.0 million shares of common stock at a cost of $3.0 billion,
completing the $2.0 billion repurchase program authorized in February 2004 and utilizing $968
million of the additional $2.0 billion repurchase program authorized in July 2004. For the year
ended December 30, 2005, Merrill Lynch repurchased a cumulative total of 63.1 million shares of
common stock at a cost of $3.7 billion, completing the $2.0 billion repurchase program authorized
in July 2004 and utilizing $2.7 billion of the additional $4.0 billion repurchase program
authorized in April 2005.
On February 26, 2006, the Finance Committee of the Board of Directors authorized an additional $6.0
billion repurchase program.
The table below sets forth the information with respect to purchases made by or on behalf of
Merrill Lynch or any “affiliated purchaser” of Merrill Lynch’s common stock during the year ended
December 30, 2005.
| |
|
|
|
|
|
|
|
|
|
|
|
|
|
|
|
|
| (dollars in millions, except per share amounts) |
|
|
|
|
|
|
|
|
|
Total Number of |
|
|
Approximate Dollar |
|
| |
|
|
|
|
|
|
|
|
|
Shares Purchased |
|
|
Value of Shares |
|
| |
|
Total Number |
|
|
Average |
|
|
as Part of Publicly |
|
|
that May Yet be |
|
| |
|
of Shares |
|
|
Price Paid |
|
|
Announced |
|
|
Purchased Under |
|
| Period |
|
Purchased |
|
|
per Share |
|
|
Program(1) |
|
|
the Program |
|
| |
First Quarter 2005 (Jan. 1 – Apr. 1) |
|
|
|
|
|
|
|
|
|
|
|
|
|
|
|
|
Capital Management Program |
|
|
17,331,900 |
|
|
$ |
59.52 |
|
|
|
17,331,900 |
|
|
$ |
– |
|
Employee Transactions(2) |
|
|
4,531,473 |
|
|
|
59.48 |
|
|
|
N/A |
|
|
|
N/A |
|
| |
|
|
Second Quarter 2005 (Apr. 2 – Jul. 1) |
|
|
|
|
|
|
|
|
|
|
|
|
|
|
|
|
Capital Management Program |
|
|
20,175,400 |
|
|
$ |
54.48 |
|
|
|
20,175,400 |
|
|
$ |
2,901 |
|
Employee Transactions(2) |
|
|
960,678 |
|
|
|
54.62 |
|
|
|
N/A |
|
|
|
N/A |
|
| |
|
|
Third Quarter 2005 (Jul. 2 – Sep. 30) |
|
|
|
|
|
|
|
|
|
|
|
|
|
|
|
|
Capital Management Program |
|
|
14,680,900 |
|
|
$ |
58.26 |
|
|
|
14,680,900 |
|
|
$ |
2,046 |
|
Employee Transactions(2) |
|
|
648,178 |
|
|
|
58.61 |
|
|
|
N/A |
|
|
|
N/A |
|
| |
|
|
Month #10 (Oct. 1 – Nov. 4) |
|
|
|
|
|
|
|
|
|
|
|
|
|
|
|
|
Capital Management Program |
|
|
4,130,000 |
|
|
$ |
61.95 |
|
|
|
4,130,000 |
|
|
$ |
1,790 |
|
Employee Transactions(2) |
|
|
392,260 |
|
|
|
62.57 |
|
|
|
N/A |
|
|
|
N/A |
|
Month #11 (Nov. 5 – Dec. 2) |
|
|
|
|
|
|
|
|
|
|
|
|
|
|
|
|
Capital Management Program |
|
|
2,475,000 |
|
|
$ |
67.32 |
|
|
|
2,475,000 |
|
|
$ |
1,623 |
|
Employee Transactions(2) |
|
|
144,814 |
|
|
|
66.69 |
|
|
|
N/A |
|
|
|
N/A |
|
Month #12 (Dec. 3 – Dec. 30) |
|
|
|
|
|
|
|
|
|
|
|
|
|
|
|
|
Capital Management Program |
|
|
4,275,000 |
|
|
$ |
68.19 |
|
|
|
4,275,000 |
|
|
$ |
1,332 |
|
Employee Transactions(2) |
|
|
104,191 |
|
|
|
68.18 |
|
|
|
N/A |
|
|
|
N/A |
|
| |
|
|
Fourth Quarter 2005 (Oct. 1 – Dec. 30) |
|
|
|
|
|
|
|
|
|
|
|
|
|
|
|
|
Capital Management Program |
|
|
10,880,000 |
|
|
$ |
65.62 |
|
|
|
10,880,000 |
|
|
$ |
1,332 |
|
Employee Transactions(2) |
|
|
641,265 |
|
|
|
64.41 |
|
|
|
N/A |
|
|
|
N/A |
|
| |
|
|
Full Year 2005 (Jan. 1 – Dec. 30) |
|
|
|
|
|
|
|
|
|
|
|
|
|
|
|
|
Capital Management Program |
|
|
63,068,200 |
|
|
$ |
58.67 |
|
|
|
63,068,200 |
|
|
$ |
1,332 |
|
Employee Transactions(2) |
|
|
6,781,594 |
|
|
|
59.17 |
|
|
|
N/A |
|
|
|
N/A |
|
| |
|
|
|
| (1) |
|
Share repurchases under the program were made pursuant to open-market purchases, Rule
10b5-1 plans or privately negotiated transactions as market conditions warranted and at prices
Merrill Lynch deemed appropriate. |
| (2) |
|
Included in the total number of shares purchased are: (1) shares purchased during the period by
participants in the Merrill Lynch 401(k) Savings and
Investment Plan (“401(k)”) and the Merrill Lynch Retirement Accumulation Plan (“RAP”), (2)
shares delivered or attested to in satisfaction of the exercise price by holders of ML & Co.
employee stock options (granted under employee stock compensation plans) and (3) Restricted Shares
withheld (under the terms of grants under employee stock compensation plans) to offset tax
withholding obligations that occur upon vesting and release of Restricted Shares. ML & Co.’s
employee stock compensation plans provide that the value of the shares delivered or attested, or
withheld, shall be the average of the high and low price of ML & Co.’s common stock (Fair Market
Value) on the date the relevant transaction occurs. See Notes 13 and 14 to the Consolidated
Financial Statements for additional information on these plans. |
Major components of the changes in equity capital for 2005 and 2004 are as follows:
| |
|
|
|
|
|
|
|
|
| (dollars in millions) |
|
2005 |
|
|
2004 |
|
| |
Beginning of year |
|
$ |
33,914 |
|
|
$ |
31,523 |
|
Net earnings |
|
|
5,116 |
|
|
|
4,436 |
|
Issuance of preferred stock, net of redemptions and repurchases |
|
|
2,043 |
|
|
|
205 |
|
Common and preferred stock dividends |
|
|
(777 |
) |
|
|
(643 |
) |
Common stock repurchases |
|
|
(3,700 |
) |
|
|
(2,968 |
) |
Net effect of employee stock transactions and other(1) |
|
|
1,548 |
|
|
|
1,361 |
|
| |
|
|
End of year |
|
$ |
38,144 |
|
|
$ |
33,914 |
|
| |
|
|
|
| (1) |
|
Includes effect of accumulated other comprehensive loss and other items. |
46
Merrill Lynch 2005 Annual Report
Balance Sheet Leverage
Asset-to-equity leverage ratios are commonly used to assess a company’s capital adequacy. When
assessing its capital adequacy, Merrill Lynch considers the risk profiles of the assets, the impact
of hedging, off-balance sheet exposures, operational risk and other considerations. As leverage
ratios are not risk sensitive, Merrill Lynch does not rely on them as a measure of capital
adequacy.
Merrill Lynch believes that a leverage ratio adjusted to exclude certain assets considered to have
low risk profiles and assets in customer accounts financed primarily by customer liabilities
provides a more meaningful measure of balance sheet leverage in the securities industry than an
unadjusted ratio. Adjusted assets are calculated by reducing total assets by (1) securities
financing transactions and securities received as collateral less trading liabilities net of
contractual agreements and (2) segregated cash and securities and separate account assets.
The following table provides calculations of Merrill Lynch’s leverage ratios at December 30, 2005
and December 31, 2004:
| |
|
|
|
|
|
|
|
|
| (dollars in millions) |
|
2005 |
|
|
2004 |
|
| |
Total assets |
|
$ |
681,015 |
|
|
$ |
628,098 |
|
Less: Receivables under resale agreements |
|
|
163,021 |
|
|
|
78,853 |
|
Receivables under securities borrowed transactions |
|
|
92,484 |
|
|
|
94,498 |
|
Securities received as collateral |
|
|
16,808 |
|
|
|
11,903 |
|
Add: Trading liabilities, at fair value, excluding contractual agreements |
|
|
60,178 |
|
|
|
63,859 |
|
| |
|
|
Sub-total |
|
|
468,880 |
|
|
|
506,703 |
|
Less: Segregated cash and securities balances |
|
|
11,949 |
|
|
|
17,784 |
|
Separate account assets |
|
|
16,185 |
|
|
|
18,641 |
|
| |
|
|
Adjusted assets |
|
|
440,746 |
|
|
|
470,278 |
|
Less: Goodwill and other intangible assets |
|
|
6,035 |
|
|
|
6,162 |
|
| |
|
|
Tangible adjusted assets |
|
$ |
434,711 |
|
|
$ |
464,116 |
|
|
|
|
|
|
|
|
|
|
Stockholders’ equity |
|
$ |
35,600 |
|
|
$ |
31,370 |
|
Long-term debt issued to TOPrSSM partnerships, net of related investments(1) |
|
|
2,544 |
|
|
|
2,544 |
|
| |
|
|
Equity capital |
|
$ |
38,144 |
|
|
$ |
33,914 |
|
Tangible equity capital(2) |
|
$ |
32,109 |
|
|
$ |
27,752 |
|
Leverage ratio(3) |
|
|
17.9x |
|
|
|
18.5x |
|
Adjusted leverage ratio(4) |
|
|
11.6x |
|
|
|
13.9x |
|
Tangible adjusted leverage ratio(5) |
|
|
13.5x |
|
|
|
16.7x |
|
| |
|
|
|
| (1) |
|
Due to the perpetual nature of TOPrSSM and other considerations, Merrill Lynch
views the long-term debt issued to TOPrSSM partnerships (net of related investments) as
a component of equity capital. However, the Long-term debt issued to TOPrSSM
partnerships is reported as a liability for accounting purposes.
TOPrSSM related investments were $548 million at December 30, 2005 and December 31,
2004. |
| (2) |
|
Equity capital less goodwill and other intangible assets. |
| (3) |
|
Total assets divided by equity capital. |
| (4) |
|
Adjusted assets divided by equity capital. |
| (5) |
|
Tangible adjusted assets divided by tangible equity capital. |
Funding
Liquidity Risk Management
Merrill Lynch seeks to assure liquidity across market cycles and through periods of financial
stress. Merrill Lynch’s primary liquidity objective is to ensure that all unsecured debt
obligations maturing within one year can be repaid without issuing new unsecured debt or requiring
liquidation of business assets. Toward this goal, Merrill Lynch has established a set of liquidity
practices that are outlined below. In addition, Merrill Lynch maintains a contingency funding plan
that outlines actions that would be taken in the event of a funding disruption.
Maintain sufficient long-term capital: Merrill Lynch regularly reviews its mix of assets,
liabilities and commitments to ensure the maintenance of adequate long-term capital sources to meet
long-term capital requirements. Merrill Lynch’s long-term capital sources include equity capital,
long-term debt obligations and certain deposit liabilities in banking subsidiaries which are
considered by management to be long-term or stable in nature.
At December 30, 2005 and December 31, 2004, Merrill Lynch’s long-term capital was comprised of the
following:
| |
|
|
|
|
|
|
|
|
| |
December 30, |
|
December 31, |
|
| (dollars in billions) |
2005 |
|
2004 |
|
| |
Equity capital |
|
$ |
38.1 |
|
|
$ |
33.9 |
|
Long-term debt obligations(1) |
|
|
99.3 |
|
|
|
89.2 |
|
Deposit liabilities(2) |
|
|
69.9 |
|
|
|
73.7 |
|
| |
|
|
Total long-term capital |
|
$ |
207.3 |
|
|
$ |
196.8 |
|
| |
|
|
|
| (1) |
|
Total long-term borrowings less (1) the current portion and (2) other subsidiary financing
— non-recourse. Borrowings that mature in more than one year, but contain provisions whereby the
holder has the option to redeem the obligations within one year, are reflected as current portion
of long-term borrowings and are not included in long-term capital. Management believes, however,
that a portion of such borrowings will remain outstanding beyond their earliest redemption date. |
| (2) |
|
Includes $60.2 billion and $9.7 billion of deposits in U.S. and non-U.S. banking subsidiaries,
respectively, in 2005, and $65.4 billion and $8.3 billion of deposits, respectively, in 2004 that
are considered by management to be long-term. |
The following items are generally financed with long-term capital:
| • |
|
The portion of assets that cannot be self-funded in the secured financing markets, considering
stressed market conditions, including long-term, illiquid assets such as certain loans, goodwill
and other intangible assets and fixed assets; |
| |
| • |
|
Subsidiaries’ regulatory capital; |
| |
| • |
|
Collateral on derivative contracts that may be required in the event of changes in Merrill
Lynch’s ratings or movements in underlying instruments; and |
| |
| • |
|
Portions of commitments to extend credit based on management’s estimate of the probability of
drawdown. |
At December 30, 2005, Merrill Lynch’s long-term capital sources of $207.3 billion exceeded Merrill
Lynch’s estimated long-term capital requirements.
In assessing the appropriateness of its long-term capital, Merrill Lynch seeks to: (1) ensure
sufficient matching of its assets based on factors such as holding period, contractual maturity and
regulatory restrictions and (2) limit the amount of liabilities maturing in any particular period.
Merrill Lynch also considers circumstances that might cause contingent funding obligations,
including early repayment of debt.
The following chart presents Merrill Lynch’s long-term borrowings maturity profile as of December
30, 2005 (quarterly for two years and annually thereafter):
|
|
|
| (1) |
|
Extendibles are debt instruments with an extendible maturity date. Unless debt holders
instruct Merrill Lynch to redeem their debt with at least a one-year notification period, the
maturity date of these instruments is automatically extended. Extendibles are included in long-term
borrowings if the earliest maturity date is at least one year away. Based on past experience, the
majority of Merrill Lynch’s extendibles are expected to remain outstanding beyond their earliest
maturity date. |
At December 30, 2005, senior debt issued by ML & Co. or by subsidiaries and guaranteed by ML &
Co. totaled $124.6 billion. Except for the $2.3 billion of zero-coupon contingent convertible debt
(Liquid Yield Option™ notes or “LYONs®") that were outstanding at December 30, 2005,
senior debt obligations issued by ML & Co. and senior debt issued by subsidiaries and guaranteed by
ML & Co. do not contain provisions that could, upon an adverse change in ML & Co.’s credit rating,
financial ratios, earnings, cash flows, or stock price, trigger a requirement for an early payment,
additional collateral support, changes in terms, acceleration of maturity, or the creation of an
additional financial obligation. Refer to Note 9 to the Consolidated Financial Statements for
additional information.
Included in its debt obligations are structured notes issued by Merrill Lynch with returns linked
to other debt or equity securities, indices, or currencies. Merrill Lynch could be required to
immediately settle certain structured note obligations for cash or other securities
48
Merrill Lynch 2005 Annual Report
under certain circumstances, which is taken into account for liquidity planning purposes.
Merrill Lynch typically hedges these notes with positions in derivatives and/or in the underlying
instruments.
Merrill Lynch’s bank subsidiaries that take deposits have liquidity policies as well as guidelines
and practices in place aimed at ensuring sufficient liquidity is available at each bank to meet
deposit obligations under stressed market conditions.
Maintain sufficient funding to repay short-term obligations: The main alternative funding sources
to unsecured borrowings are repurchase agreements, securities loaned, other secured borrowings,
which require pledging unencumbered securities held for trading or investment purposes, or
collateral and proceeds from maturing loans and other assets. Nonetheless, a key funding assumption
is accessibility to a repurchase market for highly rated government, agency and certain other
securities.
Merrill Lynch maintains a liquidity portfolio of U.S. Government and agency obligations and other
instruments of high credit quality that is funded with debt with a maturity greater than one year.
The carrying value of this portfolio, net of related hedges, was $18.0 billion and $14.9 billion at
December 30, 2005 and December 31, 2004, respectively. ML & Co. also maintained cash and cash
equivalents, investments in short-term money market mutual funds, and certain highly liquid
unencumbered securities of $7.4 billion and $6.9 billion at December 30, 2005 and December 31,
2004, respectively.
In addition to its liquidity portfolio and cash balances, Merrill Lynch monitors the extent to
which other unencumbered assets are available to ML & Co. as a source of funds, considering that
some subsidiaries are restricted in their ability to upstream unencumbered assets to ML & Co. At
December 30, 2005, unencumbered assets, including amounts that may be restricted, were in excess of
$136 billion, including the carrying value of the liquidity portfolio and cash balances.
For liquidity planning purposes, Merrill Lynch considers as short-term debt obligations: (i)
commercial paper and other short-term borrowings and (ii) the current portion of long-term
borrowings. At December 30, 2005 and December 31, 2004, these short-term obligations are as
follows.
| |
|
|
|
|
|
|
|
|
| |
December 30, |
|
December 31, |
|
| (dollars in billions) |
2005 |
|
2004 |
|
| |
Commercial paper and other short-term borrowings |
|
$ |
3.9 |
|
|
$ |
4.0 |
|
Current portion of long-term borrowings |
|
|
22.8 |
|
|
|
21.1 |
|
| |
|
|
Total short-term obligations |
|
$ |
26.7 |
|
|
$ |
25.1 |
|
| |
Certain long-term borrowing agreements contain provisions whereby the borrowings are redeemable
at the option of the holder at specified dates prior to maturity. Maturities of such borrowings are
reported based on their put dates, rather than their contractual maturities. Management believes,
however, that a portion of such borrowings will remain outstanding beyond their earliest redemption
date.
At December 30, 2005, Merrill Lynch’s liquidity portfolio, cash balances, maturing short-term
assets and other unencumbered assets, some of which may be held in regulated entities but which
management believes may be reasonably upstreamed to ML & Co., were more than the amount that would
be required to repay Merrill Lynch’s short-term obligations and other contingent cash outflows.
In addition to the aforementioned sources of funding available to meet short-term obligations,
Merrill Lynch maintains credit facilities that are available to cover immediate funding needs.
Merrill Lynch replaced the unsecured bank facility that totaled $3.0 billion at December 31, 2004
with a new committed, multi-currency, unsecured bank credit facility that totaled $4.0 billion at
December 30, 2005. This 364-day facility permits borrowings by ML & Co. and select subsidiaries and
expires in June 2006. The facility includes a one year term-out feature that allows ML & Co., at
its option, to extend borrowings under the facility for a further year beyond the expiration date
in June 2006. At December 30, 2005 there were no borrowings outstanding under this credit facility,
although Merrill Lynch borrows regularly from this facility.
In 2005, Merrill Lynch added two committed, secured credit facilities which totaled $5.5 billion at
December 30, 2005. The facilities expire in May 2006 and December 2006 respectively. Both
facilities include a one year term-out option that allows ML & Co. to extend borrowings under the
facilities for a further year beyond their respective expiration dates. The secured facilities
permit borrowings by ML & Co. and select subsidiaries, secured by a broad range of collateral. At
December 30, 2005 there were no borrowings outstanding under either facility.
In addition, Merrill Lynch maintains a committed, secured credit facility with a financial
institution that totaled $6.25 billion at December 30, 2005 and December 31, 2004. The secured
facility may be collateralized by government obligations eligible for pledging. The facility
expires in 2014, but may be terminated with at least nine months notice by either party. At
December 30, 2005 and December 31, 2004, there were no borrowings outstanding under this facility.
Concentrate unsecured financing at ML & Co.: ML & Co. is the primary issuer of all unsecured,
non-deposit financing instruments that are used primarily to fund assets in subsidiaries, some of
which are regulated. The benefits of this strategy are greater control, reduced financing costs,
wider name recognition by creditors, and greater flexibility to meet variable funding requirements
of subsidiaries. Where regulations, time zone differences, or other business considerations make
this impractical, some subsidiaries enter into their own financing arrangements.
While Merrill Lynch concentrates excess funds at ML & Co., Merrill Lynch recognizes that regulatory
restrictions may limit the free flow of funds from subsidiaries where assets are held to ML & Co.
and also between subsidiaries. For example, a portion of deposits held by Merrill Lynch bank
subsidiaries funds securities that can be sold or pledged to provide immediate liquidity for the
banks. In addition, a portion of deposits are utilized to fund the long-term capital requirements
of the banks. However, there are regulatory restrictions on the use of this liquidity for ML & Co.
and non-bank affiliates of Merrill Lynch. Merrill Lynch takes these and other restrictions into
consideration when evaluating the liquidity of individual legal entities and ML & Co. See Note 9 to
the Consolidated Financial Statements for more information on borrowings.
Diversify unsecured funding sources: Merrill Lynch strives to continually expand and globally
diversify its funding programs, its markets, and its investor and creditor base to minimize
reliance on any one investor base or region. Merrill Lynch diversifies its borrowings by
maintaining various limits, including a limit on the amount of commercial paper held by a single
investor. Merrill Lynch benefits by distributing a significant portion of its debt issuances
through its own sales force to a large, diversified global client base. Merrill Lynch also makes
markets buying and selling its debt instruments.
Adhere to prudent governance processes: In order to ensure that both daily and strategic funding
activities are appropriate and subject to senior management review and control, liquidity
management is reviewed in Asset/Liability Committee meetings with Treasury management and is
presented to Merrill Lynch’s Risk Oversight Committee (“ROC”), ML & Co. executive management and
the Finance Committee of the Board of Directors. Merrill Lynch also manages the growth and
composition of its assets and sets limits on the level of unsecured funding at any time.
Asset and Liability Management
Merrill Lynch routinely issues debt in a variety of maturities and currencies to achieve low cost
financing and an appropriate liability maturity profile. The cost and availability of unsecured
funding may be impacted by general market conditions or by matters specific to the financial
services industry or Merrill Lynch.
Merrill Lynch uses derivative transactions to more closely match the duration of borrowings to the
duration of the assets being funded, thereby enabling interest rate risk to be managed within
limits set by the Global Liquidity and Risk Management Group (“GLRM”). Interest rate swaps also
serve to adjust Merrill Lynch’s interest expense and effective borrowing rate principally to
floating rate. Merrill Lynch also enters into currency swaps to hedge assets that are not financed
through debt issuance in the same currency. Investments in subsidiaries in non-U.S. dollar
currencies are also hedged in whole or in part to mitigate translation adjustments in the
accumulated other comprehensive loss. See Notes 1 and 6 to the Consolidated Financial Statements
for further information.
Credit Ratings
The cost and availability of unsecured funding are also impacted by credit ratings. In addition,
credit ratings are important when competing in certain markets and when seeking to engage in
long-term transactions including OTC derivatives. Factors that influence Merrill Lynch’s credit
ratings include the credit rating agencies’ assessment of the general operating environment,
relative positions in the markets in which Merrill Lynch competes, reputation, level and volatility
of earnings, corporate governance, risk management policies, liquidity and capital management.
The senior debt and preferred stock ratings of ML & Co. and the ratings of preferred securities
issued by subsidiaries on February 27, 2006 are as follows. Rating agencies express outlooks from
time to time on these ratings. Each of these ratings agencies describes its current outlook as
stable, except for Standard & Poor’s whose outlook on ML & Co. was raised to positive from stable
on January 23, 2006.
| |
|
|
|
|
|
|
|
|
| |
|
Senior Debt |
|
|
Preferred |
|
| Rating Agency |
|
Ratings |
|
|
Stock Ratings |
|
| |
Dominion Bond Rating Service Ltd. |
|
AA (low) |
|
|
Not Rated |
|
Fitch Ratings |
|
AA– |
|
|
|
A+ |
|
Moody’s Investors Service, Inc. |
|
Aa3 |
|
|
|
A2 |
|
Rating & Investment Information, Inc. (Japan) |
|
AA |
|
|
|
A+ |
|
Standard & Poor’s Ratings Services |
|
|
A+ |
|
|
|
A– |
|
| |
50
Merrill Lynch 2005 Annual Report
In connection with certain OTC derivatives transactions and other trading agreements, Merrill
Lynch could be required to provide additional collateral to certain counterparties in the event of
a downgrade of the senior debt ratings of ML & Co. At December 30, 2005, the amount of additional
collateral that would be required for such derivatives transactions and trading agreements was
approximately $360 million in the event of a one-notch downgrade and approximately $860 million in
the event of a two-notch downgrade of ML & Co.’s long term senior debt credit rating. Merrill Lynch
considers additional collateral on derivative contracts that may be required in the event of
changes in ML & Co.’s ratings as part of its liquidity management practices.
Risk Management
Risk Management Philosophy
Risk-taking is integral to many of the core businesses in which Merrill Lynch operates. In the
course of conducting its business operations, Merrill Lynch is exposed to a variety of risks
including market, credit, liquidity, operational and other risks that are material and require
comprehensive controls and ongoing oversight. Senior managers of Merrill Lynch’s core businesses
are responsible and accountable for management of the risks associated with their business
activities. In addition, GLRM includes the independent control groups which manage market risk,
credit risk, liquidity risk and operational risk, among other functions. GLRM falls under the
management responsibility of the Deputy Chief Financial Officer and ultimately the Chief Financial
Officer. Along with other control units these disciplines work to ensure risks are properly
identified, measured, monitored, and managed throughout Merrill Lynch. To accomplish this, Merrill
Lynch has established a risk management process, which includes:
| • |
|
A formal risk governance organization that defines the oversight process and its components; |
| |
| • |
|
A regular review of the risk management process by the Audit Committee of the Board of Directors
(“the Audit Committee”); |
| |
| • |
|
Clearly defined risk management policies and procedures supported by a rigorous analytical
framework; |
| |
| • |
|
Communication and coordination among the business, executive management, and risk functions while
maintaining strict segregation of responsibilities, controls, and oversight; and |
| |
| • |
|
Clearly articulated risk tolerance levels as defined by the ROC, which are regularly reviewed to
ensure that Merrill Lynch’s risk-taking is consistent with its business strategy, capital
structure, and current and anticipated market conditions. |
The risk management and control process ensures that Merrill Lynch’s risk tolerance is well-defined
and understood by the firm’s businesses as well as by its executive management. Other groups,
including Corporate Audit, Finance, and the Office of General Counsel, interact with GLRM to
establish and maintain this overall risk management control process. While no risk management
system can ever be absolutely complete, the goal of these control groups is to make certain that
risk-related losses occur within acceptable, predefined levels.
Risk Governance Structure
Merrill Lynch’s risk governance structure is comprised of the Audit Committee and the Finance
Committee of the Board of Directors, the Executive Committee (a group composed of Merrill Lynch
executive management), the ROC, the business units, GLRM, and various corporate governance
committees.
The Audit Committee, which is comprised entirely of independent directors, approves the ROC charter
and has authorized the ROC to establish Merrill Lynch’s risk management policies. The ROC reports
to the Executive Committee and has provided the Audit Committee with regular market and credit risk
updates during 2005. The Finance Committee, which is also comprised entirely of independent
directors, is responsible for reviewing Merrill Lynch’s policies and procedures for managing
exposure to market, credit and liquidity risk, including framework limits for both market and
credit risk, Value at Risk (“VaR”), liquidity and funding analyses, and/or other relevant models.
The ROC establishes risk tolerance levels for the firm and authorizes material changes in Merrill
Lynch’s risk profile and also ensures that the risks assumed by Merrill Lynch are managed within
these tolerance levels and verifies that Merrill Lynch has implemented appropriate policies for the
effective management of risks. The Executive Committee must approve risk levels and all substantive
changes to risk policies proposed by the ROC. The Executive Committee pays particular attention to
risk concentrations and liquidity concerns.
The ROC is comprised of the heads of the key business segments and senior business and control
managers and is chaired by the Chief Financial Officer. It oversees Merrill Lynch’s risk-taking and
ensures that the business units create and implement processes to identify, measure, and monitor
their risks. Additionally, the ROC assists the Executive Committee in determining risk tolerance
levels for the firm’s business units and monitors the activities of Merrill Lynch’s corporate
governance committees, reporting significant issues and transactions to the Executive Committee and
the Audit Committee.
The ROC also reports substantive Market and Credit Risk Framework Limits changes to the Audit
Committee. These Framework Limits are reviewed and approved annually by the Executive Committee,
which must also approve certain intra-year changes. During 2005, the risk parameters that define
these Frameworks were reviewed by the Audit Committee; currently, they are reviewed by the Finance
Committee in the context of its evaluation of Market and Credit Risk exposures. Risk Framework
exceptions and violations are reported and investigated at pre-defined and appropriate levels of
management.
Various other governance committees exist to create policy, review activity, and ensure that new
and existing business initiatives remain within established risk tolerance levels. Representatives
of the principal independent control functions participate as voting members of these committees.
The overall effectiveness of Merrill Lynch’s risk processes and policies can be seen on a broader
level when analyzing daily net trading revenues over time. Merrill Lynch’s policies and procedures
of monitoring and controlling risk, combined with the businesses’ focus on customer
order-flow-driven revenues and selective proprietary positioning have helped Merrill Lynch to
reduce earnings volatility within its trading portfolios. While no guarantee can be given regarding
future earnings volatility, Merrill Lynch will continue to pursue policies and procedures that
assist the firm in measuring and monitoring its risks. The histogram below shows the distribution
of daily net revenues from Merrill Lynch’s trading businesses (principal transactions and net
interest profit) for 2005.
Market Risk
Market risk is defined as the potential change in value of financial instruments caused by
fluctuations in interest rates, exchange rates, equity and commodity prices, credit spread, and/or
other risks. The Market Risk Framework defines and communicates Merrill Lynch’s market risk
tolerance and broad overall limits across the firm by defining and constraining exposure to
specific asset classes, market risk factors and VaR. VaR is a statistical measure of the potential
loss in the fair value of a portfolio due to adverse movements in underlying risk factors.
The Market Risk Management Group is responsible for approving the products and markets in which
Merrill Lynch’s major business units and functions will transact and take risk. Moreover, it is
responsible for identifying the risks to which these business units will be exposed in these
approved products and markets. Market Risk Management uses a variety of quantitative methods to
assess the risk of Merrill Lynch’s positions and portfolios. In particular, Market Risk Management
quantifies the sensitivities of Merrill Lynch’s current portfolios to changes in market variables.
These sensitivities are then utilized in the context of historical data to estimate earnings and
loss distributions that Merrill Lynch’s current portfolios would have incurred throughout the
historical period. From these distributions, Market Risk Management derives a number of useful risk
statistics, including VaR.
The VaR disclosed in the accompanying table is an estimate of the amount that Merrill Lynch’s
current trading portfolios could lose with a specified degree of confidence, over a given time
interval. The VaR for Merrill Lynch’s overall portfolios is less than the sum of the VaRs for
individual risk categories because movements in different risk categories occur at different times
and, historically, extreme movements have not occurred in all risk categories simultaneously. The
difference between the sum of the VaRs for individual risk categories and the VaR calculated for
all risk categories is shown in the following table and may be viewed as a measure of the
diversification within Merrill Lynch’s portfolios. Market Risk Management believes that the
tabulated risk measures provide broad guidance as to the amount Merrill Lynch could lose in future
periods, and Market Risk Management works continually to improve its measurement and the
methodology of the firm’s VaR. However, the calculation of VaR requires numerous assumptions and
thus VaR should not be viewed as a precise measure of risk. In addition, VaR is not intended to
capture worst case scenario losses.
To complement VaR and in recognition of its inherent limitations, Merrill Lynch uses a number of
additional risk measurement methods and tools as part of its overall market risk management
process. These include stress testing and event risk analysis, which examine portfolio behavior
under significant adverse market conditions, including scenarios that would result in material
losses for the firm.
52
Merrill Lynch 2005 Annual Report
To calculate VaR, Market Risk Management aggregates sensitivities to market risk factors and
combines them with a database of historical market factor movements to simulate a series of profits
and losses. The level of loss that is exceeded in that series 5% of the time is used as the
estimate for the 95% confidence level VaR. The overall total VaR amounts are presented across major
risk categories, which include exposure to volatility risk found in certain products, such as
options.
The table that follows presents Merrill Lynch’s average and year-end VaR for trading instruments
for 2005 and 2004. Additionally, high and low VaR for 2005 is presented independently for each risk
category and overall. Because high and low VaR numbers for these risk categories may have occurred
on different days, high and low numbers for diversification benefit would not be meaningful.
| |
|
|
|
|
|
|
|
|
|
|
|
|
|
|
|
|
|
|
|
|
|
|
|
|
| |
|
|
|
|
Daily |
|
|
|
|
|
|
|
|
|
|
|
|
|
Daily |
|
| |
Year-end |
|
Average |
|
High |
|
Low |
|
Year-end |
|
Average |
|
| (dollars in millions) |
2005 |
|
2005 |
|
2005 |
|
2005 |
|
2004 |
|
2004 |
|
| |
Trading Value-at-Risk(1) |
|
|
|
|
|
|
|
|
|
|
|
|
|
|
|
|
|
|
|
|
|
|
|
|
Interest rate and credit spread |
|
$ |
41 |
|
|
$ |
40 |
|
|
$ |
56 |
|
|
$ |
26 |
|
|
$ |
39 |
|
|
$ |
31 |
|
Equity |
|
|
16 |
|
|
|
12 |
|
|
|
29 |
|
|
|
3 |
|
|
|
5 |
|
|
|
9 |
|
Commodity |
|
|
6 |
|
|
|
8 |
|
|
|
15 |
|
|
|
4 |
|
|
|
8 |
|
|
|
2 |
|
Currency |
|
|
2 |
|
|
|
3 |
|
|
|
6 |
|
|
|
– |
|
|
|
2 |
|
|
|
3 |
|
| |
|
|
|
|
|
65 |
|
|
|
63 |
|
|
|
|
|
|
|
|
|
|
|
54 |
|
|
|
45 |
|
Diversification benefit |
|
|
(25 |
) |
|
|
(25 |
) |
|
|
|
|
|
|
|
|
|
|
(20 |
) |
|
|
(17 |
) |
| |
|
|
Overall(2) |
|
$ |
40 |
|
|
$ |
38 |
|
|
$ |
61 |
|
|
$ |
21 |
|
|
$ |
34 |
|
|
$ |
28 |
|
| |
|
|
|
| (1) |
|
Based on a 95% confidence level and a one-day holding period. |
| (2) |
|
Overall trading VaR using a 95% confidence level and a one-week holding period was $77 million
and $62 million at year-end 2005 and 2004, respectively. |
Trading VaR increased during 2005 due to increased interest rate and credit spread and equity
exposures. If market conditions are favorable, Merrill Lynch may increase its risk taking in a
number of its businesses, including certain proprietary trading activities and principal
investments. These activities provide revenue opportunities while also increasing the loss
potential under certain market conditions. GLRM monitors these risk levels on a daily basis to
ensure they remain within corporate risk guidelines and tolerance levels.
Non-Trading Market Risk
Non-trading market risk includes the risks associated with certain non-trading activities,
including investment securities, securities financing transactions and equity investments. Also
included are the risks related to treasury funding activities. Risks related to lending activities
are covered in the Credit Risk section that follows.
The primary market risk of non-trading investment securities, and non-trading repurchase and
reverse repurchase agreements is expressed as sensitivity to changes in the general level of credit
spreads which are defined as the differences in the yields on debt instruments from relevant
LIBOR/Swap rates. Non-trading investment securities include securities available-for-sale and
held-to-maturity as well as investments of insurance subsidiaries. At year-end 2005, the total
credit spread sensitivity of these instruments is a pre-tax loss of $19 million in fair market
value for an increase of one basis point, which is one one-hundredth of a percent, in credit
spreads, compared to a pre-tax loss of $20 million at year-end 2004. This change in fair market
value is a measurement of economic risk which may differ significantly in magnitude and timing from
the actual profit or loss that would be realized under generally accepted accounting principles.
The interest rate risk associated with the foregoing non-trading positions, together with treasury
funding activities is expressed as sensitivity to changes in the general level of interest rates.
Treasury funding activities include LYONs® and TOPrSSM and other long-term
debt together with interest rate hedges. At year-end 2005, the net interest rate sensitivity of
these positions is a pre-tax loss in fair market value of $1 million for a parallel one basis point
increase in interest rates across all yield curves, compared to negligible profit or loss for a
parallel one basis point increase at year-end 2004. This change in fair market value is a
measurement of economic risk which may differ significantly in magnitude and timing from the actual
profit or loss that would be realized under generally accepted accounting principles.
Other non-trading equity investments include direct private equity interests, private equity fund
investments, hedge fund interests, and certain direct and indirect real estate investments. These
investments are broadly sensitive to general price levels in the equity or commercial real estate
markets as well as to specific business, financial and credit factors which influence the
performance and valuation of each investment uniquely. Refer to Note 5 to the Consolidated
Financial Statements for additional information on these investments.
Credit Risk
Credit risk is defined as the potential for loss that can occur as a result of an individual,
counterparty or issuer being unable or unwilling to honor its contractual obligations to Merrill
Lynch. The Credit Risk Framework is the primary tool used to communicate firmwide limits and
monitor exposure by constraining the magnitude and tenor of exposure to counterparty and issuer
families. Additionally, country risk limits ensure that total aggregate exposure across all
counterparties and issuers (including sovereign entities) for a given country do not exceed
predefined tolerance levels.
The Global Credit and Commitments Group assesses the creditworthiness of existing and potential
individual clients, institutional counterparties and issuers, and determines firmwide credit risk
levels within the Credit Risk Framework among other tools. The group reviews and monitors specific
transactions as well as portfolio and other credit risk concentrations both within and across
businesses. The group is also responsible for ongoing monitoring of credit quality and limit
compliance and actively works with all the business units of Merrill Lynch to manage and mitigate
credit risk.
The Global Credit and Commitments Group uses a variety of methodologies to set limits on exposure
resulting from an individual, counterparty or issuer failing to fulfill its contractual
obligations. The group performs analysis in the context of industrial, regional, and global
economic trends and incorporates portfolio and concentration effects when determining tolerance
levels. Credit risk limits take into account measures of both current and potential exposure and
are set and monitored by broad risk type, product type, and maturity. Credit risk mitigation
techniques include, where appropriate, the right to require initial collateral or margin, the right
to terminate transactions or to obtain collateral should unfavorable events occur, the right to
call for collateral when certain exposure thresholds are exceeded, the right to call for third
party guarantees and the purchase of credit default protection. With senior management involvement,
Merrill Lynch conducts regular portfolio reviews, monitors counterparty creditworthiness, and
evaluates potential transaction risks with a view toward early problem identification and
protection against unacceptable credit-related losses. In 2005, the Global Credit and Commitments
Group continued investing additional resources to enhance its methods and policies in order to
assist in the management of Merrill Lynch’s credit risk.
Senior members of the Global Credit and Commitments Group chair various commitment committees with
membership across business and support units. These committees review and approve commitments,
underwritings and syndication strategies related to debt, syndicated loans, equity, real estate and
asset based finance among other products and activities.
Commercial Lending
Commercial lending conducted by Merrill Lynch consists primarily of corporate and institutional
lending, asset-based finance, commercial finance, and commercial real estate related activities. In
evaluating certain potential commercial lending transactions, Merrill Lynch utilizes a risk
adjusted return on capital model in addition to other methodologies. Corporate and institutional
lending facilities are commonly used by clients for general corporate purposes, backup liquidity
lines, bridge financings, and acquisition related activities. Corporate and institutional loans are
often syndicated down from original levels through assignments and participations to unaffiliated
third parties. While these facilities may be supported by credit enhancing arrangements such as
property liens or claims on operating assets, repayment is generally expected through other sources
including cash flow and/or recapitalization. The Global Credit and Commitments Group’s Loan
Execution and Management Division selectively hedges exposure in the corporate and institutional
lending portfolio by purchasing single name and basket credit default swaps as well as evaluating
and selectively executing loan sales in the secondary markets.
Asset-based finance facilities are typically secured by financial assets such as mortgages, auto
loans, leases, credit card and other receivables. Clients often use these facilities for the
origination and purchase of assets during a warehousing period leading up to securitization. Credit
assessment for these facilities relies primarily on the amount, asset type, quality, and liquidity
of the supporting collateral.
Commercial finance activities consist of corporate finance, healthcare finance, equipment finance
and commercial real estate lending to qualifying business clients. These facilities are
substantially secured by liens on property, plant, and equipment, third party guarantees or other
similar arrangements. Other commercial real estate related activities consist of commercial
mortgage originations and other extensions of credit connected to the financing of commercial
properties or portfolios of properties. These exposures may be reduced or eliminated through
third-party syndications or securitizations. Assessment of creditworthiness and credit approval is
highly dependent upon the anticipated performance of the underlying property and/or associated cash
flows.
The following table presents a distribution of commercial loans and closed commitments for year-end
2005, gross of allowances for loan losses and reserves, without considering the impact of purchased
credit protection. Closed commitments represent the unfunded portion of existing commitments
available for draw down and do not include contingent commitments extended but not yet closed. As
of December 30, 2005, Merrill Lynch’s largest commercial lending industry concentration was to
financial institutions including banks, insurance companies, finance companies, investment managers
and other diversified financial institutions. Commercial borrowers
54
Merrill Lynch 2005 Annual Report
were predominantly domiciled in the United States or had principal operations tied to the
United States or its economy. The majority of all outstanding commercial loan balances had a
remaining maturity of less than three years. Additional detail on Merrill Lynch’s commercial
lending related activities can be found in Note 8 to the Consolidated Financial Statements. The
following table depicts Merrill Lynch’s commercial lending balances by credit quality, industry and
country at December 30, 2005.
| |
|
|
|
|
|
|
|
|
|
|
|
|
|
|
|
|
| (dollars in millions) |
|
|
|
|
|
|
| By Credit Quality(1) |
|
Loans |
|
|
Closed Commitments |
|
| |
| |
|
Secured |
|
Unsecured |
|
|
Secured |
|
Unsecured |
|
| |
|
|
|
|
Investment grade |
|
$ |
19,993 |
|
|
$ |
3,283 |
|
|
$ |
11,170 |
|
|
$ |
22,061 |
|
Non-investment grade |
|
|
16,578 |
|
|
|
869 |
|
|
|
8,083 |
|
|
|
980 |
|
| |
|
|
|
|
Total |
|
$ |
36,571 |
|
|
$ |
4,152 |
|
|
$ |
19,253 |
|
|
$ |
23,041 |
|
| |
|
|
|
| (1) |
|
Based on credit rating agency equivalent of internal credit ratings. |
| |
|
|
|
|
|
|
|
|
|
|
|
|
|
|
|
|
| By Industry |
|
Loans |
|
|
Closed Commitments |
|
| |
| |
|
Secured |
|
Unsecured |
|
|
Secured |
|
Unsecured |
|
| |
|
|
|
|
Financial Institutions |
|
|
44 |
% |
|
|
15 |
% |
|
|
49 |
% |
|
|
31 |
% |
Consumer Goods and Services |
|
|
16 |
|
|
|
44 |
|
|
|
17 |
|
|
|
21 |
|
Real Estate |
|
|
10 |
|
|
|
17 |
|
|
|
6 |
|
|
|
3 |
|
Energy/Utilities |
|
|
1 |
|
|
|
5 |
|
|
|
2 |
|
|
|
17 |
|
Technology/Media/Telecommunications |
|
|
2 |
|
|
|
11 |
|
|
|
3 |
|
|
|
12 |
|
Industrial/Manufacturing Goods and Services |
|
|
3 |
|
|
|
3 |
|
|
|
7 |
|
|
|
9 |
|
All Other |
|
|
24 |
|
|
|
5 |
|
|
|
16 |
|
|
|
7 |
|
| |
|
|
|
|
Total |
|
|
100 |
% |
|
|
100 |
% |
|
|
100 |
% |
|
|
100 |
% |
| |
| |
|
|
|
|
|
|
|
|
|
|
|
|
|
|
|
|
| By Country |
|
Loans |
|
|
Closed Commitments |
|
| |
| |
|
Secured |
|
Unsecured |
|
|
Secured |
|
Unsecured |
|
| |
|
|
|
|
United States |
|
|
69 |
% |
|
|
73 |
% |
|
|
83 |
% |
|
|
75 |
% |
United Kingdom |
|
|
14 |
|
|
|
5 |
|
|
|
6 |
|
|
|
6 |
|
Germany |
|
|
3 |
|
|
|
– |
|
|
|
– |
|
|
|
8 |
|
France |
|
|
2 |
|
|
|
– |
|
|
|
2 |
|
|
|
1 |
|
Canada |
|
|
– |
|
|
|
2 |
|
|
|
2 |
|
|
|
3 |
|
All Other |
|
|
12 |
|
|
|
20 |
|
|
|
7 |
|
|
|
7 |
|
| |
|
|
|
|
Total |
|
|
100 |
% |
|
|
100 |
% |
|
|
100 |
% |
|
|
100 |
% |
| |
Residential Mortgage Lending
Merrill Lynch originates and purchases residential mortgage loans, certain of which include
features that may result in additional credit risk when compared to more traditional types of
mortgages. The potential additional credit risk arising from these mortgages is addressed through
adherence to underwriting guidelines as described below. Credit risk is closely monitored in order
to ensure that reserves are sufficient and valuations are appropriate. These loans are
predominantly extended to high credit quality borrowers and include:
| • |
|
Loans where the borrower is subject to payment increases over the life of the loan including: |
| |
• |
|
Interest-only loans where the borrower makes no principal payments on the loan during an initial
period and is required to make both interest and principal payments either during the later stages
of the loan or in one lump sum at maturity. These loans therefore may require the borrower to make
larger payments later in the life of the loans if the loans are not otherwise repaid through a
refinancing or sale of the property. These loans are underwritten based on a variety of factors
including, for example, the borrower’s credit history, the debt to income ratio, employment, the
loan-to-value (“LTV”) ratio on the property, and the borrower’s disposable income and cash
reserves; typically using a qualifying formula that assesses the borrower’s ability to make
interest payments at a minimum of 2% above the initial rate. In instances where the borrower is of
lower credit standing, the loans are typically underwritten to have a lower LTV ratio and/or other
mitigating factors. Interest-only loans are the significant majority of the loans held by Merrill
Lynch where the borrower may be subject to payment increases. |
| |
| |
• |
|
Loans with low rates early in the loan term. These loans are offered by Merrill Lynch primarily
in the United Kingdom. The loans are underwritten based on the borrower’s ability to make the
principal and interest payments, and borrowers of a lower credit standing are typically
underwritten to a lower LTV ratio. |
| • |
|
High LTV ratio loans where the principal amount of the loan is greater than 80% of the value of
the mortgaged property and the borrower is not required to obtain private mortgage insurance
(“PMI”), and/or loans where a mortgage and home equity loan are simultaneously established for the
same property. Under Merrill Lynch’s policy, the maximum LTV ratio for originated residential
mortgages with no PMI or other security is 95%. High LTV ratio loans also include Merrill Lynch’s
Mortgage100SM product. The Mortgage100SM product permits |
| |
|
borrowers to pledge securities in lieu of a cash down payment. The securities are subject to daily
monitoring and additional collateral is required if the value of the pledged securities declines
below certain levels. The LTV on real estate collateral in the Mortgage 100SM program
typically does not exceed 70%. |
As suggested in recent SEC guidance, the following table shows the percentages of these types of
loans compared to the overall residential mortgage portfolio held in loans, notes, and mortgages:
| |
|
|
|
|
|
|
|
|
| |
|
Loan and Unfunded |
|
|
Originated/Purchased |
|
| |
|
Commitment Balance as a % of |
|
|
loans as a % of all |
|
| |
|
all Residential Mortgages and |
|
|
Residential Mortgages |
|
| |
|
Unfunded Residential |
|
|
Originated/Purchased |
|
| |
|
Commitments at December 30, 2005(2) |
|
|
during 2005 |
|
| |
Loans where borrowers may be subject to payment increases(1) |
|
|
61 |
% |
|
|
69 |
% |
Loans with high LTV ratios |
|
|
6 |
% |
|
|
5 |
% |
Loans with both high LTV ratios and loans where borrowers may be
subject to payment increases |
|
|
14 |
% |
|
|
13 |
% |
| |
|
|
Total |
|
|
81 |
% |
|
|
87 |
% |
| |
|
|
|
| (1) |
|
Includes interest-only loans and loans with low initial rates. |
| (2) |
|
Total residential mortgages were $18.2 billion and unfunded commitments were $6.4 billion as of
December 30, 2005. |
Approximately half of the high LTV ratio loans were made to borrowers in the United Kingdom;
the majority of the remaining loans were made to borrowers in the United States. Approximately 5%
of the loans where the borrower is subject to payment increases were made to borrowers in the
United Kingdom; the majority of the remaining loans were made to borrowers in the United States.
The majority of these loans are with high credit quality borrowers.
Merrill Lynch does not currently originate or purchase residential mortgage loans that allow for
minimum monthly payments less than the interest accrued on the loan (i.e., negative amortizing
loans) or option adjustable rate mortgages.
Derivatives
Merrill Lynch enters into International Swaps and Derivatives Association, Inc. master agreements
or their equivalent (“master netting agreements”) with substantially all of its derivative
counterparties as soon as possible. Agreements are negotiated bilaterally and can require complex
terms. While every effort is taken to execute such agreements, it is possible that a counterparty
may be unwilling to sign such an agreement and, as a result, would subject Merrill Lynch to
additional credit risk. Master netting agreements provide protection in bankruptcy in certain
circumstances and, in some cases, enable receivables and payables with the same counterparty to be
offset for risk management purposes. However, the enforceability of master netting agreements under
bankruptcy laws in certain countries or in certain industries is not free from doubt, and
receivables and payables with counterparties in these countries or industries are accordingly
recorded on a gross basis.
In addition, to reduce the risk of loss, Merrill Lynch requires collateral, principally cash and
U.S. Government and agency securities, on certain derivative transactions. From an economic
standpoint, Merrill Lynch evaluates risk exposures net of related collateral. During 2005, Merrill
Lynch began netting cash collateral received against the derivatives inventory on the Consolidated
Balance Sheets. See Note 1 to the Consolidated Financial Statements for additional information. The
following is a summary of counterparty credit ratings for the replacement cost (net of $12.3
billion of collateral, of which $7.9 billion represented cash collateral) of OTC trading
derivatives in a gain position by maturity at December 30, 2005.
| |
|
|
|
|
|
|
|
|
|
|
|
|
|
|
|
|
|
|
|
|
|
|
|
|
| (dollars in millions) |
|
Years to Maturity |
|
|
Cross- |
|
|
|
|
| Credit |
|
|
|
|
|
|
|
|
|
|
|
|
|
|
|
|
|
Maturity |
|
|
|
|
| Rating(1) |
|
0–3 |
|
|
3+–5 |
|
|
5+–7 |
|
|
Over 7 |
|
|
Netting(2) |
|
|
Total |
|
| |
AAA |
|
$ |
1,645 |
|
|
$ |
228 |
|
|
$ |
248 |
|
|
$ |
2,387 |
|
|
$ |
(1,036 |
) |
|
$ |
3,472 |
|
AA |
|
|
2,891 |
|
|
|
628 |
|
|
|
774 |
|
|
|
2,487 |
|
|
|
(1,808 |
) |
|
|
4,972 |
|
A |
|
|
2,706 |
|
|
|
1,100 |
|
|
|
700 |
|
|
|
2,282 |
|
|
|
(1,747 |
) |
|
|
5,041 |
|
BBB |
|
|
1,607 |
|
|
|
394 |
|
|
|
587 |
|
|
|
1,044 |
|
|
|
(911 |
) |
|
|
2,721 |
|
Other |
|
|
2,414 |
|
|
|
522 |
|
|
|
397 |
|
|
|
559 |
|
|
|
(265 |
) |
|
|
3,627 |
|
| |
|
|
Grand Total |
|
$ |
11,263 |
|
|
$ |
2,872 |
|
|
$ |
2,706 |
|
|
$ |
8,759 |
|
|
$ |
(5,767 |
) |
|
$ |
19,833 |
|
| |
|
|
|
| (1) |
|
Represents credit rating agency equivalent of internal credit ratings. |
| (2) |
|
Represents netting of payable balances with receivable balances for the same counterparty
across maturity band categories. Receivable and payable balances with the same counterparty in the
same maturity category, however, are net within the maturity category. |
In addition to obtaining collateral, Merrill Lynch attempts to mitigate its default risk on
derivatives whenever possible by entering into transactions with provisions that enable Merrill
Lynch to terminate or reset the terms of its derivative contracts.
56
Merrill Lynch 2005 Annual Report
Operational Risk
Merrill Lynch defines operational risk as the risk of loss resulting from inadequate or failed
internal processes, people and systems or from external events. This is consistent with the
definitions used by regulators, and as specified in the Basel II accord.
The primary responsibility for managing operational risk on a day-to-day basis lies with Merrill
Lynch’s businesses and support groups. Each business and support group has processes and systems in
place to address operational risks within their unit. These include the use of technology to
automate processes and key controls, the provision of business continuity plans to protect against
major disruptions, and the establishment of control committees to ensure the ongoing effectiveness
of controls.
Merrill Lynch also employs independent control groups and governance committees to ensure effective
management of operational risk. The Operational Risk Management Group is part of GLRM and is
responsible for the monitoring and reporting of operational risk loss events, as well as putting in
place the tools and techniques for the reporting and mitigation of operational risk exposure. In
addition, this group is responsible for updating the ROC on the status of the Operational Risk
program.
Corporate Audit and Compliance are key partners in the management of operational risk through
independent reviews of the controls of the firm, and ensuring compliance with applicable rules and
regulations.
Liquidity Risk
Liquidity risk relates to the ability of a company to repay short-term borrowings with new
borrowings or assets that can be quickly converted into cash while meeting other obligations and
continuing to operate as a going concern. Liquidity risk is particularly important for financial
services firms and includes both the potential inability to raise funding with appropriate maturity
and interest rate characteristics as well as the inability to liquidate an asset in a timely manner
at a reasonable price. For more information on how Merrill Lynch manages liquidity risk, see the
Capital and Funding section.
Other Risks
Merrill Lynch encounters a variety of other risks, which could have the ability to impact the
viability, profitability, and cost-effectiveness of present or future transactions. Such risks
include political, tax, and regulatory risks that may arise due to changes in local laws,
regulations, accounting standards, or tax statutes. To assist in the mitigation of such risks,
Merrill Lynch rigorously reviews new and pending legislation and regulations. Additionally, Merrill
Lynch employs professionals in jurisdictions in which Merrill Lynch operates to actively follow
issues of potential concern or impact to the firm and to participate in related interest groups.
Non-Investment Grade Holdings and Highly Leveraged Transactions
Non-investment grade holdings and highly leveraged transactions involve risks related to the
creditworthiness of the issuers or counterparties and the liquidity of the market for such
investments. Merrill Lynch recognizes these risks and, whenever possible, employs strategies to
mitigate exposures. The specific components and overall level of non-investment grade and highly
leveraged positions may vary significantly from period to period as a result of inventory turnover,
investment sales, and asset redeployment.
In the normal course of business, Merrill Lynch underwrites, trades, and holds non-investment grade
cash instruments in connection with its investment banking, market-making, and derivative
structuring activities. Non-investment grade holdings are defined as debt and preferred equity
securities rated lower than BBB or equivalent ratings by recognized credit rating agencies,
sovereign debt in emerging markets, amounts due under derivative contracts from non-investment
grade counterparties, and other instruments that, in the opinion of management, are non-investment
grade.
In addition to the amounts included in the following table, derivatives may also expose Merrill
Lynch to credit risk related to the underlying security where a derivative contract can either
replicate ownership of the underlying security (e.g., long total return swaps) or potentially force
ownership of the underlying security (e.g., short put options). Derivatives may also subject
Merrill Lynch to credit spread or issuer default risk, in that changes in credit spreads or in the
credit quality of the underlying securities may adversely affect the derivatives’ fair values.
Merrill Lynch seeks to manage these risks by engaging in various hedging strategies to reduce its
exposure associated with non-investment grade positions, such as purchasing an option to sell the
related security or entering into other offsetting derivative contracts.
Merrill Lynch provides financing and advisory services to, and invests in, companies entering into
leveraged transactions, which may include leveraged buyouts, recapitalizations, and mergers and
acquisitions. On a selected basis, Merrill Lynch provides extensions of credit to leveraged
companies, in the form of senior and subordinated debt, as well as bridge financing. In addition,
Merrill Lynch syndicates loans for non-investment grade companies or in connection with highly
leveraged transactions and may retain a portion of these loans.
Merrill Lynch holds direct equity investments in leveraged companies and interests in partnerships
that invest in leveraged transactions. Merrill Lynch has also committed to participate in limited
partnerships that invest in leveraged transactions. Future commitments to participate in limited
partnerships and other direct equity investments will continue to be made on a selective basis.
Trading Exposures
The following table summarizes trading exposures to non-investment grade or highly leveraged
corporate issuers or counterparties at year-end 2005 and 2004:
| |
|
|
|
|
|
|
|
|
| (dollars in millions) |
|
2005 |
|
|
2004 |
|
| |
Trading assets: |
|
|
|
|
|
|
|
|
Cash instruments |
|
$ |
15,578 |
|
|
$ |
11,929 |
|
Derivatives |
|
|
6,750 |
|
|
|
4,884 |
|
Trading liabilities — cash instruments |
|
|
(3,400 |
) |
|
|
(2,721 |
) |
Collateral on derivative assets |
|
|
(3,123 |
) |
|
|
(2,641 |
) |
| |
|
|
Net trading asset exposure |
|
$ |
15,805 |
|
|
$ |
11,451 |
|
| |
Included in the preceding table are debt and equity securities and bank loans of companies in
various stages of bankruptcy proceedings or in default. At December 30, 2005, the carrying value of
such debt and equity securities totaled $900 million, of which 61% resulted from Merrill Lynch’s
market-making activities in such securities. This compared with $539 million at December 31, 2004,
of which 45% related to market-making activities. Also included are distressed bank loans totaling
$290 million and $176 million at year-end 2005 and 2004, respectively.
Non-Trading Exposures
The following table summarizes Merrill Lynch’s non-trading exposures to non-investment grade or
highly leveraged corporate issuers or counterparties at year-end 2005 and 2004. This table excludes
lending-related exposures which are included in the Credit Risk section of Risk Management.
| |
|
|
|
|
|
|
|
|
| (dollars in millions) |
|
2005 |
|
|
2004 |
|
| |
Investment securities |
|
$ |
515 |
|
|
$ |
455 |
|
Other investments(1): |
|
|
|
|
|
|
|
|
Partnership interests |
|
|
2,186 |
|
|
|
1,534 |
|
Other equity Investments(2) |
|
|
2,069 |
|
|
|
691 |
|
Other assets |
|
|
76 |
|
|
|
– |
|
| |
|
|
|
| (1) |
|
Includes a total of $556 million and $491 million in investments held by employee
partnerships at year-end 2005 and 2004, respectively, for which a portion of the market risk of the
investments rests with the participating employees. |
| (2) |
|
Includes investments in 171 and 192 enterprises at year-end 2005 and 2004, respectively. |
In addition, Merrill Lynch had commitments to non-investment grade or highly leveraged
corporate issuers or counterparties of $1.2 billion and $1.3 billion at year-end 2005 and 2004,
respectively, which primarily relate to commitments to invest in partnerships.
At December 30, 2005, Merrill Lynch’s single largest non-investment grade industry exposure was to
the Industrial/Manufacturing Goods and Services sector, principally consisting of chemicals.
58
Merrill Lynch 2005 Annual Report
Recent Developments
New Accounting Pronouncements
In February 2006, the Financial Accounting Standards Board (“FASB”) issued SFAS No. 155,
Accounting for Certain Hybrid Financial Instruments an amendment of FASB Statements No. 133 and
140. This Statement will be effective for Merrill Lynch beginning in the first quarter of 2007.
Earlier adoption is permitted. The statement permits interests in hybrid financial assets that
contain an embedded derivative that would require bifurcation to be accounted for as a single
financial instrument at fair value with changes in fair value recognized in earnings. This election
is permitted on an instrument-by-instrument basis for all hybrid financial instruments held,
obtained, or issued as of the adoption date. Merrill Lynch is currently assessing the impact and
timing of adoption of the proposed guidance.
In December 2005, the FASB issued FASB Staff Position (“FSP”) SOP 94-6-1, Terms of Loan Products
That May Give Rise to a Concentration of Credit Risk. The guidance requires the disclosure of
concentrations of loans with certain features that may increase the creditor’s exposure to risk of
nonpayment or realization. These loans are often referred to as “non-traditional” loans and include
features such as high LTV ratios, terms that permit payments smaller than the interest accruals and
loans where the borrower is subject to significant payment increases over the life of the loan.
Merrill Lynch adopted the provisions of this guidance in the fourth quarter of 2005. See Note 8 to
the Consolidated Financial Statements for this disclosure.
In November 2005, the FASB issued FSP 115-1, The Meaning of Other-Than-Temporary Impairment and Its
Application to Certain Investments, which in conjunction with EITF 03-1 resulted in additional
disclosures for securities in an unrealized loss position effective for year-end 2003. Merrill
Lynch previously implemented the disclosure requirements of EITF 03-1 in its December 26, 2003
Consolidated Financial Statements. See Note 5 to the Consolidated Financial Statements for
additional information.
In June 2005, the FASB ratified the consensus reached by the EITF on Issue 04-5, Determining
Whether a General Partner, or the General Partners as a Group, Controls a Limited Partnership or
Similar Entity When the Limited Partners Have Certain Rights (“EITF 04-5”). EITF 04-5 presumes that
a general partner controls a limited partnership, and should therefore consolidate a limited
partnership, unless the limited partners have the substantive ability to remove the general partner
without cause based on a simple majority vote or can otherwise dissolve the limited partnership, or
unless the limited partners have substantive participating rights over decision making. The
guidance in EITF 04-5 was effective immediately for all new limited partnership agreements and any
limited partnership agreements that are modified. The guidance is effective for existing
partnership agreements for financial reporting periods beginning after December 15, 2005 and may be
reported as either a cumulative effect of a change in accounting principle or via retroactive
restatement. The adoption of the guidance is not expected to have a material impact on the
Consolidated Financial Statements.
On December 21, 2004, the FASB issued FSP 109-2, Accounting and Disclosure Guidance for the Foreign
Earnings Repatriation Provision within the American Jobs Creation Act of 2004. The FSP provides
guidance on the impact of the new tax law’s one-time deduction for qualifying repatriations of
foreign earnings made in 2005. The deduction can result in a lower tax rate on repatriation of
certain foreign earnings, where deferred taxes were previously established. To the extent that the
cumulative undistributed earnings of non-U.S. subsidiaries were permanently reinvested, no deferred
U.S. federal income taxes have been provided. Accordingly, net earnings in 2005 included tax
expense of $97 million ($113 million of tax expense recorded in the fourth quarter, less a $16
million tax benefit recorded in the second quarter) associated with
the foreign earnings repatriation of $1.8 billion.
On December 16, 2004, the FASB issued SFAS No. 123 (revised 2004), Share-Based Payment, a revision
of SFAS No. 123, Accounting for Stock-Based Compensation (“SFAS No. 123R”). In April 2005, the SEC
delayed the effective date for SFAS No. 123R until the first fiscal year beginning after June 15,
2005. As a result of the SEC ruling, Merrill Lynch expects to adopt the provisions of SFAS No. 123R
in the first quarter of 2006. Merrill Lynch adopted the provisions of SFAS No. 123 in the first
quarter of 2004. Under the provisions of SFAS No. 123, stock-based compensation cost is measured at
the grant date based on the fair value of the award. Merrill Lynch recognizes expense over the
vesting period stipulated in the grant for all employees. Such employees include those that have
satisfied retirement eligibility criteria but are subject to a non-compete agreement that applies
from the date of retirement through each applicable vesting period. Should a retirement-eligible
employee actually leave Merrill Lynch, all previously unvested awards are immediately charged to
expense. SFAS No. 123R clarifies and amends the guidance of SFAS No. 123 in several areas,
including measuring fair value, classifying an award as equity or as a liability, attributing
compensation cost to service periods and accounting for forfeitures of awards. Merrill Lynch
currently expects that the impact of adopting SFAS No. 123R will reduce after-tax net income by
approximately $350 million in the first quarter of 2006. See Note 14 to the Consolidated Financial
Statements for further information on share-based compensation arrangements.
Activities of Principal Subsidiaries
Merrill Lynch, Pierce, Fenner & Smith Incorporated (“MLPF&S”) in the United States, acts as a
broker (i.e., agent) for corporate, institutional, government, and private clients and as a dealer
(i.e., principal) in the purchase and sale of corporate securities, primarily equity and debt
securities traded on exchanges or in the OTC markets. MLPF&S also acts as a broker and/or a dealer
in the purchase and sale of mutual funds, money market instruments, government securities, high
yield bonds, municipal securities, financial futures contracts and options. The futures business
and foreign exchange activities are conducted through MLPF&S and other subsidiaries. MLPF&S holds
memberships and/or has third-party clearing relationships with all major commodity and financial
futures exchanges and clearing associations in the United States and it also carries positions
reflecting trades executed on exchanges outside of the United States through affiliates and/or
third-party clearing brokers. As a leading investment banking firm, MLPF&S provides corporate,
institutional, and government clients with a wide variety of financial services including
underwriting the sale of securities to the public, structured and derivative financing, private
placements, mortgage and lease financing and financial advisory services, including advice on
mergers and acquisitions.
MLPF&S also provides securities clearing services for its own account and for unaffiliated
broker-dealers through its Broadcort Correspondent Clearing Division and through its subsidiary
Merrill Lynch Professional Clearing Corp. (“ML Pro”). ML Pro is involved in Merrill Lynch’s prime
brokerage business and also makes a market in listed option contracts on various options exchanges.
MLPF&S also provides discretionary and non-discretionary investment advisory services. These
advisory services include Merrill Lynch Consults® Service, the Personal Investment
Advisory Program, the Merrill Lynch Mutual Fund Advisor® program, the Merrill Lynch
Mutual Fund Advisor Selects® program, and Merrill Lynch Global Selects. MLPF&S also
offers fee-based financial planning services, including the Financial Foundation®
report. MLPF&S provides financing to clients, including margin lending and other extensions of
credit. Through the Beyond Banking® account, a Merrill Lynch customer has access to a
special securities account product designed for everyday transactions, savings and cash management
that combines Visa, check writing and ATM access with available advice and guidance. Merrill Lynch
also offers Merrill Lynch branded credit cards in partnership with MBNA America Bank, N.A.
Through its retirement group, MLPF&S provides a wide variety of investment and custodial services
to individuals through Individual Retirement Accounts and small business retirement programs.
MLPF&S also provides investment, administration, communications, and consulting services to
corporations and their employees for their retirement programs, including 401(k), pension,
profit-sharing and non-qualified deferred compensation plans.
Merrill Lynch International (“MLI”) is a United Kingdom-based dealer in equity and fixed income
securities of a significant number of global issuers, sovereign government obligations and
asset-backed securities, and in loans and related financial instruments. Outside the United States,
MLI is a registered market maker and regularly makes a market in the equity securities of the more
actively traded non-U.S. corporations. MLI is also Merrill Lynch’s primary non-U.S. credit and
equity derivatives and futures product dealer.
Merrill Lynch Government Securities, Inc. (“MLGSI”) is a primary dealer in obligations issued or
guaranteed by the U.S. Government and regularly makes a market in securities issued by Federal
agencies and other government-sponsored entities, such as, among others, Government National
Mortgage Association, Fannie Mae and Freddie Mac. MLGSI deals in mortgage-backed pass-through
instruments issued by certain of these entities and also in related futures, options, and forward
contracts for its own account, to hedge its own risk, and to facilitate customers’ transactions. As
a primary dealer, MLGSI acts as a counterparty to the Federal Reserve Bank of New York (“FRBNY”) in
the conduct of open market operations and regularly reports positions and activities to the FRBNY.
An integral part of MLGSI’s business involves entering into repurchase agreements and securities
lending transactions.
60
Merrill Lynch 2005 Annual Report
Merrill Lynch Capital Services, Inc. (“MLCS”) and Merrill Lynch Derivative Products AG (“MLDP”)
are Merrill Lynch’s primary interest rate and currency derivative product dealers. MLCS primarily
acts as a counterparty for certain derivative financial products, including interest rate and
currency swaps, caps and floors and options. MLCS maintains positions in interest-bearing
securities, financial futures and forward contracts to hedge its interest rate and currency risk
related to derivative exposures. In the normal course of its business, MLCS enters into repurchase
and resale agreements with certain affiliated companies. MLDP acts as an intermediary for certain
derivative products, including interest rate and currency swaps, between MLCS and counterparties
that are highly rated or otherwise acceptable to MLDP. Its activities address certain swap
customers’ preference to limit their trading to those dealers having the highest credit quality.
MLDP has been assigned the Aaa, AAA and AAA counterparty rating by the rating agencies Moody’s
Investors Service, Standard & Poor’s Ratings Services and Fitch Ratings, respectively. Customers
meeting certain credit criteria enter into swaps with MLDP and, in turn, MLDP enters into
offsetting mirror swaps with MLCS. However, MLCS is required to provide MLDP with collateral to
mitigate certain exposures MLDP may have to MLCS. In addition, MLCS’s subsidiaries, Merrill Lynch
Commodities, Inc., Merrill Lynch Commodities (Europe) Trading Limited and other Merrill Lynch
subsidiaries trade as principal in physically and financially settled contracts in energy, weather
and a broad range of other commodities. These subsidiaries also provide asset optimization and
other energy management and risk management services for third parties.
Merrill Lynch Investment Managers, L.P., Fund Asset Management, L.P., and Merrill Lynch Investment
Managers Limited are the principal subsidiaries engaged in asset management activities conducted
through the MLIM brand name. MLIM is an asset manager with portfolio managers located in the United
States, the United Kingdom, Japan and Australia. MLIM manages a variety of investment products and
offers a wide array of taxable and tax-exempt fixed income, equity and balanced mutual funds and
segregated accounts to a diverse global clientele. MLIM offers a wide assortment of index-based
equity and alternative investment products. MLIM’s clients include institutions, high-net-worth
individuals, retail investors, mutual funds and other investment vehicles.
Merrill Lynch Bank USA (“MLBUSA”) and Merrill Lynch Bank & Trust Co. (“MLB&T”) are part of the
Merrill Lynch Global Bank Group, which provides the management platform for Merrill Lynch’s banking
products and services. Merrill Lynch, primarily through MLBUSA, provides syndicated and bridge
financing, asset-based lending, commercial real estate lending, equipment financing, and standby or
“backstop” credit in various forms for large institutional clients generally in connection with
their commercial paper programs. MLBUSA also offers securities-based loans primarily to individual
clients. MLBUSA and MLB&T are state-chartered depository institutions insured by the Federal
Deposit Insurance Corporation (“FDIC”), and both are wholesale banks for Community Reinvestment Act
purposes. MLBUSA and MLB&T offer certificates of deposit, transaction accounts and money market
deposit accounts and issue VISA debit cards.
MLBUSA, through its subsidiary Merrill Lynch Credit Corporation, offers residential mortgage
financing throughout the United States enabling clients to purchase and refinance their homes as
well as to manage their other personal credit needs. In addition, Merrill Lynch Business Financial
Services Inc. (“MLBFS”), a subsidiary of MLBUSA, originates commercial financing for qualifying
small- and mid-size businesses, including lines of credit and reducing revolver loans through the
WCMA Commercial Line of Credit and the WCMA Reducing RevolverSM Loan, respectively.
MLBFS also assists its qualifying business clients with equipment financing, owner-occupied
commercial real estate and other specialized financing needs.
Financial Data Services Inc., a wholly-owned subsidiary of MLB&T, is a registered transfer agent
and provides support and services for both Merrill Lynch and non-Merrill Lynch mutual fund
products.
Merrill Lynch has submitted regulatory applications to the Office of Thrift Supervision, the FDIC
and the Utah Department of Financial Institutions for purposes of internally reorganizing certain
bank businesses, including the merger of MLB&T into Merrill Lynch Trust Company, FSB, with the
latter expected to be the surviving entity.
Merrill Lynch International Bank Limited (“MLIB”), an authorized credit institution under the U.K.
Financial Services and Markets Act 2000, provides collateralized (including mortgage) lending,
letters of credit, guarantee and foreign exchange services to, and accepts deposits from,
international clients. In addition, it has a number of branch offices in which FAs are located.
MLIB, through its subsidiary, Mortgages plc, provides mortgage lending, administration and
servicing in the U.K. nonconforming residential mortgage market.
Merrill Lynch Bank (Suisse) S.A., a subsidiary of MLIB, is a Swiss licensed bank that provides a
full array of banking, asset management and brokerage products and services to international
clients, including securities trading and custody, secured loans and overdrafts, fiduciary
deposits, foreign exchange trading and portfolio management services.
Merrill Lynch Capital Markets Bank Limited (“MLCMBL”), an Ireland-based bank with branch offices in
London, Frankfurt and Milan, acts primarily as a credit intermediary for swaps, options and other
derivative transactions, and secondarily as a principal for debt derivative transactions. MLCMBL
also engages in advisory, lending, loan trading, and institutional sales activities.
Merrill Lynch Mortgage Capital Inc. (“MLMCI”) is a dealer in syndicated commercial loans. As an
integral part of its business, MLMCI enters into repurchase agreements whereby it obtains funds by
pledging its own whole loans as collateral. The repurchase agreements provide financing for MLMCI’s
inventory and serve as short-term investments for MLMCI’s customers. MLMCI also enters into reverse
repurchase agreements through which it provides funds to customers collateralized by whole loan
mortgages, thereby providing the customers with temporary liquidity. MLMCI, through its subsidiary
Merrill Lynch Mortgage Lending, Inc. (“MLML”), is a dealer in whole loan mortgages, mortgage loan
participations, mortgage loan servicing and a commercial mortgage conduit that makes, and purchases
from lenders, both commercial and multi-family mortgage loans and then securitizes these loans for
sale to investors. MLML purchases prime, subprime, nonperforming and subperforming residential
mortgage loans from originators of these loans and aggregates these loans for sale in the
securitization market. Wilshire Credit Corporation, a subsidiary of MLMCI, services subprime,
nonperforming and reperforming residential mortgages.
Merrill Lynch Japan Securities Co., Ltd. (“MLJS”) is a Japan-based broker-dealer that provides
institutional and private clients with a variety of financial services, including the purchase and
sale of equity and fixed income securities, futures and options. MLJS also acts as an underwriter
and seller of securities in both publicly registered transactions and private placements.
Merrill Lynch Life Insurance Company and ML Life Insurance Company of New York issue annuity
products. The sale of non-proprietary insurance products and proprietary and non-proprietary
annuity products are made through Merrill Lynch Life Agency Inc. and other affiliated insurance
agencies operating in the United States.
ML IBK Positions, Inc. is a U.S.-based entity involved in private equity and principal investing
that makes proprietary investments in all levels of the capital structure of U.S. and non-U.S.
companies, and in special purpose companies owning real estate, mortgage loans, consumer
receivables and other assets, and may make direct equity investments in real estate assets,
mortgage loans and other assets. In addition, through its subsidiary, Merrill Lynch Capital
Corporation, it provides senior and subordinated financing to certain companies.
62
Merrill Lynch 2005 Annual Report
Management’s Discussion of Financial Responsibility, Disclosure Controls and
Procedures, and Report On Internal Control Over Financial Reporting
Financial Responsibility
Oversight is provided by independent units within Merrill Lynch, working together to maintain
Merrill Lynch’s internal control standards. Corporate Audit reports directly to the Audit Committee
of the Board of Directors, providing independent appraisals of Merrill Lynch’s internal controls
and compliance with established policies and procedures. Finance management establishes accounting
policies and procedures, measures and monitors financial risk, and independently from the
businesses prepares financial statements that fairly present the underlying transactions and events
of Merrill Lynch. GLRM monitors capital adequacy and liquidity management and has oversight
responsibility for Merrill Lynch’s market and credit risks independent from business line
management. This group has clear authority to enforce trading and credit limits using various
systems and procedures to monitor positions and risks. The Office of the General Counsel serves in
a counseling and advisory role to Management and the business groups. In this role, the group
develops policies; monitors compliance with internal policies, external rules, and industry
regulations; and provides legal advice, representation, execution, and transaction support to the
businesses.
ML & Co. has established a Disclosure Committee to assist the Chief Executive Officer and Chief
Financial Officer in fulfilling their responsibilities for overseeing the accuracy and timeliness
of disclosures made by ML & Co. The Disclosure Committee is made up of senior representatives of
Merrill Lynch’s Finance, Investor Relations, Office of the General Counsel, Treasury, Tax and GLRM
groups, and is responsible for implementing and evaluating disclosure controls and procedures on an
ongoing basis. The Disclosure Committee meets at least eight times a year. Meetings are held as
needed to review key events and disclosures impacting the period throughout each fiscal quarter and
prior to the filing of ML & Co.’s Form 10-K and 10-Q reports and proxy statement with the SEC.
The Board of Directors designated Merrill Lynch’s Guidelines for Business Conduct as the Company’s
code of ethics for directors, officers and employees in performing their duties. The Guidelines set
forth written standards for employee conduct with respect to conflicts of interest, disclosure
obligations, compliance with applicable laws and rules and other matters. The Guidelines also set
forth information and procedures for employees to report ethical or accounting concerns, misconduct
or violations of the Guidelines in a confidential manner. The Board of Directors adopted Merrill
Lynch’s Code of Ethics for Financial Professionals in 2003. The Code, which applies to all Merrill
Lynch professionals who participate in the Company’s public disclosure process, supplements our
Guidelines for Business Conduct and is designed to promote honest and ethical conduct, full, fair
and accurate disclosure and compliance with applicable laws.
The independent registered public accounting firm, Deloitte & Touche LLP, performs annual audits of
Merrill Lynch’s financial statements in accordance with the Standards of the Public Company
Accounting Oversight Board (United States). They openly discuss with the Audit Committee their
views on the quality of the financial statements and related disclosures and the adequacy of
Merrill Lynch’s internal accounting controls. Quarterly review reports on the unaudited interim
financial statements are also issued by Deloitte & Touche LLP. The Audit Committee appoints the
independent registered public accounting firm. The independent registered public accounting firm is
given unrestricted access to all financial records and related data, including minutes of meetings
of stockholders, the Board of Directors, and committees of the Board.
As part of their oversight role, committees of the Board supervise management in the formulation of
corporate policies, procedures and controls. The Audit Committee, which consists of five
independent directors, oversees Merrill Lynch’s system of internal accounting controls and the
internal audit function. In addition, the Audit Committee oversees adherence to risk management and
compliance policies, procedures, and functions. It also reviews the annual Consolidated Financial
Statements with Management and Merrill Lynch’s independent registered public accounting firm, and
evaluates the performance, independence and fees of our independent registered public accounting
firm and the professional services it provides. The Audit Committee also has the sole authority to
appoint or replace the independent registered public accounting firm.
The Finance Committee, which consists of four independent directors, reviews, recommends, and
approves policies regarding financial commitments and other expenditures. It also reviews and
approves certain financial commitments, acquisitions, divestitures, and proprietary investments. In
addition, the Finance Committee oversees balance sheet and capital management, corporate funding
policies and financing plans. It also reviews Merrill Lynch’s policies and procedures for managing
exposure to market and credit risk.
Disclosure Controls and Procedures
ML & Co.’s Disclosure Committee assists with implementing, monitoring and evaluating our
disclosure controls and procedures. ML & Co.’s Chief Executive Officer, Chief Financial Officer and
Disclosure Committee have evaluated the effectiveness of ML & Co.’s disclosure controls and
procedures (as defined in Rule 13a-15(e) under the Securities Exchange Act of 1934) as of the end
of the period covered by this Report. Based on that evaluation, ML & Co.’s Chief Executive Officer
and Chief Financial Officer have concluded that ML & Co.’s disclosure controls and procedures are
effective as of the end of the period covered by this Report.
No change in ML & Co.’s internal control over financial reporting (as defined in Rule 13a-15(f)
under the Securities Exchange Act of 1934) occurred during the fourth fiscal quarter of 2005 that
has materially affected, or is reasonably likely to materially affect, ML & Co.’s internal control
over financial reporting, except that during 2005, Merrill Lynch completed a company-wide
implementation of a new general ledger system. As of December 30, 2005, substantially all of
Merrill Lynch’s business units were using the new system. We have reviewed the internal controls
affected by the implementation of this system and made changes to those impacted by the new system.
We believe that the internal controls surrounding the new general ledger system as modified, are
appropriate and functioning effectively.
Report on Internal Control Over Financial Reporting
Management recognizes its responsibility for establishing and maintaining adequate internal
control over financial reporting and has designed internal controls and procedures to provide
reasonable assurance regarding the reliability of financial reporting and the preparation of
consolidated financial statements and related notes in accordance with generally accepted
accounting principles in the United States of America. Management assessed the effectiveness of
Merrill Lynch’s internal control over financial reporting as of December 30, 2005. In making this
assessment, management used the criteria set forth by the Committee of Sponsoring Organizations of
the Treadway Commission (COSO) in Internal Control-Integrated Framework. Based on our assessment,
management believes that Merrill Lynch maintained effective internal control over financial
reporting as of December 30, 2005.
The audited consolidated financial statements of Merrill Lynch include the results of The Advest
Group Inc., but management’s assessment does not include an assessment of the internal control over
financial reporting of this entity because it was acquired on December 2, 2005. This approach is
consistent with published SEC guidance on the permissible scope of management’s internal control
report. The financial statements for this entity reflect total assets and revenues constituting
less than one percent of the related consolidated financial statement amounts as of and for the
year ended December 30, 2005. See Note 17 to the Consolidated Financial Statements for additional
information regarding this acquisition.
Deloitte & Touche LLP, Merrill Lynch’s independent registered public accounting firm, has issued an
attestation report on management’s assessment of Merrill Lynch’s internal control over financial
reporting and on the effectiveness of Merrill Lynch’s internal control over financial reporting.
This report appears under “Report of Independent Registered Public Accounting Firm” on the
following page.
New York, New York
February 27, 2006
64
Merrill Lynch 2005 Annual Report
Report of Independent Registered Public Accounting Firm
To the Board of Directors and Stockholders of Merrill Lynch & Co., Inc.:
We have audited management’s assessment, included in the accompanying Report on Internal
Control Over Financial Reporting, that Merrill Lynch & Co., Inc. and subsidiaries (“Merrill Lynch”)
maintained effective internal control over financial reporting as of December 30, 2005, based on
criteria established in Internal Control-Integrated Framework issued by the Committee of Sponsoring
Organizations of the Treadway Commission. As described in the Report on Internal Control Over
Financial Reporting, management excluded from their assessment the internal control over financial
reporting at The Advest Group Inc., which was acquired on December 2, 2005, and whose financial
statements reflect total assets and revenues constituting less than one percent of the related
consolidated financial statement amounts as of and for the year ended December 30, 2005.
Accordingly, our audit did not include the internal control over financial reporting at The Advest
Group, Inc. Merrill Lynch’s management is responsible for maintaining effective internal control
over financial reporting and for its assessment of the effectiveness of internal control over
financial reporting. Our responsibility is to express an opinion on management’s assessment and an
opinion on the effectiveness of Merrill Lynch’s internal control over financial reporting based on
our audit.
We conducted our audit in accordance with the standards of the Public Company Accounting Oversight
Board (United States). Those standards require that we plan and perform the audit to obtain
reasonable assurance about whether effective internal control over financial reporting was
maintained in all material respects. Our audit included obtaining an understanding of internal
control over financial reporting, evaluating management’s assessment, testing and evaluating the
design and operating effectiveness of internal control, and performing such other procedures as we
considered necessary in the circumstances. We believe that our audit provides a reasonable basis
for our opinions.
A company’s internal control over financial reporting is a process designed by, or under the
supervision of, the company’s principal executive and principal financial officers, or persons
performing similar functions, and effected by the company’s board of directors, management, and
other personnel to provide reasonable assurance regarding the reliability of financial reporting
and the preparation of financial statements for external purposes in accordance with generally
accepted accounting principles. A company’s internal control over financial reporting includes
those policies and procedures that (1) pertain to the maintenance of records that, in reasonable
detail, accurately and fairly reflect the transactions and dispositions of the assets of the
company; (2) provide reasonable assurance that transactions are recorded as necessary to permit
preparation of financial statements in accordance with generally accepted accounting principles,
and that receipts and expenditures of the company are being made only in accordance with
authorizations of management and directors of the company; and (3) provide reasonable assurance
regarding prevention or timely detection of unauthorized acquisition, use, or disposition of the
company’s assets that could have a material effect on the financial statements.
Because of the inherent limitations of internal control over financial reporting, including the
possibility of collusion or improper management override of controls, material misstatements due to
error or fraud may not be prevented or detected on a timely basis. Also, projections of any
evaluation of the effectiveness of the internal control over financial reporting to future periods
are subject to the risk that the controls may become inadequate because of changes in conditions,
or that the degree of compliance with the policies or procedures may deteriorate.
In our opinion, management’s assessment that Merrill Lynch maintained effective internal control
over financial reporting as of December 30, 2005, is fairly stated, in all material respects, based
on the criteria established in Internal Control-Integrated Framework issued by the Committee of
Sponsoring Organizations of the Treadway Commission. Also in our opinion, Merrill Lynch maintained,
in all material respects, effective internal control over financial reporting as of December 30,
2005, based on the criteria established in Internal Control-Integrated Framework issued by the
Committee of Sponsoring Organizations of the Treadway Commission.
We have also audited, in accordance with the standards of the Public Company Accounting Oversight
Board (United States), the consolidated financial statements as of and for the year ended December
30, 2005 of Merrill Lynch and our report dated February 27, 2006 expressed an unqualified opinion
on those financial statements.
New York, New York
February 27, 2006
Report of Independent Registered Public Accounting Firm
To the Board of Directors and Stockholders of Merrill Lynch & Co., Inc.:
We have audited the accompanying consolidated balance sheets of Merrill Lynch & Co., Inc. and
subsidiaries (“Merrill Lynch”) as of December 30, 2005 and December 31, 2004, and the related
consolidated statements of earnings, changes in stockholders’ equity, comprehensive income and cash
flows for each of the three years in the period ended December 30, 2005. These financial statements
are the responsibility of Merrill Lynch’s management. Our responsibility is to express an opinion
on these financial statements based on our audits.
We conducted our audits in accordance with the standards of the Public Company Accounting Oversight
Board (United States). Those standards require that we plan and perform the audit to obtain
reasonable assurance about whether the financial statements are free of material misstatement. An
audit includes examining, on a test basis, evidence supporting the amounts and disclosures in the
financial statements. An audit also includes assessing the accounting principles used and
significant estimates made by management, as well as evaluating the overall financial statement
presentation. We believe that our audits provide a reasonable basis for our opinion.
In our opinion, such consolidated financial statements present fairly, in all material respects,
the financial position of Merrill Lynch as of December 30, 2005 and December 31, 2004, and the
results of its operations and its cash flows for each of the three years in the period ended
December 30, 2005, in conformity with accounting principles generally accepted in the United States
of America.
We have also audited, in accordance with the standards of the Public Company Accounting Oversight
Board (United States), the effectiveness of Merrill Lynch’s internal control over financial
reporting as of December 30, 2005, based on the criteria established in Internal Control-Integrated
Framework issued by the Committee of Sponsoring Organizations of the Treadway Commission and our
report dated February 27, 2006 expressed an unqualified opinion on management’s assessment of the
effectiveness of Merrill Lynch’s internal control over financial reporting and an unqualified
opinion on the effectiveness of Merrill Lynch’s internal control over financial reporting.
New York, New York
February 27, 2006
66
Merrill Lynch 2005 Annual Report
Consolidated Statements of Earnings
| |
|
|
|
|
|
|
|
|
|
|
|
|
| |
|
Year Ended Last Friday in December |
|
| |
2005 |
|
2004 |
|
2003 |
|
| (dollars in millions, except per share amounts) |
(52 weeks) |
|
(53 weeks) |
|
(52 weeks) |
|
| |
Net Revenues |
|
|
|
|
|
|
|
|
|
|
|
|
Asset management and portfolio service fees |
|
$ |
6,031 |
|
|
$ |
5,440 |
|
|
$ |
4,698 |
|
Commissions |
|
|
5,371 |
|
|
|
4,874 |
|
|
|
4,299 |
|
Investment banking |
|
|
3,594 |
|
|
|
3,268 |
|
|
|
2,643 |
|
Principal transactions |
|
|
3,583 |
|
|
|
2,248 |
|
|
|
3,065 |
|
Revenues from consolidated investments |
|
|
438 |
|
|
|
346 |
|
|
|
70 |
|
Other |
|
|
2,195 |
|
|
|
1,454 |
|
|
|
1,492 |
|
| |
|
|
|
|
|
21,212 |
|
|
|
17,630 |
|
|
|
16,267 |
|
|
|
|
|
|
|
|
|
|
|
|
|
|
Interest and dividend revenues |
|
|
26,571 |
|
|
|
14,989 |
|
|
|
11,657 |
|
Less interest expense |
|
|
21,774 |
|
|
|
10,560 |
|
|
|
8,024 |
|
| |
|
|
Net interest profit |
|
|
4,797 |
|
|
|
4,429 |
|
|
|
3,633 |
|
| |
|
|
Total Net Revenues |
|
|
26,009 |
|
|
|
22,059 |
|
|
|
19,900 |
|
| |
|
|
|
|
|
|
|
|
|
|
|
|
|
|
|
Non-Interest Expenses |
|
|
|
|
|
|
|
|
|
|
|
|
Compensation and benefits |
|
|
12,441 |
|
|
|
10,663 |
|
|
|
9,886 |
|
Communications and technology |
|
|
1,608 |
|
|
|
1,461 |
|
|
|
1,457 |
|
Occupancy and related depreciation |
|
|
938 |
|
|
|
893 |
|
|
|
889 |
|
Brokerage, clearing, and exchange fees |
|
|
842 |
|
|
|
773 |
|
|
|
676 |
|
Professional fees |
|
|
727 |
|
|
|
715 |
|
|
|
598 |
|
Advertising and market development |
|
|
599 |
|
|
|
533 |
|
|
|
429 |
|
Expenses of consolidated investments |
|
|
258 |
|
|
|
231 |
|
|
|
68 |
|
Office supplies and postage |
|
|
210 |
|
|
|
203 |
|
|
|
197 |
|
Other |
|
|
1,155 |
|
|
|
751 |
|
|
|
627 |
|
Net recoveries related to September 11 |
|
|
– |
|
|
|
– |
|
|
|
(147 |
) |
| |
|
|
Total Non-Interest Expenses |
|
|
18,778 |
|
|
|
16,223 |
|
|
|
14,680 |
|
| |
|
|
|
|
|
|
|
|
|
|
|
|
|
|
|
Earnings Before Income Taxes |
|
|
7,231 |
|
|
|
5,836 |
|
|
|
5,220 |
|
Income Tax Expense |
|
|
2,115 |
|
|
|
1,400 |
|
|
|
1,384 |
|
| |
|
|
|
|
|
|
|
|
|
|
|
|
|
|
|
Net Earnings |
|
$ |
5,116 |
|
|
$ |
4,436 |
|
|
$ |
3,836 |
|
Preferred Stock Dividends |
|
|
70 |
|
|
|
41 |
|
|
|
39 |
|
| |
|
|
Net Earnings Applicable to Common Stockholders |
|
$ |
5,046 |
|
|
$ |
4,395 |
|
|
$ |
3,797 |
|
| |
|
|
Earnings Per Common Share |
|
|
|
|
|
|
|
|
|
|
|
|
Basic |
|
$ |
5.66 |
|
|
$ |
4.81 |
|
|
$ |
4.22 |
|
| |
|
|
Diluted |
|
$ |
5.16 |
|
|
$ |
4.38 |
|
|
$ |
3.87 |
|
| |
See Notes to Consolidated Financial Statements.
Consolidated Balance Sheets
| |
|
|
|
|
|
|
|
|
| (dollars in millions, except per share amounts) |
Dec. 30, 2005 |
|
Dec. 31, 2004 |
|
| |
Assets |
|
|
|
|
|
|
|
|
Cash and cash equivalents |
|
$ |
14,586 |
|
|
$ |
20,790 |
|
Cash and securities segregated for regulatory purposes or
deposited with clearing organizations |
|
|
11,949 |
|
|
|
17,784 |
|
Securities financing transactions |
|
|
|
|
|
|
|
|
Receivables under resale agreements |
|
|
163,021 |
|
|
|
78,853 |
|
Receivables under securities borrowed transactions |
|
|
92,484 |
|
|
|
94,498 |
|
| |
|
|
|
|
|
255,505 |
|
|
|
173,351 |
|
| |
|
|
|
|
|
|
|
|
|
|
|
Trading assets, at fair value (includes securities pledged as collateral that can be
sold or repledged of $44,261 in 2005 and $47,067 in 2004) |
|
|
|
|
|
|
|
|
Equities and convertible debentures |
|
|
32,933 |
|
|
|
27,644 |
|
Mortgages, mortgage-backed, and asset-backed |
|
|
29,233 |
|
|
|
26,877 |
|
Corporate debt and preferred stock |
|
|
27,436 |
|
|
|
32,793 |
|
Contractual agreements |
|
|
26,216 |
|
|
|
35,875 |
|
Non-U.S. governments and agencies |
|
|
15,157 |
|
|
|
29,887 |
|
U.S. Government and agencies |
|
|
8,936 |
|
|
|
13,861 |
|
Municipals and money markets |
|
|
5,694 |
|
|
|
6,538 |
|
Commodities and related contracts |
|
|
3,105 |
|
|
|
1,102 |
|
| |
|
|
|
|
|
148,710 |
|
|
|
174,577 |
|
| |
|
|
|
|
|
|
|
|
|
|
|
Investment securities (includes securities pledged as collateral that can be sold or
repledged of $0 in 2005 and $3,806 in 2004) |
|
|
69,273 |
|
|
|
78,460 |
|
|
|
|
|
|
|
|
|
|
Securities received as collateral |
|
|
16,808 |
|
|
|
11,903 |
|
|
|
|
|
|
|
|
|
|
Other receivables |
|
|
|
|
|
|
|
|
Customers (net of allowance for doubtful accounts of $46 in 2005 and $51 in 2004) |
|
|
40,451 |
|
|
|
38,224 |
|
Brokers and dealers |
|
|
12,127 |
|
|
|
12,109 |
|
Interest and other |
|
|
15,619 |
|
|
|
13,954 |
|
| |
|
|
|
|
|
68,197 |
|
|
|
64,287 |
|
| |
|
|
|
|
|
|
|
|
|
|
|
Loans, notes, and mortgages (net of allowance for loan losses of $406 in 2005 and
$283 in 2004) |
|
|
66,041 |
|
|
|
53,262 |
|
|
|
|
|
|
|
|
|
|
Separate accounts assets |
|
|
16,185 |
|
|
|
18,641 |
|
|
|
|
|
|
|
|
|
|
Equipment and facilities (net of accumulated depreciation and amortization of $4,865
in 2005 and $5,259 in 2004) |
|
|
2,313 |
|
|
|
2,508 |
|
|
|
|
|
|
|
|
|
|
Goodwill and other intangible assets |
|
|
6,035 |
|
|
|
6,162 |
|
|
|
|
|
|
|
|
|
|
Other assets |
|
|
5,413 |
|
|
|
6,373 |
|
| |
|
|
|
|
|
|
|
|
|
|
|
Total Assets |
|
$ |
681,015 |
|
|
$ |
628,098 |
|
| |
68
Merrill Lynch 2005 Annual Report
Consolidated Balance Sheets
| |
|
|
|
|
|
|
|
|
| (dollars in millions, except per share amounts) |
Dec. 30, 2005 |
|
Dec. 31, 2004 |
|
| |
| |
Liabilities |
|
|
|
|
|
|
|
|
Securities financing transactions |
|
|
|
|
|
|
|
|
Payables under repurchase agreements |
|
$ |
198,152 |
|
|
$ |
153,843 |
|
Payables under securities loaned transactions |
|
|
19,335 |
|
|
|
22,236 |
|
| |
|
|
|
|
|
217,487 |
|
|
|
176,079 |
|
| |
|
|
|
|
|
|
|
|
|
|
|
Commercial paper and other short-term borrowings |
|
|
3,902 |
|
|
|
3,979 |
|
Deposits |
|
|
80,016 |
|
|
|
79,746 |
|
Trading liabilities, at fair value |
|
|
|
|
|
|
|
|
Contractual agreements |
|
|
28,755 |
|
|
|
35,734 |
|
Non-U.S. governments and agencies |
|
|
19,217 |
|
|
|
22,271 |
|
Equities and convertible debentures |
|
|
19,119 |
|
|
|
15,131 |
|
U.S. Government and agencies |
|
|
12,478 |
|
|
|
16,496 |
|
Corporate debt and preferred stock |
|
|
6,203 |
|
|
|
8,058 |
|
Commodities and related contracts |
|
|
2,029 |
|
|
|
767 |
|
Municipals, money markets and other |
|
|
1,132 |
|
|
|
1,136 |
|
| |
|
|
|
|
|
88,933 |
|
|
|
99,593 |
|
| |
|
|
Obligation to return securities received as collateral |
|
|
16,808 |
|
|
|
11,903 |
|
Other payables |
|
|
|
|
|
|
|
|
Customers |
|
|
35,619 |
|
|
|
34,381 |
|
Brokers and dealers |
|
|
19,528 |
|
|
|
20,133 |
|
Interest and other |
|
|
28,501 |
|
|
|
26,510 |
|
| |
|
|
|
|
|
83,648 |
|
|
|
81,024 |
|
| |
|
|
Liabilities of insurance subsidiaries |
|
|
2,935 |
|
|
|
3,158 |
|
Separate accounts liabilities |
|
|
16,185 |
|
|
|
18,641 |
|
Long-term borrowings |
|
|
132,409 |
|
|
|
119,513 |
|
Long-term debt issued to TOPrSSM partnerships |
|
|
3,092 |
|
|
|
3,092 |
|
| |
|
|
Total Liabilities |
|
|
645,415 |
|
|
|
596,728 |
|
| |
|
|
|
|
|
|
|
|
|
|
|
Commitments and Contingencies |
|
|
|
|
|
|
|
|
Stockholders’ Equity |
|
|
|
|
|
|
|
|
Preferred Stockholders’ Equity (liquidation preference of $30,000 per share; issued: |
|
|
|
|
|
|
|
|
2005 – 93,000 shares; 2004 – 21,000 shares) |
|
|
2,773 |
|
|
|
630 |
|
Less: Treasury stock, at cost (2005 – 3,315 shares; 2004 – 0 shares) |
|
|
100 |
|
|
|
– |
|
| |
|
|
Total Preferred Stockholders’ Equity |
|
|
2,673 |
|
|
|
630 |
|
| |
|
|
Common Stockholders’ Equity |
|
|
|
|
|
|
|
|
Shares exchangeable into common stock |
|
|
41 |
|
|
|
41 |
|
Common stock
(par value
$1.331/3 per share; authorized: 3,000,000,000 shares;
issued: 2005 – 1,148,714,008 shares and 2004 – 1,098,991,806 shares) |
|
|
1,531 |
|
|
|
1,465 |
|
Paid-in capital |
|
|
15,012 |
|
|
|
12,332 |
|
Accumulated other comprehensive loss (net of tax) |
|
|
(844 |
) |
|
|
(481 |
) |
Retained earnings |
|
|
26,824 |
|
|
|
22,485 |
|
| |
|
|
|
|
|
42,564 |
|
|
|
35,842 |
|
| |
|
|
Less: Treasury stock, at cost (2005 – 233,112,271 shares;
2004 – 170,955,057 shares) |
|
|
7,945 |
|
|
|
4,230 |
|
Unamortized employee stock grants |
|
|
1,692 |
|
|
|
872 |
|
| |
|
|
Total Common Stockholders’ Equity |
|
|
32,927 |
|
|
|
30,740 |
|
| |
|
|
Total Stockholders’ Equity |
|
|
35,600 |
|
|
|
31,370 |
|
| |
|
|
|
|
|
|
|
|
|
|
|
Total Liabilities and Stockholders’ Equity |
|
$ |
681,015 |
|
|
$ |
628,098 |
|
| |
See Notes to Consolidated Financial Statements.
Consolidated Statements of Changes in Stockholders’ Equity
| |
|
|
|
|
|
|
|
|
|
|
|
|
|
|
|
|
|
|
|
|
|
|
|
|
| |
|
Year Ended Last Friday in December |
|
| |
|
Amounts |
|
|
Shares |
|
| (dollars in
millions) |
|
2005 |
|
|
2004 |
|
|
2003 |
|
|
2005 |
|
|
2004 |
|
|
2003 |
|
| |
Preferred Stock, net |
|
|
|
|
|
|
|
|
|
|
|
|
|
|
|
|
|
|
|
|
|
|
|
|
Balance, beginning of year |
|
$ |
630 |
|
|
$ |
425 |
|
|
$ |
425 |
|
|
|
21,000 |
|
|
|
42,500 |
|
|
|
42,500 |
|
Issuances |
|
|
2,143 |
|
|
|
630 |
|
|
|
– |
|
|
|
72,000 |
|
|
|
21,000 |
|
|
|
– |
|
Redemptions |
|
|
– |
|
|
|
(425 |
) |
|
|
– |
|
|
|
– |
|
|
|
(42,500 |
) |
|
|
– |
|
Shares repurchased |
|
|
(100 |
) |
|
|
– |
|
|
|
– |
|
|
|
(3,315 |
) |
|
|
– |
|
|
|
– |
|
| |
|
|
|
|
Balance, end of year |
|
|
2,673 |
|
|
|
630 |
|
|
|
425 |
|
|
|
89,685 |
|
|
|
21,000 |
|
|
|
42,500 |
|
| |
|
|
|
|
Common Stockholders’ Equity |
|
|
|
|
|
|
|
|
|
|
|
|
|
|
|
|
|
|
|
|
|
|
|
|
Shares Exchangeable into Common Stock |
|
|
|
|
|
|
|
|
|
|
|
|
|
|
|
|
|
|
|
|
|
|
|
|
Balance, beginning of year |
|
|
41 |
|
|
|
43 |
|
|
|
58 |
|
|
|
2,782,712 |
|
|
|
2,899,923 |
|
|
|
3,911,041 |
|
Exchanges |
|
|
– |
|
|
|
(2 |
) |
|
|
(15 |
) |
|
|
(74,915 |
) |
|
|
(117,211 |
) |
|
|
(1,011,118 |
) |
| |
|
|
|
|
Balance, end of year |
|
|
41 |
|
|
|
41 |
|
|
|
43 |
|
|
|
2,707,797 |
|
|
|
2,782,712 |
|
|
|
2,899,923 |
|
| |
|
|
|
|
Common Stock |
|
|
|
|
|
|
|
|
|
|
|
|
|
|
|
|
|
|
|
|
|
|
|
|
Balance, beginning of year |
|
|
1,465 |
|
|
|
1,417 |
|
|
|
1,311 |
|
|
|
1,098,991,806 |
|
|
|
1,063,205,274 |
|
|
|
983,502,078 |
|
Shares issued to employees |
|
|
66 |
|
|
|
48 |
|
|
|
106 |
|
|
|
49,722,202 |
|
|
|
35,786,532 |
|
|
|
79,703,196 |
|
| |
|
|
|
|
Balance, end of year |
|
|
1,531 |
|
|
|
1,465 |
|
|
|
1,417 |
|
|
|
1,148,714,008 |
|
|
|
1,098,991,806 |
|
|
|
1,063,205,274 |
|
| |
|
|
|
|
Paid-in Capital |
|
|
|
|
|
|
|
|
|
|
|
|
|
|
|
|
|
|
|
|
|
|
|
|
Balance, beginning of year |
|
|
12,332 |
|
|
|
10,676 |
|
|
|
9,102 |
|
|
|
|
|
|
|
|
|
|
|
|
|
Employee stock plan activity |
|
|
2,680 |
|
|
|
1,656 |
|
|
|
1,574 |
|
|
|
|
|
|
|
|
|
|
|
|
|
| |
|
|
|
|
|
|
|
|
|
|
|
|
|
|
Balance, end of year |
|
|
15,012 |
|
|
|
12,332 |
|
|
|
10,676 |
|
|
|
|
|
|
|
|
|
|
|
|
|
| |
|
|
|
|
|
|
|
|
|
|
|
|
|
|
Accumulated Other Comprehensive Loss |
|
|
|
|
|
|
|
|
|
|
|
|
|
|
|
|
|
|
|
|
|
|
|
|
Foreign Currency Translation Adjustment
(net of tax) |
|
|
|
|
|
|
|
|
|
|
|
|
|
|
|
|
|
|
|
|
|
|
|
|
Balance, beginning of year |
|
|
(289 |
) |
|
|
(301 |
) |
|
|
(320 |
) |
|
|
|
|
|
|
|
|
|
|
|
|
Translation adjustment |
|
|
(218 |
) |
|
|
12 |
|
|
|
19 |
|
|
|
|
|
|
|
|
|
|
|
|
|
| |
|
|
|
|
|
|
|
|
|
|
|
|
|
|
Balance, end of year |
|
|
(507 |
) |
|
|
(289 |
) |
|
|
(301 |
) |
|
|
|
|
|
|
|
|
|
|
|
|
| |
|
|
|
|
|
|
|
|
|
|
|
|
|
|
Net Unrealized Gains (Losses) on
Available-for-Sale Securities (net of tax) |
|
|
|
|
|
|
|
|
|
|
|
|
|
|
|
|
|
|
|
|
|
|
|
|
Balance, beginning of year |
|
|
(91 |
) |
|
|
(111 |
) |
|
|
(145 |
) |
|
|
|
|
|
|
|
|
|
|
|
|
Net unrealized gains (losses) on
available-for-sale |
|
|
(156 |
) |
|
|
30 |
|
|
|
27 |
|
|
|
|
|
|
|
|
|
|
|
|
|
Other adjustments(1) |
|
|
66 |
|
|
|
(10 |
) |
|
|
7 |
|
|
|
|
|
|
|
|
|
|
|
|
|
| |
|
|
|
|
|
|
|
|
|
|
|
|
|
|
Balance, end of year |
|
|
(181 |
) |
|
|
(91 |
) |
|
|
(111 |
) |
|
|
|
|
|
|
|
|
|
|
|
|
| |
|
|
|
|
|
|
|
|
|
|
|
|
|
|
Deferred
Gains (Losses) on Cash Flow Hedges
(net of tax) |
|
|
|
|
|
|
|
|
|
|
|
|
|
|
|
|
|
|
|
|
|
|
|
|
Balance, beginning of year |
|
|
21 |
|
|
|
11 |
|
|
|
20 |
|
|
|
|
|
|
|
|
|
|
|
|
|
Net deferred gains on cash flow hedges |
|
|
(1 |
) |
|
|
– |
|
|
|
43 |
|
|
|
|
|
|
|
|
|
|
|
|
|
Reclassification adjustment to earnings |
|
|
(23 |
) |
|
|
10 |
|
|
|
(52 |
) |
|
|
|
|
|
|
|
|
|
|
|
|
| |
|
|
|
|
|
|
|
|
|
|
|
|
|
|
Balance, end of year |
|
|
(3 |
) |
|
|
21 |
|
|
|
11 |
|
|
|
|
|
|
|
|
|
|
|
|
|
| |
|
|
|
|
|
|
|
|
|
|
|
|
|
|
Minimum Pension Liability (net of tax) |
|
|
|
|
|
|
|
|
|
|
|
|
|
|
|
|
|
|
|
|
|
|
|
|
Balance, beginning of year |
|
|
(122 |
) |
|
|
(150 |
) |
|
|
(125 |
) |
|
|
|
|
|
|
|
|
|
|
|
|
Net minimum pension liability adjustment |
|
|
(31 |
) |
|
|
28 |
|
|
|
(25 |
) |
|
|
|
|
|
|
|
|
|
|
|
|
| |
|
|
|
|
|
|
|
|
|
|
|
|
|
|
Balance, end of year |
|
|
(153 |
) |
|
|
(122 |
) |
|
|
(150 |
) |
|
|
|
|
|
|
|
|
|
|
|
|
| |
|
|
|
|
|
|
|
|
|
|
|
|
|
|
Balance, end of year |
|
|
(844 |
) |
|
|
(481 |
) |
|
|
(551 |
) |
|
|
|
|
|
|
|
|
|
|
|
|
| |
|
|
|
|
|
|
|
|
|
|
|
|
|
|
Retained Earnings |
|
|
|
|
|
|
|
|
|
|
|
|
|
|
|
|
|
|
|
|
|
|
|
|
Balance, beginning of year |
|
|
22,485 |
|
|
|
18,692 |
|
|
|
15,491 |
|
|
|
|
|
|
|
|
|
|
|
|
|
Net earnings |
|
|
5,116 |
|
|
|
4,436 |
|
|
|
3,836 |
|
|
|
|
|
|
|
|
|
|
|
|
|
Preferred stock dividends declared |
|
|
(70 |
) |
|
|
(41 |
) |
|
|
(39 |
) |
|
|
|
|
|
|
|
|
|
|
|
|
Common stock dividends declared |
|
|
(707 |
) |
|
|
(602 |
) |
|
|
(596 |
) |
|
|
|
|
|
|
|
|
|
|
|
|
| |
|
|
|
|
|
|
|
|
|
|
|
|
|
|
Balance, end of year |
|
|
26,824 |
|
|
|
22,485 |
|
|
|
18,692 |
|
|
|
|
|
|
|
|
|
|
|
|
|
| |
|
|
|
|
|
|
|
|
|
|
|
|
|
|
Treasury Stock, at cost |
|
|
|
|
|
|
|
|
|
|
|
|
|
|
|
|
|
|
|
|
|
|
|
|
Balance, beginning of year |
|
|
(4,230 |
) |
|
|
(1,195 |
) |
|
|
(961 |
) |
|
|
(170,955,057 |
) |
|
|
(117,294,392 |
) |
|
|
(116,211,158 |
) |
Shares repurchased |
|
|
(3,700 |
) |
|
|
(2,968 |
) |
|
|
– |
|
|
|
(63,068,200 |
) |
|
|
(54,029,600 |
) |
|
|
– |
|
Shares issued to (reacquired from) employees(2) |
|
|
(18 |
) |
|
|
(74 |
) |
|
|
(273 |
) |
|
|
836,071 |
|
|
|
251,724 |
|
|
|
(2,094,352 |
) |
Share exchanges |
|
|
3 |
|
|
|
7 |
|
|
|
39 |
|
|
|
74,915 |
|
|
|
117,211 |
|
|
|
1,011,118 |
|
| |
|
|
|
|
Balance, end of year |
|
|
(7,945 |
) |
|
|
(4,230 |
) |
|
|
(1,195 |
) |
|
|
(233,112,271 |
) |
|
|
(170,955,057 |
) |
|
|
(117,294,392 |
) |
| |
|
|
|
|
Unamortized Employee Stock Grants |
|
|
|
|
|
|
|
|
|
|
|
|
|
|
|
|
|
|
|
|
|
|
|
|
Balance, beginning of year |
|
|
(872 |
) |
|
|
(623 |
) |
|
|
(775 |
) |
|
|
|
|
|
|
|
|
|
|
|
|
Net issuance of employee stock grants |
|
|
(1,507 |
) |
|
|
(765 |
) |
|
|
(440 |
) |
|
|
|
|
|
|
|
|
|
|
|
|
Amortization of employee stock grants |
|
|
687 |
|
|
|
516 |
|
|
|
592 |
|
|
|
|
|
|
|
|
|
|
|
|
|
| |
|
|
|
|
|
|
|
|
|
|
|
|
|
|
Balance, end of year |
|
|
(1,692 |
) |
|
|
(872 |
) |
|
|
(623 |
) |
|
|
|
|
|
|
|
|
|
|
|
|
| |
|
|
|
|
|
|
|
|
|
|
|
|
|
|
Total Common Stockholders’ Equity |
|
|
32,927 |
|
|
|
30,740 |
|
|
|
28,459 |
|
|
|
|
|
|
|
|
|
|
|
|
|
| |
|
|
|
|
|
|
|
|
|
|
|
|
|
|
Total Stockholders’ Equity |
|
$ |
35,600 |
|
|
$ |
31,370 |
|
|
$ |
28,884 |
|
|
|
|
|
|
|
|
|
|
|
|
|
| |
|
|
|
| (1) |
|
Other adjustments relate to policyholder liabilities, deferred policy acquisition costs,
and income taxes. |
| (2) |
|
Share amounts are net of reacquisitions from employees of 4,360,607 shares, 4,982,481 shares
and 8,355,168 shares in 2005, 2004 and 2003, respectively. |
See Notes to Consolidated Financial
Statements. |
70
Merrill Lynch 2005 Annual Report
Consolidated Statements of Comprehensive Income
| |
|
|
|
|
|
|
|
|
|
|
|
|
| |
|
Year Ended Last Friday in December |
|
| (dollars in millions) |
|
2005 |
|
|
2004 |
|
|
2003 |
|
| |
|
|
|
|
|
|
|
|
|
|
|
|
|
Net Earnings |
|
$ |
5,116 |
|
|
$ |
4,436 |
|
|
$ |
3,836 |
|
Other Comprehensive Income (Loss) |
|
|
|
|
|
|
|
|
|
|
|
|
Foreign currency translation adjustment: |
|
|
|
|
|
|
|
|
|
|
|
|
Foreign currency translation gains (losses) |
|
|
129 |
|
|
|
(359 |
) |
|
|
(392 |
) |
Income tax (expense) benefit |
|
|
(347 |
) |
|
|
371 |
|
|
|
411 |
|
| |
|
|
Total |
|
|
(218 |
) |
|
|
12 |
|
|
|
19 |
|
| |
|
|
|
|
|
|
|
|
|
|
|
|
|
|
|
Net unrealized gains (losses) on investment securities
available-for-sale: |
|
|
|
|
|
|
|
|
|
|
|
|
Net unrealized holding gains arising during the period |
|
|
184 |
|
|
|
365 |
|
|
|
598 |
|
Reclassification adjustment for realized gains included
in net earnings |
|
|
(340 |
) |
|
|
(335 |
) |
|
|
(571 |
) |
| |
|
|
|
|
|
|
|
|
|
|
|
|
|
|
|
Net unrealized gains (losses) on investment securities
available-for-sale |
|
|
(156 |
) |
|
|
30 |
|
|
|
27 |
|
| |
|
|
Adjustments for: |
|
|
|
|
|
|
|
|
|
|
|
|
Policyholder liabilities |
|
|
12 |
|
|
|
19 |
|
|
|
8 |
|
Deferred policy acquisition costs |
|
|
(2 |
) |
|
|
– |
|
|
|
(1 |
) |
Income tax (expense) benefit |
|
|
56 |
|
|
|
(29 |
) |
|
|
– |
|
| |
|
|
Total |
|
|
(90 |
) |
|
|
20 |
|
|
|
34 |
|
| |
|
|
|
|
|
|
|
|
|
|
|
|
|
|
|
Deferred gains (losses) on cash flow hedges |
|
|
|
|
|
|
|
|
|
|
|
|
Deferred gains (losses) on cash flow hedges |
|
|
(2 |
) |
|
|
(7 |
) |
|
|
37 |
|
Income tax benefit |
|
|
1 |
|
|
|
7 |
|
|
|
6 |
|
Reclassification adjustment to earnings |
|
|
(23 |
) |
|
|
10 |
|
|
|
(52 |
) |
| |
|
|
Total |
|
|
(24 |
) |
|
|
10 |
|
|
|
(9 |
) |
| |
|
|
|
|
|
|
|
|
|
|
|
|
|
|
|
Minimum pension liability |
|
|
|
|
|
|
|
|
|
|
|
|
Minimum pension liability adjustment |
|
|
(46 |
) |
|
|
38 |
|
|
|
(38 |
) |
Income tax (expense) benefit |
|
|
15 |
|
|
|
(10 |
) |
|
|
13 |
|
| |
|
|
Total |
|
|
(31 |
) |
|
|
28 |
|
|
|
(25 |
) |
| |
|
|
Total Other Comprehensive Income (Loss) |
|
|
(363 |
) |
|
|
70 |
|
|
|
19 |
|
| |
|
|
|
|
|
|
|
|
|
|
|
|
|
|
|
Comprehensive Income |
|
$ |
4,753 |
|
|
$ |
4,506 |
|
|
$ |
3,855 |
|
| |
See Notes to Consolidated Financial Statements.
Consolidated Statements of Cash Flows
| |
|
|
|
|
|
|
|
|
|
|
|
|
| |
|
Year Ended Last Friday in December |
|
| (dollars in millions) |
|
2005 |
|
|
2004 |
|
|
2003 |
|
| |
Cash Flows from Operating Activities |
|
|
|
|
|
|
|
|
|
|
|
|
|
|
|
|
|
|
|
|
|
|
|
|
|
Net Earnings |
|
$ |
5,116 |
|
|
$ |
4,436 |
|
|
$ |
3,836 |
|
Noncash items included in earnings: |
|
|
|
|
|
|
|
|
|
|
|
|
Depreciation and amortization |
|
|
473 |
|
|
|
506 |
|
|
|
570 |
|
Stock compensation expense |
|
|
1,003 |
|
|
|
876 |
|
|
|
998 |
|
Deferred taxes |
|
|
232 |
|
|
|
2 |
|
|
|
361 |
|
Policyholder reserves |
|
|
129 |
|
|
|
144 |
|
|
|
156 |
|
Undistributed earnings from equity investments |
|
|
(417 |
) |
|
|
(400 |
) |
|
|
(179 |
) |
Other |
|
|
888 |
|
|
|
23 |
|
|
|
(30 |
) |
Changes in operating assets and liabilities: |
|
|
|
|
|
|
|
|
|
|
|
|
Trading assets |
|
|
25,902 |
|
|
|
(46,918 |
) |
|
|
(21,141 |
) |
Cash and securities segregated for regulatory purposes or
deposited with clearing organizations |
|
|
3,259 |
|
|
|
(5,466 |
) |
|
|
466 |
|
Receivables under resale agreements |
|
|
(84,166 |
) |
|
|
(17,835 |
) |
|
|
(406 |
) |
Receivables under securities borrowed transactions |
|
|
2,014 |
|
|
|
(38,426 |
) |
|
|
71 |
|
Customer receivables |
|
|
(2,217 |
) |
|
|
(7,041 |
) |
|
|
(667 |
) |
Brokers and dealers receivables |
|
|
(19 |
) |
|
|
(4,768 |
) |
|
|
1,139 |
|
Trading liabilities |
|
|
(17,007 |
) |
|
|
14,447 |
|
|
|
6,304 |
|
Payables under repurchase agreements |
|
|
44,309 |
|
|
|
58,197 |
|
|
|
10,400 |
|
Payables under securities loaned transactions |
|
|
(2,901 |
) |
|
|
11,155 |
|
|
|
3,441 |
|
Customer payables |
|
|
1,238 |
|
|
|
12,141 |
|
|
|
(1,459 |
) |
Brokers and dealers payables |
|
|
(605 |
) |
|
|
1,024 |
|
|
|
2,568 |
|
Other, net |
|
|
(2,889 |
) |
|
|
2,962 |
|
|
|
2,228 |
|
| |
|
|
Cash Provided by (used for) Operating Activities |
|
|
(25,658 |
) |
|
|
(14,941 |
) |
|
|
8,656 |
|
| |
|
|
|
|
|
|
|
|
|
|
|
|
|
|
|
Cash Flows from Investing Activities |
|
|
|
|
|
|
|
|
|
|
|
|
Proceeds from (payments for): |
|
|
|
|
|
|
|
|
|
|
|
|
Maturities of available-for-sale securities |
|
|
25,452 |
|
|
|
26,602 |
|
|
|
31,345 |
|
Sales of available-for-sale securities |
|
|
36,574 |
|
|
|
27,983 |
|
|
|
56,448 |
|
Purchases of available-for-sale securities |
|
|
(51,283 |
) |
|
|
(54,498 |
) |
|
|
(81,639 |
) |
Maturities of held-to-maturity securities |
|
|
16 |
|
|
|
37 |
|
|
|
1,337 |
|
Purchases of held-to-maturity securities |
|
|
– |
|
|
|
(4 |
) |
|
|
(1,062 |
) |
Loans, notes, and mortgages, net |
|
|
(12,977 |
) |
|
|
(2,234 |
) |
|
|
(12,625 |
) |
Other investments and other assets |
|
|
(1,442 |
) |
|
|
(1,854 |
) |
|
|
(4,110 |
) |
Equipment and facilities, net |
|
|
(278 |
) |
|
|
(402 |
) |
|
|
(102 |
) |
| |
|
|
Cash Used for Investing Activities |
|
|
(3,938 |
) |
|
|
(4,370 |
) |
|
|
(10,408 |
) |
| |
|
|
|
|
|
|
|
|
|
|
|
|
|
|
|
Cash Flows from Financing Activities |
|
|
|
|
|
|
|
|
|
|
|
|
Proceeds from (payments for): |
|
|
|
|
|
|
|
|
|
|
|
|
Commercial paper and other short-term borrowings |
|
|
(77 |
) |
|
|
(1,021 |
) |
|
|
(353 |
) |
Deposits |
|
|
270 |
|
|
|
289 |
|
|
|
(2,385 |
) |
Issuance and resale of long-term borrowings |
|
|
49,703 |
|
|
|
50,535 |
|
|
|
29,754 |
|
Settlement and repurchase of long-term borrowings |
|
|
(31,195 |
) |
|
|
(23,231 |
) |
|
|
(26,454 |
) |
Derivative financing transactions |
|
|
6,347 |
|
|
|
6,642 |
|
|
|
584 |
|
Issuance of common stock |
|
|
858 |
|
|
|
589 |
|
|
|
624 |
|
Issuance of preferred stock, net |
|
|
2,043 |
|
|
|
205 |
|
|
|
– |
|
Common stock repurchases |
|
|
(3,700 |
) |
|
|
(2,968 |
) |
|
|
– |
|
Other common stock transactions |
|
|
(80 |
) |
|
|
41 |
|
|
|
69 |
|
Dividends |
|
|
(777 |
) |
|
|
(643 |
) |
|
|
(635 |
) |
| |
|
|
Cash Provided by Financing Activities |
|
|
23,392 |
|
|
|
30,438 |
|
|
|
1,204 |
|
| |
|
|
Increase (Decrease) in Cash and Cash Equivalents |
|
|
(6,204 |
) |
|
|
11,127 |
|
|
|
(548 |
) |
Cash and Cash Equivalents, beginning of year |
|
|
20,790 |
|
|
|
9,663 |
|
|
|
10,211 |
|
| |
|
|
Cash and Cash Equivalents, end of year |
|
$ |
14,586 |
|
|
$ |
20,790 |
|
|
$ |
9,663 |
|
| |
|
|
|
|
|
|
|
|
|
|
|
|
|
Supplemental Disclosures |
|
|
|
|
|
|
|
|
|
|
|
|
Cash paid for: |
|
|
|
|
|
|
|
|
|
|
|
|
Income taxes |
|
$ |
1,443 |
|
|
$ |
661 |
|
|
$ |
205 |
|
Interest |
|
|
21,519 |
|
|
|
10,345 |
|
|
|
7,898 |
|
| |
|
|
See Notes to Consolidated Financial Statements.
72
Merrill Lynch 2005 Annual Report
Notes to Consolidated Financial Statements
|
|
|
| NOTE 1
|
|
Summary of Significant Accounting Policies |
Description of Business
Merrill Lynch & Co., Inc. (“ML & Co.”) and subsidiaries (“Merrill Lynch”) provide investment,
financing, insurance, and related services to individuals and institutions on a global basis
through its broker, dealer, banking, insurance, and other financial services subsidiaries. Its
principal subsidiaries include:
| • |
|
Merrill Lynch, Pierce, Fenner & Smith Incorporated (“MLPF&S”), a U.S.-based broker-dealer in
securities and futures commission merchant; |
| |
| • |
|
Merrill Lynch International (“MLI”), a U.K.-based broker-dealer in securities and dealer in
equity and credit derivatives; |
| |
| • |
|
Merrill Lynch Government Securities Inc. (“MLGSI”), a U.S.-based dealer in U.S. Government
securities; |
| |
| • |
|
Merrill Lynch Capital Services, Inc., a U.S.-based dealer in interest rate, currency, credit
derivatives and commodities; |
| |
| • |
|
Merrill Lynch Investment Managers, LP, a U.S.-based asset management company; |
| |
| • |
|
Merrill Lynch Investment Managers Limited, a U.K.-based asset management company; |
| |
| • |
|
Merrill Lynch Bank USA (“MLBUSA”), a U.S.-based Federal Deposit Insurance Corporation
(“FDIC”)-insured depository institution; |
| |
| • |
|
Merrill Lynch Bank & Trust Co. (“MLB&T”), a U.S.-based FDIC-insured depository institution; |
| |
| • |
|
Merrill Lynch International Bank Limited (“MLIB”), a U.K.-based bank; |
| |
| • |
|
Merrill Lynch Capital Markets Bank Limited (“MLCMBL”), an Ireland-based bank; |
| |
| • |
|
Merrill Lynch Mortgage Capital, Inc., a U.S.-based dealer in syndicated commercial loans; |
| |
| • |
|
Merrill Lynch Japan Securities Co., Ltd. (“MLJS”), a Japan-based broker-dealer; |
| |
| • |
|
Merrill Lynch Life Insurance Company (“MLLIC”), a U.S.-based provider of annuity products; |
| |
| • |
|
ML Life Insurance Company of New York (“ML Life”), a U.S.-based provider of annuity products; |
| |
| • |
|
Merrill Lynch Derivative Products, AG, a Switzerland-based derivatives dealer; and |
| |
| • |
|
ML IBK Positions Inc., a U.S.-based entity involved in private equity and principal investing. |
Services provided to clients by Merrill Lynch and other activities include:
| • |
|
Securities brokerage, trading and underwriting; |
| |
| • |
|
Investment banking, strategic advisory services (including mergers and acquisitions) and other
corporate finance activities; |
| |
| • |
|
Wealth management products and services, including financial, retirement and generational
planning; |
| |
| • |
|
Asset management and investment advisory and related record-keeping services; |
| |
| • |
|
Origination, brokerage, dealer, and related activities in swaps, options, forwards,
exchange-traded futures, other derivatives, commodities and foreign exchange products; |
| |
| • |
|
Securities clearance, settlement financing services and prime brokerage; |
| |
| • |
|
Private equity and other principal investing activities; |
| |
| • |
|
Proprietary trading of securities, derivatives and loans; |
| |
| • |
|
Banking, trust, and lending services, including deposit-taking, consumer and commercial lending,
including mortgage loans, and related services; |
| |
| • |
|
Insurance and annuities sales; and |
| |
| • |
|
Research across the following disciplines: global equity strategy and economics, global fixed
income and equity-linked research, global fundamental equity research, and global wealth management
strategy. |
Basis of Presentation
The Consolidated Financial Statements include the accounts of Merrill Lynch, whose subsidiaries
are generally controlled through a majority voting interest but may be controlled by means of a
significant minority ownership, by contract, lease or otherwise. In certain cases, Merrill Lynch
subsidiaries (i.e., Variable Interest Entities (“VIEs”) may also be consolidated based on a risks
and rewards approach as required by Financial Accounting Standards Board (“FASB”) revised
Interpretation No. 46 (“FIN 46R”). See Note 7 to the Consolidated Financial Statements for further
discussion regarding the consolidation of VIEs.
The Consolidated Financial Statements are presented in accordance with accounting principles
generally accepted in the United States of America, which include industry practices. Intercompany
transactions and balances have been eliminated.
The Consolidated Financial Statements are presented in U.S. dollars. Many non-U.S. subsidiaries
have a functional currency (i.e., the currency in which activities are primarily conducted) that is
other than the U.S. dollar, often the currency of the country in which a subsidiary is domiciled.
Subsidiaries’ assets and liabilities are translated to U.S. dollars at year-end exchange rates,
while revenues and expenses are translated at average exchange rates during the year. Adjustments
that result from translating amounts in a subsidiary’s functional currency and related hedging, net
of related tax effects, are reported in stockholders’ equity as a component
of accumulated other comprehensive loss. All other translation adjustments are included in
earnings. Merrill Lynch uses derivatives to manage the currency exposure arising from activities in
non-U.S. subsidiaries. (See the Derivatives section for additional information on accounting for
derivatives.)
Certain reclassifications and format changes have been made to prior year amounts to conform to the
current year presentation. In the second quarter of 2005, Merrill Lynch elected, under FASB
Interpretation No. 39 (“FIN 39”), Offsetting of Amounts Related to Certain Contracts, to net cash
collateral paid or received under credit support annexes associated with legally enforceable master
netting agreements against derivatives inventory. Merrill Lynch believes this accounting
presentation is preferable as compared to a gross presentation as it is a better representation of
Merrill Lynch’s exposure relating to these derivative contracts. Amounts as of December 31, 2004
have been restated to conform to the current period presentation. The amounts netted at December
31, 2004 reduced total assets and total liabilities by $19.0 billion. Additionally, the December
31, 2004 Consolidated Balance Sheet reflects an immaterial restatement to correctly classify
certain securities, amounting to $430 million, from cash and cash equivalents to investment
securities-non-qualifying, a reclassification of $1.1 billion to properly reflect investment
securities-trading, which were previously included in trading assets, as well as a reclassification
of $953 million, to properly reflect payables under repurchase agreements, which were previously
included in investment securities-held-to-maturity.
Certain
hybrid instruments with embedded derivatives were reclassified on the
Consolidated Balance Sheets from
trading liabilities to long term borrowings to correct their classification. This reclassification
amounted to $3.0 billion at December 31, 2004. The associated interest charge was also reclassified
from principal transactions revenues to interest expense. The amounts reclassified to interest
expense were not material to the Consolidated Statements of Earnings.
In 2005, Merrill Lynch changed its policy for recording the changes in fair value of foreign
exchange contracts used to economically hedge foreign denominated assets or liabilities that are
translated at the spot rate. In prior periods, Merrill Lynch recorded the change in fair value
associated with the difference between the spot translation rate and the contracted forward
translation rate in interest revenue or expense, and the revaluation of the contract related to
changes in the spot rate was recorded in other expense or principal transactions revenues. In 2005,
Merrill Lynch changed its policy to record the entire change in fair value for these contracts in
other revenues in the Consolidated Statements of Earnings. Merrill Lynch made a similar change to
the classification of foreign exchange contracts that qualified as hedges of a net investment in a
foreign operation under Statement of Financial Accounting Standards (“SFAS”) No. 133, Accounting
for Derivative Instruments and Hedging Activities. In prior periods, changes in the fair value of
the hedge instruments that are associated with the difference between the spot translation rate and
the contracted forward translation rate (i.e., the ineffectiveness) were recorded in interest
revenue or expense. Consistent with the above change, these amounts are now reflected in other
revenues. Merrill Lynch believes this accounting presentation is more appropriate as it more
accurately reflects the overall changes in the fair value of the contracts. In addition, in prior
periods the changes related to the translation of foreign-denominated assets and liabilities were
recorded in other expense; these amounts have now been reclassified to other revenues. All prior
periods presented have been reclassified to conform to the current period presentation. The amounts
reclassified to other revenues were not material to the Consolidated Statements of Earnings.
Use of Estimates
In presenting the Consolidated Financial Statements, management makes estimates regarding:
| • |
|
Valuations of assets and liabilities requiring fair value estimates including: |
| |
• |
|
Trading inventory and investment securities; |
| |
| |
• |
|
Private equity investments; |
| |
| |
• |
|
Loans and allowance for loan losses; |
| • |
|
The outcome of litigation; |
| |
| • |
|
The realization of deferred taxes and tax reserves; |
| |
| • |
|
Assumptions and cash flow projections used in determining whether variable interest entities
(“VIEs”) should be consolidated and the determination of the qualifying status of special purpose
entities (“QSPEs”); |
| |
| • |
|
The carrying amount of goodwill and other intangible assets; |
| |
| • |
|
Valuation of employee stock options; |
| |
| • |
|
Insurance reserves and recovery of insurance deferred acquisition costs; |
| |
| • |
|
Other matters that affect the reported amounts and disclosure of contingencies in the financial
statements. |
Estimates, by their nature, are based on judgment and available information. Therefore, actual
results could differ from those estimates and could have a material impact on the Consolidated
Financial Statements, and it is possible that such changes could occur in the near term. A
discussion of certain areas in which estimates are a significant component of the amounts reported
in the Consolidated Financial Statements follows:
74
Merrill Lynch 2005 Annual Report
Trading Assets and Liabilities
Trading assets and liabilities are accounted for at fair value with realized and unrealized gains
and losses reported in earnings. Fair values of trading securities are based on quoted market
prices, pricing models (utilizing indicators of general market conditions and other economic
measurements), or management’s estimates of amounts to be realized on settlement, assuming current
market conditions and an orderly disposition over a reasonable period of time. Estimating the fair
value of certain illiquid securities requires significant management judgment. Merrill Lynch values
trading security assets at the institutional bid price and recognizes bid-offer revenues when
assets are sold. Trading security liabilities are valued at the institutional offer price and
bid-offer revenues are recognized when the positions are closed.
Fair values for over-the-counter (“OTC”) derivative financial instruments, principally forwards,
options, and swaps, represent the present value of amounts estimated to be received from or paid to
a third-party in settlement of these instruments. These derivatives are valued using pricing models
based on the net present value of estimated future cash flows and directly observed prices from
exchange-traded derivatives, other OTC trades, or external pricing services, while taking into
account the counterparty’s credit ratings, or Merrill Lynch’s own credit ratings, as appropriate.
Obtaining the fair value for OTC derivatives contracts requires the use of management judgment and
estimates.
New and/or complex instruments may have immature or limited markets. As a result, the pricing
models used for valuation often incorporate significant estimates and assumptions, which may impact
the results of operations reported in the Consolidated Financial Statements. For long-dated and
illiquid contracts, extrapolation methods are applied to observed market data in order to estimate
inputs and assumptions that are not directly observable. This enables Merrill Lynch to
mark-to-market all positions consistently when only a subset of prices are directly observable.
Values for OTC derivatives are verified using observed information about the costs of hedging the
risk and other trades in the market. As the markets for these products develop, Merrill Lynch
continually refines its pricing models based on experience to correlate more closely to the market
risk of these instruments. Unrealized gains at the inception of the derivative contract are not
recognized unless the valuation model incorporates significant observable market inputs.
Valuation adjustments are an integral component of the fair valuation process and may be taken
where either the sheer size of the trade or other specific features of the trade or particular
market (such as counterparty credit quality or concentration or market liquidity) requires the
valuation to be based on more than simple application of the pricing models.
Investment Securities
ML & Co. and certain of its non-broker-dealer subsidiaries follow the guidance prescribed by SFAS
No. 115, Accounting for Certain Investments in Debt and Equity Securities, when accounting for
investments in debt and publicly traded equity securities. Merrill Lynch classifies those debt
securities that it has the intent and ability to hold to maturity as held-to-maturity securities,
which are carried at cost unless a decline in value is deemed other-than-temporary, in which case
the carrying value is reduced. Those securities that are bought and held principally for the
purpose of selling them in the near term are classified as trading and marked to fair value through
earnings. All other qualifying securities are classified as available-for-sale with unrealized
gains and losses reported in accumulated other comprehensive loss. Any unrealized losses deemed
other-than-temporary are included in current period earnings and removed from accumulated other
comprehensive loss.
Investment securities are reviewed for other-than-temporary impairment on a quarterly basis. The
determination of other-than-temporary impairment will often depend on several factors, including
the severity and duration of the decline in value of the investment securities and the financial
condition of the issuer, and requires judgment. To the extent that Merrill Lynch has the ability
and intent to hold the investments for a period of time sufficient for a forecasted market price
recovery up to or beyond the cost of the investment, no impairment charge will be recognized.
Restricted Investments
Merrill Lynch holds investments that may have quoted market prices but that are subject to
restrictions (e.g., requires consent of the issuer or other investors to sell) that may limit
Merrill Lynch’s ability to realize the quoted market price. Restricted investments may be recorded
in either trading assets or investment securities. Merrill Lynch estimates the fair value of these
securities taking into account the restrictions using pricing models based on projected cash flows,
earnings multiples, comparisons based on similar transactions, and/or review of underlying
financial conditions and other market factors. Such estimation may result in a fair value for a
security that is less than its quoted market price.
Private Equity Investments
Certain private equity investments are held at fair value. Private equity investments held by
non-broker-dealer subsidiaries, which have defined exit strategies and are held for capital
appreciation and/or current income are accounted for under the AICPA Accounting and Auditing Guide,
Investment Companies (“Investment Company Guide”) and carried at fair value. Investments are
initially carried at original cost, and are adjusted when changes in the underlying fair values are
readily ascertainable, generally based on observable evidence.
Loans and Allowance for Loan Losses
Certain loans held by Merrill Lynch are carried at fair value or lower of cost or market (“LOCOM”)
and estimation is required in determining these fair values. The fair value of loans made in
connection with commercial lending activity, consisting primarily of senior debt, is primarily
estimated using discounted cash flows or the market value of publicly issued debt instruments.
Merrill Lynch’s estimate of fair value for other loans, notes, and mortgages is determined based on
the individual loan characteristics. For certain homogeneous categories of loans, including
residential mortgages and home equity loans, fair value is estimated using market price quotations
or previously executed transactions for securities backed by similar loans, adjusted for credit
risk and other individual loan characteristics. For Merrill Lynch’s variable-rate loan receivables,
carrying value approximates fair value.
Loans held for investment are carried at cost, less a provision for loan losses. This provision for
loan losses is based on management’s estimate of the amount necessary to maintain the allowance at
a level adequate to absorb probable incurred loan losses. Management’s estimate of loan losses is
influenced by many factors, including adverse situations that may affect the borrower’s ability to
repay, current economic conditions, prior loan loss experience, and the estimated fair value of any
underlying collateral. The fair value of collateral is generally determined by third-party
appraisals in the case of residential mortgages or quoted market prices for securities, or
estimates of fair value for other assets. Management’s estimates of loan losses include
considerable judgment about collectibility based on available facts and evidence at the balance
sheet date, and the uncertainties inherent in those assumptions. While management uses the best
information available on which to base its estimates, future adjustments to the allowance may be
necessary based on changes in the economic environment or variances between actual results and the
original assumptions used by management.
Legal and Other Reserves
Merrill Lynch is a party in various actions, some of which involve claims for substantial amounts.
Amounts are accrued for the financial resolution of claims that have either been asserted or are
deemed probable of assertion if, in the opinion of management, it is both probable that a liability
has been incurred and the amount of the liability can be reasonably estimated. In many cases, it is
not possible to determine whether a liability has been incurred or to estimate the ultimate or
minimum amount of that liability until years after the litigation has been commenced, in which case
no accrual is made until that time. Accruals are subject to significant estimation by management
with input from outside counsel.
Income Taxes
Deferred tax assets and liabilities are recorded for the effects of temporary differences between
the tax basis of an asset or liability and its reported amount in the Consolidated Financial
Statements. Merrill Lynch assesses its ability to realize deferred tax assets primarily based on
the earnings history and future earnings potential of the legal entities through which the deferred
tax assets will be realized as discussed in SFAS No. 109, Accounting for Income Taxes. See Note 15
to the Consolidated Financial Statements for further discussion of income taxes.
Variable Interest Entities
In the normal course of business, Merrill Lynch enters into a variety of transactions with VIEs.
The applicable accounting guidance requires Merrill Lynch to perform a qualitative and/or
quantitative analysis of a VIE to determine whether it is the primary beneficiary of the VIE and
therefore must consolidate the VIE. In performing this analysis, Merrill Lynch makes assumptions
regarding future performance of assets held by the VIE, taking into account estimates of credit
risk, estimates of the fair value of assets, timing of cash flows, and other significant factors.
It should also be noted that although a VIE’s actual results may differ from projected outcomes, a
revised consolidation analysis is not required. If a VIE meets the conditions to be considered a
QSPE, it is typically not required to be consolidated by Merrill Lynch. A QSPE’s activities must be
significantly limited. A servicer of the assets held by a QSPE may have discretion in restructuring
or working out assets held by the QSPE as long as the discretion is significantly limited and the
parameters of that discretion are fully described in the legal documents that established the QSPE.
Determining whether the activities of a QSPE and its servicer meet these conditions requires the
use of judgment by management.
Impairment of Goodwill and Other Intangibles
SFAS No. 142, Goodwill and Other Intangible Assets, requires Merrill Lynch to make certain
subjective and complex judgments, including assumptions and estimates used to determine the fair
value of its reporting units. The majority of Merrill Lynch’s goodwill
76
Merrill Lynch 2005 Annual Report
is related to the 1997 purchase of the Mercury Asset Management Group and resides in the
Merrill Lynch Investment Managers (“MLIM”) segment. The fair value of the MLIM segment is measured
based on a discounted expected future cash flows approach. The estimates used in preparing these
cash flows are based upon historical experience, current knowledge, and available external
information about future trends.
Employee Stock Options
The fair value of stock options is estimated as of the grant date based on a Black-Scholes option
pricing model. The Black-Scholes model takes into account the exercise price and expected life of
the option, the current price of the underlying stock and its expected volatility, expected
dividends, and the risk-free interest rate for the expected term of the option. Judgment is
required in determining certain of the inputs to the model. The expected life of the option is
based on an analysis of historical employee exercise behavior. The expected volatility is based on
Merrill Lynch’s historical monthly stock price volatility for the same number of months as the
expected life of the option. The fair value of the option estimated at grant date is not adjusted
for subsequent changes in assumptions.
Insurance Reserves and Deferred Acquisition Costs Relating to Insurance Policies
Merrill Lynch records reserves related to life insurance and annuity contracts. Included in these
reserves is a mortality reserve that is determined by projecting expected guaranteed benefits under
multiple scenarios. Merrill Lynch uses estimates for mortality and surrender assumptions based on
actual and projected experience for each contract type. These estimates are consistent with the
estimates used in the calculation of deferred policy acquisition costs.
Merrill Lynch records deferred policy acquisition costs that are amortized in proportion to the
estimated future gross profits for each group of contracts over the anticipated life of the
insurance contracts, utilizing an effective yield methodology. These future gross profit estimates
are subject to periodic evaluation by Merrill Lynch, with necessary revisions applied against
amortization to date.
Fair Value
At December 30, 2005, $613 billion, or 90%, of Merrill Lynch’s total assets and $622 billion,
or 96%, of Merrill Lynch’s total liabilities were carried at fair value or at amounts that
approximate fair value. At December 31, 2004, $569 billion, or 91%, of Merrill Lynch’s total assets
and $574 billion, or 96%, of Merrill Lynch’s total liabilities were carried at fair value or at
amounts that approximate such values. Financial instruments that are carried at fair value include
cash and cash equivalents, cash and securities segregated for regulatory purposes or deposited with
clearing organizations, trading assets and liabilities, securities received as collateral and
obligation to return securities received as collateral, available-for-sale and trading securities
included in investment securities, certain private equity investments, certain investments of
insurance subsidiaries and certain other investments.
Financial instruments recorded at amounts that approximate fair value include receivables under
resale agreements, receivables under securities borrowed transactions, other receivables, payables
under repurchase agreements, payables under securities loaned transactions, commercial paper and
other short-term borrowings, deposits, other payables, and long-term borrowings. The fair value of
these items is not materially sensitive to shifts in market interest rates because of the
short-term nature of many of these instruments and/or their variable interest rates.
The fair value amounts for financial instruments are disclosed in each respective Note to the
Consolidated Financial Statements.
Revenue Recognition
Asset management and portfolio service fees consist of:
| • |
|
Management fees, which represent a percentage of client assets under management, and are accrued
ratably over the service period. Management fees are presented net of payments made to distributors
of MLIM funds; |
| |
| • |
|
Account fees, which generally represent a fixed annual charge and are recognized ratably over the
period in which services are provided; and |
| |
| • |
|
Performance fees, which are earned if investment performance exceeds predetermined levels, and
are generally accrued based on performance to date. |
Commissions revenues includes commissions, mutual fund distribution fees and contingent deferred
sale charge revenue, which are all accrued as earned. Commissions revenues also includes mutual
fund redemption fees, which are recognized at the time of redemption. Commissions revenues earned
from certain customer equity transactions are recorded net of related brokerage, clearing and
exchange fees.
Principal transactions revenues include both realized and unrealized gains and losses on trading
assets and trading liabilities and investment securities classified as trading investments.
Realized gains and losses are recognized on a trade date basis.
Investment banking revenues include underwriting revenues and fees for merger and acquisition
advisory services, which are accrued when services for the transactions are substantially
completed. Transaction-related expenses are deferred to match revenue recognition. Investment
banking and advisory services revenues are presented net of transaction-related expenses.
Revenues from consolidated investments and expenses of consolidated investments are related to
investments that are consolidated under SFAS No. 94, Consolidation of All Majority-Owned
Subsidiaries, and FIN 46R. Expenses of consolidated investments primarily consist of minority
interest expense and cost of goods sold related to manufacturing entities that are consolidated and
are part of Merrill Lynch’s private equity and principal investment activities.
Balance Sheet Captions
The following are descriptions of specific balance sheet captions. Refer to the related Notes
to the Consolidated Financial Statements for additional information.
Cash and Cash Equivalents
Merrill Lynch defines cash equivalents as short-term, highly liquid securities, federal funds sold,
and interest-earning deposits with maturities, when purchased, of 90 days or less, that are not
used for trading purposes.
Cash and Securities Segregated for Regulatory Purposes or Deposited with Clearing Organizations
Merrill Lynch maintains relationships with clients around the world and, as a result, it is subject
to various regulatory regimes. As a result of its client activities, Merrill Lynch is obligated by
rules mandated by its primary regulators, including the Securities and Exchange Commission (“SEC”)
and the Commodities Futures Trading Commission (“CFTC”) in the United States and the Financial
Services Authority (“FSA”) in the United Kingdom to segregate or set aside cash and/or qualified
securities to satisfy these regulations, which have been promulgated to protect customer assets. In
addition, Merrill Lynch is a member of various clearing organizations at which it maintains cash
and/or securities required for the conduct of its day-to-day clearance activities.
Securities Financing Transactions
Merrill Lynch enters into repurchase and resale agreements and securities borrowed and loaned
transactions to accommodate customers (also referred to as “matched-book transactions”), and earn
residual interest rate spreads, obtain securities for settlement and finance inventory positions.
Merrill Lynch also engages in securities financing for customers through margin lending (see the
customer receivables and payables section).
Resale and repurchase agreements are accounted for as collateralized financing transactions and are
recorded at their contractual amounts plus accrued interest. Merrill Lynch’s policy is to obtain
possession of collateral with a market value equal to or in excess of the principal amount loaned
under resale agreements. To ensure that the market value of the underlying collateral remains
sufficient, collateral is valued daily, and Merrill Lynch may require counterparties to deposit
additional collateral or return collateral pledged, when appropriate.
Substantially all repurchase and resale activities are transacted under master netting agreements
that give Merrill Lynch the right, in the event of default, to liquidate collateral held and to
offset receivables and payables with the same counterparty. Merrill Lynch offsets certain
repurchase and resale agreement balances with the same counterparty on the Consolidated Balance
Sheets.
Merrill Lynch may use securities received as collateral for resale agreements to satisfy regulatory
requirements such as Rule 15c3-3 of the SEC.
Securities borrowed and loaned transactions are recorded at the amount of cash collateral advanced
or received. Securities borrowed transactions require Merrill Lynch to provide the counterparty
with collateral in the form of cash, letters of credit, or other securities. Merrill Lynch receives
collateral in the form of cash or other securities for securities loaned transactions. For these
transactions, the fees received or paid by Merrill Lynch are recorded as interest revenue or
expense. On a daily basis, Merrill Lynch monitors the market value of securities borrowed or loaned
against the collateral value, and Merrill Lynch may require counterparties to deposit additional
collateral or return collateral pledged, when appropriate. Although substantially all securities
borrowing and lending activities are transacted under master netting agreements, such receivables
and payables with the same counterparty are not offset on the Consolidated Balance Sheets.
All firm-owned securities pledged to counterparties where the counterparty has the right, by
contract or custom, to sell or repledge the securities are disclosed parenthetically in trading
assets and investment securities on the Consolidated Balance Sheets.
78
Merrill Lynch 2005 Annual Report
In transactions where Merrill Lynch acts as the lender in a securities lending agreement and
receives securities that can be pledged or sold as collateral, it recognizes an asset on the
Consolidated Balance Sheets, representing the securities received (securities received as
collateral), and a liability for the same amount, representing the obligation to return those
securities (obligation to return securities received as collateral). The amounts on the
Consolidated Balance Sheets result from non-cash transactions.
Trading Assets and Liabilities
Merrill Lynch’s trading activities consist primarily of securities brokerage and trading;
derivatives dealing and brokerage; commodities trading and brokerage; and securities financing
transactions. Trading assets and trading liabilities consist of cash instruments (such as
securities and loans) and derivative instruments used for trading purposes or for managing risk
exposures in other trading inventory. See the Derivatives section for additional information on
accounting policy for derivatives. Trading assets and trading liabilities also include commodities
inventory.
Trading securities and other cash instruments (e.g., loans held for trading purposes) are recorded
on a trade date basis at fair value. Included in trading liabilities are securities that Merrill
Lynch has sold but did not own and will therefore be obligated to purchase at a future date (“short
sales”). Commodities inventory is recorded at the lower of cost or market value. Changes in fair
value of trading assets and liabilities (i.e., unrealized gains and losses) are recognized as
principal transactions revenues in the current period. Realized gains and losses and any related
interest amounts are included in principal transactions revenues and interest revenues and
expenses, depending on the nature of the instrument.
Fair values of trading assets and liabilities are based on quoted market prices, pricing models
(utilizing indicators of general market conditions or other economic measurements), or management’s
best estimates of amounts to be realized on settlement, assuming current market conditions and an
orderly disposition over a reasonable period of time. As previously noted, estimating the fair
value of certain trading assets and liabilities requires significant management judgment.
Derivatives
A derivative is an instrument whose value is “derived” from an underlying instrument or index such
as a future, forward, swap, or option contract, or other financial instrument with similar
characteristics. Derivative contracts often involve future commitments to exchange interest payment
streams or currencies based on a notional or contractual amount (e.g., interest rate swaps or
currency forwards) or to purchase or sell other financial instruments at specified terms on a
specified date (e.g., options to buy or sell securities or currencies). Derivative activity is
subject to Merrill Lynch’s overall risk management policies and procedures. See Note 6 to the
Consolidated Financial Statements for further information.
Accounting for Derivatives and Hedging Activities
SFAS No. 133, as amended, establishes accounting and reporting standards for derivative
instruments, including certain derivative instruments embedded in other contracts (“embedded
derivatives”) and for hedging activities. SFAS No. 133 requires that an entity recognize all
derivatives as either assets or liabilities in the Consolidated Balance Sheets and measure those
instruments at fair value. The fair value of all derivatives is recorded on a net-by-counterparty
basis on the Consolidated Balance Sheets where management believes a legal right of setoff exists
under an enforceable netting agreement.
The accounting for changes in fair value of a derivative instrument depends on its intended use and
if it is designated and qualifies as an accounting hedging instrument.
Merrill Lynch enters into derivatives to facilitate client transactions, for proprietary trading
and financing purposes, and to manage its risk exposures arising from trading assets and
liabilities. Derivatives entered into for these purposes are recognized at fair value on the
Consolidated Balance Sheets as trading assets and liabilities in contractual agreements and the
change in fair value is reported in current period earnings as principal transactions revenues.
Merrill Lynch also enters into derivatives in order to manage its risk exposures arising from
assets and liabilities not carried at fair value as follows:
| 1. |
|
Merrill Lynch routinely issues debt in a variety of maturities and currencies to achieve the
lowest cost financing possible. In addition, Merrill Lynch’s regulated bank entities accept time
deposits of varying rates and maturities. Merrill Lynch enters into derivative transactions to
hedge these liabilities. Derivatives used most frequently include swap agreements that: |
| |
• |
|
Convert fixed-rate interest payments into variable payments |
| |
| |
• |
|
Change the underlying interest rate basis or reset frequency |
| |
| |
• |
|
Change the settlement currency of a debt instrument. |
| 2. |
|
Merrill Lynch enters into hedges on marketable investment securities to manage the interest rate
risk, currency risk, and net duration of its investment portfolios. |
| 3. |
|
Merrill Lynch enters into fair value hedges of long-term fixed rate resale and repurchase
agreements to manage the interest rate risk of these assets and liabilities. |
| |
| 4. |
|
Merrill Lynch uses foreign-exchange forward contracts, foreign-exchange options, currency swaps,
and foreign-currency-denominated debt to hedge its net investments in foreign operations. These
derivatives and cash instruments are used to mitigate the impact of changes in exchange rates. |
| |
| 5. |
|
Merrill Lynch enters into futures and forwards to manage the price risk of certain commodity
inventory. |
Derivatives entered into by Merrill Lynch to hedge its funding, marketable investment securities
and net investments in foreign subsidiaries are reported at fair value in other assets or interest
and other payables in the Consolidated Balance Sheets at December 30, 2005 and December 31, 2004.
Derivatives used to hedge commodity inventory are included in trading assets and trading
liabilities on the Consolidated Balance Sheets at December 30, 2005 and December 31, 2004.
Derivatives that qualify as accounting hedges under the guidance in SFAS No. 133 are designated, on
the date they are entered into, as either:
| 1. |
|
A hedge of the fair value of a recognized asset or liability (“fair value” hedge). Changes in
the fair value of derivatives that are designated and qualify as fair value hedges of interest rate
risk, along with the gain or loss on the hedged asset or liability that is attributable to the
hedged risk, are recorded in current period earnings as interest revenue or expense. Changes in the
fair value of derivatives that are designated and qualify as fair value hedges of commodity price
risk, along with the gain or loss on the hedged asset or liability that is attributable to the
hedged risk, are recorded in current period earnings in principal transactions. |
| |
| 2. |
|
A hedge of the variability of cash flows to be received or paid related to a recognized asset or
liability (“cash flow” hedge). Changes in the fair value of derivatives that are designated and
qualify as cash flow hedges are recorded in accumulated other comprehensive loss until earnings are
affected by the variability of cash flows of the hedged asset or liability (e.g., when periodic
interest accruals on a variable-rate asset or liability are recorded in earnings). |
| |
| 3. |
|
A hedge of a net investment in a foreign operation. Changes in the fair value of derivatives
that are designated and qualify as hedges of a net investment in a foreign operation are recorded
in the foreign currency translation adjustment account within accumulated other comprehensive loss.
Changes in the fair value of the hedge instruments that are associated with the difference between
the spot translation rate and the forward translation rate are recorded in current period earnings
in other revenues. |
Merrill Lynch formally assesses, both at the inception of the hedge and on an ongoing basis,
whether the hedging derivatives are highly effective in offsetting changes in fair value or cash
flows of hedged items. When it is determined that a derivative is not highly effective as a hedge,
Merrill Lynch discontinues hedge accounting. Under the provisions of SFAS No. 133, 100% hedge
effectiveness is assumed for those derivatives whose terms meet the conditions of SFAS No. 133
“short-cut method.”
As noted above, Merrill Lynch enters into fair value hedges of interest rate exposure associated
with certain investment securities and debt issuances. Merrill Lynch uses interest rate swaps to
hedge this exposure. Hedge effectiveness testing is required for certain of these hedging
relationships on a quarterly basis. Merrill Lynch assesses effectiveness on a prospective basis by
comparing the expected change in the price of the hedge instrument to the expected change in the
value of the hedged item under various interest rate shock scenarios. In addition, Merrill Lynch
assesses effectiveness on a retrospective basis using the Dollar-Offset ratio approach. When
assessing hedge effectiveness, there are no attributes of the derivatives used to hedge the fair
value exposure that are excluded from the assessment. In addition, the amount of hedge
ineffectiveness on fair value hedges reported in earnings was not material for all periods
presented. Merrill Lynch also enters into fair value hedges of commodity price risk associated with
certain commodity inventory. For these hedges, Merrill Lynch assesses effectiveness on a
prospective and retrospective basis using regression techniques. The difference between the spot
rate and the contracted forward rate which represents the time value of money is excluded from the
assessment of hedge effectiveness and is recorded in principal transactions. The amount of hedge
ineffectiveness on these fair value hedges reported in earnings was not material for all periods
presented.
The majority of deferred net gains (losses) on derivative instruments designated as cash flow
hedges that were in accumulated other comprehensive loss at December 30, 2005 are expected to be
reclassified into earnings over the next three years. The amount of ineffectiveness related to
these hedges reported in earnings was not material for all periods presented.
For the years ended 2005 and 2004, respectively, $731 million and $458 million of net losses
related to non-U.S. dollar hedges of investments in non-U.S. dollar subsidiaries were included in
accumulated other comprehensive loss on the Consolidated Balance Sheets. These amounts were
substantially offset by net gains on the hedged investments.
80
Merrill Lynch 2005 Annual Report
Changes in the fair value of derivatives that are economically used to hedge non-trading assets
and liabilities, but that do not meet the criteria in SFAS No. 133 to qualify as an accounting
hedge, are reported in current period earnings as either principal transactions revenues, other
revenues or expenses, or interest revenues or expenses, depending on the nature of the transaction.
Embedded Derivatives
Merrill Lynch issues debt and certificates of deposit whose coupons or repayment terms are linked
to the performance of debt or equity securities, indices or currencies. The contingent payment
components of these obligations may meet the definition in SFAS No. 133 of an “embedded
derivative.” These debt instruments are assessed to determine if the embedded derivative requires
separate reporting and accounting, and if so, the embedded derivative is accounted for at fair
value and reported in long-term borrowings or deposits on the Consolidated Balance Sheets along
with the debt obligation. Changes in the fair value of the embedded derivative and related economic
hedges are reported in principal transactions revenues. Separating an embedded derivative from its
host contract requires careful analysis, judgment, and an understanding of the terms and conditions
of the instrument.
Merrill Lynch may also purchase financial instruments that contain embedded derivatives. These
instruments may be part of either trading inventory or trading marketable investment securities.
These instruments are generally accounted for at fair value in their entirety; the embedded
derivative is not separately accounted for, and all changes in fair value are reported in principal
transactions revenues.
Derivatives that Contain a Significant Financing Element
In the ordinary course of trading activities, Merrill Lynch enters into certain transactions that
are documented as derivatives where a significant cash investment is made by one party. These
transactions can be in the form of simple interest rate swaps where the fixed leg is prepaid or may
be in the form of equity-linked or credit-linked transactions where the initial investment equals
the notional amount of the derivative. In accordance with SFAS No. 149, Amendment of Statement 133
on Derivative Instruments and Hedging Activities, certain derivative instruments entered into or
modified after June 30, 2003 that contain a significant financing element at inception and where
Merrill Lynch is deemed to be the borrower, are included in financing activities in the
Consolidated Statements of Cash Flows. Prior to July 1, 2003, the activity associated with such
derivative instruments is included in operating activities in the Consolidated Statements of Cash
Flows. In addition, the cash flows from all other derivative transactions that do not contain a
significant financing element at inception are included in operating activities.
Investment Securities
Investment securities consist of marketable investment securities, investments of Merrill Lynch
insurance subsidiaries, and other investments.
Marketable Investment Securities
ML & Co. and certain of its non-broker-dealer subsidiaries hold debt and equity investments, which
are primarily classified as available-for-sale.
Debt and marketable equity securities classified as available-for-sale are reported at fair value.
Unrealized gains or losses on these securities are reported in stockholders’ equity as a component
of accumulated other comprehensive loss, net of income taxes and other related items. However, to
the extent that Merrill Lynch enters into interest rate swaps to hedge the interest rate exposure
of certain available-for-sale investment securities, the gain or loss on the derivative instrument,
as well as the offsetting loss or gain on the investment security, are recorded in current period
earnings as interest revenue or expense. (Refer to the Derivatives section for additional
information.) Any unrealized losses deemed other-than-temporary are included in current period
earnings.
Debt securities that Merrill Lynch has the positive intent and ability to hold to maturity are
classified as held-to-maturity. These investments are recorded at amortized cost unless a decline
in value is deemed other-than-temporary, in which case the carrying value is reduced. The
amortization of premiums or accretion of discounts and any unrealized losses deemed
other-than-temporary are included in current period earnings.
Debt and marketable equity securities purchased principally for the purpose of resale in the near
term are classified as trading investments and are reported at fair value. Unrealized gains or
losses on these investments are included in current period earnings.
Realized gains and losses on all investment securities are included in current period earnings. For
purposes of computing realized gains and losses, the cost basis of each investment sold is
generally based on the average cost method.
Investments of Insurance Subsidiaries and Related Liabilities
Insurance liabilities are future benefits payable under annuity and life insurance contracts and
include deposits received plus interest credited during the contract accumulation period, the
present value of future payments for contracts that have annuitized, and a
mortality provision for certain products. Certain policyholder liabilities are also adjusted for
those investments classified as available-for-sale. Liabilities for unpaid claims consist of the
mortality benefit for reported claims and an estimate of unreported claims based upon actual and
projected experience for each contract type.
Substantially all security investments of insurance subsidiaries are classified as
available-for-sale and recorded at fair value. These investments support Merrill Lynch’s in-force,
universal life-type contracts. Merrill Lynch records adjustments to deferred policy acquisition
costs and policyholder account balances which, when combined, are equal to the gain or loss that
would have been recorded if those available-for-sale investments had been sold at their estimated
fair values and the proceeds reinvested at current yields. The corresponding credits or charges for
these adjustments are recorded in stockholders’ equity as a component of accumulated other
comprehensive loss, net of applicable income taxes.
Certain variable costs related to the sale or acquisition of new and renewal insurance contracts
have been deferred, to the extent deemed recoverable, and amortized over the estimated lives of the
contracts in proportion to the estimated gross profit for each group of contracts.
Other Investments
Other investments primarily consist of private equity investments. Refer to Note 5 to the
Consolidated Financial Statements for further information.
Other Receivables and Payables
Customer Receivables and Payables
Customer securities transactions are recorded on a settlement date basis. Receivables from and
payables to customers include amounts due on cash and margin transactions, including futures
contracts transacted on behalf of Merrill Lynch customers. Securities owned by customers, including
those that collateralize margin or other similar transactions, are not reflected on the
Consolidated Balance Sheets.
Brokers and Dealers Receivables and Payables
Receivables from brokers and dealers include amounts receivable for securities not delivered by
Merrill Lynch to a purchaser by the settlement date (“fails to deliver”), margin deposits,
commissions, and net receivables arising from unsettled trades. Payables to brokers and dealers
include amounts payable for securities not received by Merrill Lynch from a seller by the
settlement date (“fails to receive”). Brokers and dealers receivables and payables also include
amounts related to futures contracts on behalf of Merrill Lynch customers as well as net payables
and receivables from unsettled trades.
Interest and Other Receivables and Payables
Interest and other receivables include interest receivable on corporate and governmental
obligations, customer or other receivables, and stock-borrowed transactions. Also included are
receivables from income taxes, underwriting and advisory fees, commissions and fees, and other
receivables. Interest and other payables include interest payable for stock-loaned transactions,
and short-term and long-term borrowings. Also included are amounts payable for employee
compensation and benefits, income taxes, minority interest, non-trading derivatives, dividends,
other reserves, and other payables.
Loans, Notes, and Mortgages, Net
Merrill Lynch’s lending and related activities include loan originations, syndications, and
securitizations. Loan originations include corporate and institutional loans, residential and
commercial mortgages, asset-based loans, and other loans to individuals and businesses. Merrill
Lynch also engages in secondary market loan trading and margin lending (see trading assets and
liabilities and customer receivables and payables sections, respectively). Loans included in loans,
notes, and mortgages are classified for accounting purposes as loans held for investment and loans
held for sale.
Loans held for investment purposes include:
| • |
|
commercial loans |
| |
| • |
|
small business loans and some consumer loans |
| |
| • |
|
certain residential mortgage loans. |
These loans are carried at their principal amount outstanding. An allowance for loan losses is
established through provisions that are based on management’s estimate of probable incurred losses.
Loans are charged off against the allowance for loan losses when management determines that the
loan is uncollectible. The loan loss provision related to loans held for investment is included in
interest revenue in the Consolidated Statements of Earnings. In general, loans are evaluated for
impairment when they are greater than 90 days past due or exhibit credit quality weakness. Loans
are considered impaired when it is probable that Merrill Lynch will not be able to collect all
principal and interest due from the borrower. All payments received on impaired loans are applied
to principal until the principal balance has been reduced to a level where collection of the
remaining recorded investment is not in doubt. Typically, when collection of principal on an
impaired loan is not in doubt, contractual interest will be credited to interest income when
received.
82
Merrill Lynch 2005 Annual Report
Loans held for sale include:
| • |
|
commercial loans that are in the process of being syndicated |
| |
| • |
|
certain purchased automobile loans |
| |
| • |
|
certain residential mortgage loans which are typically sold via securitization. |
These loans are reported at LOCOM. Declines in the carrying value of loans held for sale are
included in other revenues in the Consolidated Statements of Earnings.
Nonrefundable loan origination fees, loan commitment fees, and “draw down” fees received in
conjunction with financing arrangements are generally deferred and recognized over the contractual
life of the loan as an adjustment to the yield. If, at the outset, or any time during the term of
the loan, it becomes highly probable that the repayment period will be extended, the amortization
is recalculated using the expected remaining life of the loan. When the loan contract does not
provide for a specific maturity date, management’s best estimate of the repayment period is used.
At repayment of the loan, any unrecognized deferred fee is immediately recognized in earnings.
Separate Accounts Assets and Liabilities
Merrill Lynch maintains separate accounts representing segregated funds held for purposes of
funding variable life and annuity contracts. The separate accounts assets are not subject to
general claims of Merrill Lynch. These accounts and the related liabilities are recorded as
separate accounts assets and separate accounts liabilities on the Consolidated Balance Sheets.
Absent any contract provision wherein Merrill Lynch guarantees either a minimum return or account
value upon death or annuitization, the net investment income and net realized and unrealized gains
and losses attributable to separate accounts assets supporting variable life and annuity contracts
accrue directly to the contract owner and are not reported as revenue in the Consolidated
Statements of Earnings. Mortality, policy administration and withdrawal charges associated with
separate accounts products are included in other revenues in the Consolidated Statements of
Earnings.
Equipment and Facilities
Equipment and facilities consist primarily of technology hardware and software, leasehold
improvements, and owned facilities. Equipment and facilities are reported at historical cost, net
of accumulated depreciation and amortization, except for land, which is reported at historical
cost.
Depreciation and amortization are computed using the straight-line method. Equipment is depreciated
over its estimated useful life, while leasehold improvements are amortized over the lesser of the
improvement’s estimated economic useful life or the term of the lease. Maintenance and repair costs
are expensed as incurred.
Included in the occupancy and related depreciation expense category was depreciation and
amortization of $200 million, $198 million, and $209 million in 2005, 2004, and 2003, respectively.
Depreciation and amortization recognized in the communications and technology expense category was
$273 million, $308 million, and $361 million for 2005, 2004, and 2003, respectively.
Qualifying costs incurred in the development of internal-use software are capitalized when costs
exceed $5 million and are amortized over the useful life of the developed software, generally not
exceeding three years.
Goodwill and Other Intangibles
In accordance with SFAS No. 142, goodwill and indefinite-lived intangible assets are tested
annually (or more frequently under certain conditions) for impairment. Other intangible assets are
amortized over their useful lives.
As of December 30, 2005, goodwill and other intangible assets of $6,035 million was comprised of
net goodwill of $5,803 million and net intangible assets of $232 million. As of December 31, 2004,
goodwill and other intangible assets of $6,162 million was comprised of net goodwill of $6,035
million and net intangible assets of $127 million. There were no intangible assets that were
considered to be indefinite-lived at December 30, 2005 and December 31, 2004. The majority of the
goodwill, and related accumulated amortization, is denominated in sterling, and as a result has
changed from 2004 due to exchange rate changes. Goodwill and other intangibles also includes the
impact of the acquisition of The Advest Group, Inc. (“Advest”) in 2005, as well as goodwill and
other intangibles from other smaller acquisitions. Refer to Note 17 to the Consolidated Financial
Statements for further information.
Accumulated amortization of goodwill and other intangible assets amounted to $1,076 million and
$1,124 million at year-end 2005 and 2004, respectively. The change is primarily due to changes in
exchange rates.
Merrill Lynch has reviewed its goodwill in accordance with SFAS No. 142 and determined that the
fair value of the reporting units to which goodwill relates exceeded the carrying value of such
reporting units. Accordingly, no goodwill impairment loss has been recognized. The majority of the
goodwill is related to the 1997 purchase of the Mercury Asset Management Group and was tested for
impairment at the MLIM segment level since this business has been fully integrated into MLIM.
Other Assets
Other assets includes unrealized gains on derivatives used to hedge Merrill Lynch’s non-trading
borrowing and investing activities. All of these derivatives are recorded at fair value with
changes reflected in earnings or accumulated other comprehensive loss (refer to the Derivatives
section for more information). Other assets also includes prepaid pension expense related to plan
contributions in excess of obligations, other prepaid expenses, and other deferred charges. Refer
to Note 13 to the Consolidated Financial Statements for further information.
In addition, real estate purchased for investment purposes is also included in this category. Real
estate held in this category may be classified as either held and used or held for sale depending
on the facts and circumstances. Real estate held and used is valued at cost, less depreciation, and
real estate held for sale is valued at the lower of cost or fair value, less estimated cost to
sell.
Commercial Paper and Short- and Long-Term Borrowings
Merrill Lynch’s unsecured general-purpose funding is principally obtained from medium-term and
long-term borrowings. Commercial paper, when issued at a discount, is recorded at the proceeds
received and accreted to its par value. Long-term borrowings are carried at the principal amount
borrowed, net of unamortized discounts or premiums, adjusted for the effects of fair-value hedges.
Merrill Lynch is an issuer of debt whose coupons or repayment terms are linked to the performance
of equity, debt, a basket of securities or other indices. These debt instruments must be separated
into a debt host and an embedded derivative if the derivative is not considered clearly and closely
related under the criteria established in SFAS No. 133. Embedded derivatives are recorded at fair
value and changes in fair value are reflected in earnings. Beginning in 2004, in accordance with
SEC guidance, Merrill Lynch amortizes any observable upfront profit associated with the embedded
derivative into income as a yield adjustment over the life of the related debt instrument or
certificate of deposit. This resulted in deferred revenue, net of related amortization, of $126
million and $184 million for the years ended December 30, 2005 and December 31, 2004, respectively.
See the Embedded Derivatives section above for additional information.
Merrill Lynch uses derivatives to manage the interest rate, currency, equity, and other risk
exposures of its borrowings. See the Derivatives section for additional information on accounting
policy for derivatives.
Deposits
Savings deposits are interest-bearing accounts that have no maturity or expiration date, whereby
the depositor is not required by the deposit contract, but may at any time be required by the
depository institution, to give written notice of an intended withdrawal not less than seven days
before withdrawal is made. Time deposits are accounts that have a stipulated maturity and interest
rate. Depositors holding time deposits may recover their funds prior to the stated maturity but may
pay a penalty to do so. In certain cases, Merrill Lynch enters into interest rate swaps to hedge
the fair value risk in these time deposits. See the Derivatives section above for additional
information.
Stock-Based Compensation
Merrill Lynch accounts for stock-based compensation in accordance with the fair value method in
SFAS No. 123, Accounting for Stock-Based Compensation. Under the fair value recognition provisions
of SFAS No. 123, stock-based compensation cost is measured at the grant date based on the value of
the award and is recognized as expense on a straight-line basis over the vesting period. The
unamortized portion of the grant value for certain of these plans is reflected as a reduction of
stockholders’ equity in unamortized employee stock grants on the Consolidated Balance Sheets. See
Note 14 to the Consolidated Financial Statements for additional disclosures related to stock-based
compensation.
Income Taxes
ML & Co. and certain of its wholly-owned subsidiaries file a consolidated U.S. federal income
tax return. Certain other Merrill Lynch entities file tax returns in their local jurisdictions.
Merrill Lynch provides for income taxes on all transactions that have been recognized in the
Consolidated Financial Statements in accordance with SFAS No. 109. Accordingly, deferred taxes are
adjusted to reflect the tax rates at which future taxable amounts will likely be settled or
realized. The effects of tax rate changes on future deferred tax liabilities and deferred tax
assets, as well as other changes in income tax laws, are recognized in net earnings in the period
during which such changes are enacted. Deferred tax assets and liabilities are included in interest
and other receivables and interest and other payables, respectively, on the Consolidated
84
Merrill Lynch 2005 Annual Report
Balance Sheets. Valuation allowances are established when necessary to reduce deferred tax
assets to the amounts expected to be realized. See Note 15 to the Consolidated Financial Statements
for further information.
New Accounting Pronouncements
In February 2006, the Financial Accounting Standards Board (“FASB”) issued SFAS No. 155,
Accounting for Certain Hybrid Financial Instruments an amendment of FASB Statements No. 133 and
140. This Statement will be effective for Merrill Lynch beginning in the first quarter of 2007.
Earlier adoption is permitted. The statement permits interests in hybrid financial assets that
contain an embedded derivative that would require bifurcation to be accounted for as a single
financial instrument at fair value with changes in fair value recognized in earnings. This election
is permitted on an instrument-by-instrument basis for all hybrid financial instruments held,
obtained, or issued as of the adoption date. Merrill Lynch is currently assessing the impact and
timing of adoption of the proposed guidance.
In December 2005, the FASB issued FASB Staff Position (“FSP”) SOP 94-6-1, Terms of Loan Products
That May Give Rise to a Concentration of Credit Risk. The guidance requires the disclosure of
concentrations of loans with certain features that may increase the creditor’s exposure to risk of
nonpayment or realization. These loans are often referred to as “non-traditional” loans and include
features such as high loan-to-value (“LTV”) ratios, terms that permit payments smaller than the
interest accruals and loans where the borrower is subject to significant payment increases over the
life of the loan. Merrill Lynch adopted the provisions of this guidance in the fourth quarter of
2005. See Note 8 to the Consolidated Financial Statements for this disclosure.
In November 2005, the FASB issued FSP 115-1, The Meaning of Other-Than-Temporary Impairment and Its
Application to Certain Investments, which in conjunction with the Emerging Issues Task Force
(“EITF”) 03-1 resulted in additional disclosures for securities in an unrealized loss position
effective for year-end 2003. Merrill Lynch previously implemented the disclosure requirements of
EITF 03-1 in its December 26, 2003 Consolidated Financial Statements. See Note 5 to the
Consolidated Financial Statements for additional information.
In June 2005, the FASB ratified the consensus reached by the EITF on Issue 04-5, Determining
Whether a General Partner, or the General Partners as a Group, Controls a Limited Partnership or
Similar Entity When the Limited Partners Have Certain Rights (“EITF 04-5”). EITF 04-5 presumes that
a general partner controls a limited partnership, and should therefore consolidate a limited
partnership, unless the limited partners have the substantive ability to remove the general partner
without cause based on a simple majority vote or can otherwise dissolve the limited partnership, or
unless the limited partners have substantive participating rights over decision making. The
guidance in EITF 04-5 was effective immediately for all new limited partnership agreements and any
limited partnership agreements that are modified. The guidance is effective for existing
partnership agreements for financial reporting periods beginning after December 15, 2005 and may be
reported as either a cumulative effect of a change in accounting principle or via retroactive
restatement. The adoption of this guidance is not expected to have a material impact on the
Consolidated Financial Statements.
On December 21, 2004, the FASB issued FSP 109-2, Accounting and Disclosure Guidance for the Foreign
Earnings Repatriation Provision within the American Jobs Creation Act of 2004. The FSP provides
guidance on the impact of the new tax law’s one-time deduction for qualifying repatriations of
foreign earnings made in 2005. The deduction can result in a lower tax rate on repatriation of
certain foreign earnings, where deferred taxes were previously established. To the extent that the
cumulative undistributed earnings of non-U.S. subsidiaries were permanently reinvested, no deferred
U.S. federal income taxes have been provided. Accordingly, net earnings in 2005 included tax
expense of $97 million ($113 million of tax expense recorded in the fourth quarter, less a $16
million tax benefit recorded in the second quarter), associated with
the foreign earnings repatriation of $1.8 billion.
On December 16, 2004, the FASB issued SFAS No. 123 (revised 2004), Share-Based Payment, a revision
of SFAS No. 123, Accounting for Stock-Based Compensation (“SFAS No. 123R”). In April 2005, the SEC
delayed the effective date for SFAS No. 123R until the first fiscal year beginning after June 15,
2005. As a result of the SEC ruling, Merrill Lynch expects to adopt the provisions of SFAS No. 123R
in the first quarter of 2006. Merrill Lynch adopted the provisions of SFAS No. 123 in the first
quarter of 2004. Under the provisions of SFAS No. 123, stock-based compensation cost is measured at
the grant date based on the fair value of the award. Merrill Lynch recognizes expense over the
vesting period stipulated in the grant for all employees. Such employees include those that have
satisfied retirement eligibility criteria but are subject to a non-compete agreement that applies
from the date of retirement through each application vesting period. Should a retirement-eligible
employee actually leave Merrill Lynch, all previously unvested awards are immediately charged to
expense. SFAS No. 123R clarifies and amends the guidance of SFAS
No. 123 in several areas,
including measuring fair value, classifying an award as equity or as a liability, attributing
compensation cost to service periods and accounting for forfeitures of awards. Merrill Lynch
currently expects that the impact of adopting SFAS No. 123R will reduce after-tax net income by
approximately $350 million in the first quarter of 2006. See Note 14 to the Consolidated Financial
Statements for further information on share-based compensation arrangements.
In December of 2003, the AICPA issued Statement of Position (“SOP”) 03-3, Accounting for Certain
Loans or Debt Securities Acquired in a Transfer. SOP 03-3 addresses revenue recognition and
impairment assessments for certain loans and debt securities that were purchased at a discount that
was at least in part due to credit quality. SOP 03-3 states that where expected cash flows from the
loan or debt security can be reasonably estimated, the difference between the purchase price and
the expected cash flows (i.e., the “accretable yield”) should be accreted into income. In addition,
the SOP prohibits the recognition of an allowance for loan losses on the purchase date. Further,
the SOP requires that the allowance for loan losses be supported through a cash flow analysis, on
either an individual or on a pooled basis, for all loans that fall within the scope of the
guidance. Merrill Lynch adopted SOP 03-3 as of the beginning of fiscal year 2005. The adoption of
the guidance did not have a material impact on the Consolidated Financial Statements.
On May 19, 2004, the FASB issued FSP 106-2, Accounting and Disclosure Requirements Related to the
Medicare Prescription Drug, Improvement and Modernization Act of 2003, which supersedes FSP 106-1
of the same title issued in January 2004. FSP 106-2 provides guidance on accounting for the effects
of the Medicare Prescription Drug, Improvement and Modernization Act of 2003 (“the Act”) that was
signed into law on December 8, 2003. The Act allows for a tax-free government subsidy to employers
providing “actuarially equivalent” prescription drug benefits to its Medicare eligible retirees.
Management concluded that the benefits provided under Merrill Lynch’s plan are “actuarially
equivalent” to Medicare Part D and qualify for the subsidy provided by the Act. Effective for the
third quarter of 2004, Merrill Lynch adopted FSP 106-2 using the prospective application method. As
a result, Merrill Lynch’s accumulated postretirement benefit obligation has been reduced by
approximately $45 million and the net periodic postretirement benefit cost for the third and fourth
quarters of 2004 decreased by $2.6 million.
On February 15, 2006, Merrill Lynch announced that it had signed a definitive agreement under
which it would transfer its MLIM investment management business to BlackRock, Inc. (“BlackRock”) in
exchange for a 49.8% interest in the combined firm, including a 45% voting interest. Based on the
value of this transaction at the time of the announcement, it is expected to result in an after-tax
gain to Merrill Lynch upon closing of over $1 billion. This transaction is expected to close during
the third quarter of 2006. The actual gain will be contingent upon BlackRock’s share price at
closing, as well as closing adjustments. Merrill Lynch plans to account for its investment in
BlackRock under the equity method of accounting. Refer to Note 3 to the Consolidated Financial
Statements for further information on MLIM.
On February 16, 2006, Merrill Lynch entered into agreements-in-principle settling 23 class actions
that challenged the objectivity of Merrill Lynch’s research recommendations related to securities
of Internet companies. As a result of this settlement and an accrual for other litigation-related
matters in accordance with SFAS No. 5, Accounting for Contingencies, Merrill Lynch has recorded a
pre-tax charge of $170 million ($102 million after-tax, and $0.11 per diluted share). This amount
has been included in the Consolidated Statements of Earnings in other expenses. See Note 12 to the
Consolidated Financial Statements for information regarding this and other litigation matters.
|
|
|
| NOTE 3
|
|
Segment and Geographic Information |
Segment Information
In reporting to management during 2005, Merrill Lynch’s operating results were categorized into
three business segments: Global Markets and Investment Banking (“GMI”), Global Private Client
(“GPC”), and MLIM. Prior period amounts have been reclassified to conform to the current period
presentation.
The principal methodology used in preparing the segment results in the table that follows is:
| • |
|
Revenues and expenses are assigned to segments where directly attributable. |
| |
| • |
|
Principal transactions, net interest and investment banking revenues and related costs resulting
from the client activities of GPC are allocated among GMI and GPC based on production credits,
share counts, trade counts, and other measures which estimate relative value. |
| |
| • |
|
MLIM receives a net advisory fee from GPC relating to certain MLIM-branded products offered
through GPC’s 401(k) product offering. |
| |
| • |
|
Revenues and expenses related to mutual fund shares bearing a contingent deferred sales charge
are reflected in segment results as if MLIM and GPC were unrelated entities. |
| |
| • |
|
Interest (cost of carry) is allocated based on management’s assessment of the relative liquidity
of segment assets and liabilities. |
86
Merrill Lynch 2005 Annual Report
| • |
|
Acquisition financing costs, other corporate interest and September 11-related expenses are
not attributed to segments because management excludes these items from segment operating results
in evaluating segment performance. The elimination of inter-segment revenues and expenses is also
included in Corporate items. |
| |
| • |
|
Residual expenses (i.e., those related to overhead and support units) are attributed to segments
based on specific methodologies (e.g., headcount, square footage, intersegment agreements). |
Management believes that the following information by business segment provides a reasonable
representation of each segment’s contribution to the consolidated net revenues and pre-tax
earnings:
| |
|
|
|
|
|
|
|
|
|
|
|
|
|
|
|
|
|
|
|
|
| |
|
|
|
|
|
|
|
|
|
|
|
|
Corporate Items |
|
|
|
|
| |
|
|
|
|
|
|
|
|
|
|
|
|
(including |
|
|
|
|
| |
|
|
|
|
|
|
|
|
|
|
|
|
intersegment |
|
|
|
|
| (dollars in millions) |
|
GMI |
|
|
GPC |
|
|
MLIM |
|
eliminations) |
|
|
Total |
|
| |
2005 |
|
|
|
|
|
|
|
|
|
|
|
|
|
|
|
|
|
|
|
|
Non-interest revenues |
|
$ |
10,325 |
|
|
$ |
9,069 |
|
|
$ |
1,780 |
|
|
$ |
38 |
(1) |
|
$ |
21,212 |
|
Net interest profit(2) |
|
|
3,544 |
|
|
|
1,695 |
|
|
|
27 |
|
|
|
(469) |
(3) |
|
|
4,797 |
|
| |
|
|
Net revenues |
|
|
13,869 |
|
|
|
10,764 |
|
|
|
1,807 |
|
|
|
(431 |
) |
|
|
26,009 |
|
Non-interest expenses |
|
|
8,841 |
|
|
|
8,587 |
|
|
|
1,221 |
|
|
|
129 |
(1) |
|
|
18,778 |
|
| |
|
|
Pre-tax earnings (loss) |
|
$ |
5,028 |
|
|
$ |
2,177 |
|
|
$ |
586 |
|
|
$ |
(560 |
) |
|
$ |
7,231 |
|
| |
|
|
Year-end total assets |
|
$ |
590,054 |
|
|
$ |
76,908 |
|
|
$ |
7,470 |
|
|
$ |
6,583 |
|
|
$ |
681,015 |
|
| |
|
|
|
|
|
|
|
|
|
|
|
|
|
|
|
|
|
|
|
|
|
|
|
2004 |
|
|
|
|
|
|
|
|
|
|
|
|
|
|
|
|
|
|
|
|
Non-interest revenues |
|
$ |
7,519 |
|
|
$ |
8,547 |
|
|
$ |
1,567 |
|
|
$ |
(3 |
)(1) |
|
$ |
17,630 |
|
Net interest profit(2) |
|
|
3,544 |
|
|
|
1,280 |
|
|
|
13 |
|
|
|
(408 |
)(3) |
|
|
4,429 |
|
| |
|
|
Net revenues |
|
|
11,063 |
|
|
|
9,827 |
|
|
|
1,580 |
|
|
|
(411 |
) |
|
|
22,059 |
|
Non-interest expenses |
|
|
7,194 |
|
|
|
7,954 |
|
|
|
1,120 |
|
|
|
(45 |
)(1) |
|
|
16,223 |
|
| |
|
|
Pre-tax earnings (loss) |
|
$ |
3,869 |
|
|
$ |
1,873 |
|
|
$ |
460 |
|
|
$ |
(366 |
) |
|
$ |
5,836 |
|
| |
|
|
Year-end total assets |
|
$ |
537,124 |
|
|
$ |
74,849 |
|
|
$ |
9,415 |
|
|
$ |
6,710 |
|
|
$ |
628,098 |
|
| |
|
|
|
|
|
|
|
|
|
|
|
|
|
|
|
|
|
|
|
|
|
|
|
2003 |
|
|
|
|
|
|
|
|
|
|
|
|
|
|
|
|
|
|
|
|
Non-interest revenues |
|
$ |
7,280 |
|
|
$ |
7,639 |
|
|
$ |
1,356 |
|
|
$ |
(8 |
)(1) |
|
$ |
16,267 |
|
Net interest profit(2) |
|
|
2,737 |
|
|
|
1,259 |
|
|
|
6 |
|
|
|
(369 |
) (3) |
|
|
3,633 |
|
| |
|
|
Net revenues |
|
|
10,017 |
|
|
|
8,898 |
|
|
|
1,362 |
|
|
|
(377 |
) |
|
|
19,900 |
|
Non-interest expenses |
|
|
6,246 |
|
|
|
7,369 |
|
|
|
1,101 |
|
|
|
(36 |
) (1) |
|
|
14,680 |
|
| |
|
|
Pre-tax earnings (loss) |
|
$ |
3,771 |
|
|
$ |
1,529 |
|
|
$ |
261 |
|
|
$ |
(341 |
) |
|
$ |
5,220 |
|
| |
|
|
Year-end total assets |
|
$ |
392,853 |
|
|
$ |
75,089 |
|
|
$ |
6,913 |
|
|
$ |
5,378 |
|
|
$ |
480,233 |
|
| |
|
|
|
| (1) |
|
Primarily represents the elimination of intersegment revenues and expenses. |
| (2) |
|
Management
views interest income net of interest expense in evaluating results. |
| (3) |
|
Represents acquisition financing costs and other corporate interest, including the impact of
Trust Originated Preferred Securities (“TOPrSSM”). |
Geographic Information
Merrill Lynch operates in both U.S. and non-U.S. markets. Merrill Lynch’s non-U.S. business
activities are conducted through offices in four regions:
| • |
|
Europe, Middle East, and Africa; |
| |
| • |
|
Pacific Rim; |
| |
| • |
|
Latin America; and |
| |
| • |
|
Canada. |
The principal methodology used in preparing the geographic data in the table that follows is:
| • |
|
Revenue and expenses are generally recorded based on the location of the employee generating the
revenue or incurring the expense; |
| |
| • |
|
Earnings before income taxes include the allocation of certain shared expenses among regions; and |
| |
| • |
|
Intercompany transfers are based primarily on service agreements. |
The information that follows, in management’s judgment, provides a reasonable representation of
each region’s contribution to the consolidated net revenues and pre-tax earnings:
| |
|
|
|
|
|
|
|
|
|
|
|
|
| (dollars in millions) |
|
2005 |
|
|
2004 |
|
|
2003 |
|
| |
Net revenues |
|
|
|
|
|
|
|
|
|
|
|
|
Europe, Middle East, and Africa |
|
$ |
4,860 |
|
|
$ |
3,392 |
|
|
$ |
3,350 |
|
Pacific Rim |
|
|
2,725 |
|
|
|
2,351 |
|
|
|
2,040 |
|
Latin America |
|
|
823 |
|
|
|
664 |
|
|
|
562 |
|
Canada |
|
|
230 |
|
|
|
248 |
|
|
|
224 |
|
| |
|
|
Total Non-U.S. |
|
|
8,638 |
|
|
|
6,655 |
|
|
|
6,176 |
|
United States |
|
|
17,802 |
|
|
|
15,815 |
|
|
|
14,101 |
|
Corporate |
|
|
(431 |
) |
|
|
(411 |
) |
|
|
(377 |
) |
| |
|
|
Total |
|
$ |
26,009 |
|
|
$ |
22,059 |
|
|
$ |
19,900 |
|
| |
|
|
|
|
|
|
|
|
|
|
|
|
|
|
|
Earnings (loss) before income taxes |
|
|
|
|
|
|
|
|
|
|
|
|
Europe, Middle East, and Africa |
|
$ |
1,374 |
|
|
$ |
632 |
|
|
$ |
835 |
|
Pacific Rim |
|
|
973 |
|
|
|
885 |
|
|
|
789 |
|
Latin America |
|
|
332 |
|
|
|
236 |
|
|
|
191 |
|
Canada |
|
|
45 |
|
|
|
76 |
|
|
|
63 |
|
| |
|
|
Total Non-U.S. |
|
|
2,724 |
|
|
|
1,829 |
|
|
|
1,878 |
|
United States |
|
|
5,067 |
|
|
|
4,373 |
|
|
|
3,683 |
|
Corporate |
|
|
(560 |
) |
|
|
(366 |
) |
|
|
(341 |
) |
| |
|
|
Total |
|
$ |
7,231 |
|
|
$ |
5,836 |
|
|
$ |
5,220 |
|
| |
|
|
|
| NOTE 4
|
|
Securities Financing Transactions |
Merrill Lynch enters into secured borrowing and lending transactions in order to meet
customers’ needs and earn residual interest rate spreads, obtain securities for settlement and
finance trading inventory positions.
Under these transactions, Merrill Lynch either receives or provides collateral, including U.S.
Government and agencies, asset-backed, corporate debt, equity, and non-U.S. governments and
agencies securities. Merrill Lynch receives collateral in connection with resale agreements,
securities borrowed transactions, customer margin loans, and other loans. Under many agreements,
Merrill Lynch is permitted to sell or repledge the securities received (e.g., use the securities to
secure repurchase agreements, enter into securities lending transactions, or deliver to
counterparties to cover short positions). At December 30, 2005 and December 31, 2004, the fair
value of securities received as collateral where Merrill Lynch is permitted to sell or repledge the
securities was $538 billion and $375 billion, respectively, and the fair value of the portion that
has been sold or repledged was $403 billion and $300 billion, respectively. Merrill Lynch may use
securities received as collateral for resale agreements to satisfy regulatory requirements such as
Rule 15c3-3 of the SEC. At December 30, 2005 and December 31, 2004, the fair value of collateral
used for this purpose was $15.5 billion, and $12.6 billion, respectively.
Merrill Lynch pledges firm-owned assets to collateralize repurchase agreements and other secured
financings. Pledged securities that can be sold or repledged by the secured party are
parenthetically disclosed in trading assets and investment securities on the Consolidated Balance
Sheets. The carrying value and classification of securities owned by Merrill Lynch that have been
pledged to counterparties where those counterparties do not have the right to sell or repledge at
year-end 2005 and 2004 are as follows:
| |
|
|
|
|
|
|
|
|
| (dollars in millions) |
|
2005 |
|
|
2004 |
|
| |
Trading asset category |
|
|
|
|
|
|
|
|
Corporate debt and preferred stock |
|
$ |
10,868 |
|
|
$ |
11,248 |
|
Mortgages, mortgage-backed, and asset-backed securities |
|
|
9,189 |
|
|
|
10,302 |
|
U.S. Government and agencies |
|
|
6,711 |
|
|
|
9,199 |
|
Equities and convertible debentures |
|
|
4,019 |
|
|
|
3,685 |
|
Non-U.S. Governments and agencies |
|
|
3,547 |
|
|
|
2,031 |
|
Municipals and money markets |
|
|
100 |
|
|
|
1,544 |
|
| |
|
|
Total |
|
$ |
34,434 |
|
|
$ |
38,009 |
|
| |
88
Merrill Lynch 2005 Annual Report
|
|
|
| NOTE 5
|
|
Investment Securities |
Investment securities on the Consolidated Balance Sheets include:
| • |
|
SFAS No. 115 investments held by ML & Co. and certain of its non-broker dealer entities,
including Merrill Lynch banks and insurance subsidiaries. SFAS No. 115 investments consist of: |
| |
• |
|
Debt securities, including debt held for investment and liquidity and collateral management
purposes that are classified as available-for-sale, debt securities held for trading purposes, and
debt securities that Merrill Lynch intends to hold until maturity; |
| |
| |
• |
|
Marketable equity securities, which are generally classified as available-for-sale; |
| • |
|
Non-qualifying investments that do not fall within the scope of SFAS No. 115. Non-qualifying
investments consist principally of: |
| |
• |
|
Private equity investments, including investments in partnerships and joint ventures. Private
equity investments that Merrill Lynch holds for capital appreciation and/or current income are
accounted for in accordance with the Investment Company Guide. The investments are initially
carried at cost and are adjusted when changes in the underlying fair values are readily
ascertainable. Merrill Lynch began applying the Investment Company Guide in the second quarter of
2005, acknowledging the growth in its private equity business. Changes in value associated with
private equity investments were not material in prior periods. |
| |
| |
|
|
Private equity investments held outside of investment companies, which are held for strategic
purposes, are generally accounted for at LOCOM or under the equity method depending on Merrill
Lynch’s ability to exercise significant influence. |
| |
| |
• |
|
Investments of insurance subsidiaries, which primarily represent insurance policy loans and are
accounted for at amortized cost. |
| |
| |
• |
|
Deferred compensation hedges, which are investments economically hedging deferred compensation
liabilities and are accounted for at fair value. |
| |
| |
• |
|
Investments in TOPrSSM partnerships, which are deconsolidated trusts of Merrill Lynch
used as part of general purpose funding and are accounted for under the equity method. |
Fair value for non-qualifying investments is estimated using a number of methods, including
earnings multiples, discounted cash flow analyses, and review of underlying financial conditions
and other market factors. These instruments may be subject to restrictions (e.g., sale requires
consent of other investors to sell) that may limit Merrill Lynch’s ability to currently realize the
estimated fair value. Accordingly, Merrill Lynch’s current estimate of fair value and the ultimate
realization for these instruments may differ. The fair value of other non-qualifying investment
securities approximated the carrying amounts at year-end 2005 and 2004, respectively.
Investment securities reported on the Consolidated Balance Sheets at December 30, 2005 and December
31, 2004 are as follows:
| |
|
|
|
|
|
|
|
|
| (dollars in millions) |
|
2005 |
|
|
2004 |
|
| |
Investment securities |
|
|
|
|
|
|
|
|
Available-for-sale(1) |
|
$ |
54,471 |
|
|
$ |
66,224 |
|
Trading |
|
|
5,666 |
|
|
|
7,736 |
|
Held-to-maturity |
|
|
271 |
|
|
|
278 |
|
Non-qualifying
|
|
|
|
|
|
|
|
|
Equity investments |
|
|
9,795 |
|
|
|
7,346 |
|
Investments of insurance subsidiaries |
|
|
1,174 |
|
|
|
1,354 |
|
Deferred compensation hedges |
|
|
1,457 |
|
|
|
1,419 |
|
Investments in TOPrSSM partnerships and other investments |
|
|
738 |
|
|
|
978 |
|
| |
|
|
Total |
|
$ |
73,572 |
|
|
$ |
85,335 |
|
| |
|
|
|
| (1) |
|
At December 30, 2005 and December 31, 2004, includes $4.3 billion and $6.9 billion,
respectively, of investment securities reported in cash and securities segregated for regulatory
purposes or deposited with clearing organizations. |
Investment securities accounted for under SFAS No. 115 are classified as available-for-sale,
held-to-maturity, or trading as described in Note 1 to the Consolidated Financial Statements.
Information regarding investment securities subject to SFAS No. 115 follows:
| |
|
|
|
|
|
|
|
|
|
|
|
|
|
|
|
|
|
|
|
|
|
|
|
|
|
|
|
|
|
|
|
|
| |
|
December 30, 2005 |
|
|
December 31, 2004 |
|
| |
Cost/ |
|
Gross |
|
Gross |
|
Estimated |
|
Cost/ |
|
Gross |
|
Gross |
|
Estimated |
|
| |
Amortized |
|
Unrealized |
|
Unrealized |
|
Fair |
|
Amortized |
|
Unrealized |
|
Unrealized |
|
Fair |
|
| (dollars in millions) |
Cost |
|
Gains |
|
Losses |
|
Value |
|
Cost |
|
Gains |
|
Losses |
|
Value |
|
| |
Available-for-Sale |
|
|
|
|
|
|
|
|
|
|
|
|
|
|
|
|
|
|
|
|
|
|
|
|
|
|
|
|
|
|
|
|
Mortgage- and asset-backed |
|
$ |
44,726 |
|
|
$ |
80 |
|
|
$ |
(400 |
) |
|
$ |
44,406 |
|
|
$ |
52,719 |
|
|
$ |
306 |
|
|
$ |
(209 |
) |
|
$ |
52,816 |
|
Corporate debt |
|
|
5,044 |
|
|
|
15 |
|
|
|
(37 |
) |
|
|
5,022 |
|
|
|
5,708 |
|
|
|
61 |
|
|
|
(17 |
) |
|
|
5,752 |
|
U.S. Government and agencies |
|
|
2,930 |
|
|
|
1 |
|
|
|
(40 |
) |
|
|
2,891 |
|
|
|
4,315 |
|
|
|
57 |
|
|
|
(20 |
) |
|
|
4,352 |
|
Non-U.S. Governments and agencies |
|
|
262 |
|
|
|
8 |
|
|
|
(1 |
) |
|
|
269 |
|
|
|
1,088 |
|
|
|
41 |
|
|
|
(1 |
) |
|
|
1,128 |
|
Other |
|
|
158 |
|
|
|
6 |
|
|
|
(3 |
) |
|
|
161 |
|
|
|
263 |
|
|
|
9 |
|
|
|
(4 |
) |
|
|
268 |
|
| |
|
|
Total debt securities |
|
|
53,120 |
|
|
|
110 |
|
|
|
(481 |
) |
|
|
52,749 |
|
|
|
64,093 |
|
|
|
474 |
|
|
|
(251 |
) |
|
|
64,316 |
|
Equity securities |
|
|
1,669 |
|
|
|
63 |
|
|
|
(10 |
) |
|
|
1,722 |
|
|
|
1,895 |
|
|
|
20 |
|
|
|
(7 |
) |
|
|
1,908 |
|
| |
|
|
Total |
|
$ |
54,789 |
|
|
$ |
173 |
|
|
$ |
(491 |
) |
|
$ |
54,471 |
|
|
$ |
65,988 |
|
|
$ |
494 |
|
|
$ |
(258 |
) |
|
$ |
66,224 |
|
| |
|
|
|
|
|
|
|
|
|
|
|
|
|
|
|
|
|
|
|
|
|
|
|
|
|
|
|
|
|
|
|
|
|
|
|
Held-to-Maturity |
|
|
|
|
|
|
|
|
|
|
|
|
|
|
|
|
|
|
|
|
|
|
|
|
|
|
|
|
|
|
|
|
Municipals |
|
$ |
254 |
|
|
$ |
– |
|
|
$ |
– |
|
|
$ |
254 |
|
|
$ |
246 |
|
|
$ |
– |
|
|
$ |
– |
|
|
$ |
246 |
|
Mortgage- and asset-backed |
|
|
17 |
|
|
|
– |
|
|
|
– |
|
|
|
17 |
|
|
|
20 |
|
|
|
– |
|
|
|
– |
|
|
|
20 |
|
Corporate debt |
|
|
– |
|
|
|
– |
|
|
|
– |
|
|
|
– |
|
|
|
11 |
|
|
|
– |
|
|
|
– |
|
|
|
11 |
|
U.S. Government and agencies |
|
|
– |
|
|
|
– |
|
|
|
– |
|
|
|
– |
|
|
|
1 |
|
|
|
– |
|
|
|
– |
|
|
|
1 |
|
| |
|
|
Total |
|
$ |
271 |
|
|
$ |
– |
|
|
$ |
– |
|
|
$ |
271 |
|
|
$ |
278 |
|
|
$ |
– |
|
|
$ |
– |
|
|
$ |
278 |
|
| |
The following table presents fair value and unrealized losses, after hedges, for
available-for-sale securities, aggregated by investment category and length of time that the
individual securities have been in a continuous unrealized loss position at December 30, 2005 and
December 31, 2004.
| |
|
|
|
|
|
|
|
|
|
|
|
|
|
|
|
|
|
|
|
|
|
|
|
|
| (dollars in millions) |
|
Less than 1 Year |
|
|
More than 1 Year |
|
|
Total |
|
| |
Estimated |
|
|
|
|
|
Estimated |
|
|
|
|
|
Estimated |
|
|
|
| |
Fair |
|
Unrealized |
|
Fair |
|
Unrealized |
|
Fair |
|
Unrealized |
|
| Asset category |
Value |
|
Losses |
|
Value |
|
Losses |
|
Value |
|
Losses |
|
| |
December 30, 2005 |
|
|
|
|
|
|
|
|
|
|
|
|
|
|
|
|
|
|
|
|
|
|
|
|
Mortgage- and asset-backed |
|
$ |
20,867 |
|
|
$ |
(186 |
) |
|
$ |
6,843 |
|
|
$ |
(158 |
) |
|
$ |
27,710 |
|
|
$ |
(344 |
) |
U.S. Government and agencies |
|
|
2,369 |
|
|
|
(32 |
) |
|
|
228 |
|
|
|
(3 |
) |
|
|
2,597 |
|
|
|
(35 |
) |
Corporate debt |
|
|
3,570 |
|
|
|
(18 |
) |
|
|
519 |
|
|
|
(17 |
) |
|
|
4,089 |
|
|
|
(35 |
) |
Non-U.S. Governments and
agencies |
|
|
2 |
|
|
|
– |
|
|
|
206 |
|
|
|
(8 |
) |
|
|
208 |
|
|
|
(8 |
) |
Other |
|
|
3 |
|
|
|
– |
|
|
|
133 |
|
|
|
(3 |
) |
|
|
136 |
|
|
|
(3 |
) |
| |
|
|
Total debt securities |
|
|
26,811 |
|
|
|
(236 |
) |
|
|
7,929 |
|
|
|
(189 |
) |
|
|
34,740 |
|
|
|
(425 |
) |
Equity securities |
|
|
1,278 |
|
|
|
(7 |
) |
|
|
3 |
|
|
|
(3 |
) |
|
|
1,281 |
|
|
|
(10 |
) |
| |
|
|
Total temporarily impaired
securities |
|
$ |
28,089 |
|
|
$ |
(243 |
) |
|
$ |
7,932 |
|
|
$ |
(192 |
) |
|
$ |
36,021 |
|
|
$ |
(435 |
) |
| |
|
|
|
|
|
|
|
|
|
|
|
|
|
|
|
|
|
|
|
|
|
|
|
|
|
|
|
December 31, 2004 |
|
|
|
|
|
|
|
|
|
|
|
|
|
|
|
|
|
|
|
|
|
|
|
|
Mortgage- and asset-backed |
|
$ |
23,758 |
|
|
$ |
(105 |
) |
|
$ |
7,408 |
|
|
$ |
(109 |
) |
|
$ |
31,166 |
|
|
$ |
(214 |
) |
U.S. Government and agencies |
|
|
2,745 |
|
|
|
(4 |
) |
|
|
1,461 |
|
|
|
(24 |
) |
|
|
4,206 |
|
|
|
(28 |
) |
Corporate debt |
|
|
2,529 |
|
|
|
(13 |
) |
|
|
177 |
|
|
|
(4 |
) |
|
|
2,706 |
|
|
|
(17 |
) |
Non-U.S. Governments and
agencies |
|
|
77 |
|
|
|
(1 |
) |
|
|
899 |
|
|
|
(21 |
) |
|
|
976 |
|
|
|
(22 |
) |
Other |
|
|
– |
|
|
|
– |
|
|
|
193 |
|
|
|
(3 |
) |
|
|
193 |
|
|
|
(3 |
) |
| |
|
|
Total debt securities |
|
|
29,109 |
|
|
|
(123 |
) |
|
|
10,138 |
|
|
|
(161 |
) |
|
|
39,247 |
|
|
|
(284 |
) |
Equity securities |
|
|
9 |
|
|
|
(2 |
) |
|
|
19 |
|
|
|
(4 |
) |
|
|
28 |
|
|
|
(6 |
) |
| |
|
|
Total temporarily impaired
securities |
|
$ |
29,118 |
|
|
$ |
(125 |
) |
|
$ |
10,157 |
|
|
$ |
(165 |
) |
|
$ |
39,275 |
|
|
$ |
(290 |
) |
| |
The majority of the unrealized losses relate to mortgage- and asset-backed securities. The
majority of the investments are AAA-rated debentures and mortgage-backed securities issued by U.S.
agencies. These investments are not considered other-than-temporarily impaired because Merrill
Lynch has the ability and intent to hold the investments for a period of time sufficient for a
forecasted market price recovery up to or beyond the cost of the investment.
During 2003, other revenues included a write-down of $114 million related to certain
available-for-sale securities that were considered to be impaired on an other-than-temporary basis.
Unrealized losses on these securities were previously included in accumulated other comprehensive
loss. During 2003, the write-down was charged to earnings and removed from accumulated other
comprehensive loss.
90
Merrill Lynch 2005 Annual Report
The amortized cost and estimated fair value of debt securities at December 30, 2005 by
contractual maturity, for available-for-sale and held-to-maturity investments follow:
| |
|
|
|
|
|
|
|
|
|
|
|
|
|
|
|
|
| |
Available-for-Sale |
|
Held-to-Maturity |
|
| |
|
|
|
|
Estimated |
|
|
|
|
|
Estimated |
|
| |
Amortized |
|
Fair |
|
Amortized |
|
Fair |
|
| (dollars in millions) |
Cost |
|
Value |
|
Cost |
|
Value |
|
| |
Due in one year or less |
|
$ |
4,013 |
|
|
$ |
4,007 |
|
|
$ |
– |
|
|
$ |
– |
|
Due after one year through five years |
|
|
3,361 |
|
|
|
3,309 |
|
|
|
– |
|
|
|
– |
|
Due after five years through ten years |
|
|
825 |
|
|
|
825 |
|
|
|
254 |
|
|
|
254 |
|
Due after ten years |
|
|
195 |
|
|
|
202 |
|
|
|
– |
|
|
|
– |
|
| |
|
|
|
|
|
8,394 |
|
|
|
8,343 |
|
|
|
254 |
|
|
|
254 |
|
Mortgage- and asset-backed securities |
|
|
44,726 |
|
|
|
44,406 |
|
|
|
17 |
|
|
|
17 |
|
| |
|
|
Total(1) |
|
$ |
53,120 |
|
|
$ |
52,749 |
|
|
$ |
271 |
|
|
$ |
271 |
|
| |
|
|
|
| (1) |
|
Expected maturities may differ from contractual maturities because borrowers may have the
right to call or prepay obligations with or without prepayment penalties. |
The proceeds and gross realized gains (losses) from the sale of available-for-sale investments
are as follows:
| |
|
|
|
|
|
|
|
|
|
|
|
|
| (dollars in millions) |
|
2005 |
|
|
2004 |
|
|
2003 |
|
| |
Proceeds |
|
$ |
36,574 |
|
|
$ |
27,983 |
|
|
$ |
56,448 |
|
Gross realized gains |
|
|
411 |
|
|
|
389 |
|
|
|
709 |
|
Gross realized losses |
|
|
(71 |
) |
|
|
(54 |
) |
|
|
(138 |
) |
| |
Net unrealized losses from investment securities classified as trading included in the 2005,
2004, and 2003 Consolidated Statements of Earnings were $(13) million, $(275) million, and $(93)
million, respectively.
|
|
|
| NOTE 6
|
|
Trading Assets and Liabilities |
As part of its trading activities, Merrill Lynch provides its clients with brokerage, dealing,
financing, and underwriting services for a broad range of products. While trading activities are
primarily generated by client order flow, Merrill Lynch also takes proprietary positions based on
expectations of future market movements and conditions. Merrill Lynch’s trading strategies rely on
the integrated management of its client-driven and proprietary positions, along with related
hedging and financing.
Interest revenue and expense are integral components of trading activities. In assessing the
profitability of trading activities, Merrill Lynch views net interest and principal transactions
revenues in the aggregate.
Trading activities expose Merrill Lynch to market and credit risks. These risks are managed in
accordance with established risk management policies and procedures. Specifically, the Global
Liquidity and Risk Management Group (“GLRM”), along with other control units, ensures that these
risks are properly identified, monitored, and managed throughout Merrill Lynch. To accomplish this,
GLRM has established a risk management process that includes:
| • |
|
A formal risk governance organization that defines the oversight process and its components; |
| |
| • |
|
A regular review of the risk management process by the Audit Committee of the Board of Directors
as part of their oversight role; |
| |
| • |
|
Clearly defined risk management policies and procedures supported by a rigorous analytic
framework; |
| |
| • |
|
Close communication and coordination between the business, executive, and risk functions while
maintaining strict segregation of responsibilities, controls, and oversight; |
| |
| • |
|
Clearly articulated risk tolerance levels as defined by a group composed of executive management
that are regularly reviewed to ensure that Merrill Lynch’s risk-taking is consistent with its
business strategy, capital structure, and current and anticipated market conditions. |
The risk management process, combined with GLRM’s personnel and analytic infrastructure, works to
ensure that Merrill Lynch’s risk tolerance is well-defined and understood by the firm’s risk-takers
as well as by its executive management. Other groups, including Corporate Audit, Finance, and the
Office of the General Counsel, partner with GLRM to establish this overall risk management control
process. While no risk management system can ever be absolutely complete, the goal of GLRM is to
make certain that risk-related losses occur within acceptable, predefined levels.
Merrill Lynch documents its risk management objectives and strategies for undertaking various hedge
transactions. The risk management objectives and strategies are monitored and managed by GLRM in
accordance with established risk management policies and procedures that include risk tolerance
levels.
Market Risk
Market risk is the potential change in an instrument’s value caused by fluctuations in interest
and currency exchange rates, equity and commodity prices, credit spreads, or other risks. The level
of market risk is influenced by the volatility and the liquidity in the markets in which financial
instruments are traded.
Merrill Lynch seeks to mitigate market risk associated with trading inventories by employing
hedging strategies that correlate rate, price, and spread movements of trading inventories and
related financing and hedging activities. Merrill Lynch uses a combination of cash instruments and
derivatives to hedge its market exposures. The following discussion describes the types of market
risk faced by Merrill Lynch.
Interest Rate Risk
Interest rate risk arises from the possibility that changes in interest rates will affect the value
of financial instruments. Interest rate swap agreements, Eurodollar futures, and U.S. Treasury
securities and futures are common interest rate risk management tools. The decision to manage
interest rate risk using futures or swap contracts, as opposed to buying or selling short U.S.
Treasury or other securities, depends on current market conditions and funding considerations.
Interest rate agreements used by Merrill Lynch include caps, collars, floors, basis swaps,
leveraged swaps, and options. Interest rate caps and floors provide the purchaser with protection
against rising and falling interest rates, respectively. Interest rate collars combine a cap and a
floor, providing the purchaser with a predetermined interest rate range. Basis swaps are a type of
interest rate swap agreement where variable rates are received and paid, but are based on different
index rates. Leveraged swaps are another type of interest rate swap where changes in the variable
rate are multiplied by a contractual leverage factor, such as four times three-month London
Interbank Offered Rate (“LIBOR”). Merrill Lynch’s exposure to interest rate risk resulting from
these leverage factors is typically hedged with other financial instruments.
Currency Risk
Currency risk arises from the possibility that fluctuations in foreign exchange rates will impact
the value of financial instruments. Merrill Lynch’s trading assets and liabilities include both
cash instruments denominated in and derivatives linked to more than 50 currencies, including the
euro, Japanese yen, British pound, and Swiss franc. Currency forwards and options are commonly used
to manage currency risk associated with these instruments. Currency swaps may also be used in
situations where a long-dated forward market is not available or where the client needs a
customized instrument to hedge a foreign currency cash flow stream. Typically, parties to a
currency swap initially exchange principal amounts in two currencies, agreeing to exchange interest
payments and to re-exchange the currencies at a future date and exchange rate.
Equity Price Risk
Equity price risk arises from the possibility that equity security prices will fluctuate, affecting
the value of equity securities and other instruments that derive their value from a particular
stock, a defined basket of stocks, or a stock index. Instruments typically used by Merrill Lynch to
manage equity price risk include equity options, warrants, and baskets of equity securities. Equity
options, for example, can require the writer to purchase or sell a specified stock or to make a
cash payment based on changes in the market price of that stock, basket of stocks, or stock index.
Credit Spread Risk
Credit spread risk arises from the possibility that changes in credit spreads will affect the value
of financial instruments. Credit spreads represent the credit risk premiums required by market
participants for a given credit quality (i.e., the additional yield that a debt instrument issued
by a AA-rated entity must produce over a risk-free alternative (e.g., U.S. Treasury instrument)).
Certain instruments are used by Merrill Lynch to manage this type of risk. Swaps and options, for
example, can be designed to mitigate losses due to changes in credit spreads, as well as the credit
downgrade or default of the issuer. Credit risk resulting from default on counterparty obligations
is discussed in the Credit Risk section.
Commodity Price and Other Risks
Through its commodities business, Merrill Lynch enters into exchange-traded contracts, financially
settled OTC derivatives, contracts for physical delivery and contracts providing for the
transportation and/or storage rights on pipelines, power lines or storage facilities. Commodity
contracts expose Merrill Lynch to the possibility that the price of the underlying commodity may
rise or fall. In addition, contracts resulting in physical delivery can expose Merrill Lynch to
numerous other risks, including performance risk and other delivery risks.
92
Merrill Lynch 2005 Annual Report
Credit Risk
Merrill Lynch is exposed to risk of loss if an individual, counterparty or issuer fails to
perform its obligations under contractual terms (“default risk”). Both cash instruments and
derivatives expose Merrill Lynch to default risk. Credit risk arising from changes in credit
spreads was previously discussed in the Market Risk section.
Merrill Lynch has established policies and procedures for mitigating credit risk on principal
transactions, including reviewing and establishing limits for credit exposure, maintaining
collateral, and continually assessing the creditworthiness of counterparties.
In the normal course of business, Merrill Lynch executes, settles, and finances various customer
securities transactions. Execution of these transactions includes the purchase and sale of
securities by Merrill Lynch. These activities may expose Merrill Lynch to default risk arising from
the potential that customers or counterparties may fail to satisfy their obligations. In these
situations, Merrill Lynch may be required to purchase or sell financial instruments at unfavorable
market prices to satisfy obligations to other customers or counterparties. Additional information
about these obligations is provided in Note 12 to the Consolidated Financial Statements. In
addition, Merrill Lynch seeks to control the risks associated with its customer margin activities
by requiring customers to maintain collateral in compliance with regulatory and internal
guidelines.
Liabilities to other brokers and dealers related to unsettled transactions (i.e., securities
failed-to-receive) are recorded at the amount for which the securities were purchased, and are paid
upon receipt of the securities from other brokers or dealers. In the case of aged securities
failed-to-receive, Merrill Lynch may purchase the underlying security in the market and seek
reimbursement for losses from the counterparty.
Concentrations of Credit Risk
Merrill Lynch’s exposure to credit risk (both default and credit spread) associated with its
trading and other activities is measured on an individual counterparty basis, as well as by groups
of counterparties that share similar attributes. Concentrations of credit risk can be affected by
changes in political, industry, or economic factors. To reduce the potential for risk
concentration, credit limits are established and monitored in light of changing counterparty and
market conditions.
At December 30, 2005, Merrill Lynch’s most significant concentration of credit risk was with the
U.S. Government and its agencies. This concentration consists of both direct and indirect
exposures. Direct exposure, which primarily results from trading asset and investment security
positions in instruments issued by the U.S. Government and its agencies, excluding mortgage-backed
securities, amounted to $11.9 billion and $18.3 billion at December 30, 2005 and December 31, 2004,
respectively. Merrill Lynch’s indirect exposure results from maintaining U.S. Government and
agencies securities as collateral for resale agreements and securities borrowed transactions.
Merrill Lynch’s direct credit exposure on these transactions is with the counterparty; thus Merrill
Lynch has credit exposure to the U.S. Government and its agencies only in the event of the
counterparty’s default. Securities issued by the U.S. Government or its agencies held as collateral
for resale agreements and securities borrowed transactions at December 30, 2005 and December 31,
2004 totaled $140.7 billion and $79.3 billion, respectively.
At December 30, 2005, Merrill Lynch had other concentrations of credit risk, the largest of which
was related to a U.S.-based investment company carrying a credit rating equivalent internal rating
of AAA, which reflects structural seniority and other credit enhancements. Total unsecured exposure
to this counterparty was approximately $2.4 billion, or 0.4% of total assets.
Merrill Lynch’s most significant industry credit concentration is with financial institutions.
Financial institutions include banks, insurance companies, finance companies, investment managers,
and other diversified financial institutions. This concentration arises in the normal course of
Merrill Lynch’s brokerage, trading, hedging, financing, and underwriting activities. Merrill Lynch
also monitors credit exposures worldwide by region. Outside the United States, financial
institutions and sovereign governments represent the most significant concentrations of credit
risk.
In the normal course of business, Merrill Lynch purchases, sells, underwrites, and makes markets in
non-investment grade instruments. Merrill Lynch also provides extensions of credit and makes equity
investments to facilitate leveraged transactions. These activities expose Merrill Lynch to a higher
degree of credit risk than is associated with trading, investing in, and underwriting investment
grade instruments and extending credit to investment grade counterparties.
Derivatives
Merrill Lynch’s trading derivatives consist of derivatives provided to customers and
derivatives entered into for proprietary trading strategies or risk management purposes.
Default risk on derivatives can also occur for the full notional amount of the trade where a final
exchange of principal takes place, as may be the case for currency swaps. Default risk exposure
varies by type of derivative. Swap agreements and forward contracts are generally OTC-transacted
and thus are exposed to default risk to the extent of their replacement cost. Since futures
contracts are exchange-traded and usually require daily cash settlement, the related risk of loss
is generally limited to a one-day net positive change in market value. Generally such receivables
and payables are recorded in customers receivables and payables on the Consolidated Balance Sheets.
Option contracts can be exchange-traded or OTC-transacted. Purchased options have default risk to
the extent of their replacement cost. Written options represent a potential obligation to
counterparties and typically do not subject Merrill Lynch to default risk except under
circumstances such as where the option premium is being financed or in cases where Merrill Lynch is
required to post collateral. Additional information about derivatives that meet the definition of a
guarantee for accounting purposes is included in Note 12 to the Consolidated Financial Statements.
Merrill Lynch generally enters into International Swaps and Derivatives Association, Inc. master
agreements or their equivalent (“master netting agreements”) with each of its counterparties, as
soon as possible. Master netting agreements provide protection in bankruptcy in certain
circumstances and, in some cases, enable receivables and payables with the same counterparty to be
offset on the Consolidated Balance Sheets, providing for a more meaningful balance sheet
presentation of credit exposure. However, the enforceability of master netting agreements under
bankruptcy laws in certain countries, or in certain industries, is not free from doubt and
receivables and payables with counterparties in these countries or industries are accordingly
recorded on a gross basis.
To reduce the risk of loss, Merrill Lynch requires collateral, principally cash and U.S. Government
and agencies securities, on certain derivative transactions. In the second quarter of 2005, Merrill
Lynch elected to net cash collateral paid or received under credit support annexes associated with
legally enforceable master netting agreements against derivative inventory. Refer to Basis of
Presentation in Note 1 to the Consolidated Financial Statements for additional information. From an
economic standpoint, Merrill Lynch evaluates default risk exposures net of related collateral. In
addition to obtaining collateral, Merrill Lynch attempts to mitigate default risk on derivatives by
entering into transactions with provisions that enable Merrill Lynch to terminate or reset the
terms of the derivative contract.
Many of Merrill Lynch’s derivative contracts contain provisions that could, upon an adverse change
in ML & Co.’s credit rating, trigger a requirement for an early payment or additional collateral
support.
|
|
|
| NOTE 7
|
|
Securitization Transactions and Transactions with Special Purpose Entities (“SPEs”) |
Securitizations
In the normal course of business, Merrill Lynch securitizes: commercial and residential
mortgage and home equity loans; municipal, government, and corporate bonds; and other types of
financial assets. SPEs, often referred to as Variable Interest Entities, or VIEs, are often used
when entering into or facilitating securitization transactions. Merrill Lynch’s involvement with
SPEs used to securitize financial assets includes: structuring and/or establishing SPEs; selling
assets to SPEs; managing or servicing assets held by SPEs; underwriting, distributing, and making
loans to SPEs; making markets in securities issued by SPEs; engaging in derivative transactions
with SPEs; owning notes or certificates issued by SPEs; and/or providing liquidity facilities and
other guarantees to SPEs.
Merrill Lynch securitized assets of approximately $90.3 billion and $65.1 billion for the years
ended December 30, 2005 and December 31, 2004, respectively. For the years ended December 30, 2005
and December 31, 2004, Merrill Lynch received $91.1 billion and $65.9 billion, respectively, of
proceeds, and other cash inflows, from securitization transactions, and recognized net
securitization gains of $425.4 million and $456.5 million, respectively, in Merrill Lynch’s
Consolidated Statements of Earnings.
In 2005 and 2004, cash inflows from securitizations related to the following asset types:
| |
|
|
|
|
|
|
|
|
| (dollars in millions) |
|
2005 |
|
|
2004 |
|
| |
Asset category |
|
|
|
|
|
|
|
|
Residential mortgage loans |
|
$ |
57,958 |
|
|
$ |
45,944 |
|
Municipal bonds |
|
|
17,085 |
|
|
|
9,982 |
|
Corporate and government bonds |
|
|
2,468 |
|
|
|
1,486 |
|
Commercial loans and other |
|
|
13,569 |
|
|
|
8,462 |
|
| |
|
|
|
|
$ |
91,080 |
|
|
$ |
65,874 |
|
| |
In certain instances, Merrill Lynch retains interests in the senior tranche, subordinated
tranche, and/or residual tranche of securities issued by certain SPEs created to securitize assets.
The gain or loss on the sale of the assets is determined with reference to the previous carrying
amount of the financial assets transferred, which is allocated between the assets sold and the
retained interests, if any, based on their relative fair value at the date of transfer.
94
Merrill Lynch 2005 Annual Report
Retained interests are recorded in the Consolidated Balance Sheets at fair value. To obtain
fair values, observable market prices are used if available. Where observable market prices are
unavailable, Merrill Lynch generally estimates fair value initially and on an ongoing basis based
on the present value of expected future cash flows using management’s best estimates of credit
losses, prepayment rates, forward yield curves, and discount rates, commensurate with the risks
involved. Retained interests are either held as trading assets, with changes in fair value recorded
in the Consolidated Statements of Earnings, or as securities available-for-sale, with changes in
fair value included in accumulated other comprehensive loss. Retained interests held as
available-for-sale are reviewed periodically for impairment.
Retained interests in securitized assets were approximately $4.0 billion and $2.0 billion at
December 30, 2005 and December 31, 2004, respectively, which related primarily to residential
mortgage loan and municipal bond securitization transactions. The majority of the retained interest
balance consists of mortgage-backed securities that have observable market prices. These retained
interests include mortgage-backed securities that Merrill Lynch has committed to purchase and
expects to sell to investors in the normal course of its underwriting activity.
The following table presents information on retained interests, excluding the offsetting benefit of
financial instruments used to hedge risks, held by Merrill Lynch as of December 30, 2005, arising
from Merrill Lynch’s residential mortgage loan, municipal bond and other securitization
transactions. The sensitivities of the current fair value of the retained interests to immediate
10% and 20% adverse changes in assumptions and parameters are also shown.
| |
|
|
|
|
|
|
|
|
|
|
|
|
| |
|
Residential |
|
|
|
|
|
|
|
| |
|
Mortgage |
|
|
Municipal |
|
|
|
|
| (dollars in millions) |
|
Loans |
|
|
Bonds |
|
|
Other |
|
| |
Retained interest amount |
|
$ |
2,933 |
|
|
$ |
800 |
|
|
$ |
270 |
|
Weighted average credit losses (rate per annum) |
|
|
0.7 |
% |
|
|
0.0 |
% |
|
|
0.0 |
% |
Range |
|
|
0.0–8.0 |
% |
|
|
0.0 |
% |
|
|
0.0–8.0 |
% |
Impact on fair value of 10% adverse change |
|
$ |
(27 |
) |
|
$ |
– |
|
|
$ |
– |
|
Impact on fair value of 20% adverse change |
|
$ |
(52 |
) |
|
$ |
– |
|
|
$ |
– |
|
Weighted average discount rate |
|
|
6.7 |
% |
|
|
4.2 |
% |
|
|
5.2 |
% |
Range |
|
|
0.0–50.0 |
% |
|
|
0.1–8.0 |
% |
|
|
3.6–23.2 |
% |
Impact on fair value of 10% adverse change |
|
$ |
(44 |
) |
|
$ |
(67 |
) |
|
$ |
(7 |
) |
Impact on fair value of 20% adverse change |
|
$ |
(82 |
) |
|
$ |
(122 |
) |
|
$ |
(13 |
) |
Weighted average life (in years) |
|
|
4.3 |
|
|
|
1.8 |
|
|
|
4.2 |
|
Range |
|
|
0.2–19.3 |
|
|
|
0.1–3.9 |
|
|
|
0.0–7.8 |
|
Weighted average prepayment speed (CPR) |
|
|
21.9 |
% |
|
|
11.3% |
(1) |
|
|
8.4 |
% |
Range |
|
|
0.0–61.4 |
% |
|
|
2.0–23.9% |
(1) |
|
|
0.0–15.0 |
% |
Impact on fair value of 10% adverse change |
|
$ |
(52 |
) |
|
$ |
– |
|
|
$ |
(1 |
) |
Impact on fair value of 20% adverse change |
|
$ |
(85 |
) |
|
$ |
– |
|
|
$ |
(1 |
) |
| |
|
|
|
CPR=Constant Prepayment Rate |
| (1) |
|
Relates to select securitization transactions where assets are prepayable. |
The preceding sensitivity analysis is hypothetical and should be used with caution. In
particular, the effect of a variation in a particular assumption on the fair value of the retained
interest is calculated independent of changes in any other assumption; in practice, changes in one
factor may result in changes in another, which might magnify or counteract the sensitivities.
Further, changes in fair value based on a 10% or 20% variation in an assumption or parameter
generally cannot be extrapolated because the relationship of the change in the assumption to the
change in fair value may not be linear. Also, the sensitivity analysis does not include the
offsetting benefit of financial instruments that Merrill Lynch utilizes to hedge risks, including
credit, interest rate, and prepayment risk, that are inherent in the retained interests. These
hedging strategies are structured to take into consideration the hypothetical stress scenarios
above such that they would be effective in principally offsetting Merrill Lynch’s exposure to loss
in the event these scenarios occur.
The weighted average assumptions and parameters used initially to value retained interests relating
to securitizations that were still held by Merrill Lynch as of December 30, 2005 are as follows:
| |
|
|
|
|
|
|
|
|
|
|
|
|
| |
|
Residential |
|
|
|
|
|
|
|
| |
|
Mortgage |
|
|
Municipal |
|
|
|
|
| |
|
Loans |
|
|
Bonds |
|
|
Other |
|
| |
Credit losses (rate per annum) |
|
|
0.7 |
% |
|
|
0.0 |
% |
|
|
0.0 |
% |
Weighted average discount rate |
|
|
6.3 |
% |
|
|
3.8 |
% |
|
|
5.5 |
% |
Weighted average life (in years) |
|
|
4.5 |
|
|
|
2.7 |
|
|
|
5.3 |
|
Prepayment speed assumption (CPR) |
|
|
19.6 |
% |
|
|
9.0 |
% |
|
|
8.4 |
% |
| |
|
|
|
CPR=Constant Prepayment Rate |
For residential mortgage loan and other securitizations, the investors and the securitization
trust have no recourse to Merrill Lynch’s other assets for failure of mortgage holders to pay when
due.
For municipal bond securitization SPEs, in the normal course of dealer market-making activities,
Merrill Lynch acts as liquidity provider. Specifically, the holders of beneficial interests issued
by municipal bond securitization SPEs have the right to tender their interests for purchase by
Merrill Lynch on specified dates at a specified price. Beneficial interests that are tendered are
then sold by Merrill Lynch to investors through a best efforts remarketing where Merrill Lynch is
the remarketing agent. If the beneficial interests are not successfully remarketed, the holders of
beneficial interests are paid from funds drawn under a standby liquidity letter of credit issued by
Merrill Lynch.
In addition to standby letters of credit, in certain municipal bond securitizations, Merrill Lynch
also provides default protection or credit enhancement to investors in securities issued by certain
municipal bond securitization SPEs. Interest and principal payments on beneficial interests issued
by these SPEs are secured by a guarantee issued by Merrill Lynch. In the event that the issuer of
the underlying municipal bond defaults on any payment of principal and/or interest when due, the
payments on the bonds will be made to beneficial interest holders from an irrevocable guarantee by
Merrill Lynch.
The maximum payout under these liquidity and default guarantees totaled $29.9 billion and $21.3
billion at December 30, 2005 and December 31, 2004, respectively. The fair value of the guarantee
approximated $14 million and $74 million at December 30, 2005 and December 31, 2004, respectively,
which is reflected in the Consolidated Balance Sheets. Of these arrangements, $6.9 billion and $4.7
billion at December 30, 2005 and December 31, 2004, respectively, represent agreements where the
guarantee is provided to the SPE by a third-party financial intermediary and Merrill Lynch enters
into a reimbursement agreement with the financial intermediary. In these arrangements, if the
financial intermediary incurs losses, Merrill Lynch has up to one year to fund those losses.
Additional information regarding these commitments is provided in Note 12 to the Consolidated
Financial Statements.
The following table summarizes principal amounts outstanding and delinquencies of securitized
financial assets as of December 30, 2005 and December 31, 2004, and net credit losses for the years
then ended:
| |
|
|
|
|
|
|
|
|
|
|
|
|
| |
Residential |
|
|
|
|
|
|
|
| |
Mortgage |
|
Municipal |
|
|
|
| (dollars in millions) |
Loans |
|
Bonds |
|
Other |
|
| |
December 30, 2005 |
|
|
|
|
|
|
|
|
|
|
|
|
Principal Amount Outstanding |
|
$ |
82,468 |
|
|
$ |
19,745 |
|
|
$ |
10,416 |
|
Delinquencies |
|
|
39 |
|
|
|
– |
|
|
|
– |
|
Net Credit Losses |
|
|
4 |
|
|
|
– |
|
|
|
6 |
|
|
|
|
|
|
|
|
|
|
|
|
|
|
December 31, 2004 |
|
|
|
|
|
|
|
|
|
|
|
|
Principal Amount Outstanding |
|
$ |
31,541 |
|
|
$ |
14,510 |
|
|
$ |
3,866 |
|
Delinquencies |
|
|
40 |
|
|
|
– |
|
|
|
– |
|
Net Credit Losses |
|
|
2 |
|
|
|
– |
|
|
|
9 |
|
| |
96
Merrill Lynch 2005 Annual Report
Variable Interest Entities
In January 2003, the FASB issued FIN 46, which provides additional guidance on the application of
Accounting Research Bulletin No. 51, Consolidated Financial Statements, for enterprises that have
interests in entities that meet the definition of a VIE, and on December 24, 2003, the FASB issued
FIN 46R. FIN 46R requires that an entity shall consolidate a VIE if that enterprise has a variable
interest that will absorb a majority of the VIE’s expected losses, receive a majority of the VIE’s
expected residual returns, or both.
QSPEs are a type of VIE that holds financial instruments and distributes cash flows to investors
based on preset terms. QSPEs are commonly used in mortgage and other securitization transactions.
In accordance with SFAS No. 140, Accounting for Transfers and Servicing of Financial Assets and
Extinguishments of Liabilities, and FIN 46R, Consolidation of Variable Interest Entities, Merrill
Lynch does not consolidate QSPEs. Information regarding QSPEs can be found in the Securitization
section of this Note and the Guarantees section of Note 12 to the Consolidated Financial
Statements.
For the purpose of determining whether Merrill Lynch has a variable interest in a VIE, Merrill
Lynch generally employs a cash flow approach. Under a cash flow approach, the determination as to
whether an interest is a variable interest is based on whether the interest absorbs variability in
the cash flows of the VIE.
Merrill Lynch has entered into transactions with a number of VIEs in which it is the primary
beneficiary and therefore must consolidate the VIE; or is a significant variable interest holder in
the VIE. These VIEs are as follows:
| • |
|
Merrill Lynch has made loans to, and/or investments in, VIEs that hold loan receivable assets and
real estate, and as a result of these loans and investments, Merrill Lynch may be either the
primary beneficiary of and consolidate the VIE, or may be a significant variable interest holder.
These VIEs are primarily designed to provide on- or off-balance sheet financing to clients and/or
to invest in real estate. Assets held by VIEs where Merrill Lynch has provided financing and is the
primary beneficiary are recorded in other assets and/or loans, notes, and mortgages in the
Consolidated Balance Sheets. Assets held by VIEs where Merrill Lynch has invested in real estate
partnerships and is the primary beneficiary are included in other assets. The beneficial interest
holders in these VIEs have no recourse to the general credit of Merrill Lynch; their investments
are paid exclusively from the assets in the VIE. |
| |
| • |
|
Merrill Lynch has entered into transactions with VIEs that are used, in part, to provide tax
planning strategies to investors and/or Merrill Lynch through an enhanced yield investment
security. These structures typically provide financing to Merrill Lynch and/or the investor at
enhanced rates. Merrill Lynch may be either the primary beneficiary of and consolidate the VIE, or
may be a significant variable interest holder in the VIE. Where Merrill Lynch is the primary
beneficiary, the assets held by the VIEs are primarily included in either trading or investments. |
| |
| |
|
In 2004, Merrill Lynch entered into a transaction with an international financial institution
involving VIEs that provided to Merrill Lynch a $6.25 billion secured credit facility and $500
million unsecured financing. These VIEs are also used as part of Merrill Lynch’s overall
tax-planning strategies and enable Merrill Lynch to borrow at more favorable rates. Merrill Lynch
consolidates the VIEs as it is deemed to be the primary beneficiary of these VIEs. |
| • |
|
Merrill Lynch is the sponsor, guarantor, derivative counterparty, or liquidity and credit
facility provider to certain mutual funds, investment entities, and conduits. Some of these funds
provide a guaranteed return to investors at the maturity of the VIE. This guarantee may include a
guarantee of the return of an initial investment or of the initial investment plus an agreed upon
return depending on the terms of the VIE. Investors in certain of these VIEs have recourse to
Merrill Lynch to the extent that the value of the assets held by the VIEs at maturity is less than
the guaranteed amount. In some instances, Merrill Lynch is the primary beneficiary and must
consolidate the fund. Assets held in these VIEs are primarily classified in trading. In instances
where Merrill Lynch is not the primary beneficiary, the guarantees related to these funds are
further discussed in Note 12 to the Consolidated Financial Statements. |
| |
| |
|
In addition, in 2005 Merrill Lynch established an asset-backed commercial paper conduit
(“Conduit”) and holds a significant variable interest in the Conduit in the form of 1) a liquidity
facility that protects commercial paper holders against short term changes in the fair value of the
assets held by the Conduit, and 2) a credit facility to the Conduit that protects commercial paper
investors against credit losses for up to 2% of the portfolio of assets held by the Conduit. The
liquidity facility and credit facility is further discussed in Note 12 to the Consolidated
Financial Statements. |
| • |
|
In 2004, Merrill Lynch entered into a transaction with a VIE whereby Merrill Lynch arranged for
additional protection for directors and employees to indemnify them against certain losses they may
incur as a result of claims against them. Merrill Lynch is the primary beneficiary and consolidates
the VIE because its employees benefit from the indemnification arrangement. As of December 30, 2005
and December 31, 2004 the assets of the VIE totaled approximately $16 million, representing the
fair value of a purchased credit default agreement, which is recorded in other assets on the
Consolidated Balance Sheets. In the event of a Merrill Lynch insolvency, proceeds of $140 million
will be received by the VIE to fund any claims. Neither Merrill Lynch nor its creditors have any
recourse to the assets of the VIE. |
Other Involvement with VIEs
Merrill Lynch is involved with other VIEs in which it is neither the primary beneficiary or a
significant variable interest holder; rather, its involvement relates to a significant program
sponsored by Merrill Lynch. Significant programs sponsored by Merrill Lynch, which are disclosed in
the table below, include the following:
| • |
|
Merrill Lynch has entered into transactions with VIEs where Merrill Lynch typically purchases
credit protection from the VIE in the form of a derivative in order to synthetically expose
investors to a specific credit risk. These are commonly known as credit-linked note VIEs. |
| |
| • |
|
Merrill Lynch has entered into transactions with VIEs in which Merrill Lynch transfers
convertible bonds to the VIE and retains a call option on the underlying bonds. The purpose of
these VIEs is to market convertible bonds to a broad investor base by separating the bonds into
callable debt and a conversion call option. |
The following tables summarize Merrill Lynch’s involvement with the VIEs listed above as of
December 30, 2005 and December 31, 2004, respectively. The table below does not include information
on QSPEs. For more information on these entities (e.g. municipal bond securitizations), see the
Securitizations section of this note and the Guarantees section in Note 12 to the Consolidated
Financial Statements.
Where an entity is a significant variable interest holder, FIN 46R requires that entity to disclose
its maximum exposure to loss as a result of its interest in the VIE. It should be noted that this
measure does not reflect Merrill Lynch’s estimate of the actual losses that could result from
adverse changes because it does not reflect the economic hedges Merrill Lynch enters into to reduce
its exposure.
| |
|
|
|
|
|
|
|
|
|
|
|
|
|
|
|
|
|
|
|
|
|
|
|
|
|
|
|
|
| (dollars in millions) |
|
Primary |
|
|
Significant Variable |
|
|
Other Involvement |
|
| |
|
Beneficiary |
|
|
Interest Holder |
|
|
with VIEs |
|
| |
|
Total |
|
|
Net |
|
Recourse |
|
|
Total |
|
|
|
|
|
|
Total |
|
|
|
|
| |
|
Asset |
|
|
Asset |
|
to Merrill |
|
|
Asset |
|
Maximum |
|
|
Asset |
|
Maximum |
|
| Description |
|
Size(4) |
|
|
Size(5) |
|
Lynch(6) |
|
|
Size(4) |
|
Exposure |
|
|
Size(4) |
|
Exposure |
|
| |
December 30, 2005 |
|
|
|
|
|
|
|
|
|
|
|
|
|
|
|
|
|
|
|
|
|
|
|
|
|
|
|
|
Loan and Real Estate VIEs |
|
$ |
5,144 |
|
|
$ |
5,140 |
|
|
$ |
– |
|
|
$ |
116 |
|
|
$ |
63 |
|
|
$ |
– |
|
|
$ |
– |
|
Tax Planning VIEs(1)(2) |
|
|
29,617 |
|
|
|
8,365 |
|
|
|
5,823 |
|
|
|
5,416 |
|
|
|
2,297 |
|
|
|
– |
|
|
|
– |
|
Guaranteed and Other Funds |
|
|
1,802 |
|
|
|
1,349 |
|
|
|
464 |
|
|
|
2,981 |
|
|
|
2,973 |
|
|
|
– |
|
|
|
– |
|
Credit-Linked
Note and Other
VIEs(3) |
|
|
130 |
|
|
|
30 |
|
|
|
– |
|
|
|
– |
|
|
|
– |
|
|
|
8,835 |
|
|
|
780 |
|
| |
|
|
December 31, 2004
|
|
|
|
|
|
|
|
|
|
|
|
|
|
|
|
|
|
|
|
|
|
|
|
|
|
|
|
|
Loan and Real Estate VIEs |
|
$ |
3,550 |
|
|
$ |
3,550 |
|
|
$ |
– |
|
|
$ |
330 |
|
|
$ |
227 |
|
|
$ |
– |
|
|
$ |
– |
|
Tax Planning VIEs(1)(2) |
|
|
25,037 |
|
|
|
7,847 |
|
|
|
5,105 |
|
|
|
7,061 |
|
|
|
2,328 |
|
|
|
– |
|
|
|
– |
|
Guaranteed and Other Funds |
|
|
1,254 |
|
|
|
1,054 |
|
|
|
245 |
|
|
|
– |
|
|
|
– |
|
|
|
– |
|
|
|
– |
|
Credit-Linked
Note and Other
VIEs(3) |
|
|
16 |
|
|
|
16 |
|
|
|
– |
|
|
|
– |
|
|
|
– |
|
|
|
9,061 |
|
|
|
536 |
|
| |
|
|
|
| (1) |
|
Recourse to Merrill Lynch associated with Tax Planning VIEs primarily relates to
transactions where the investors in the debt issued by the VIEs have recourse to both the assets of
the VIEs and to Merrill Lynch, as well as certain indemnifications made by Merrill Lynch to the
investors in the VIEs. |
| (2) |
|
The maximum exposure for Tax Planning VIEs reflects the fair value of investments in the VIEs
and derivatives entered into with the VIEs, as well as the maximum exposure to loss associated with
indemnifications made by Merrill Lynch to investors in the VIEs. |
| (3) |
|
The maximum exposure for Credit-Linked Note and Other VIEs is the fair value of the derivatives
entered into with the VIEs if they are in an asset position as of December 30, 2005 and December
31, 2004, respectively. |
| (4) |
|
This column reflects the total size of the assets held in the VIE. |
| (5) |
|
This column reflects the size of the assets held in the VIE after accounting for intercompany
eliminations and any balance sheet netting of assets and liabilities as permitted by FIN 39. |
| (6) |
|
This column reflects the extent, if any, to which investors have recourse to Merrill Lynch
beyond the assets held in the VIE. |
98
Merrill Lynch 2005 Annual Report
|
|
|
| NOTE 8
|
|
Loans, Notes, and Mortgages and Related Commitments to Extend Credit |
Loans, notes, and mortgages and related commitments to extend credit at December 30, 2005 and
December 31, 2004, are presented below. This disclosure includes commitments to extend credit that
may result in loans held for investment and loans held for sale.
| |
|
|
|
|
|
|
|
|
|
|
|
|
|
|
|
|
| |
|
Loans |
|
|
Commitments(1) |
|
| (dollars in millions) |
|
2005 |
|
|
2004 |
|
|
2005(2)(3) |
|
|
2004(3) |
|
| |
Consumer and small- and middle-market business: |
|
|
|
|
|
|
|
|
|
|
|
|
|
|
|
|
Mortgages |
|
$ |
18,172 |
|
|
$ |
17,439 |
|
|
$ |
6,376 |
|
|
$ |
4,735 |
|
Small- and middle-market business |
|
|
4,994 |
|
|
|
6,450 |
|
|
|
3,062 |
|
|
|
3,780 |
|
Other |
|
|
2,558 |
|
|
|
3,545 |
|
|
|
75 |
|
|
|
396 |
|
Commercial: |
|
|
|
|
|
|
|
|
|
|
|
|
|
|
|
|
Secured |
|
|
36,571 |
|
|
|
23,675 |
|
|
|
34,583 |
|
|
|
26,046 |
|
Unsecured investment grade |
|
|
3,283 |
|
|
|
1,444 |
|
|
|
22,061 |
|
|
|
15,333 |
|
Unsecured non-investment grade |
|
|
869 |
|
|
|
992 |
|
|
|
980 |
|
|
|
1,549 |
|
| |
|
|
|
|
|
66,447 |
|
|
|
53,545 |
|
|
|
67,137 |
|
|
|
51,839 |
|
Allowance for loan losses |
|
|
(406 |
) |
|
|
(283 |
) |
|
|
– |
|
|
|
– |
|
Reserve for lending-related commitments |
|
|
– |
|
|
|
– |
|
|
|
(281 |
) |
|
|
(188 |
) |
| |
|
|
Total, net |
|
$ |
66,041 |
|
|
$ |
53,262 |
|
|
$ |
66,856 |
|
|
$ |
51,651 |
|
| |
|
|
|
| (1) |
|
Commitments are outstanding as of the date the commitment letter is issued and are
comprised of closed and contingent commitments. Closed commitments represent the unfunded portion
of existing commitments available for draw down. Contingent commitments are contingent on the
borrower fulfilling certain conditions or upon a particular event, such as an acquisition. A
portion of these contingent commitments may be syndicated among other lenders or replaced with
capital markets funding. |
| (2) |
|
See Note 12 to the Consolidated Financial Statements for a maturity profile of these
commitments. |
| (3) |
|
In addition to the loan origination commitments included in the table above, at December 30,
2005, Merrill Lynch entered into agreements to purchase $96 million of loans that, upon settlement
date, are likely to be classified in loans held for investment and loans held for sale. Similar
loan purchase commitments totaled $326 million at December 31, 2004. See Note 12 to the
Consolidated Financial Statements for further information. |
Activity in the allowance for loan losses is presented below:
| |
|
|
|
|
|
|
|
|
|
|
|
|
| (dollars in millions) |
2005 |
|
2004 |
|
2003 |
|
| |
Allowance for loan losses at beginning of year |
|
$ |
283 |
|
|
$ |
318 |
|
|
$ |
285 |
|
Provision for loan losses |
|
|
200 |
|
|
|
174 |
|
|
|
76 |
|
Charge-offs |
|
|
(88 |
) |
|
|
(209 |
) |
|
|
(46 |
) |
Recoveries |
|
|
12 |
|
|
|
4 |
|
|
|
3 |
|
| |
|
|
Net charge-offs |
|
|
(76 |
) |
|
|
(205 |
) |
|
|
(43 |
) |
Other |
|
|
(1 |
) |
|
|
(4 |
) |
|
|
– |
|
| |
|
|
Allowance for loan losses at end of year |
|
$ |
406 |
|
|
$ |
283 |
|
|
$ |
318 |
|
| |
Consumer and small- and middle-market business loans, which are substantially secured,
consisted of approximately 258,000 individual loans at December 30, 2005, and included residential
mortgages, home equity loans, small- and middle-market business loans, and other loans to
individuals for household, family, or other personal expenditures. Commercial loans, which at
year-end 2005 consisted of approximately 9,000 separate loans, include corporate and institutional
loans, commercial mortgages, asset-based loans, and other loans to businesses. The principal
balance of nonaccrual loans was $256 million at December 30, 2005 and $282 million at December 31,
2004. The investment grade and non-investment grade categorization is determined using the credit
rating agency equivalent of internal credit ratings. Non-investment grade counterparties are those
rated lower than BBB. In some cases, Merrill Lynch enters into credit default swaps to mitigate
credit exposure related to funded and unfunded commercial loans. The notional value of these swaps
totaled $7.9 billion and $6.0 billion at December 30, 2005 and December 31, 2004, respectively. For
information on credit risk management see Note 6 to the Consolidated Financial Statements.
The above amounts include $12.3 billion and $9.0 billion of loans held for sale at December 30,
2005 and December 31, 2004, respectively. Loans held for sale are loans that management expects to
sell prior to maturity. At December 30, 2005, such loans consisted of $3.4 billion of consumer
loans, primarily automobile loans and residential mortgages, and $8.9 billion of commercial loans,
approximately 22% of which are to investment grade counterparties. At December 31, 2004, such loans
consisted of $4.7 billion of consumer loans, primarily automobile loans and residential mortgages,
and $4.3 billion of commercial loans, approximately 56% of which are to investment grade
counterparties. For information on the accounting policy related to loans, notes and mortgages, see
Note 1 to the Consolidated Financial Statements.
Merrill Lynch originates and purchases portfolios of loans that have certain features that may be
viewed as increasing Merrill Lynch’s exposure to nonpayment risk by the borrower. Specifically,
Merrill Lynch originates and purchases commercial and residential loans that:
| • |
|
have negative amortizing features that permit the borrower to draw on unfunded commitments to pay
current interest (commercial loans only); |
| |
| • |
|
subject the borrower to payment increases over the life of the loan; |
| |
| • |
|
have high LTV ratios. |
Although these features may be considered non-traditional for residential mortgages, interest-only
features and high LTV ratios are considered traditional for commercial loans. Therefore, the table
below includes only those commercial loans with features that permit negative amortization. Merrill
Lynch does not originate or purchase residential loans that have terms that permit negative
amortization features or are option adjustable rate mortgages.
The table below summarizes the level of exposure to each type of loan at December 30, 2005 and
December 31, 2004:
| |
|
|
|
|
|
|
|
|
| (dollars in millions) |
|
2005 |
|
|
2004 |
|
| |
Loans with negative amortization features |
|
$ |
2,818 |
|
|
$ |
3,118 |
|
Loans where borrowers may be subject to payment increases |
|
|
12,309 |
|
|
|
12,957 |
|
Loans with high LTV ratios |
|
|
1,407 |
|
|
|
656 |
|
Loans with both high LTV ratios and loans where borrowers may be subject to payment increases |
|
|
2,552 |
|
|
|
1,397 |
|
| |
The negative amortizing loan products that Merrill Lynch issues include loans where the
small/middle-market or commercial borrower receives a loan and an unfunded commitment, which
together equal the maximum amount Merrill Lynch is willing to lend. The unfunded commitment is
automatically drawn on in order to meet current interest payments. These loans are often made to
real estate developers where the financed property will not generate current income at the
beginning of the loan term. This balance also includes working capital lines of credit that are
issued to small and middle-market investors and are secured by the assets of the business.
Loans where borrowers may be subject to payment increases primarily include interest-only loans.
This caption also includes mortgages with low initial rates. These loans are underwritten based on
a variety of factors including, for example, the borrower’s credit history, debt to income ratio,
employment, the LTV ratio, and the borrower’s disposable income and cash reserves; typically using
a qualifying formula that assesses the borrower’s ability to make interest payments at a minimum of
2% above the initial rate. In instances where the borrower is of lower credit standing, the loans
are typically underwritten to have a lower LTV ratio and/or other mitigating factors.
High LTV loans include all mortgage loans where the LTV is greater than 80% and the borrower has
not purchased private mortgage insurance (“PMI”). High LTV loans also include residential mortgage
products where a mortgage and home equity loan are simultaneously established for the same
property. The maximum original LTV ratio for the mortgage portfolio with no PMI or other security
is 95%. In addition, the Mortgage 100SM product is included in this category. The
Mortgage 100SM product permits high credit quality borrowers to pledge their securities
portfolio in lieu of a traditional down payment. The securities portfolio is subject to daily
monitoring, and additional collateral is required if the value of the pledged securities declines
below certain levels.
The fair values of loans, notes, and mortgages were approximately $66.2 billion and $53.6 billion
at December 30, 2005 and December 31, 2004, respectively. For commercial loans, fair value is
estimated based on other market prices for similar instruments issued by the borrower or is
estimated using discounted cash flows. Merrill Lynch’s estimate of fair value for other loans,
notes, and mortgages is determined based on loan characteristics. For certain homogeneous
categories of loans, including residential mortgages and home equity loans, fair value is estimated
using market price quotations or previously executed transactions for securities backed by similar
loans, adjusted for credit risk and other individual loan characteristics. For Merrill Lynch’s
variable-rate loan receivables, carrying value approximates fair value.
Merrill Lynch generally maintains collateral on secured loans in the form of securities, liens on
real estate, perfected security interests in other assets of the borrower, and guarantees. Consumer
and small and middle-market loans are typically collateralized by liens on real estate,
automobiles, and other property. Commercial secured loans primarily include asset-based loans
secured by financial assets such as loan receivables and trade receivables where the amount of the
loan is based on the level of available collateral (i.e., the borrowing base) and commercial
mortgages secured by real property. In addition, for secured commercial loans related to the
corporate and institutional lending business, Merrill Lynch typically receives collateral in the
form of either a first or second lien on the assets of the borrower or the stock of a subsidiary,
which gives Merrill Lynch a priority claim in the case of a bankruptcy filing by the borrower. In
many cases, where a security interest in the assets of the borrower is granted, no restrictions are
placed on the use of assets by the borrower and asset levels are not typically subject to periodic
review; however, the borrowers are typically subject to
100
Merrill Lynch 2005 Annual Report
stringent debt covenants. Where the borrower grants a security interest in the stock of its
subsidiary, the subsidiary’s ability to issue additional debt is typically restricted.
Merrill Lynch enters into commitments to extend credit, predominantly at variable interest rates,
in connection with corporate finance and loan syndication transactions. Customers may also be
extended loans or lines of credit collateralized by first and second mortgages on real estate,
certain liquid assets of small businesses, or securities. Merrill Lynch considers commitments to be
outstanding as of the date the commitment letter is issued. These commitments usually have a fixed
expiration date and are contingent on certain contractual conditions that may require payment of a
fee by the counterparty. Once commitments are drawn upon, Merrill Lynch may require the
counterparty to post collateral depending on its creditworthiness and general market conditions.
The contractual amounts of these commitments represent the amounts at risk should the contract be
fully drawn upon, the client defaults, and the value of the existing collateral becomes worthless.
The total amount of outstanding commitments may not represent future cash requirements, as
commitments may expire without being drawn upon. For a maturity profile of these and other
commitments see Note 12 to the Consolidated Financial Statements.
|
|
|
| NOTE 9
|
|
Commercial Paper and Short- and Long-Term Borrowings |
ML & Co. is the primary issuer of all debt instruments. For local tax or regulatory reasons,
debt is also issued by certain subsidiaries.
Total borrowings at December 30, 2005 and December 31, 2004, which is comprised of commercial paper
and other short-term borrowings, long-term borrowings and long-term debt issued to
TOPrSSM partnerships, consisted of the following:
| |
|
|
|
|
|
|
|
|
| (dollars in millions) |
|
2005 |
|
|
2004 |
|
| |
Senior debt issued by ML & Co. |
|
$ |
111,533 |
|
|
$ |
102,892 |
|
Senior debt issued by subsidiaries – guaranteed by ML & Co. |
|
|
13,036 |
|
|
|
9,994 |
|
Subordinated debt issued to TOPrSSM partnerships |
|
|
3,092 |
|
|
|
3,092 |
|
Other subsidiary financing – not guaranteed by ML & Co. |
|
|
1,391 |
|
|
|
1,309 |
|
Other subsidiary financing – non-recourse |
|
|
10,351 |
|
|
|
9,297 |
|
| |
|
|
Total |
|
$ |
139,403 |
|
|
$ |
126,584 |
|
| |
These borrowing activities may create exposure to market risk, most notably interest rate,
equity, and currency risk. Refer to Note 1 to the Consolidated Financial Statements, Derivatives
section, for additional information on the use of derivatives to hedge these risks and the
accounting for derivatives embedded in these instruments. Other subsidiary financing –
non-recourse is primarily attributable to consolidated entities that are VIEs. Additional
information regarding VIEs is provided in Note 7 to the Consolidated Financial Statements.
Borrowings at December 30, 2005 and December 31, 2004, are presented below:
| |
|
|
|
|
|
|
|
|
| (dollars in millions) |
|
2005 |
|
|
2004 |
|
| |
Commercial paper and other short-term borrowings |
|
|
|
|
|
|
|
|
Commercial paper |
|
$ |
3,420 |
|
|
$ |
3,736 |
|
Other |
|
|
482 |
|
|
|
243 |
|
| |
|
|
Total |
|
$ |
3,902 |
|
|
$ |
3,979 |
|
| |
|
|
Long-term borrowings(1)
|
|
|
|
|
|
|
|
|
Fixed-rate obligations(2)(4) |
|
$ |
54,104 |
|
|
$ |
52,379 |
|
Variable-rate obligations(3)(4) |
|
|
79,071 |
|
|
|
67,709 |
|
Zero-coupon contingent convertible debt (LYONs®) |
|
|
2,326 |
|
|
|
2,517 |
|
| |
|
|
Total |
|
$ |
135,501 |
|
|
$ |
122,605 |
|
| |
|
|
|
| (1) |
|
Includes long-term debt issued to TOPrSSM partnerships. |
| (2) |
|
Fixed-rate obligations are generally swapped to floating rates. |
| (3) |
|
Variable interest rates are generally based on rates such as LIBOR, the U.S. Treasury Bill
Rate, or the Federal Funds Rate. |
| (4) |
|
Included are various equity-linked or other indexed instruments. |
Long-term borrowings, including adjustments related to fair value hedges and various
equity-linked or other indexed instruments, and long-term debt issued to TOPrSSM
partnerships at December 30, 2005, mature as follows:
| |
|
|
|
|
|
|
|
|
| (dollars in millions) |
|
|
|
|
|
|
|
|
| |
2006 |
|
$ |
22,771 |
|
|
|
17 |
% |
2007 |
|
|
26,212 |
|
|
|
19 |
|
2008 |
|
|
14,348 |
|
|
|
11 |
|
2009 |
|
|
20,632 |
|
|
|
15 |
|
2010 |
|
|
17,037 |
|
|
|
13 |
|
2011 and thereafter |
|
|
34,501 |
|
|
|
25 |
|
| |
|
|
Total |
|
$ |
135,501 |
|
|
|
100 |
% |
| |
Certain long-term borrowing agreements contain provisions whereby the borrowings are redeemable
at the option of the holder at specified dates prior to maturity. These borrowings are reflected in
the above table as maturing at their put dates, rather than their contractual maturities.
Management believes, however, that a portion of such borrowings will remain outstanding beyond
their earliest redemption date.
A limited number of notes whose coupon or repayment terms are linked to the performance of equity,
other indices, or baskets of securities, may be accelerated based on the value of a referenced
index or security, in which case Merrill Lynch may be required to immediately settle the obligation
for cash or other securities. Refer to Note 1 to the Consolidated Financial Statements (Embedded
Derivatives) for further information.
Except for the $2.3 billion of LYONs® that were outstanding at December 30, 2005, senior
debt obligations issued by ML & Co. and senior debt issued by subsidiaries and guaranteed by ML &
Co. do not contain provisions that could, upon an adverse change in ML & Co.’s credit rating,
financial ratios, earnings, cash flows, or stock price, trigger a requirement for an early payment,
additional collateral support, changes in terms, acceleration of maturity, or the creation of an
additional financial obligation.
The fair values of long-term borrowings and related hedges approximated the carrying amounts at
year-end 2005 and 2004.
The effective weighted-average interest rates for borrowings, at December 30, 2005 and December 31,
2004 were:
| |
|
|
|
|
|
|
|
|
| |
|
2005 |
|
|
2004 |
|
| |
Commercial paper and other short-term borrowings |
|
|
3.46 |
% |
|
|
2.38 |
% |
Long-term borrowings, contractual rate |
|
|
3.70 |
|
|
|
3.10 |
|
Long-term
debt issued to TOPrSSM partnerships |
|
|
7.31 |
|
|
|
7.31 |
|
| |
On June 30, 2004, Merrill Lynch redeemed its Yen TOPrSSM debentures, which were due
on June 30, 2019, pursuant to the optional redemption provisions stated in the terms and conditions
of the debentures. Such redemption resulted in a cash payment of $107.1 million. No gain or loss
was recognized on the transaction.
Long-Term Borrowings
Floating Rate LYONs®
In 2004, Merrill Lynch issued $2.2 billion of aggregate principal amount of floating rate
zero-coupon contingently convertible LYONs® (“new LYONs®”) at an issue price
of $1,000 per note. The new LYONs® were issued upon completion of an exchange offer, in
which approximately 97% of the previously issued floating rate LYONs® (“original
LYONs®”) were tendered for an equal amount of new LYONs®. The new
LYONs® are unsecured and unsubordinated indebtedness of Merrill Lynch and mature in
2032. At December 30, 2005, $2.2 billion aggregate principal amount of new LYONs® were
outstanding.
At maturity, holders of the new LYONs® will receive the original principal amount of
$1,000 increased daily by a rate that resets on a quarterly basis. Upon conversion, holders of new
LYONs® will receive the value of 13.8213 shares of Merrill Lynch common stock based on
the conditions described below. This value will be paid in cash in an amount equal to the
contingent principal amount of the new LYONs® on the conversion date and the remainder,
at Merrill Lynch’s election, will be paid in cash, common stock or a combination thereof.
In addition, under the terms of the new LYONs®:
| • |
|
Merrill Lynch may redeem the new LYONs® at any time on or after March 13, 2008. |
| |
| • |
|
Investors may require Merrill Lynch to repurchase the new LYONs® in March, 2006, 2007,
2008, 2012, 2017, 2022 and 2027. Repurchases may be settled only in cash. |
102
Merrill Lynch 2005 Annual Report
| • |
|
Until March 2008, the conversion rate on the new LYONS® will be adjusted upon the
issuance of a quarterly cash dividend to holders of Merrill Lynch common stock to the extent that
such dividend exceeds $.16 per share. During the last three quarters of 2005, Merrill Lynch’s
common stock dividend exceeded $.16 per share and, as a result, Merrill Lynch expects the
conversion ratio to adjust during the first quarter of 2006 for those new LYONs® that
remain outstanding as of March 2006. In addition, the conversion rate on the new LYONs®
will be adjusted for any other cash dividends or distributions to all holders of Merrill Lynch
common stock until March 2008. After March 2008, cash dividends and distributions will cause the
conversion ratio to be adjusted only to the extent such dividends are extraordinary. |
| |
| • |
|
The conversion rate on the new LYONs® will also adjust upon: (1) dividends or
distributions payable in Merrill Lynch common stock, (2) subdivisions, combinations or certain
reclassifications of Merrill Lynch common stock, (3) distributions to all holders of Merrill Lynch
common stock of certain rights to purchase the stock at less than the sale price of Merrill Lynch
common stock at that time, and (4) distributions of Merrill Lynch assets or debt securities to
holders of Merrill Lynch common stock (including certain cash dividends and distributions as
described above). |
The new LYONs® may be converted based on any of the following conditions:
| • |
|
If the closing price of Merrill Lynch common stock for at least 20 of the last 30 consecutive
trading days ending on the last day of the calendar quarter is more than the conversion trigger
price. The conversion trigger price for the new LYONs® at December 30, 2005 was $87.97.
That is, on and after January 1, 2006, a holder could have converted new LYONs® into the
value of 13.8213 shares of Merrill Lynch common stock if the Merrill Lynch stock price had been
greater than $87.97 for at least 20 of the last 30 consecutive trading days ending December 30,
2005. |
| |
| • |
|
During any period in which the credit rating of the new LYONs® is Baa1 or lower by
Moody’s Investor Services, Inc., BBB+ or lower by Standard & Poor’s Credit Market Services, or BBB+
or lower by Fitch, Inc.; |
| |
| • |
|
If the new LYONs® are called for redemption; |
| |
| • |
|
If Merrill Lynch is party to a consolidation, merger or binding share exchange; or |
| |
| • |
|
If Merrill Lynch makes a distribution that has a per share value equal to more than 15% of the
sale price of its shares on the day preceding the declaration date for such distribution. |
As of December 30, 2005, and December 31, 2004 the value of the conversion option in the new
LYONs® was not in the money and, as a result, no shares have been included in the
computation of diluted EPS. However, 2.1 million and 3.2 million weighted average shares related to
the original LYONs® that remain outstanding have been included in 2005 and 2004 diluted
EPS, respectively.
Long-Term
Debt Issued to
TOPrS Partnerships
SM
Long-term debt issued to TOPrSSM
partnerships represents long-term debt payable to
the partnerships that issued TOPrSSM. TOPrSSM were issued to investors by
trusts created by Merrill Lynch and are registered with the SEC. Using the issuance proceeds, the
trusts purchased Partnership Preferred Securities, representing limited partnership interests.
Using the purchase proceeds, the limited partnerships extended loans to ML & Co. and one or more
subsidiaries of ML & Co. ML & Co. has guaranteed, on a subordinated basis, the payment in full of
all distributions and other payments on the TOPrSSM to the extent that the trusts have
funds legally available. This guarantee and a similar partnership distribution guarantee are
subordinated to all other liabilities of ML & Co. and rank equally with preferred stock of ML & Co.
Merrill Lynch has accounted for its issuance of TOPrSSM in accordance with the
provisions of FIN 46R and, as a result, the partnerships and trusts that issue these securities are
not consolidated in Merrill Lynch’s financial statements. That is, the long-term debt payable to
the TOPrSSM partnerships is presented in the Consolidated Balance Sheets rather than the
TOPrSSM issued to the third party investors.
Borrowing Facilities
Merrill Lynch maintains credit facilities that are available to cover immediate funding needs.
Merrill Lynch replaced the unsecured bank facility that totaled $3.0 billion at December 31, 2004
with a new committed, multi-currency, unsecured bank credit facility that totaled $4.0 billion at
December 30, 2005. This 364-day facility permits borrowings by ML & Co. and select subsidiaries and
expires in June 2006. The facility includes a one year term-out feature that allows ML & Co., at
its option, to extend borrowings under the facility for a further year beyond the expiration date
in June 2006. At December 30, 2005, there were no borrowings outstanding under this credit
facility, although Merrill Lynch borrows regularly from this facility.
In 2005, Merrill Lynch added two committed, secured credit facilities which totaled $5.5 billion at
December 30, 2005. The facilities expire in May 2006 and December 2006, respectively. Both
facilities include a one year term-out option that allows ML & Co. to extend borrowings under the
facilities for a further year beyond their respective expiration dates. The secured facilities
permit borrowings by ML & Co. and select subsidiaries, secured by a broad range of collateral. At
December 30, 2005, there were no borrowings outstanding under either facility.
In addition, Merrill Lynch maintains a committed, secured credit facility with a financial
institution that totaled $6.25 billion at December 30, 2005 and December 31, 2004. The secured
facility may be collateralized by government obligations eligible for pledging. The facility
expires in 2014, but may be terminated with at least nine months notice by either party. At
December 30, 2005 and December 31, 2004, there were no borrowings outstanding under this facility.
Other
Merrill Lynch also obtains standby letters of credit from issuing banks to satisfy various
counterparty collateral requirements, in lieu of depositing cash or securities collateral. Such
standby letters of credit aggregated $1.1 billion and $799 million at December 30, 2005 and
December 31, 2004, respectively.
Deposits at December 30, 2005 and December 31, 2004, are presented below:
| |
|
|
|
|
|
|
|
|
| (dollars in millions) |
|
2005 |
|
|
2004 |
|
| |
U.S. |
|
|
|
|
|
|
|
|
Savings Deposits |
|
$ |
60,256 |
|
|
$ |
65,019 |
|
Time Deposits |
|
|
1,528 |
|
|
|
688 |
|
| |
|
|
Total U.S. Deposits |
|
|
61,784 |
|
|
|
65,707 |
|
| |
|
|
Non-U.S. |
|
|
|
|
|
|
|
|
Non-interest bearing |
|
|
670 |
|
|
|
687 |
|
Interest bearing |
|
|
17,562 |
|
|
|
13,352 |
|
| |
|
|
Total Non-U.S. Deposits |
|
|
18,232 |
|
|
|
14,039 |
|
| |
|
|
Total Deposits |
|
$ |
80,016 |
|
|
$ |
79,746 |
|
| |
The effective weighted-average interest rates for deposits, which include the impact of hedges,
at December 30, 2005 and December 31, 2004, were 2.4% and 0.96%, respectively. The fair values of
deposits approximated carrying values at December 30, 2005 and December 31, 2004.
|
|
|
| NOTE 11
|
|
Stockholders’ Equity and Earnings Per Share |
Preferred Equity
ML & Co. is authorized to issue 25,000,000 shares of undesignated preferred stock, $1.00 par
value per share. All shares of currently outstanding preferred stock constitute one and the same
class that have equal rank and priority over common stockholders as to dividends and in the event
of liquidation.
Floating Rate Non-Cumulative Preferred Stock, Series 1, Series 2, and Series 4
On November 1, 2004, ML & Co. issued 25,200,000 Depositary Shares, each representing a
one-twelve-hundredth interest in a share of Floating Rate Non-Cumulative Preferred Stock, Series 1,
liquidation preference of $30,000 per share (“Preferred Stock, Series 1”). On March 14, 2005 and
April 4, 2005, ML & Co. issued 40,800,000 and 3,600,000 Depositary Shares, respectively, each
representing a one-twelve-hundredth interest in a share of Floating Rate Non-Cumulative Preferred
Stock, Series 2, liquidation preference of $30,000 per share (“Preferred Stock, Series 2”). On
November 17, 2005, ML & Co. issued 9,600,000 Depositary Shares, each representing a
one-twelve-hundredth interest in a share of Floating Rate Non-Cumulative Preferred Stock, Series 4,
liquidation preference of $30,000 per share (“Preferred Stock, Series 4”). As of December 30, 2005,
the Preferred Stock, Series 1 consisted of 21,000 shares with an aggregate liquidation preference
of $630 million, the Preferred Stock, Series 2 consisted of 37,000 shares with an aggregate
liquidation preference of $1,110 million, the Preferred Stock, Series 4 consisted of 8,000 shares
with an aggregate liquidation preference of $240 million. At December 30, 2005, MLPF&S held
approximately $96 million of Merrill Lynch Preferred Stock, Series 1 related to market-making
activities.
Dividends on the Preferred Stock, Series 1, Series 2, and Series 4 are non-cumulative and are
payable quarterly when, and if, declared by the Board of Directors. The Preferred Stock, Series 1
and Series 2 are perpetual and redeemable on or after November 28, 2009, at the option of ML & Co.,
in whole or in part, at a redemption price of $30,000 per share, plus any declared and unpaid
dividends, without accumulation of any undeclared dividends. The Preferred Stock, Series 4 is
perpetual and redeemable on or after November 28, 2010, at the option of ML & Co., in whole or in
part, at a redemption price of $30,000 per share, plus any declared and unpaid dividends, without
accumulation of any undeclared dividends.
104
Merrill Lynch 2005 Annual Report
6.375% Non-Cumulative Preferred Stock, Series 3
On November 17, 2005 and December 8, 2005, ML & Co. issued 30,000,000 and 2,400,000 Depositary
Shares, respectively, each representing a one-twelve-hundredth interest in a share of 6.375%
Non-Cumulative Preferred Stock, Series 3, liquidation preference of $30,000 per share (“Preferred
Stock, Series 3”). As of December 30, 2005, the Preferred Stock, Series 3 consisted of 27,000
shares with an aggregate liquidation preference of $810 million. At December 30, 2005, MLPF&S held
approximately $4 million of Merrill Lynch Preferred Stock, Series 3 related to market-making
activities.
Dividends on the Preferred Stock, Series 3 are non-cumulative and are payable quarterly when, and
if, declared by the Board of Directors. The Preferred Stock, Series 3 is perpetual and redeemable
on or after November 28, 2010, at the option of ML & Co., in whole or in part, at a redemption
price of $30,000 per share, plus any declared and unpaid dividends, without accumulation of any
undeclared dividends.
Common Stock
On April 18, 2005, the Board of Directors declared a 25% increase in the regular quarterly
dividend to 20 cents per common share, from 16 cents per common share. On January 18, 2006, the
Board of Directors declared a 25% increase in the regular quarterly dividend to 25 cents per common
share, from 20 cents per common share. Dividends paid on common stock were $0.76 per share in 2005
and $0.64 per share in 2004 and 2003.
In 2004 and 2005, the Board of Directors authorized three share repurchase programs to provide
greater flexibility to return capital to shareholders. For the year ended December 31, 2004,
Merrill Lynch repurchased a cumulative total of 54.0 million shares of common stock at a cost of
$3.0 billion, completing the $2.0 billion repurchase program authorized in February 2004 and
utilizing $968 million of the additional $2.0 billion repurchase program authorized in July 2004.
For the year ended December 30, 2005, Merrill Lynch repurchased a cumulative total of 63.1 million
shares of common stock at a cost of $3.7 billion, completing the $2.0 billion repurchase program
authorized in July 2004 and utilizing $2.7 billion of the additional $4.0 billion repurchase
program authorized in April 2005.
On February 26, 2006, the Finance Committee of the Board of Directors authorized an additional $6.0
billion repurchase program.
Shares Exchangeable into Common Stock
In 1998, Merrill Lynch & Co., Canada Ltd. issued 9,662,448 Exchangeable Shares in connection
with Merrill Lynch’s merger with Midland Walwyn Inc. Holders of Exchangeable Shares have dividend,
voting, and other rights equivalent to those of ML & Co. common stockholders. Exchangeable Shares
may be exchanged at any time, at the option of the holder, on a one-for-one basis for ML & Co.
common stock. Merrill Lynch may redeem all outstanding Exchangeable Shares for ML & Co. common
stock after January 31, 2011, or earlier under certain circumstances.
Accumulated Other Comprehensive Loss
Accumulated other comprehensive loss represents cumulative gains and losses on items that are
not reflected in earnings. The balances at December 30, 2005 and December 31, 2004 are as follows:
| |
|
|
|
|
|
|
|
|
| (dollars in millions) |
|
2005 |
|
|
2004 |
|
| |
Foreign currency translation adjustment |
|
|
|
|
|
|
|
|
Unrealized (losses), net of gains |
|
$ |
(988 |
) |
|
$ |
(1,117 |
) |
Income taxes |
|
|
481 |
|
|
|
828 |
|
| |
|
|
Total |
|
|
(507 |
) |
|
|
(289 |
) |
| |
|
|
Unrealized gains (losses) on investment securities available-for-sale |
|
|
|
|
|
|
|
|
Unrealized (losses), net of gains |
|
|
(284 |
) |
|
|
(128 |
) |
Adjustments for: |
|
|
|
|
|
|
|
|
Policyholder liabilities |
|
|
(5 |
) |
|
|
(17 |
) |
Deferred policy acquisition costs |
|
|
– |
|
|
|
2 |
|
Income taxes |
|
|
108 |
|
|
|
52 |
|
| |
|
|
Total |
|
|
(181 |
) |
|
|
(91 |
) |
| |
|
|
Deferred gains (losses) on cash flow hedges |
|
|
|
|
|
|
|
|
Deferred gains (losses) |
|
|
(3 |
) |
|
|
22 |
|
Income taxes |
|
|
– |
|
|
|
(1 |
) |
| |
|
|
Total |
|
|
(3 |
) |
|
|
21 |
|
| |
|
|
Minimum pension liability |
|
|
|
|
|
|
|
|
Minimum pension liability |
|
|
(224 |
) |
|
|
(178 |
) |
Income taxes |
|
|
71 |
|
|
|
56 |
|
| |
|
|
Total |
|
|
(153 |
) |
|
|
(122 |
) |
| |
|
|
Total accumulated other comprehensive loss |
|
$ |
(844 |
) |
|
$ |
(481 |
) |
| |
Stockholder Rights Plan
In 1997, the Board of Directors approved and adopted the amended and restated Stockholder
Rights Plan. The amended and restated Stockholder Rights Plan provides for the distribution of
preferred purchase rights (“Rights”) to common stockholders. The Rights separate from the common
stock 10 days following the earlier of: (a) an announcement of an acquisition by a person or group
(“acquiring party”) of 15% or more of the outstanding common shares of ML & Co., or (b) the
commencement of a tender or exchange offer for 15% or more of the common shares outstanding. One
Right is attached to each outstanding share of common stock and will attach to all subsequently
issued shares. Each Right entitles the holder to purchase 1/100 of a share (a “Unit”) of Series A
Junior Preferred Stock, par value $1.00 per share, at an exercise price of $300 per Unit at any
time after the distribution of the Rights. The Units are nonredeemable and have voting privileges
and certain preferential dividend rights. The exercise price and the number of Units issuable are
subject to adjustment to prevent dilution.
If, after the Rights have been distributed, either the acquiring party holds 15% or more of ML &
Co.’s outstanding shares or ML & Co. is a party to a business combination or other specifically
defined transaction, each Right (other than those held by the acquiring party) will entitle the
holder to receive, upon exercise, a Unit of preferred stock or shares of common stock of the
surviving company with a value equal to two times the exercise price of the Right. The Rights
expire in 2007, and are redeemable at the option of a majority of the directors of ML & Co. at $.01
per Right at any time until the 10th day following an announcement of the acquisition of 15% or
more of ML & Co.’s common stock.
Earnings Per Share
Basic EPS is calculated by dividing earnings available to common stockholders by the
weighted-average number of common shares outstanding. Diluted EPS is similar to basic EPS, but
adjusts for the effect of the potential issuance of common shares. The following table presents the
computations of basic and diluted EPS:
| |
|
|
|
|
|
|
|
|
|
|
|
|
| (dollars in millions, except per share amounts) |
|
2005 |
|
|
2004 |
|
|
2003 |
|
| |
Net earnings |
|
$ |
5,116 |
|
|
$ |
4,436 |
|
|
$ |
3,836 |
|
Preferred stock dividends |
|
|
(70 |
) |
|
|
(41 |
) |
|
|
(39 |
) |
| |
|
|
Net earnings applicable to common shareholders — for basic EPS |
|
$ |
5,046 |
|
|
$ |
4,395 |
|
|
$ |
3,797 |
|
Interest expense on LYONs®(1) |
|
|
2 |
|
|
|
3 |
|
|
|
3 |
|
| |
|
|
Net earnings applicable to common shareholders — for diluted EPS |
|
$ |
5,048 |
|
|
$ |
4,398 |
|
|
$ |
3,800 |
|
| |
|
|
|
|
|
|
|
|
|
|
|
|
|
|
|
(shares in thousands) |
|
|
|
|
|
|
|
|
|
|
|
|
| |
Weighted-average basic shares outstanding(2) |
|
|
890,744 |
|
|
|
912,935 |
|
|
|
900,711 |
|
| |
|
|
Effect of dilutive instruments
Employee stock options(3) |
|
|
42,117 |
|
|
|
42,178 |
|
|
|
32,807 |
|
FACAAP shares(3) |
|
|
22,140 |
|
|
|
23,591 |
|
|
|
22,995 |
|
Restricted shares and units(3) |
|
|
20,608 |
|
|
|
21,917 |
|
|
|
21,215 |
|
Convertible LYONs®(1) |
|
|
2,120 |
|
|
|
3,158 |
|
|
|
3,158 |
|
ESPP shares(3) |
|
|
7 |
|
|
|
– |
|
|
|
61 |
|
| |
|
|
|
|
|
|
|
|
|
|
|
|
|
|
|
Dilutive potential common shares |
|
|
86,992 |
|
|
|
90,844 |
|
|
|
80,236 |
|
|
|
|
|
|
|
|
|
|
|
|
|
|
| |
|
|
Diluted shares(4) |
|
|
977,736 |
|
|
|
1,003,779 |
|
|
|
980,947 |
|
| |
|
|
Basic EPS |
|
$ |
5.66 |
|
|
$ |
4.81 |
|
|
$ |
4.22 |
|
Diluted EPS |
|
|
5.16 |
|
|
|
4.38 |
|
|
|
3.87 |
|
| |
|
|
|
| (1) |
|
See Note 9 to the Consolidated Financial Statements for further information on LYONs®. |
| (2) |
|
Includes shares exchangeable into common stock. |
| (3) |
|
See Note 14 to the Consolidated Financial Statements for a description of
these instruments and issuances subsequent to December 30, 2005. |
| (4) |
|
At year-end 2005, 2004, and 2003, there were 40,889, 52,875 and 103,857
instruments, respectively, that were considered antidilutive and thus were not
included in the above calculations. In addition, the value of the
conversion option in the new floating rate LYONs® was not in the money and, as a result, no shares
have been included in the computation of diluted EPS in any period.
See Note 9 to the Consolidated Financial Statements for further information on LYONs® . |
|
|
|
| NOTE 12
|
|
Commitments, Contingencies and Guarantees |
Litigation
Merrill Lynch has been named as a defendant in various legal actions, including arbitrations, class actions, and other litigation arising
in connection with its activities as a global diversified financial
services institution. The general decline of equity securities prices
between 2000 and 2003 resulted in increased legal actions against
many firms, including Merrill Lynch.
Some of the legal actions include claims for substantial compensatory and/or punitive damages or claims for indeterminate amounts
of damages. In some cases, the issuers that would otherwise be the primary defendants in such cases are bankrupt or otherwise in
106
Merrill Lynch 2005 Annual Report
financial distress. Merrill Lynch is also involved in investigations and/or proceedings by
governmental and self-regulatory agencies. The number of these investigations has also increased in
recent years with regard to many firms, including Merrill Lynch.
Merrill Lynch believes it has strong defenses to, and where appropriate, will vigorously contest,
many of these matters. Given the number of these matters, some are likely to result in adverse
judgments, penalties, injunctions, fines, or other relief. Merrill Lynch may explore potential
settlements before a case is taken through trial because of the uncertainty and risks inherent in
the litigation process. In accordance with SFAS No. 5, Merrill Lynch will accrue a liability when
it is probable that a liability has been incurred and the amount of the loss can be reasonably
estimated. In many lawsuits and arbitrations, including almost all of the class action lawsuits, it
is not possible to determine whether a liability has been incurred or to estimate the ultimate or
minimum amount of that liability until the case is close to resolution, in which case no accrual is
made until that time. In view of the inherent difficulty of predicting the outcome of such matters,
particularly in cases in which claimants seek substantial or indeterminate damages, Merrill Lynch
cannot predict what the eventual loss or range of loss related to such matters will be. Merrill
Lynch continues to assess these cases and believes, based on information available to it, that the
resolution of these matters will not have a material adverse effect on the financial condition of
Merrill Lynch as set forth in the Consolidated Financial Statements, but may be material to Merrill
Lynch’s operating results or cash flows for any particular period and may impact ML & Co.’s credit
ratings.
IPO Allocation Litigation
In re Initial Public Offering Antitrust Litigation: Merrill Lynch is named as one of ten
underwriting defendants in this consolidated class action filed in the United States District Court
for the Southern District of New York. The complaint alleges that the defendants and unnamed
co-conspirators violated antitrust laws by conspiring to “require from customers consideration in
addition to the underwriters’ discount for allocation of shares of initial public offerings of
certain technology companies...and to inflate the aftermarket prices for such securities.” On
November 3, 2003, the district court granted the defendants’ motions to dismiss the complaint. On
September 28, 2005, the Second Circuit reversed the district court’s decision dismissing the case,
holding that the alleged conduct was not immune from the antitrust laws. On January 11, 2006, the
Second Circuit denied defendants’ petition for rehearing and rehearing en banc. The defendants are
seeking a stay of further proceedings while they petition for Supreme Court review of the Second
Circuit’s decision.
In re Initial Public Offering Securities Litigation: Merrill Lynch has been named as one of the
defendants in approximately 110 securities class action complaints alleging that dozens of
underwriting defendants, including Merrill Lynch, artificially inflated and maintained the stock
prices of the relevant securities by creating an artificially high aftermarket demand for shares.
On October 13, 2004, the district court, having previously denied defendants’ motions to dismiss,
issued an order allowing certain of these cases to proceed against the underwriters as class
actions. On June 30, 2005, the United States Court of Appeals for the Second Circuit entered an
order agreeing to review the district court’s order granting plaintiffs’ motion for class
certification. The matter has now been fully briefed, and the parties are awaiting a decision from
the Court of Appeals.
Enron Litigation
Newby v. Enron Corp. et al.: On April 8, 2002, Merrill Lynch was added as a defendant in a
consolidated class action filed in the United States District Court for the Southern District of
Texas against 69 defendants purportedly on behalf of the purchasers of Enron’s publicly traded
equity and debt securities during the period October 19, 1998 through November 27, 2001. The
complaint alleges, among other things, that Merrill Lynch engaged in improper transactions in the
fourth quarter of 1999 that helped Enron misrepresent its earnings and revenues in the fourth
quarter of 1999. The complaint also alleges that Merrill Lynch violated the securities laws in
connection with its role as an underwriter of Enron stock, its research analyst coverage of Enron
stock, and its role as placement agent for and limited partner in an Enron-controlled partnership
called LJM2. On December 19, 2002 and March 29, 2004, the court denied Merrill Lynch’s motions to
dismiss. On July 27, 2005, Merrill Lynch filed a Motion for Judgment on the Pleadings based, in
part, on the Supreme Court’s April 19, 2005, decision in Dura Pharmaceuticals v. Broudo, which
addressed the standards for pleading and proving loss causation. On August 3, 2005, plaintiff filed
a Motion for Partial Summary Judgment against Merrill Lynch, which seeks a judgment that Merrill
Lynch knowingly committed deceptive acts in furtherance of a scheme to defraud. Merrill Lynch is
opposing that motion. In addition, the defendants, including Merrill Lynch, are awaiting a decision
on plaintiffs’ motion for class certification. A trial date has been set for October 16, 2006.
In re Enron Corp.: On September 24, 2003, Enron Corporation filed an adversary proceeding in the
United States Bankruptcy Court for the Southern District of New York against a large collection of
financial institutions, including Merrill Lynch. An amended complaint was filed on December 5,
2003. The complaint alleges that the conduct of Merrill Lynch and other bank defendants contributed
to Enron’s bankruptcy.
Other Litigation: Dozens of other actions have been brought against Merrill Lynch and other
investment firms in connection with their Enron-related activities, including actions by state
pension plans and other state investment entities that purchased Enron securities and actions by
other purchasers of Enron securities. There has been no adjudication of the merits of these claims.
Research Litigation
In
re Merrill Lynch & Co., Inc. Research Reports Securities
Litigation: Beginning in 2001, Merrill
Lynch was named in dozens of class actions that challenged the objectivity of Merrill Lynch’s
research recommendations related to securities of Internet companies. As a result of the dismissal
or abandonment of many of these cases and the February 16, 2006 settlements in principle of others
(which settlements are subject to further documentation and court approvals), only two of these
class actions are actively being litigated. Merrill Lynch is vigorously defending these two
remaining actions, one of which, Dabit v. Merrill Lynch, is now before the United States Supreme
Court, and the other of which, In re Merrill Lynch & Co., Inc. Shareholders Litigation, is pending
in the United States District Court for the Southern District of New York. Refer to Note 2 to the
Consolidated Financial Statements for further information.
In re Merrill Lynch Tyco Research Securities Litigation: On June 4, 2003, shareholders of Tyco
International filed a class action in the United States District Court for the Southern District of
New York alleging that a former Merrill Lynch research analyst engaged in a variety of improper
practices in connection with research analysis on Tyco International. On February 18, 2004, the
court granted Merrill Lynch’s motion to dismiss the claims related to Tyco. Plaintiffs have
appealed the dismissal of their action to the United States Court of Appeals for the Second
Circuit.
Commitments
At December 30, 2005, Merrill Lynch commitments had the following expirations:
| |
|
|
|
|
|
|
|
|
|
|
|
|
|
|
|
|
|
|
|
|
| |
|
Commitment Expiration |
|
| (dollars in millions) |
|
Total |
|
Less than 1 year |
|
1–3 years |
|
3+–5 years |
|
Over 5 years |
|
| |
Commitments to extend credit(1) |
|
$ |
67,137 |
|
|
$ |
33,885 |
|
|
$ |
9,754 |
|
|
$ |
17,134 |
|
|
$ |
6,364 |
|
Purchasing and other commitments |
|
|
5,777 |
|
|
|
4,100 |
|
|
|
820 |
|
|
|
298 |
|
|
|
559 |
|
Operating leases |
|
|
3,348 |
|
|
|
569 |
|
|
|
1,036 |
|
|
|
814 |
|
|
|
929 |
|
Commitments to enter into resale
agreements |
|
|
3,478 |
|
|
|
3,459 |
|
|
|
19 |
|
|
|
– |
|
|
|
– |
|
| |
|
|
Total |
|
$ |
79,740 |
|
|
$ |
42,013 |
|
|
$ |
11,629 |
|
|
$ |
18,246 |
|
|
$ |
7,852 |
|
| |
|
|
|
| (1) |
|
See Note 8 to the Consolidated Financial Statements for additional details. |
Lending Commitments
Merrill Lynch primarily enters into commitments to extend credit, predominantly at variable
interest rates, in connection with corporate finance, corporate and institutional transactions and
asset-based lending transactions. Clients may also be extended loans or lines of credit
collateralized by first and second mortgages on real estate, certain liquid assets of small
businesses, or securities. These commitments usually have a fixed expiration date and are
contingent on certain contractual conditions that may require payment of a fee by the counterparty.
Once commitments are drawn upon, Merrill Lynch may require the counterparty to post collateral
depending upon creditworthiness and general market conditions. See Note 8 to the Consolidated
Financial Statements for additional information.
The contractual amounts of these commitments represent the amounts at risk should the contract be
fully drawn upon, the client defaults, and the value of the existing collateral becomes worthless.
The total amount of outstanding commitments may not represent future cash requirements, as
commitments may expire without being drawn upon.
Purchasing and Other Commitments
In the normal course of business, Merrill Lynch enters into commitments for underwriting
transactions. Settlement of these transactions as of December 30, 2005 would not have a material
effect on the consolidated financial condition of Merrill Lynch.
In connection with trading activities, Merrill Lynch enters into commitments to enter into resale
agreements.
In the normal course of business, Merrill Lynch enters into institutional and margin-lending
transactions, some of which are on a committed basis, but most of which are not. Margin lending on
a committed basis only includes amounts where Merrill Lynch has a binding commitment. These binding
margin lending commitments totaled $381 million at December 30, 2005 and $303 million at December
31, 2004.
Merrill Lynch had commitments to purchase partnership interests, primarily related to private
equity and principal investing activities, of $734 million and $973 million at December 30, 2005
and December 31, 2004, respectively. Merrill Lynch has also entered into agreements with providers
of market data, communications, systems consulting, and other office-related services. At December
30, 2005 and December 31, 2004, minimum fee commitments over the remaining life of these agreements
aggregated $517 million and $457 million, respectively. Merrill Lynch entered into commitments to
purchase loans of $3.3 billion ($3.2 billion of which may be
108
Merrill Lynch 2005 Annual Report
included in trading assets and $96 million of which may be included in loans, notes, and
mortgages) at December 30, 2005. Such commitments totaled $1.6 billion at December 31, 2004. Other
purchasing commitments amounted to $856 million and $480 million at December 30, 2005 and December
31, 2004, respectively.
Leases
Merrill Lynch has entered into various noncancellable long-term lease agreements for premises that
expire through 2024. Merrill Lynch has also entered into various noncancellable lease agreements,
which are primarily commitments of less than one year under equipment leases.
In 1999 and 2000, Merrill Lynch established two SPEs to finance its Hopewell, New Jersey campus and
an aircraft. Merrill Lynch leased the facilities and the aircraft from the SPEs. The total amount
of funds raised by the SPEs to finance these transactions was $383 million. These SPEs were not
consolidated by Merrill Lynch pursuant to the accounting guidance that was then in effect. In the
second quarter of 2003, the facilities and aircraft owned by these SPEs were acquired by a newly
created limited partnership, which is unaffiliated with Merrill Lynch. The limited partnership
acquired the assets subject to the leases with Merrill Lynch as well as the existing indebtedness
incurred by the original SPEs. The proceeds from the sale of the assets to the limited partnership,
net of the debt assumed by the limited partnership, were used to repay the equity investors in the
original SPEs. After the transaction was completed, the original SPEs were dissolved. The limited
partnership has also entered into leases with third-parties unrelated to Merrill Lynch.
The leases with the limited partnership were renewed in 2004 and mature in 2009. Each lease has a
renewal term to 2014. In addition, Merrill Lynch has entered into guarantees with the limited
partnership, whereby if Merrill Lynch does not renew the lease or purchase the assets under its
lease at the end of either the initial or the renewal lease term, the underlying assets will be
sold to a third party, and Merrill Lynch has guaranteed that the proceeds of such sale will amount
to at least 84% of the acquisition cost of the assets. The maximum exposure to Merrill Lynch as a
result of this residual value guarantee is approximately $322 million as of December 30, 2005 and
December 31, 2004. As of December 30, 2005 and December 31, 2004, the carrying value of the
liability on the Consolidated Balance Sheets is $20 million and $23 million, respectively. Merrill
Lynch’s residual value guarantee does not comprise more than half of the limited partnership’s
assets.
The limited partnership does not meet the definition of a VIE as defined in FIN 46R. Merrill Lynch
does not have a partnership or other interest in the limited partnership. Accordingly, Merrill
Lynch is not required to consolidate the limited partnership in its financial statements. The
leases with the limited partnership are accounted for as operating leases.
At December 30, 2005, future noncancellable minimum rental commitments under leases with remaining
terms exceeding one year, including lease payments to the limited partnerships discussed above are
as follows:
| |
|
|
|
|
|
|
|
|
|
|
|
|
| (dollars in millions) |
WFC(1) |
|
Other |
|
Total |
|
| |
2006 |
|
$ |
179 |
|
|
$ |
390 |
|
|
$ |
569 |
|
2007 |
|
|
179 |
|
|
|
365 |
|
|
|
544 |
|
2008 |
|
|
180 |
|
|
|
312 |
|
|
|
492 |
|
2009 |
|
|
180 |
|
|
|
250 |
|
|
|
430 |
|
2010 |
|
|
180 |
|
|
|
204 |
|
|
|
384 |
|
2011 and thereafter |
|
|
494 |
|
|
|
435 |
|
|
|
929 |
|
| |
|
|
Total |
|
$ |
1,392 |
|
|
$ |
1,956 |
|
|
$ |
3,348 |
|
| |
|
|
|
| (1) |
|
World Financial Center Headquarters. |
The minimum rental commitments shown above have not been reduced by $782 million of minimum
sublease rentals to be received in the future under noncancellable subleases. The amounts in the
above table do not include amounts related to lease renewal or purchase options or escalation
clauses providing for increased rental payments based upon maintenance, utility, and tax increases.
Net rent expense for each of the last three years is presented below:
| |
|
|
|
|
|
|
|
|
|
|
|
|
| (dollars in millions) |
2005 |
|
2004 |
|
2003 |
|
| |
Rent expense |
|
$ |
615 |
|
|
$ |
582 |
|
|
$ |
531 |
|
Sublease revenue |
|
|
(140 |
) |
|
|
(137 |
) |
|
|
(93 |
) |
| |
|
|
Net rent expense |
|
$ |
475 |
|
|
$ |
445 |
|
|
$ |
438 |
|
| |
Guarantees
Merrill Lynch issues various guarantees to counterparties in connection with certain leasing,
securitization and other transactions. In addition, Merrill Lynch enters into certain derivative
contracts that meet the accounting definition of a guarantee under FIN 45. FIN 45 defines
guarantees to include derivative contracts that contingently require a guarantor to make payment to
a guaranteed party based on changes in an underlying (such as changes in the value of interest
rates, security prices, currency rates, commodity prices, indices, etc.), that relate to an asset,
liability or equity security of a guaranteed party. Derivatives that meet the FIN 45 definition of
guarantees include certain written options and credit default swaps (contracts that require Merrill
Lynch to pay the counterparty the par value of a referenced security if that referenced security
defaults). Merrill Lynch does not track, for accounting purposes, whether its clients enter into
these derivative contracts for speculative or hedging purposes. Accordingly, Merrill Lynch has
disclosed information about all credit default swaps and certain types of written options that can
potentially be used by clients to protect against changes in an underlying, regardless of how the
contracts are used by the client.
For certain derivative contracts, such as written interest rate caps and written currency options,
the maximum payout could theoretically be unlimited, because, for example, the rise in interest
rates or changes in foreign exchange rates could theoretically be unlimited. In addition, Merrill
Lynch does not monitor its exposure to derivatives based on the theoretical maximum payout because
that measure does not take into consideration the probability of the occurrence. As such, rather
than including the maximum payout, the notional value of these contracts has been included to
provide information about the magnitude of involvement with these types of contracts. However, it
should be noted that the notional value is not a reliable indicator of Merrill Lynch’s exposure to
these contracts.
Merrill Lynch records all derivative transactions at fair value on its Consolidated Balance Sheets.
As previously noted, Merrill Lynch does not monitor its exposure to derivative contracts in terms
of maximum payout. Instead, a risk framework is used to define risk tolerances and establish limits
to ensure that certain risk-related losses occur within acceptable, predefined limits. Merrill
Lynch economically hedges its exposure to these contracts by entering into a variety of offsetting
derivative contracts and security positions. See the Derivatives section of Note 1 to the
Consolidated Financial Statements for further discussion of risk management of derivatives.
Merrill Lynch also provides guarantees to SPEs in the form of liquidity facilities, credit default
protection and residual value guarantees for equipment leasing entities.
The liquidity facilities and credit default protection relate primarily to municipal bond
securitization SPEs and a Merrill Lynch-sponsored asset-backed commercial paper conduit. See Note 7
to the Consolidated Financial Statements for additional information regarding the Conduit. Merrill
Lynch acts as liquidity provider to municipal bond securitization SPEs. Specifically, the holders
of beneficial interests issued by these SPEs have the right to tender their interests for purchase
by Merrill Lynch on specified dates at a specified price. If the beneficial interests are not
successfully remarketed, the holders of beneficial interests are paid from funds drawn under a
standby facility issued by Merrill Lynch (or by third-party financial institutions where Merrill
Lynch has agreed to reimburse the financial institution if a draw occurs). If the standby facility
is drawn, Merrill Lynch may claim the underlying assets held by the SPEs. In general, standby
facilities that are not coupled with default protection are not exercisable in the event of a
downgrade below investment grade or default of the assets held by the SPEs. In addition, as of
December 30, 2005, the value of the assets held by the SPE plus any additional collateral pledged
to Merrill Lynch exceeds the amount of beneficial interests issued, which provides additional
support to Merrill Lynch in the event that the standby facility is drawn. As of December 30, 2005,
the maximum payout if the standby facilities are drawn was $25.8 billion and the value of the
municipal bond assets to which Merrill Lynch has recourse in the event of a draw was $29.8 billion.
However, it should be noted that these two amounts are not directly comparable, as the assets to
which Merrill Lynch has recourse are on a deal-by-deal basis and are not part of a
cross-collateralized pool.
In certain instances, Merrill Lynch also provides default protection in addition to liquidity
facilities. Specifically, in the event that an issuer of a municipal bond held by the SPE defaults
on any payment of principal and/or interest when due, the payments on the bonds will be made to
beneficial interest holders from an irrevocable guarantee by Merrill Lynch (or by third-party
financial institutions where Merrill Lynch has agreed to reimburse the financial institution if
losses occur). If the default protection is drawn, Merrill Lynch may claim the underlying assets
held by the SPEs. As of December 30, 2005, the maximum payout if an issuer defaults was $4.1
billion, and the value of the assets to which Merrill Lynch has recourse, in the event that an
issuer of a municipal bond held by the SPE defaults on any payment of principal and/or interest
when due, was $5.2 billion; however, as described in the preceding paragraph, these two amounts are
not directly comparable as the assets to which Merrill Lynch has recourse are not part of a
cross-collateralized pool. Merrill Lynch also provides a $3.0 billion liquidity facility and $60
million credit facility to the Conduit. The maximum exposure to loss for these facilities combined
is $3.1 billion and assumes a total loss on a portfolio of highly rated assets. As such, this
measure significantly overstates Merrill Lynch’s exposure or expected losses at December 30, 2005.
110
Merrill Lynch 2005 Annual Report
Further, to protect against declines in the value of the assets held by SPEs, for which Merrill
Lynch provides either liquidity facilities or default protection, Merrill Lynch economically hedges
its exposure through derivative positions that principally offset the risk of loss arising from
these guarantees.
Merrill Lynch also provides residual value guarantees to leasing SPEs where either Merrill Lynch or
a third-party is the lessee. For transactions where Merrill Lynch is not the lessee, the guarantee
provides loss coverage for any shortfalls in the proceeds from asset sales greater than 75–90% of
the adjusted acquisition price, as defined. Where Merrill Lynch is the lessee, it provides a
guarantee that any proceeds from the sale of the assets will amount to at least 84% of the adjusted
acquisition cost, as defined.
Merrill Lynch also enters into reimbursement agreements in conjunction with sales of loans
originated under its Mortgage 100SM program. Under this program, borrowers can pledge
marketable securities in lieu of making a cash down payment. Upon sale of these mortgage loans,
purchasers may require a surety bond that reimburses for certain shortfalls in the borrowers’
securities accounts. Merrill Lynch provides this reimbursement through a financial intermediary.
Merrill Lynch requires borrowers to meet daily collateral calls to ensure that the securities
pledged as down payment are sufficient at all times. Merrill Lynch believes that its potential for
loss under these arrangements is remote. Accordingly, no liability is recorded in the Consolidated
Balance Sheets.
In addition, Merrill Lynch makes guarantees to counterparties in the form of standby letters of
credit. Merrill Lynch holds marketable securities of $487 million as collateral to secure these
guarantees.
Further, in conjunction with certain principal-protected mutual funds, Merrill Lynch guarantees the
return of the initial principal investment at the termination date of the fund. These funds are
generally managed based on a formula that requires the fund to hold a combination of general
investments and highly liquid risk-free assets that, when combined, will result in the return of
principal at the maturity date unless there is a significant market event. At December 30, 2005,
Merrill Lynch’s maximum potential exposure to loss with respect to these guarantees is $634 million
assuming that the funds are invested exclusively in other general investments (i.e., the funds hold
no risk-free assets), and that those other general investments suffer a total loss. As such, this
measure significantly overstates Merrill Lynch’s exposure or expected loss at December 30, 2005.
These transactions met the SFAS No. 149 definition of derivatives and, as such, were carried as a
liability with a fair value of $7 million at December 30, 2005.
Merrill Lynch also provides indemnifications related to the U.S. tax treatment of certain foreign
tax planning transactions. The maximum exposure to loss associated with these transactions is $164
million; however, Merrill Lynch believes that the likelihood of loss with respect to these
arrangements is remote.
These guarantees and their expiration are summarized at December 30, 2005 as follows:
| |
|
|
|
|
|
|
|
|
|
|
|
|
|
|
|
|
|
|
|
|
|
|
|
|
| |
Maximum |
|
Less than |
|
|
|
|
|
|
|
|
|
Over |
|
Carrying |
|
| (dollars in millions) |
Payout/Notional |
|
1 year |
|
1–3 years |
|
3+–5 years |
|
5 years |
|
Value |
|
| |
Derivative contracts(1)
|
|
$ |
1,705,577 |
|
|
$ |
525,267 |
|
|
$ |
389,723 |
|
|
$ |
330,081 |
|
|
$ |
460,506 |
|
|
$ |
37,639 |
|
Liquidity facilities with SPEs(2)
|
|
|
25,871 |
|
|
|
25,453 |
|
|
|
397 |
|
|
|
21 |
|
|
|
— |
|
|
|
12 |
|
Liquidity and default facilities with
SPEs(3)
|
|
|
7,114 |
|
|
|
6,064 |
|
|
|
806 |
|
|
|
— |
|
|
|
244 |
|
|
|
7 |
|
Residual value guarantees(4)
|
|
|
1,061 |
|
|
|
60 |
|
|
|
19 |
|
|
|
478 |
|
|
|
504 |
|
|
|
26 |
|
Standby letters of credit and other
guarantees(5)(6)(7)
|
|
|
3,291 |
|
|
|
1,313 |
|
|
|
384 |
|
|
|
886 |
|
|
|
708 |
|
|
|
16 |
|
| |
|
|
|
| (1) |
|
As noted above, the notional value of derivative contracts is provided rather than the
maximum payout amount, although the notional value should not be considered as a reliable indicator
of Merrill Lynch’s exposure to these contracts. |
| (2) |
|
Amounts relate primarily to facilities provided to municipal bond securitization SPEs. Includes
$6.9 billion of guarantees provided to SPEs by third-party financial institutions where Merrill
Lynch has agreed to reimburse the financial institution if losses occur, and has up to one year to
fund losses. |
| (3) |
|
Amounts relate to liquidity facilities and credit default protection provided to municipal bond
securitization SPEs and the Conduit sponsored by Merrill Lynch. |
| (4) |
|
Includes residual value
guarantees associated with the Hopewell campus and aircraft leases of $322 million. |
| (5) |
|
Includes $244 million of reimbursement agreements with the Mortgage 100SM program. |
| (6) |
|
Includes guarantees related to principal-protected mutual funds. |
| (7) |
|
Includes certain indemnifications related to foreign tax planning strategies. |
In addition to the guarantees described above, Merrill Lynch also provides guarantees to
securities clearinghouses and exchanges. Under the standard membership agreement, members are
required to guarantee the performance of other members. Under the agreements, if another member
becomes unable to satisfy its obligations to the clearinghouse, other members would be required to
meet shortfalls. Merrill Lynch’s liability under these arrangements is not quantifiable and could
exceed the cash and securities it has posted as collateral. However, the potential for Merrill
Lynch to be required to make payments under these arrangements is remote. Accordingly, no liability
is carried in the Consolidated Balance Sheets for these arrangements.
In connection with its prime brokerage business, Merrill Lynch provides to counterparties
guarantees of the performance of its prime brokerage clients. Under these arrangements, Merrill
Lynch stands ready to meet the obligations of its customers with respect to securities
transactions. If the customer fails to fulfill its obligation, Merrill Lynch must fulfill the
customer’s obligation with the counter-party. Merrill Lynch is secured by the assets in the
customer’s account as well as any proceeds received from the securities transaction entered into by
Merrill Lynch on behalf of the customer. No contingent liability is carried in the Consolidated
Balance Sheets for these transactions as the potential for Merrill Lynch to be required to make
payments under these arrangements is remote.
In connection with providing supplementary protection to its customers, MLPF&S holds insurance in
excess of that furnished by the Securities Investor Protection Corporation (“SIPC”). The policy
provides coverage up to $600 million in the aggregate (including up to $1.9 million per customer
for cash) for losses incurred by customers in excess of the SIPC limits. ML & Co. provides full
indemnity to the policy provider syndicate against any losses as a result of this agreement. No
contingent liability is carried in the Consolidated Balance Sheets for this indemnification as the
potential for Merrill Lynch to be required to make payments under this agreement is remote.
In connection with its securities clearing business, Merrill Lynch performs securities execution,
clearance and settlement services on behalf of other broker-dealer clients for whom it commits to
settle trades submitted for or by such clients, with the applicable clearinghouse; trades are
submitted either individually, in groups or series or, if specific arrangements are made with a
particular clearinghouse and client, all transactions with such clearing entity by such client.
Merrill Lynch’s liability under these arrangements is not quantifiable and could exceed any cash
deposit made by a client. However, the potential for Merrill Lynch to be required to make
unreimbursed payments under these arrangements is remote due to the contractual capital
requirements associated with clients’ activity and the regular review of clients’ capital.
Accordingly, no liability is carried in the Consolidated Balance Sheets for these transactions.
In connection with certain European mergers and acquisition transactions, Merrill Lynch, in its
capacity as financial advisor, in some cases may be required by law to provide a guarantee that the
acquiring entity has or can obtain or issue sufficient funds or securities to complete the
transaction. These arrangements are short-term in nature, extending from the commencement of the
offer through the termination or closing. Where guarantees are required or implied by law, Merrill
Lynch engages in a credit review of the acquirer, obtains indemnification and requests other
contractual protections where appropriate. Merrill Lynch’s maximum liability equals the required
funding for each transaction and varies throughout the year depending upon the size and number of
open transactions. Based on the review procedures performed, management believes the likelihood of
being required to pay under these arrangements is remote. Accordingly, no liability is recorded in
the Consolidated Balance Sheets for these transactions.
In the course of its business, Merrill Lynch routinely indemnifies investors for certain taxes,
including U.S. and foreign withholding taxes on interest and other payments made on securities,
swaps and other derivatives. These additional payments would be required upon a change in law or
interpretation thereof. Merrill Lynch’s maximum exposure under these indemnifications is not
quantifiable. Merrill Lynch believes that the potential for such an adverse change is remote. As
such, no liability is recorded in the Consolidated Balance Sheets.
In connection with certain asset sales and securitization transactions, Merrill Lynch typically
makes representations and warranties about the underlying assets conforming to specified
guidelines. If the underlying assets do not conform to the specifications, Merrill Lynch may have
an obligation to repurchase the assets or indemnify the purchaser against any loss. To the extent
these assets were originated by others and purchased by Merrill Lynch, Merrill Lynch seeks to
obtain appropriate representations and warranties in connection with its acquisition of the assets.
Merrill Lynch believes that the potential for loss under these arrangements is remote. Accordingly,
no liability is carried in the Consolidated Balance Sheets for these arrangements.
In connection with certain divestiture transactions, Merrill Lynch provides an indemnity to the
purchaser, which will fully compensate the purchaser for any unknown liens or liabilities (e.g.,
tax liabilities) that relate to prior periods but are not discovered until after the transaction is
closed. Merrill Lynch’s maximum liability under these indemnifications cannot be quantified.
However, Merrill Lynch believes that the likelihood of being required to pay is remote given the
level of due diligence performed prior to the close of the transactions. Accordingly, no liability
is recorded in the Consolidated Balance Sheets for these indemnifications.
112
Merrill Lynch 2005 Annual Report
|
|
|
| NOTE 13
|
|
Employee Benefit Plans |
Merrill Lynch provides pension and other postretirement benefits to its employees worldwide
through defined contribution pension, defined benefit pension and other postretirement plans. These
plans vary based on the country and local practices. Merrill Lynch reserves the right to amend or
terminate these plans at any time.
Merrill Lynch accounts for its defined benefit pension plans in accordance with SFAS No. 87,
Employers’ Accounting for Pensions and SFAS No. 88, Employers’ Accounting for Settlements and
Curtailments of Defined Benefit Pension Plans and for Termination Benefits. Its postretirement
benefit plans are accounted for in accordance with SFAS No. 106, Employers’ Accounting for
Postretirement Benefits Other Than Pensions, and postemployment benefits are accounted for in
accordance with SFAS No. 112, Employers’ Accounting for Postemployment Benefits.
Merrill Lynch’s measurement date for both its defined benefit pension and other postretirement
benefit plans is September 30th.
Defined Contribution Pension Plans
The U.S. defined contribution pension plans consist of the Retirement Accumulation Plan
(“RAP”), the Employee Stock Ownership Plan (“ESOP”), and the 401(k) Savings & Investment Plan
(“401(k)”). The RAP and ESOP cover substantially all U.S. employees who have met the service
requirement. There is no service requirement for employee deferrals in the 401(k). However, there
is a service requirement for an employee to receive corporate contributions in the 401(k).
Merrill Lynch established the RAP and the ESOP, collectively known as the “Retirement Program,” for
the benefit of employees with a minimum of one year of service. A notional retirement account is
maintained for each participant. The RAP contributions are employer-funded based on compensation
and years of service. Merrill Lynch made a contribution of approximately $149 million to the Retirement
Program in February 2006 to satisfy the 2005 contribution requirement. Under the RAP, employees are
given the opportunity to invest their retirement savings in a number of different investment
alternatives including ML & Co. common stock. Under the ESOP, all retirement savings are invested
in ML & Co. common stock, until employees have five years of service after which they have the
ability to diversify.
Merrill Lynch allocates ESOP shares of Merrill Lynch stock to all participants of the ESOP as
principal from the ESOP loan is repaid. Beginning in 2004, these allocations are made on an annual
basis. ESOP shares are considered to be either allocated (contributed to participants’ accounts),
committed (scheduled to be contributed at a specified future date but not yet released), or
unallocated (not committed or allocated). Share information at December 30, 2005 is as follows:
| |
|
|
|
|
| |
Unallocated shares as of December 31, 2004 |
|
|
598,381 |
|
Shares allocated/committed(1) |
|
|
(186,268 |
) |
|
|
|
|
Unallocated shares as of December 30, 2005 |
|
|
412,113 |
|
| |
|
|
|
| (1) |
|
Excluding forfeited shares. |
Additional information on ESOP activity follows:
| |
|
|
|
|
|
|
|
|
|
|
|
|
| (dollars in millions) |
2005 |
|
2004 |
|
2003 |
|
| |
Compensation costs funded with ESOP shares |
|
$ |
13 |
|
|
$ |
11 |
|
|
$ |
9 |
|
Dividends used for debt service |
|
|
– |
|
|
|
– |
|
|
|
1 |
|
| |
Merrill Lynch guarantees the debt of the ESOP. The note bears an interest rate of 6.75%, has an
outstanding balance of $2 million as of December 30, 2005, and matures on December 31, 2007. All
dividends received by the ESOP on unallocated ESOP shares are used to pay down the note.
Employees can participate in the 401(k) by contributing, on a tax-deferred basis, a certain
percentage of their eligible compensation, up to 25% since 2003, but not more than the maximum
annual amount allowed by law. Beginning in 2005, employees may contribute up to 25% of eligible
compensation in after-tax dollars up to an annual maximum of $10,000. Beginning July 1, 2002,
employees over the age of 50 may also make a catch-up contribution up to the maximum annual amount
allowed by law. Employees are given the opportunity to invest their 401(k) contributions in a
number of different investment alternatives including ML & Co. common stock. Merrill Lynch’s
contributions are made in cash, and are equal to one-half of the first 6% of each participant’s
eligible compensation contributed to the 401(k), up to a maximum of two thousand dollars annually.
Prior to 2004, no corporate contributions were made for participants who were also Employee Stock
Purchase Plan participants (see Note 14 to the Consolidated Financial Statements). This restriction
was removed effective January 1, 2004. Merrill Lynch makes contributions to the 401(k) on a pay
period basis and expects to make contributions of approximately $57 million in 2006.
Merrill Lynch also sponsors various non-U.S. defined contribution pension plans. The costs of
benefits under the RAP, 401(k), and non-U.S. plans are expensed during the related service period.
Defined Benefit Pension Plans
In 1988 Merrill Lynch purchased a group annuity contract that guarantees the payment of
benefits vested under a U.S. defined benefit pension plan that was terminated (the “U.S. Terminated
Pension Plan”) in accordance with the applicable provisions of the Employee Retirement Income
Security Act of 1974 (“ERISA”). At year-end 2005 and 2004, a substantial portion of the assets
supporting the annuity contract were invested in U.S. Government and agencies securities. Merrill
Lynch, under a supplemental agreement, may be responsible for, or benefit from, actual experience
and investment performance of the annuity assets. Merrill Lynch does not expect to make contributions
under this agreement in 2006. Merrill Lynch also maintains supplemental defined benefit pension
plans (i.e., plans not subject to Title IV of ERISA) for certain U.S. participants. Merrill Lynch
expects to pay $3 million of benefit payments to participants in the U.S. non-qualified pension
plans in 2006.
Employees of certain non-U.S. subsidiaries participate in various local defined benefit pension
plans. These plans provide benefits that are generally based on years of credited service and a
percentage of the employee’s eligible compensation during the final years of employment. Merrill
Lynch’s funding policy has been to contribute annually the amount necessary to satisfy local
funding standards. Merrill Lynch currently expects to contribute $103 million to its non-U.S.
pension plans in 2006.
Postretirement Benefits Other Than Pensions
Merrill Lynch provides health insurance benefits to retired employees under a plan that covers
substantially all U.S. employees who have met age and service requirements. The health care
coverage is contributory, with certain retiree contributions adjusted periodically.
Non-contributory life insurance was offered to employees that had retired prior to February 1,
2000. The accounting for costs of health care benefits anticipates future changes in cost-sharing
provisions. Merrill Lynch pays claims as incurred. Full-time employees of Merrill Lynch become
eligible for these benefits upon attainment of age 55 and completion of ten years of service.
Effective December 31, 2005, employees who turn age 65 after January 1, 2011 and are eligible for
and elect supplemental retiree medical coverage will pay the full cost of coverage after age 65.
Beginning January 1, 2006, newly hired employees and rehired employees will be offered retiree
medical coverage, if they otherwise meet the eligibility requirement, but on a retiree-pay-all
basis for coverage before and after age 65. Merrill Lynch also sponsors similar plans that provide
health care benefits to retired employees of certain non-U.S. subsidiaries. As of December 30,
2005, none of these plans had been funded.
114
Merrill Lynch 2005 Annual Report
The following table provides a summary of the changes in the plans’ benefit obligations,
fair value of plan assets, and funded status, for the twelve-month periods ended September 30, 2005 and September 30,
2004, and the amounts recognized in the Consolidated Balance Sheets at year-end 2005 and 2004 for
Merrill Lynch’s U.S. and non-U.S. defined benefit pension and postretirement benefit plans:
| |
|
|
|
|
|
|
|
|
|
|
|
|
|
|
|
|
|
|
|
|
|
|
|
|
|
|
|
|
|
|
|
|
| |
|
|
|
|
|
|
|
|
|
Non-U.S. Defined |
|
|
Total Defined |
|
|
|
|
| |
|
U.S. Defined Benefit |
|
|
Benefit Pension |
|
|
Benefit Pension |
|
|
Postretirement |
|
| |
|
Pension Plans |
|
|
Plans(1) |
|
|
Plans |
|
|
Plans(2) |
|
| (dollars in millions) |
|
2005 |
|
|
2004 |
|
|
2005 |
|
|
2004 |
|
|
2005 |
|
|
2004 |
|
|
2005 |
|
|
2004 |
|
| |
Benefit obligations |
|
|
|
|
|
|
|
|
|
|
|
|
|
|
|
|
|
|
|
|
|
|
|
|
|
|
|
|
|
|
|
|
Balance, beginning of year |
|
$ |
1,782 |
|
|
$ |
1,728 |
|
|
$ |
1,186 |
|
|
$ |
1,022 |
|
|
$ |
2,968 |
|
|
$ |
2,750 |
|
|
$ |
552 |
|
|
$ |
525 |
|
Service cost |
|
|
– |
|
|
|
– |
|
|
|
24 |
|
|
|
35 |
|
|
|
24 |
|
|
|
35 |
|
|
|
18 |
|
|
|
17 |
|
Interest cost |
|
|
95 |
|
|
|
97 |
|
|
|
58 |
|
|
|
54 |
|
|
|
153 |
|
|
|
151 |
|
|
|
31 |
|
|
|
30 |
|
Net actuarial losses (gains) |
|
|
60 |
|
|
|
52 |
|
|
|
189 |
|
|
|
24 |
|
|
|
249 |
|
|
|
76 |
|
|
|
(143 |
)(3) |
|
|
(4 |
) |
Employee contributions |
|
|
– |
|
|
|
– |
|
|
|
2 |
|
|
|
2 |
|
|
|
2 |
|
|
|
2 |
|
|
|
– |
|
|
|
– |
|
Amendments |
|
|
– |
|
|
|
– |
|
|
|
– |
|
|
|
– |
|
|
|
– |
|
|
|
– |
|
|
|
(77 |
)(3) |
|
|
– |
|
Acquisition |
|
|
33 |
|
|
|
– |
|
|
|
– |
|
|
|
– |
|
|
|
33 |
|
|
|
– |
|
|
|
– |
|
|
|
– |
|
Benefits paid |
|
|
(99 |
) |
|
|
(95 |
) |
|
|
(33 |
) |
|
|
(38 |
) |
|
|
(132 |
) |
|
|
(133 |
) |
|
|
(18 |
) |
|
|
(18 |
) |
Curtailment and settlements |
|
|
– |
|
|
|
– |
|
|
|
(3 |
) |
|
|
(5 |
) |
|
|
(3 |
) |
|
|
(5 |
) |
|
|
– |
|
|
|
– |
|
Foreign exchange and other |
|
|
– |
|
|
|
– |
|
|
|
(132 |
) |
|
|
92 |
|
|
|
(132 |
) |
|
|
92 |
|
|
|
(3 |
) |
|
|
2 |
|
| |
|
|
Balance, end of period |
|
|
1,871 |
|
|
|
1,782 |
|
|
|
1,291 |
|
|
|
1,186 |
|
|
|
3,162 |
|
|
|
2,968 |
|
|
|
360 |
|
|
|
552 |
|
| |
|
|
Fair value of plan assets |
|
|
|
|
|
|
|
|
|
|
|
|
|
|
|
|
|
|
|
|
|
|
|
|
|
|
|
|
|
|
|
|
Balance, beginning of year |
|
|
2,243 |
|
|
|
2,220 |
|
|
|
785 |
|
|
|
625 |
|
|
|
3,028 |
|
|
|
2,845 |
|
|
|
– |
|
|
|
– |
|
Actual return on plan assets |
|
|
181 |
|
|
|
123 |
|
|
|
148 |
|
|
|
78 |
|
|
|
329 |
|
|
|
201 |
|
|
|
– |
|
|
|
– |
|
Settlements |
|
|
– |
|
|
|
– |
|
|
|
– |
|
|
|
(1 |
) |
|
|
– |
|
|
|
(1 |
) |
|
|
– |
|
|
|
– |
|
Contributions |
|
|
– |
|
|
|
(5 |
)(4) |
|
|
31 |
|
|
|
58 |
|
|
|
31 |
|
|
|
53 |
|
|
|
18 |
|
|
|
18 |
|
Benefits paid |
|
|
(99 |
) |
|
|
(95 |
) |
|
|
(33 |
) |
|
|
(38 |
) |
|
|
(132 |
) |
|
|
(133 |
) |
|
|
(18 |
) |
|
|
(18 |
) |
Foreign exchange and other |
|
|
– |
|
|
|
– |
|
|
|
(87 |
) |
|
|
63 |
|
|
|
(87 |
) |
|
|
63 |
|
|
|
– |
|
|
|
– |
|
| |
|
|
Balance, end of period |
|
|
2,325 |
|
|
|
2,243 |
|
|
|
844 |
|
|
|
785 |
|
|
|
3,169 |
|
|
|
3,028 |
|
|
|
– |
|
|
|
– |
|
| |
|
|
Funded status |
|
|
454 |
|
|
|
461 |
|
|
|
(447 |
) |
|
|
(401 |
) |
|
|
7 |
|
|
|
60 |
|
|
|
(360 |
) |
|
|
(552 |
) |
Unrecognized net actuarial losses (gains)(5) |
|
|
(193 |
) |
|
|
(168 |
) |
|
|
361 |
|
|
|
322 |
|
|
|
168 |
|
|
|
154 |
|
|
|
31 |
|
|
|
183 |
|
Unrecognized prior service cost |
|
|
– |
|
|
|
– |
|
|
|
– |
|
|
|
– |
|
|
|
– |
|
|
|
– |
|
|
|
(76 |
) |
|
|
2 |
|
Fourth-quarter activity, net |
|
|
– |
|
|
|
(1 |
) |
|
|
91 |
|
|
|
10 |
|
|
|
91 |
|
|
|
9 |
|
|
|
5 |
|
|
|
5 |
|
| |
|
|
Net amount recognized |
|
$ |
261 |
|
|
$ |
292 |
|
|
$ |
5 |
|
|
$ |
(69 |
) |
|
$ |
266 |
|
|
$ |
223 |
|
|
$ |
(400 |
) |
|
$ |
(362 |
) |
| |
|
|
Assets |
|
$ |
298 |
|
|
$ |
297 |
|
|
$ |
82 |
|
|
$ |
14 |
|
|
$ |
380 |
|
|
$ |
311 |
|
|
$ |
– |
|
|
$ |
– |
|
Liabilities |
|
|
(42 |
) |
|
|
(10 |
) |
|
|
(296 |
) |
|
|
(256 |
) |
|
|
(338 |
) |
|
|
(266 |
) |
|
|
(400 |
) |
|
|
(362 |
) |
Accumulated other comprehensive loss
($153 million and $122 million, net
of tax, in 2005 and 2004) |
|
|
5 |
|
|
|
5 |
|
|
|
219 |
|
|
|
173 |
|
|
|
224 |
|
|
|
178 |
|
|
|
– |
|
|
|
– |
|
| |
|
|
Net amount recognized |
|
$ |
261 |
|
|
$ |
292 |
|
|
$ |
5 |
|
|
$ |
(69 |
) |
|
$ |
266 |
|
|
$ |
223 |
|
|
$ |
(400 |
) |
|
$ |
(362 |
) |
| |
|
|
|
| (1) |
|
Primarily represents the U.K. pension plan which accounts for 73% of the benefit obligation
and 76% of the fair value of plan assets at the end of the period. |
| (2) |
|
Approximately 91% of the postretirement benefit obligation at the end of the period relates to
the U.S. postretirement plan. |
| (3) |
|
Postretirement Plans net actuarial gains and plan amendments are
due to changes in the U.S. postretirement plan. |
| (4) |
|
Represents changes to the U.S. terminated pension plan annuity contract due to adjustments in
the benefit amounts. |
| (5) |
|
The unrecognized gain for the U.S. defined benefit pension plan relates to the U.S. terminated
pension plan. The unrecognized loss for the U.K. pension plan represents approximately 77% of the
total unrecognized net actuarial loss for the non-U.S. pension plans. The U.S. postretirement plan
accounts for 80% of the net unrecognized losses relating to the postretirement plans. |
The unrecognized net actuarial losses (gains) represent changes in the amount of either the
projected benefit obligation or plan assets resulting from actual experience being different than
that assumed and from changes in assumptions. Merrill Lynch amortizes unrecognized net actuarial
losses (gains) over the average future service periods of active participants to the extent that
the loss or gain exceeds 10% of the greater of the projected benefit obligation or the fair value
of plan assets. This amount is recorded within net periodic benefit cost. The average future
service period for the U.K. defined benefit pension plan and the U.S. postretirement plan were 13
years and 16 years, respectively. Accordingly, the expense to be recorded in fiscal year ending
2006 related to the U.K. defined benefit pension plan unrecognized loss is $14 million. The U.S.
postretirement plan unrecognized loss does not exceed 10% of the greater of the projected benefit
obligation or the fair value of plan assets; therefore the loss will not be amortized to expense in
2006. The U.S. defined benefit pension plan unrecognized gain does not exceed 10% of the greater of
the projected benefit obligation or the fair value of plan assets; therefore the gain will not be
amortized to expense in 2006.
The accumulated benefit obligation for all defined benefit pension plans was $3,021 million and
$2,842 million at September 30, 2005 and September 30, 2004, respectively.
The projected benefit obligation, accumulated benefit obligation, and fair value of plan assets for
pension plans with accumulated benefit obligations in excess of plan assets were $1,186 million,
$1,072 million, and $694 million, respectively, as of September 30, 2005, and $1,052 million, $952
million, and $641 million, respectively, as of September 30, 2004. These plans primarily represent
U.S. supplemental plans not subject to ERISA or non-U.S. plans where funding strategies vary due to
legal requirements and local practices.
The increase in accumulated other comprehensive loss in 2005 resulted from the recognition of an
additional minimum pension liability in 2005 of $46 million ($31 million, net of tax), primarily
related to the U.K. and other non-U.S. pension plans. The unfunded accumulated benefit obligation
of these plans increased in value due to a decrease in the discount rate and other assumption
changes.
The weighted average assumptions used in calculating the benefit obligation at September 30, 2005
and September 30, 2004 are as follows:
| |
|
|
|
|
|
|
|
|
|
|
|
|
|
|
|
|
|
|
|
|
|
|
|
|
|
|
|
|
|
|
|
|
| |
|
|
|
|
|
|
|
|
|
Non-U.S. Defined |
|
|
Total Defined |
|
|
|
|
| |
|
U.S. Defined Benefit |
|
|
Benefit Pension |
|
|
Benefit Pension |
|
|
Postretirement |
|
| |
|
Pension Plans |
|
|
Plans |
|
|
Plans |
|
|
Plans |
|
| |
|
2005 |
|
|
2004 |
|
|
2005 |
|
|
2004 |
|
|
2005 |
|
|
2004 |
|
|
2005 |
|
|
2004 |
|
| |
Discount rate |
|
|
5.2 |
% |
|
|
5.5 |
% |
|
|
4.9 |
% |
|
|
5.3 |
% |
|
|
5.1 |
% |
|
|
5.4 |
% |
|
|
5.3 |
% |
|
|
5.7 |
% |
Rate of compensation increase |
|
|
N/A |
|
|
|
N/A |
|
|
|
4.3 |
% |
|
|
4.2 |
% |
|
|
4.3 |
% |
|
|
4.2 |
% |
|
|
N/A |
|
|
|
N/A |
|
Healthcare cost trend rates(1)
Initial |
|
|
N/A |
|
|
|
N/A |
|
|
|
N/A |
|
|
|
N/A |
|
|
|
N/A |
|
|
|
N/A |
|
|
|
10.3 |
% |
|
|
11.9 |
% |
Long-term |
|
|
N/A |
|
|
|
N/A |
|
|
|
N/A |
|
|
|
N/A |
|
|
|
N/A |
|
|
|
N/A |
|
|
|
4.9 |
% |
|
|
4.9 |
% |
| |
|
|
|
N/A=Not Applicable |
| (1) |
|
The healthcare cost trend rate is assumed to decrease gradually through 2015 and remain
constant thereafter. |
Total net periodic benefit cost for the years ended 2005, 2004, and 2003 included the following
components:
| |
|
|
|
|
|
|
|
|
|
|
|
|
|
|
|
|
|
|
|
|
|
|
|
|
|
|
|
|
|
|
|
|
|
|
|
|
|
|
|
|
|
|
|
|
|
|
|
|
| |
|
|
|
|
|
|
|
|
|
|
|
|
|
Non-U.S. |
|
|
|
|
|
|
|
| |
|
U.S. Pension Plans |
|
|
Pension Plans |
|
|
Total Pension Plans |
|
|
Postretirement Plans |
|
| (dollars in millions) |
|
2005 |
|
|
2004 |
|
|
2003 |
|
|
2005 |
|
|
2004 |
|
|
2003 |
|
|
2005 |
|
|
2004 |
|
|
2003 |
|
|
2005 |
|
|
2004 |
|
|
2003 |
|
| |
Defined contribution pension plan cost |
|
$ |
199 |
|
|
$ |
190 |
|
|
$ |
165 |
|
|
$ |
57 |
|
|
$ |
46 |
|
|
$ |
36 |
|
|
$ |
256 |
|
|
$ |
236 |
|
|
$ |
201 |
|
|
|
N/A |
|
|
|
N/A |
|
|
|
N/A |
|
| |
|
|
Defined benefit and postretirement plans
Service cost(1)(2) |
|
|
– |
|
|
|
– |
|
|
|
– |
|
|
|
24 |
|
|
|
35 |
|
|
|
43 |
|
|
|
24 |
|
|
|
35 |
|
|
|
43 |
|
|
$ |
18 |
|
|
$ |
17 |
|
|
$ |
15 |
|
Interest cost |
|
|
95 |
|
|
|
97 |
|
|
|
100 |
|
|
|
58 |
|
|
|
54 |
|
|
|
43 |
|
|
|
153 |
|
|
|
151 |
|
|
|
143 |
|
|
|
31 |
|
|
|
30 |
|
|
|
32 |
|
Expected return on plan
assets |
|
|
(96 |
) |
|
|
(96 |
) |
|
|
(98 |
) |
|
|
(49 |
) |
|
|
(46 |
) |
|
|
(39 |
) |
|
|
(145 |
) |
|
|
(142 |
) |
|
|
(137 |
) |
|
|
– |
|
|
|
– |
|
|
|
– |
|
Amortization of unrecognized
items
and other |
|
|
– |
|
|
|
– |
|
|
|
(14 |
) |
|
|
14 |
|
|
|
19 |
|
|
|
17 |
|
|
|
14 |
|
|
|
19 |
|
|
|
3 |
|
|
|
9 |
|
|
|
8 |
|
|
|
11 |
|
| |
|
|
Total defined benefit and
postretirement plan costs |
|
|
(1 |
) |
|
|
1 |
|
|
|
(12 |
) |
|
|
47 |
|
|
|
62 |
|
|
|
64 |
|
|
|
46 |
|
|
|
63 |
|
|
|
52 |
|
|
|
58 |
|
|
|
55 |
|
|
|
58 |
|
| |
|
|
Total net periodic benefit cost |
|
$ |
198 |
|
|
$ |
191 |
|
|
$ |
153 |
|
|
$ |
104 |
|
|
$ |
108 |
|
|
$ |
100 |
|
|
$ |
302 |
|
|
$ |
299 |
|
|
$ |
253 |
|
|
$ |
58 |
|
|
$ |
55 |
|
|
$ |
58 |
|
| |
|
|
|
N/A=Not Applicable |
| (1) |
|
The U.S. plan was terminated in 1988 and thus does not incur service costs. |
| (2) |
|
The U.K. defined benefit pension plan was frozen during the second quarter of 2004, which
reduced service cost in 2004 and 2005. |
The weighted average assumptions used in calculating the net periodic benefit cost for the
years ended September 30, 2005, 2004, and 2003 are as follows:
| |
|
|
|
|
|
|
|
|
|
|
|
|
|
|
|
|
|
|
|
|
|
|
|
|
|
|
|
|
|
|
|
|
|
|
|
|
|
|
|
|
|
|
|
|
|
|
|
|
| |
|
|
|
|
|
|
|
|
|
|
|
|
|
Non-U.S. |
|
|
Total |
|
|
|
|
| |
|
U.S. Defined Benefit |
|
|
Defined Benefit |
|
|
Defined Benefit |
|
|
|
|
| |
|
Pension Plans |
|
|
Pension Plans |
|
|
Pension Plans |
|
|
Postretirement Plans |
|
| |
|
2005 |
|
|
2004 |
|
|
2003 |
|
|
2005 |
|
|
2004 |
|
|
2003 |
|
|
2005 |
|
|
2004 |
|
|
2003 |
|
|
2005 |
|
|
2004 |
|
|
2003 |
|
| |
Discount rate |
|
|
5.5 |
% |
|
|
5.8 |
% |
|
|
6.5 |
% |
|
|
5.3 |
% |
|
|
5.2 |
% |
|
|
5.5 |
% |
|
|
5.4 |
% |
|
|
5.6 |
% |
|
|
6.2 |
% |
|
|
5.7 |
% |
|
|
6.0 |
% |
|
|
6.5 |
% |
Expected long-term return on pension
plan assets |
|
|
4.4 |
% |
|
|
4.4 |
% |
|
|
4.5 |
% |
|
|
6.7 |
% |
|
|
6.9 |
% |
|
|
7.6 |
% |
|
|
5.0 |
% |
|
|
5.0 |
% |
|
|
5.0 |
% |
|
|
N/A |
|
|
|
N/A |
|
|
|
N/A |
|
Rate of compensation increase |
|
|
N/A |
|
|
|
N/A |
|
|
|
N/A |
|
|
|
4.2 |
% |
|
|
4.1 |
% |
|
|
4.1 |
% |
|
|
4.2 |
% |
|
|
4.1 |
% |
|
|
4.1 |
% |
|
|
N/A |
|
|
|
N/A |
|
|
|
N/A |
|
Healthcare cost trend rates(1)
|
|
|
|
|
|
|
|
|
|
|
|
|
|
|
|
|
|
|
|
|
|
|
|
|
|
|
|
|
|
|
|
|
|
|
|
|
|
|
|
|
|
|
|
|
|
|
|
|
Initial |
|
|
N/A |
|
|
|
N/A |
|
|
|
N/A |
|
|
|
N/A |
|
|
|
N/A |
|
|
|
N/A |
|
|
|
N/A |
|
|
|
N/A |
|
|
|
N/A |
|
|
|
11.9 |
% |
|
|
12.9 |
% |
|
|
12.8 |
% |
Long-term |
|
|
N/A |
|
|
|
N/A |
|
|
|
N/A |
|
|
|
N/A |
|
|
|
N/A |
|
|
|
N/A |
|
|
|
N/A |
|
|
|
N/A |
|
|
|
N/A |
|
|
|
4.9 |
% |
|
|
5.0 |
% |
|
|
5.0 |
% |
| |
|
|
|
N/A=Not Applicable |
| (1) |
|
The healthcare cost trend rate is assumed to decrease gradually through 2015 and remain
constant thereafter. |
116
Merrill Lynch 2005 Annual Report
Plan Assumptions
The discount rate used in determining the benefit obligation for the U.S. defined benefit
pension and postretirement plans was developed by selecting the appropriate U.S. Treasury yield,
and the related swap spread, consistent with the duration of the plan’s obligation. This yield was
further adjusted to reference a Merrill Lynch specific Moody’s Corporate Aa rating. The discount
rate for the U.K. pension plan was selected by reference to the appropriate U.K. GILTS rate, and
the related swap spread, consistent with the duration of the plan’s obligation. This yield was
further adjusted to reference a Merrill Lynch specific Moody’s Corporate Aa rating.
The expected long-term rate of return on plan assets reflects the average rate of earnings expected
on the funds invested or to be invested to provide for the benefits included in the projected
benefit obligation. The U.S. terminated pension plan, which represents approximately 73% of Merrill
Lynch’s total pension plan assets as of September 30, 2005, is 100% invested in a group annuity
contract which is currently 100% invested in fixed income securities. The expected long-term rate
of return on plan assets for the U.S. terminated pension plan is based on the portfolio yield at
the beginning of each fiscal year. The U.K. pension plan, which represents approximately 20% of
Merrill Lynch’s total plan assets as of September 30, 2005, is currently invested in 80% equity
securities, 14% debt securities and 6% real estate. The expected long-term rate of return on the
U.K. pension plan assets was determined by Merrill Lynch and reflects estimates by the plan
investment advisors of the expected returns on different asset classes held by the plan in light of
prevailing economic conditions at the beginning of the fiscal year.
At September 30, 2005, Merrill Lynch reduced the discount rate used to determine the U.S. pension
plan and postretirement benefit plan obligations to 5.2% and 5.3%, respectively. The expected rate
of return for the U.S. pension plan assets for 2005 was not changed from 2004. The discount rate at
September 30, 2005 for the U.K. pension plan was reduced from 5.5% in 2004 to 5.3% for 2005. In
addition, the expected rate of return for the U.K. pension plan was reduced from 7.5% in 2004 to
7.3% for 2005, which increased expense in 2005 by approximately $2 million.
Although Merrill Lynch’s pension and postretirement benefit plans can be sensitive to changes in
the discount rate, it is expected that a 25 basis point rate reduction would not have a material
impact on the U.S. plan expenses for 2006. This change would increase the U.K. pension plan expense
for 2006 by approximately $4 million. Also, such a change would increase the U.S. and U.K. plan
obligations at September 30, 2005 by $65 million and $51 million, respectively. A 25 basis point
decline in the expected rate of return for the U.S. pension plan and the U.K. pension plan would
result in an expense increase for 2006 of approximately $6 million and $2 million, respectively.
The assumed health care cost trend rate has a significant effect on the amounts reported for the
postretirement health care plans. A one-percent change in the assumed health care cost trend rate
would have the following effects:
| |
|
|
|
|
|
|
|
|
|
|
|
|
|
|
|
|
| |
|
1% Increase |
|
|
1% Decrease |
|
| (dollars in millions) |
2005 |
|
2004 |
|
2005 |
|
2004 |
|
| |
Effect on: |
|
|
|
|
|
|
|
|
|
|
|
|
|
|
|
|
Other postretirement benefits cost |
|
$ |
10 |
|
|
$ |
8 |
|
|
$ |
(8 |
) |
|
$ |
(7 |
) |
Accumulated benefit obligation |
|
|
44 |
|
|
|
94 |
|
|
|
(37 |
) |
|
|
(75 |
) |
| |
Investment Strategy and Asset Allocation
The U.S. terminated pension plan asset portfolio is structured such that the asset maturities
match the duration of the plan’s obligations. Consistent with the plan termination in 1988, the
annuity contract and the supplemental agreement, the asset portfolio’s investment objective calls
for a concentration in fixed income securities, the majority of which have an investment grade
rating.
The assets of the U.K. pension plan are invested prudently so that the benefits promised to members
are provided, having regard to the nature and the duration of the plan’s liabilities. The current
planned investment strategy was set following an asset-liability study and advice from the
Trustees’ investment advisors. The asset allocation strategy selected is designed to achieve a
higher return than the lowest risk strategy while maintaining a prudent approach to meeting the
plan’s liabilities. For the U.K. pension plan, the target asset allocation is 80% equity, 15% debt,
and 5% real estate.
The pension plan weighted-average asset allocations at September 30, 2005 and September 30, 2004,
by asset category are presented in the table below. The actual asset allocations are consistent
with their respective targets. The Merrill Lynch postretirement benefit plans are not funded and do
not hold assets for investment.
| |
|
|
|
|
|
|
|
|
|
|
|
|
|
|
|
|
| |
|
Defined Benefit Pension Plans |
|
| |
|
U.S. Plans |
|
|
Non-U.S. Plans |
|
| |
|
2005 |
|
|
2004 |
|
|
2005 |
|
|
2004 |
|
| |
Debt securities |
|
|
100 |
% |
|
|
100 |
% |
|
|
22 |
% |
|
|
23 |
% |
Equity securities |
|
|
– |
|
|
|
– |
|
|
|
71 |
|
|
|
70 |
|
Real estate |
|
|
– |
|
|
|
– |
|
|
|
4 |
|
|
|
4 |
|
Other |
|
|
– |
|
|
|
– |
|
|
|
3 |
|
|
|
3 |
|
| |
|
|
Total |
|
|
100 |
% |
|
|
100 |
% |
|
|
100 |
% |
|
|
100 |
% |
| |
Estimated Future Benefit Payments
Expected benefit payments associated with Merrill Lynch’s defined benefit pension and
postretirement plans for the next five years and in aggregate for the five years thereafter are as
follows:
| |
|
|
|
|
|
|
|
|
|
|
|
|
|
|
|
|
|
|
|
|
|
|
|
|
| |
|
Defined Benefit Pension Plans |
|
Postretirement Plans(3) |
|
| |
|
|
|
|
|
|
|
|
|
|
|
|
Gross |
|
Medicare |
|
Net |
|
| (dollars in millions) |
U.S. |
(1) |
Non-U.S. |
(2) |
Total |
|
Payments |
|
Subsidy |
|
Payments |
|
| |
2006 |
|
$ |
98 |
|
|
$ |
34 |
|
|
$ |
132 |
|
|
$ |
20 |
|
|
$ |
2 |
|
|
$ |
18 |
|
2007 |
|
|
130 |
|
|
|
35 |
|
|
|
165 |
|
|
|
22 |
|
|
|
3 |
|
|
|
19 |
|
2008 |
|
|
104 |
|
|
|
36 |
|
|
|
140 |
|
|
|
24 |
|
|
|
4 |
|
|
|
20 |
|
2009 |
|
|
107 |
|
|
|
38 |
|
|
|
145 |
|
|
|
27 |
|
|
|
5 |
|
|
|
22 |
|
2010 |
|
|
110 |
|
|
|
40 |
|
|
|
150 |
|
|
|
29 |
|
|
|
5 |
|
|
|
24 |
|
2011 through 2015 |
|
|
591 |
|
|
|
229 |
|
|
|
820 |
|
|
|
166 |
|
|
|
35 |
|
|
|
131 |
|
| |
|
|
|
| (1) |
|
The U.S. defined benefit pension plan payments are funded under the terminated plan annuity
contract. |
| (2) |
|
The U.K., Japan and Swiss pension plan payments represent about 56%, 16% and 11%, respectively,
of the non-U.S. 2006 expected defined benefit pension payments. |
| (3) |
|
The U.S. postretirement plan payments, including the Medicare subsidy, represent approximately
95% of the total expected postretirement benefit payments. |
Postemployment Benefits
Merrill Lynch provides certain postemployment benefits for employees on extended leave due to
injury or illness and for terminated employees. Employees who are disabled due to non-work-related
illness or injury are entitled to disability income, medical coverage, and life insurance. Merrill
Lynch also provides severance benefits to terminated employees. In addition, Merrill Lynch is
mandated by U.S. state and federal regulations to provide certain other postemployment benefits.
Merrill Lynch funds these benefits through a combination of self-insured and insured plans.
Merrill Lynch recognized $226 million, $165 million, and $343 million in 2005, 2004, and 2003,
respectively, of postemployment benefits expense, which included severance costs for terminated
employees of $225 million, $134 million, and $311 million in 2005, 2004, and 2003, respectively.
|
|
|
| NOTE 14
|
|
Employee Incentive Plans |
To align the interests of employees with those of stockholders, Merrill Lynch sponsors several
employee compensation plans that provide eligible employees with stock or options to purchase
stock. The total pre-tax compensation cost recognized in earnings for stock-based compensation
plans for 2005, 2004, and 2003 was $1,011 million, $883 million, and $1,004 million, respectively,
which includes the impact of accelerated amortization for terminated employees. Merrill Lynch also
sponsors deferred cash compensation plans and award programs for eligible employees.
Long-Term Incentive Compensation Plans (“LTIC Plans”), Employee Stock Compensation
Plan (“ESCP”) and Equity Capital Accumulation Plan (“ECAP”)
LTIC Plans, ESCP and ECAP provide for grants of equity and equity-related instruments to
certain employees. LTIC Plans consist of the Long-Term Incentive Compensation Plan, a shareholder
approved plan used for grants to executive officers, and the Long-Term Incentive Compensation Plan
for Managers and Producers, a broad-based plan which was approved by the Board of Directors, but
has not been shareholder approved. LTIC Plans provide for the issuance of Restricted Shares,
Restricted Units, and Non-qualified Stock Options, as well as Incentive Stock Options, Performance
Shares, Performance Units, Performance Options, Stock Appreciation Rights, and other securities of
Merrill Lynch. ESCP, a broad-based plan approved by shareholders in 2003, provides for the issuance
of Restricted Shares, Restricted Units, Non-qualified Stock Options and Stock Appreciation Rights.
ECAP, a shareholder-approved
118
Merrill Lynch 2005 Annual Report
plan, provides for the issuance of Restricted Shares, as well as Performance Shares. All plans
under LTIC, ESCP and ECAP may be satisfied using either treasury or newly issued shares. As of
December 30, 2005, no instruments other than Restricted Shares, Restricted Units, Non-qualified
Stock Options, Performance Options and Stock Appreciation Rights had been granted. Stock-settled
Stock Appreciation Rights, which were first granted in 2004, were substantially all converted to
Non-qualified Stock Options by December 31, 2004.
Restricted Shares and Units
Restricted Shares are shares of ML & Co. common stock carrying voting and dividend rights. A
Restricted Unit is deemed equivalent in fair market value to one share of common stock.
Substantially all awards are settled in shares of common stock. Recipients of Restricted Unit
awards receive cash payments equivalent to dividends. Under these plans, such shares and units are
restricted from sale, transfer, or assignment until the end of the restricted period. Such shares
and units are subject to forfeiture during the vesting period, for grants under LTIC Plans, or the
restricted period for grants under ECAP. Restricted share and unit grants made prior to 2003
generally cliff vest in three years. Restricted share and unit grants made in 2003 through 2005
generally cliff vest in four years.
The activity for Restricted Shares and Units under these plans during 2005 and 2004 follows:
| |
|
|
|
|
|
|
|
|
|
|
|
|
|
|
|
|
|
|
|
|
| |
|
LTIC Plans |
|
|
ECAP |
|
|
ESCP |
|
| |
|
Restricted Shares |
|
|
Restricted Units |
|
|
Restricted Shares |
|
|
Restricted Shares |
|
|
Restricted Units |
|
| |
Authorized for issuance at: |
|
|
|
|
|
|
|
|
|
|
|
|
|
|
|
|
|
|
|
|
December 30, 2005 |
|
|
660,000,000 |
|
|
|
N/A |
|
|
|
104,800,000 |
|
|
|
75,000,000 |
|
|
|
N/A |
|
December 31, 2004 |
|
|
660,000,000 |
|
|
|
N/A |
|
|
|
104,800,000 |
|
|
|
75,000,000 |
|
|
|
N/A |
|
| |
|
|
Available for issuance at:(1)
|
|
|
|
|
|
|
|
|
|
|
|
|
|
|
|
|
|
|
|
|
December 30, 2005 |
|
|
65,412,219 |
|
|
|
N/A |
|
|
|
10,832,121 |
|
|
|
57,158,319 |
|
|
|
N/A |
|
December 31, 2004 |
|
|
63,887,054 |
|
|
|
N/A |
|
|
|
10,835,952 |
|
|
|
75,000,000 |
|
|
|
N/A |
|
| |
|
|
Outstanding, end of 2003 |
|
|
33,828,628 |
|
|
|
7,220,455 |
|
|
|
39,059 |
|
|
|
– |
|
|
|
– |
|
Granted — 2004 |
|
|
12,280,362 |
|
|
|
2,664,393 |
|
|
|
7,851 |
|
|
|
– |
|
|
|
– |
|
Paid, forfeited, or released from
contingencies |
|
|
(10,735,085 |
) |
|
|
(3,152,272 |
) |
|
|
(14,622 |
) |
|
|
– |
|
|
|
– |
|
| |
|
|
Outstanding, end of 2004 |
|
|
35,373,905 |
|
|
|
6,732,576 |
|
|
|
32,288 |
|
|
|
– |
|
|
|
– |
|
Granted — 2005 |
|
|
3,816,323 |
|
|
|
970,647 |
|
|
|
8,244 |
|
|
|
16,240,185 |
|
|
|
2,340,815 |
|
Paid, forfeited, or released from
contingencies |
|
|
(10,222,689 |
) |
|
|
(2,982,677 |
) |
|
|
(19,676 |
) |
|
|
(556,398 |
) |
|
|
(182,921 |
) |
| |
|
|
Outstanding, end of 2005(2) |
|
|
28,967,539 |
|
|
|
4,720,546 |
|
|
|
20,856 |
|
|
|
15,683,787 |
|
|
|
2,157,894 |
|
| |
|
|
|
N/A=Not Applicable |
| (1) |
|
Includes shares reserved for issuance upon the exercise of stock options. |
| (2) |
|
In January 2006, 16,754,497 Restricted Shares and 3,418,576 Restricted Units were granted from
ESCP and LTIC plans to eligible employees. These awards generally vest in 25% increments over 4
years. In addition, 2,905,688 participation units were granted from the Long-Term Incentive
Compensation Plan under Merrill Lynch’s Managing Partners Incentive Program. The awards granted
under this program are fully at risk, and the potential payout can vary depending on Merrill
Lynch’s financial performance against specified return on average common stockholders’ equity
(“ROE”) targets. One-third of the Participation Units shall convert into Restricted Shares on each
of January 31, 2007, January 31, 2008 and January 31, 2009 (each a “Conversion Date”), based on ROE
determined for the most recently completed fiscal year. Participation Units converted on the
Conversion Date will cease to be outstanding immediately following conversion. If the minimum
target is not met, the participation units will expire without being converted. |
The weighted-average fair value per share or unit for 2005, 2004, and 2003 grants follows:
| |
|
|
|
|
|
|
|
|
|
|
|
|
| |
|
2005 |
|
|
2004 |
|
|
2003 |
|
| |
LTIC Plans |
|
|
|
|
|
|
|
|
|
|
|
|
Restricted Shares |
|
$ |
58.70 |
|
|
$ |
59.10 |
|
|
$ |
36.69 |
|
Restricted Units |
|
|
58.60 |
|
|
|
54.38 |
|
|
|
37.18 |
|
ECAP Restricted Shares |
|
|
60.37 |
|
|
|
58.30 |
|
|
|
53.65 |
|
ESCP Plans |
|
|
|
|
|
|
|
|
|
|
|
|
Restricted Shares |
|
|
57.01 |
|
|
|
– |
|
|
|
– |
|
Restricted Units |
|
|
57.01 |
|
|
|
– |
|
|
|
– |
|
| |
Non-Qualified Stock Options
Non-qualified Stock Options granted under LTIC Plans in 1996 through 2000 generally became
exercisable over five years; options granted in 2001 and 2002 became exercisable after
approximately six months. Option and Stock Appreciation Right grants made after 2002 generally
become exercisable over four years. The exercise price of these grants is equal to 100% of the fair
market value (as defined in LTIC Plans) of a share of ML & Co. common stock on the date of grant.
Options and Stock Appreciation Rights expire ten years after their grant date.
In December 2004, 8,141,369 Stock Appreciation Rights which were granted in January 2004 were
converted to Non-qualified Stock Options; no change was made to the remaining vesting periods or
exercise price. A total of 344,627 Stock Appreciation Rights remained outstanding at December 30,
2005.
The activity for Non-qualified Stock Options under LTIC Plans for 2005, 2004, and 2003 follows:
| |
|
|
|
|
|
|
|
|
| |
|
Options |
|
|
Weighted-Average |
|
| |
|
Outstanding |
|
|
Exercise Price |
|
| |
Outstanding, beginning of 2003 |
|
|
221,888,144 |
|
|
|
$ 42.07 |
|
Granted — 2003 |
|
|
23,188,910 |
|
|
|
36.15 |
|
Exercised |
|
|
(26,988,687 |
) |
|
|
20.41 |
|
Forfeited |
|
|
(1,943,844 |
) |
|
|
36.70 |
|
| |
|
|
Outstanding, end of 2003 |
|
|
216,144,523 |
|
|
|
44.20 |
|
Granted — 2004 |
|
|
9,842,371 |
|
|
|
59.85 |
|
Exercised |
|
|
(20,429,175 |
) |
|
|
27.10 |
|
Forfeited |
|
|
(1,434,287 |
) |
|
|
46.88 |
|
| |
|
|
Outstanding, end of 2004 |
|
|
204,123,432 |
|
|
|
46.64 |
|
Granted — 2005 |
|
|
681,622 |
|
|
|
58.13 |
|
Exercised |
|
|
(26,849,096 |
) |
|
|
30.91 |
|
Forfeited |
|
|
(1,242,883 |
) |
|
|
43.48 |
|
| |
|
|
Outstanding, end of 2005(1) |
|
|
176,713,075 |
|
|
|
49.10 |
|
| |
|
|
|
| (1) |
|
In January 2006, 333,155 Non-qualified Stock Options were granted to eligible employees. |
At year-end 2005, 2004, and 2003, options exercisable under LTIC Plans were 156,950,106,
169,975,049, and 176,168,602, respectively. The weighted-average exercise price of exercisable
options was $49.55, $47.05, and $45.35, per option, at year-end 2005, 2004, and 2003, respectively.
The table below summarizes information related to outstanding and exercisable options at year-end
2005:
| |
|
|
|
|
|
|
|
|
|
|
|
|
|
|
|
|
|
|
|
|
| |
|
Options Outstanding |
|
|
Options Exercisable |
|
| |
|
|
|
|
Weighted- |
|
|
Weighted- |
|
|
|
|
|
Weighted- |
|
| |
|
|
|
|
Average |
|
|
Average |
|
|
|
|
|
Average |
|
| |
|
Number |
|
Exercise |
|
|
Remaining |
|
|
Number |
|
Exercise |
|
| Exercise Price |
|
Outstanding |
|
Price |
|
|
Life (Years) |
(1) |
|
Exercisable |
|
Price |
|
| |
$8.00 – $31.99 |
|
|
19,697,919 |
|
|
$ |
24.86 |
|
|
|
1.44 |
|
|
|
19,697,919 |
|
|
$ |
24.86 |
|
$32.00 – $37.99 |
|
|
47,070,346 |
|
|
|
36.15 |
|
|
|
4.71 |
|
|
|
35,249,989 |
|
|
|
36.14 |
|
$38.00 – $50.99 |
|
|
27,186,237 |
|
|
|
43.67 |
|
|
|
4.12 |
|
|
|
26,913,217 |
|
|
|
43.71 |
|
$51.00 – $60.99 |
|
|
49,384,804 |
|
|
|
54.91 |
|
|
|
6.42 |
|
|
|
41,988,889 |
|
|
|
54.07 |
|
$61.00 – $77.99 |
|
|
33,373,769 |
|
|
|
77.50 |
|
|
|
5.07 |
|
|
|
33,100,092 |
|
|
|
77.56 |
|
| |
|
|
|
| (1) |
|
Based on original contractual life of ten years. |
The weighted-average fair value of options granted in 2005, 2004, and 2003 was $18.04, $20.46,
and $13.55, per option, respectively. Fair value is estimated as of the grant date based on a
Black-Scholes option pricing model using the following weighted-average assumptions:
| |
|
|
|
|
|
|
|
|
|
|
|
|
| |
|
2005 |
|
|
2004 |
|
|
2003 |
|
| |
Risk-free interest rate |
|
|
3.80 |
% |
|
|
3.27 |
% |
|
|
2.86 |
% |
Expected life |
|
4.6 yrs. |
|
5.0 yrs. |
|
5.0 yrs. |
Expected volatility |
|
|
35.31 |
% |
|
|
37.36 |
% |
|
|
46.41 |
% |
Dividend yield |
|
|
1.14 |
% |
|
|
1.07 |
% |
|
|
1.77 |
% |
| |
Employee Stock Purchase Plans (“ESPP”)
The ESPP, which is shareholder approved, allows eligible employees to invest from 1% to 10% of
their eligible compensation to purchase ML & Co. common stock, subject to legal limits. For 2005
the maximum annual purchase was $23,750. Prior to 2005, the maximum annual purchase was $21,250.
Beginning January 15, 2005, purchases were made at a discount equal to 5% of the average high and
low market price on the relevant investment date. Purchases for the 2004 plan year were made
without a discount. Prior to the 2004 plan year purchases were made with a discount generally equal
to 15% of the average high and low market price on the relevant investment date. Up to 125,000,000
shares of common stock have been authorized for issuance under ESPP. The activity in ESPP during
2005, 2004, and 2003 follows:
120
Merrill Lynch 2005 Annual Report
| |
|
|
|
|
|
|
|
|
|
|
|
|
| |
|
2005 |
|
|
2004 |
|
|
2003 |
|
| |
Available, beginning of year |
|
|
24,356,952 |
|
|
|
24,931,909 |
|
|
|
26,918,962 |
|
Purchased through plan |
|
|
(894,517 |
) |
|
|
(574,957 |
) |
|
|
(1,987,053 |
) |
| |
|
|
Available, end of year |
|
|
23,462,435 |
|
|
|
24,356,952 |
|
|
|
24,931,909 |
|
| |
The weighted-average fair value of ESPP stock purchase rights exercised by employees in 2005,
2004, and 2003 was $2.67, $3.95, and $6.69 per right, respectively.
Director Plans
Merrill Lynch provides stock based compensation to its non-employee directors under the Merrill
Lynch & Co., Inc. Deferred Stock Unit Plan for Non-Employee Directors, which was approved by
shareholders in 2005 (“New Directors Plan”) and the Deferred Stock Unit and Stock Option Plan for
Non-Employee Directors (“Old Directors Plan”) which was adopted by the Board of Directors in 1996
and discontinued after stockholders approved the New Directors Plan. In 2005, shareholders
authorized Merrill Lynch to issue 500,000 shares under the New Directors Plan and also authorized
adding all shares that remained available for issuance under the Old Directors Plan to shares
available under the New Directors Plan for a total of approximately 1 million shares.
Under both plans, non-employee directors received deferred stock units, payable in shares of ML &
Co. common stock after a deferral period of five years. Under the Old Directors Plan, 41,558 and
48,706 deferred stock units were outstanding at year-end 2005 and 2004, respectively. Under the New
Directors Plan, 34,306 deferred stock units remained outstanding at year-end 2005.
Additionally, the Old Directors Plan provided for the grant of stock options which the New
Directors Plan eliminated. There were approximately 142,117 and 152,571 stock options outstanding
under the Old Directors Plan at year-end 2005 and 2004, respectively.
Book Value Plan
Merrill Lynch also has instruments representing the right to receive approximately 1.6 million
shares under Merrill Lynch’s Investor Equity Purchase Plan (“Book Value Plan”). Issuances under the
Book Value Plan were discontinued in 1995 and the authorization under the plan is limited to the
1.6 million shares.
Financial Advisor Capital Accumulation Award Plans (“FACAAP”)
Under FACAAP, eligible employees in GPC are granted awards generally based upon their prior
year’s performance. Payment for an award is contingent upon continued employment for a period of
time and is subject to forfeiture during that period. Awards granted in 2003 and thereafter are
generally payable eight years from the date of grant in a fixed number of shares of ML & Co. common
stock. For outstanding awards granted prior to 2003, payment is generally made ten years from the
date of grant in a fixed number of shares of ML & Co. common stock unless the fair market value of
such shares is less than a specified minimum value, in which case the minimum value is paid in
cash. Eligible participants may defer awards beyond the scheduled payment date. Only shares of
common stock held as treasury stock may be issued under FACAAP. FACAAP, which was approved by the
Board of Directors, has not been shareholder approved.
At December 30, 2005, shares subject to outstanding awards totaled 37,250,319 while 18,301,782
shares were available for issuance through future awards. The weighted-average fair value of awards
granted under FACAAP during 2005, 2004, and 2003 was $59.92, $57.73, and $38.78 per award,
respectively.
Other Compensation Arrangements
Merrill Lynch sponsors deferred compensation plans in which employees who meet certain minimum
compensation thresholds may participate on either a voluntary or mandatory basis. Contributions to
the plans are made on a tax-deferred basis by participants. Participants’ returns on these
contributions may be indexed to various Merrill Lynch mutual funds and other funds, including
certain company-sponsored investment vehicles that qualify as employee securities companies.
Merrill Lynch also sponsors several cash-based employee award programs, under which certain
employees are eligible to receive future cash compensation, generally upon fulfillment of the
service and vesting criteria for the particular program.
When appropriate, Merrill Lynch maintains various assets as an economic hedge of its liabilities to
participants under the deferred compensation plans and award programs. These assets and the
payables accrued by Merrill Lynch under the various plans and grants are included on the
Consolidated Balance Sheets. Such assets totaled $2.5 billion and $2.1 billion, at December 30,
2005 and December 31, 2004, respectively. Accrued liabilities at year-end 2005 and 2004 were $2.0
billion and $1.7 billion, respectively. Changes to deferred compensation liabilities and
corresponding returns on the assets that economically hedge these liabilities are recorded within
Compensation and benefits expense on the Consolidated Statements of Earnings.
Income tax provisions (benefits) on earnings consisted of:
| |
|
|
|
|
|
|
|
|
|
|
|
|
| (dollars in millions) |
|
2005 |
|
|
2004 |
|
|
2003 |
|
| |
U.S. federal |
|
|
|
|
|
|
|
|
|
|
|
|
Current |
|
$ |
1,016 |
|
|
$ |
861 |
|
|
$ |
821 |
|
Deferred |
|
|
261 |
|
|
|
152 |
|
|
|
285 |
|
U.S. state and local |
|
|
|
|
|
|
|
|
|
|
|
|
Current |
|
|
50 |
|
|
|
73 |
|
|
|
5 |
|
Deferred |
|
|
(43 |
) |
|
|
(39 |
) |
|
|
48 |
|
Non-U.S. |
|
|
|
|
|
|
|
|
|
|
|
|
Current |
|
|
817 |
|
|
|
464 |
|
|
|
197 |
|
Deferred |
|
|
14 |
|
|
|
(111 |
) |
|
|
28 |
|
| |
|
|
Total |
|
$ |
2,115 |
|
|
$ |
1,400 |
|
|
$ |
1,384 |
|
| |
The corporate statutory U.S. federal tax rate was 35% for the three years presented. A
reconciliation of statutory U.S. federal income taxes to Merrill Lynch’s income tax provisions for
earnings follows:
| |
|
|
|
|
|
|
|
|
|
|
|
|
| (dollars in millions) |
|
2005 |
|
|
2004 |
|
|
2003 |
|
| |
U.S. federal income tax at statutory rate |
|
$ |
2,531 |
|
|
$ |
2,043 |
|
|
$ |
1,826 |
|
U.S. state and local income taxes, net |
|
|
4 |
|
|
|
22 |
|
|
|
34 |
|
Non-U.S. operations |
|
|
(155 |
) |
|
|
(204 |
) |
|
|
(232 |
) |
Tax-exempt interest |
|
|
(175 |
) |
|
|
(160 |
) |
|
|
(148 |
) |
Dividends received deduction |
|
|
(62 |
) |
|
|
(42 |
) |
|
|
(17 |
) |
Valuation allowance(1) |
|
|
– |
|
|
|
(281 |
) |
|
|
(66 |
) |
Other |
|
|
(28 |
) |
|
|
22 |
|
|
|
(13 |
) |
| |
|
|
Income tax expense |
|
$ |
2,115 |
|
|
$ |
1,400 |
|
|
$ |
1,384 |
|
| |
|
|
|
| (1) |
|
2004 amount reflects the reversal and utilization of the Japan valuation allowance. |
The 2005, 2004 and 2003 effective tax rates reflect net benefits (expenses) of $156 million,
$(33) million, and $220 million, respectively, related to changes in estimates for prior years, and
settlements with various tax authorities. The 2005 tax rate also included $97 million of tax
expense ($113 million tax expense recorded in the fourth quarter less $16 million tax benefit
recorded in the second quarter) associated with the foreign earnings repatriation of $1.8
billion.
Deferred income taxes are provided for the effects of temporary differences between the tax basis
of an asset or liability and its reported amount in the Consolidated Balance Sheets. These
temporary differences result in taxable or deductible amounts in future years. Details of Merrill
Lynch’s deferred tax assets and liabilities follow:
| |
|
|
|
|
|
|
|
|
|
|
|
|
| (dollars in millions) |
|
2005 |
|
|
2004 |
|
|
2003 |
|
| |
Deferred tax assets |
|
|
|
|
|
|
|
|
|
|
|
|
Deferred compensation |
|
$ |
1,379 |
|
|
$ |
1,360 |
|
|
$ |
1,412 |
|
Stock options |
|
|
1,219 |
|
|
|
1,298 |
|
|
|
1,255 |
|
Valuation and other reserves |
|
|
991 |
|
|
|
986 |
|
|
|
769 |
|
Employee benefits and pension |
|
|
508 |
|
|
|
477 |
|
|
|
163 |
|
Foreign exchange translation |
|
|
352 |
|
|
|
285 |
|
|
|
113 |
|
Deferred interest |
|
|
240 |
|
|
|
250 |
|
|
|
318 |
|
Net operating loss carryforwards |
|
|
120 |
|
|
|
292 |
|
|
|
431 |
|
Partnership activity |
|
|
72 |
|
|
|
166 |
|
|
|
123 |
|
Restructuring related |
|
|
48 |
|
|
|
79 |
|
|
|
140 |
|
Other |
|
|
268 |
|
|
|
450 |
|
|
|
836 |
|
| |
|
|
Gross deferred tax assets |
|
|
5,197 |
|
|
|
5,643 |
|
|
|
5,560 |
|
Valuation allowances |
|
|
(44 |
) |
|
|
(66 |
) |
|
|
(315 |
) |
| |
|
|
Total deferred tax assets |
|
|
5,153 |
|
|
|
5,577 |
|
|
|
5,245 |
|
| |
|
|
Deferred tax liabilities |
|
|
|
|
|
|
|
|
|
|
|
|
Goodwill |
|
|
539 |
|
|
|
613 |
|
|
|
423 |
|
Deferred income |
|
|
276 |
|
|
|
331 |
|
|
|
294 |
|
Interest and dividends |
|
|
221 |
|
|
|
85 |
|
|
|
269 |
|
Depreciation and amortization |
|
|
186 |
|
|
|
161 |
|
|
|
99 |
|
Deferred acquisition costs |
|
|
157 |
|
|
|
181 |
|
|
|
171 |
|
Other |
|
|
199 |
|
|
|
380 |
|
|
|
243 |
|
| |
|
|
Total deferred tax liabilities |
|
|
1,578 |
|
|
|
1,751 |
|
|
|
1,499 |
|
| |
|
|
Net deferred tax assets |
|
$ |
3,575 |
|
|
$ |
3,826 |
|
|
$ |
3,746 |
|
| |
122
Merrill Lynch 2005 Annual Report
At December 30, 2005, Merrill Lynch had U.S. net operating loss carryforwards of approximately
$1,363 million and non-U.S. net operating loss carryforwards of $133 million. The U.S. amounts are
primarily state carryforwards expiring in various years after 2006. The non-U.S. amounts are
primarily United Kingdom and Canada carryforwards. Merrill Lynch also had approximately $81 million
of state tax credit carryforwards expiring in various years after 2006.
Merrill Lynch is under examination by the Internal Revenue Service (“IRS”) and other tax
authorities in major countries such as Japan and the United Kingdom, and states in which Merrill
Lynch has significant business operations, such as New York. The tax years under examination vary
by jurisdiction. An IRS examination covering the years 2001-2003 is expected to be completed in
2006. There are carryback claims from these years of approximately $250 million
to $300 million, which will undergo Joint Committee review. A tax benefit would be
recorded to the extent that Merrill Lynch is successful in obtaining the tax benefit from these
carryback claims. IRS audits have also commenced for the 2004 and 2005 tax years. In the second
quarter of 2005, Merrill Lynch paid a tax assessment from the Tokyo Regional Tax Bureau for the
years 1998-2002. The assessment reflected the Japanese tax authority’s view that certain income on
which Merrill Lynch previously paid income tax to other international jurisdictions, primarily the
United States, should have been allocated to Japan. Merrill Lynch is taking steps to file a request
for reinvestigation of this assessment, including seeking clarification from international
authorities on the appropriate allocation of income among multiple jurisdictions to prevent double
taxation. Merrill Lynch regularly assesses the likelihood of additional assessments in each of the
tax jurisdictions resulting from these examinations. Tax reserves have been established, which
Merrill Lynch believes to be adequate in relation to the potential for additional assessments.
However, there is a reasonable possibility that additional amounts may be incurred. The estimated
additional possible amounts are no more than $150 million. Merrill Lynch will adjust the level of
reserves when there is more information available, or when an event occurs requiring a change to
the reserves. The reassessment of tax reserves could have a material impact on Merrill Lynch’s
effective tax rate in the period in which it occurs.
Income tax benefits of $317 million, $248 million, and $370 million were allocated to stockholders’
equity related to employee stock compensation transactions for 2005, 2004, and 2003, respectively.
Cumulative undistributed earnings of non-U.S. subsidiaries were approximately $7.7 billion at
December 30, 2005. No deferred U.S. federal income taxes have been provided for the undistributed
earnings to the extent that they are permanently reinvested in Merrill Lynch’s non-U.S. operations.
It is not practical to determine the amount of additional tax that may be payable in the event
these earnings are repatriated. See Note 1 to the Consolidated Financial Statements, New Accounting
Pronouncements, for further information.
|
|
|
| NOTE 16
|
|
Regulatory Requirements and Dividend Restrictions |
Effective January 1, 2005, Merrill Lynch became a Consolidated Supervised Entity (“CSE”) as
defined by the SEC. As a CSE, Merrill Lynch is subject to group-wide supervision, which requires
Merrill Lynch to compute allowable capital and risk allowances on a consolidated basis.
Certain U.S. and non-U.S. subsidiaries are subject to various securities, banking, and insurance
regulations and capital adequacy requirements promulgated by the regulatory and exchange
authorities of the countries in which they operate. These regulatory restrictions may impose
regulatory capital requirements and limit the amounts that these subsidiaries can pay in dividends
or advance to Merrill Lynch. Merrill Lynch’s principal regulated subsidiaries are discussed below.
Securities Regulation
As a registered broker-dealer and futures commission merchant, MLPF&S is subject to the net
capital requirements of Rule 15c3-1 under the Securities Exchange Act of 1934 (“the Rule”). Under
the alternative method permitted by the Rule, the minimum required net capital, as defined, shall
be the greater of 2% of aggregate debit items (“ADI”) arising from customer transactions or $500
million. On December 23, 2004, the SEC approved MLPF&S’s use of the new Appendix E of Rule 15c3-1.
The new Appendix was created pursuant to SEC rule amendments adopted on June 8, 2004. As a
condition for this approval, Merrill Lynch consented to group-wide supervision by the SEC. The Rule
amendments are intended to reduce regulatory capital costs for broker-dealers by allowing very
highly capitalized firms that have comprehensive internal controls and risk management practices in
place to use their mathematical risk models to calculate certain regulatory capital deductions. As
a result, beginning as of January 3, 2005, MLPF&S computed certain net capital deductions under the
SEC Rule amendments. At December 30, 2005, MLPF&S’s regulatory net capital of $3,805 million was
approximately 25.4% of ADI, and its regulatory net capital in excess of the minimum required was
$3,301 million.
MLPF&S is also subject to the capital requirements of the CFTC, which requires that minimum net
capital should not be less than 8% of the total customer risk margin requirement plus 4% of the
total non-customer risk margin requirement. MLPF&S substantially exceeds both standards.
MLPF&S has reduced and expects to reduce further, subject to regulatory approval, its excess net
capital so as to realize the benefits of the Rule amendments. On March 31, 2005, MLPF&S, with the
approval of the SEC and The New York Stock Exchange, Inc. (“NYSE”), made a payment of $2.0 billion
to its parent company, ML & Co., consisting of a $1.2 billion dividend and a subordinated debt
repayment of $800 million. In addition, on December 6, 2005, after receiving the required
approvals, MLPF&S paid a $500 million dividend to ML & Co.
MLI, a U.K. regulated investment firm, is subject to capital requirements of the FSA. Financial
resources, as defined, must exceed the total financial resources requirement of the FSA. At
December 30, 2005, MLI’s financial resources were $9,234 million, exceeding the minimum requirement
by $1,572 million.
MLGSI, a primary dealer in U.S. Government securities, is subject to the capital adequacy
requirements of the Government Securities Act of 1986. This rule requires dealers to maintain
liquid capital in excess of market and credit risk, as defined, by 20% (a 1.2-to-1 capital-to-risk
standard). At December 30, 2005, MLGSI’s liquid capital of $1,987 million was 311% of its total
market and credit risk, and liquid capital in excess of the minimum required was $1,219 million.
MLJS, a Japan-based regulated broker-dealer, is subject to capital requirements of the Japanese
Financial Services Agency (“JFSA”). Net capital, as defined, must exceed 120% of the total risk
equivalents requirement of the JFSA. At December 30, 2005, MLJS’s net capital was $1,040 million,
exceeding the minimum requirement by $536 million.
Banking Regulation
MLBUSA is a Utah-chartered industrial bank, regulated by the FDIC and the State of Utah
Department of Financial Institutions (“UTDFI”). MLB&T is a New Jersey-chartered state bank
regulated by the FDIC and the New Jersey Department of Banking and Insurance (“NJDBI”). Both MLBUSA
and MLB&T are required to maintain capital levels that at least equal minimum capital levels
specified in federal banking laws and regulations. Failure to meet the minimum levels will result
in certain mandatory, and possibly additional discretionary, actions by the regulators that, if
undertaken, could have a direct material effect on the banks. The following table illustrates the
actual capital ratios and capital amounts for MLBUSA and MLB&T as of December 30, 2005.
| |
|
|
|
|
|
|
|
|
|
|
|
|
|
|
|
|
|
|
|
|
|
|
Well |
|
|
MLBUSA |
|
|
MLB&T |
|
| |
|
Capitalized |
|
|
Actual |
|
|
Actual |
|
|
Actual |
|
Actual |
|
| (dollars in millions) |
|
Minimum |
|
|
Ratio |
|
|
Amount |
|
|
Ratio |
|
Amount |
|
| |
Tier 1 leverage (to average assets) |
|
|
5 |
% |
|
|
9.46 |
% |
|
$ |
5,733 |
|
|
|
7.47 |
% |
|
$ |
764 |
|
Tier 1 capital (to risk-weighted assets) |
|
|
6 |
% |
|
|
9.95 |
|
|
|
5,733 |
|
|
|
18.21 |
|
|
|
764 |
|
Total capital (to risk-weighted assets) |
|
|
10 |
% |
|
|
11.07 |
|
|
|
6,376 |
|
|
|
18.32 |
|
|
|
768 |
|
| |
MLCMBL, an Ireland-based regulated bank, is subject to the capital requirements of the
Financial Regulator, as well as to those of the State of New York Banking Department (“NYSBD”), as
the consolidated supervisor of its indirect parent, Merrill Lynch International Finance Corporation
(“MLIFC”). MLCMBL is required to meet minimum regulatory capital requirements under the European
Union (“EU”) banking law as implemented in Ireland by the Financial Regulator. At December 30,
2005, MLCMBL’s capital ratio was above the minimum requirement at 8.81% and its financial
resources, as defined, were $3,032 million, exceeding the minimum requirement by $1,027 million.
MLIB, a U.K.-based regulated bank, is subject to the capital requirements of the FSA as well as
those of the NYSBD as part of the MLIFC group. MLIB is required to meet minimum regulatory capital
requirements under the EU banking law as implemented in the U.K. MLIB’s consolidated capital ratio
(including its subsidiary Merrill Lynch Bank (Suisse) S.A.), is above the minimum capital
requirements established by the FSA. At December 30, 2005, MLIB’s consolidated capital ratio was
12.5% and its consolidated financial resources were $3,298 million, exceeding the minimum
requirement by $593 million.
124
Merrill Lynch 2005 Annual Report
Insurance Regulation
Merrill Lynch’s insurance subsidiaries are subject to various regulatory restrictions and at
December 30, 2005, $763 million, representing 80% of the insurance subsidiaries’ net assets, was
unavailable for distribution to Merrill Lynch.
Other
Approximately 60 other subsidiaries are subject to regulatory and other requirements of the
jurisdictions in which they operate. At December 30, 2005, restricted net assets of these
subsidiaries were $1.8 billion.
With the exception of regulatory restrictions on subsidiaries’ abilities to pay dividends, there
are no restrictions on ML & Co.’s present ability to pay dividends on common stock, other than ML &
Co.’s obligation to make payments on its preferred stock and TOPrSSM, and the governing
provisions of the Delaware General Corporation Law.
Acquisitions
On December 7, 2005, Merrill Lynch announced that it will increase its 40 percent ownership
interest in DSP Merrill Lynch, one of India’s leading investment banking and wealth management
companies, by up to 50 percent to 90 percent for approximately $500 million. The transaction is
expected to close in the first half of 2006 and is subject to various regulatory approvals.
On December 2, 2005, Merrill Lynch completed its acquisition of Advest. Prior to acquisition,
Advest was a wholly-owned subsidiary of AXA Financial Inc. The Advest operations are conducted
primarily through Advest, Inc., a registered broker-dealer. Total consideration for the acquisition
as of December 30, 2005 amounted to $451 million. Approximately $250 million of goodwill and $45
million of intangible assets, which consist solely of customer relationships, were recorded as a
result of this transaction. The total consideration and purchase price allocation have not yet been
finalized. The results of this business are included in Merrill Lynch’s GPC segment.
On November 1, 2004, Merrill Lynch completed its acquisition of the energy trading businesses of
Entergy-Koch, LP. Total consideration for the acquisition amounted to $800 million, plus an amount
equal to net working capital and net assets/liabilities from trading activities. Approximately $670
million of goodwill and $120 million of intangible assets were recorded as a result of this
transaction. Intangible assets consist primarily of customer and technology related intangible
assets. The wholly-owned energy trading business operates as the Global Commodities group, within
Merrill Lynch’s GMI segment.
On October 29, 2004, Merrill Lynch completed its acquisition of the U.K. non-conforming mortgage
lender, Mortgages plc. Mortgages plc engages in a range of mortgage-related businesses, including
origination, servicing, packaging and securitization.
September 11-related Recoveries/Expenses
On September 11, 2001, terrorists attacked the World Trade Center complex, which subsequently
collapsed and damaged surrounding buildings, some of which were occupied by Merrill Lynch. These
events caused the temporary relocation of approximately 9,000 employees from Merrill Lynch’s global
headquarters in the North and South Towers of the World Financial Center, and from offices at 222
Broadway to backup facilities. Merrill Lynch maintains insurance for losses caused by physical
damage to property. This coverage includes repair or replacement of property and lost profits due
to business interruption, including costs related to lack of access to facilities. Merrill Lynch
recorded September 11-related net insurance recoveries of $147 million in 2003. Expenses related to
September 11 were $38 million in 2003.
During 2003, Merrill Lynch concluded its insurance recovery efforts related to the events of
September 11th. In aggregate, Merrill Lynch was reimbursed $725 million for repair and replacement
of physical damage, recovery expenses, and losses due to business interruption.
Supplemental Financial Information (Unaudited)
Quarterly Information
The unaudited quarterly results of operations of Merrill Lynch for 2005 and 2004 are prepared
in conformity with U.S. generally accepted accounting principles, which include industry practices,
and reflect all adjustments that are, in the opinion of management, necessary for a fair
presentation of the results of operations for the periods presented. Results of any interim period
are not necessarily indicative of results for a full year.
| |
|
|
|
|
|
|
|
|
|
|
|
|
|
|
|
|
|
|
|
|
|
|
|
|
|
|
|
|
|
|
|
|
| |
|
|
|
| |
|
For the Quarter Ended |
|
| (dollars in millions, |
|
Dec. 30, |
|
|
Sept. 30, |
|
|
July 1, |
|
|
Apr. 1, |
|
|
Dec. 31, |
|
|
Sept. 24, |
|
|
June 25, |
|
|
Mar. 26, |
|
| except per share amounts) |
|
2005 |
|
|
2005 |
|
|
2005 |
|
|
2005 |
|
|
2004 |
|
|
2004 |
|
|
2004 |
|
|
2004 |
|
| |
Total Revenues |
|
$ |
13,500 |
|
|
$ |
12,395 |
|
|
$ |
11,326 |
|
|
$ |
10,562 |
|
|
$ |
9,680 |
|
|
$ |
7,588 |
|
|
$ |
7,367 |
|
|
$ |
7,984 |
|
Interest Expense |
|
|
6,720 |
|
|
|
5,717 |
|
|
|
5,007 |
|
|
|
4,330 |
|
|
|
3,774 |
|
|
|
2,759 |
|
|
|
2,104 |
|
|
|
1,923 |
|
| |
|
|
Net Revenues |
|
|
6,780 |
|
|
|
6,678 |
|
|
|
6,319 |
|
|
|
6,232 |
|
|
|
5,906 |
|
|
|
4,829 |
|
|
|
5,263 |
|
|
|
6,061 |
|
Non-Interest Expenses |
|
|
4,749 |
|
|
|
4,742 |
|
|
|
4,724 |
|
|
|
4,563 |
|
|
|
4,354 |
|
|
|
3,621 |
|
|
|
3,877 |
|
|
|
4,371 |
|
| |
|
|
Earnings Before Income Taxes |
|
|
2,031 |
|
|
|
1,936 |
|
|
|
1,595 |
|
|
|
1,669 |
|
|
|
1,552 |
|
|
|
1,208 |
|
|
|
1,386 |
|
|
|
1,690 |
|
Income Tax Expense |
|
|
638 |
|
|
|
560 |
|
|
|
460 |
|
|
|
457 |
|
|
|
359 |
|
|
|
286 |
|
|
|
316 |
|
|
|
439 |
|
| |
|
|
Net Earnings |
|
$ |
1,393 |
|
|
$ |
1,376 |
|
|
$ |
1,135 |
|
|
$ |
1,212 |
|
|
$ |
1,193 |
|
|
$ |
922 |
|
|
$ |
1,070 |
|
|
$ |
1,251 |
|
| |
|
|
Earnings Per Common Share: |
|
|
|
|
|
|
|
|
|
|
|
|
|
|
|
|
|
|
|
|
|
|
|
|
|
|
|
|
|
|
|
|
Basic |
|
$ |
1.56 |
|
|
$ |
1.54 |
|
|
$ |
1.25 |
|
|
$ |
1.33 |
|
|
$ |
1.32 |
|
|
$ |
1.01 |
|
|
$ |
1.15 |
|
|
$ |
1.33 |
|
Diluted |
|
$ |
1.41 |
|
|
$ |
1.40 |
|
|
$ |
1.14 |
|
|
$ |
1.21 |
|
|
$ |
1.19 |
|
|
$ |
0.93 |
|
|
$ |
1.05 |
|
|
$ |
1.21 |
|
| |
The principal market on which ML & Co. common stock is traded is the New York Stock Exchange.
ML & Co. common stock also is listed on the Chicago Stock Exchange, Pacific Exchange, London Stock
Exchange and Tokyo Stock Exchange. Information relating to the high and low sales prices per share
for each full quarterly period within the two most recent fiscal years, the approximate number of
holders of record of common stock, and the frequency and amount of cash dividends declared for the
two most recent fiscal years is below.
Dividends Per Common Share
| |
|
|
|
|
|
|
|
|
|
|
|
|
|
|
|
|
| (declared and paid) |
|
1st Quarter |
|
|
2nd Quarter |
|
|
3rd Quarter |
|
|
4th Quarter |
|
| |
2005 |
|
$ |
.16 |
|
|
$ |
.20 |
|
|
$ |
.20 |
|
|
$ |
.20 |
|
2004 |
|
$ |
.16 |
|
|
$ |
.16 |
|
|
$ |
.16 |
|
|
$ |
.16 |
|
| |
With the exception of regulatory restrictions on subsidiaries’ abilities to pay dividends,
there are no restrictions on ML & Co.’s present ability to pay dividends on common stock, other
than ML & Co.’s obligation to make payments on its preferred stock and TOPrSSM, and the
governing provisions of the Delaware General Corporation Law. Certain subsidiaries’ ability to
declare dividends may also be limited. See Note 16 to the Consolidated Financial Statements.
Stockholder Information
Consolidated Transaction Reporting System prices for ML & Co. common stock for the specified
calendar quarters are noted below.
| |
|
|
|
|
|
|
|
|
|
|
|
|
|
|
|
|
|
|
|
|
|
|
|
|
|
|
|
|
|
|
|
|
| |
|
1st Quarter |
|
|
2nd Quarter |
|
|
3rd Quarter |
|
|
4th Quarter |
|
| (at calendar period-end) |
|
High |
|
|
Low |
|
|
High |
|
|
Low |
|
|
High |
|
|
Low |
|
|
High |
|
|
Low |
|
| |
2005 |
|
$ |
61.99 |
|
|
$ |
56.01 |
|
|
$ |
57.50 |
|
|
$ |
52.00 |
|
|
$ |
61.67 |
|
|
$ |
54.36 |
|
|
$ |
69.34 |
|
|
$ |
58.64 |
|
2004 |
|
$ |
64.89 |
|
|
$ |
56.97 |
|
|
$ |
60.74 |
|
|
$ |
51.35 |
|
|
$ |
54.32 |
|
|
$ |
47.35 |
|
|
$ |
61.16 |
|
|
$ |
50.01 |
|
| |
The approximate number of holders of record of ML & Co. common stock as of February 21, 2006 was 18,012. As of February 21,
2006, the closing price of ML & Co. common stock as reported on the New York Stock Exchange was $75.98.
126
Merrill Lynch 2005 Annual Report
Other Information (Unaudited)
Regulation and Supervision
Certain aspects of Merrill Lynch’s business, and the business of its competitors and the
financial services industry in general, are subject to stringent regulation by U.S. Federal and
state regulatory agencies and securities exchanges and by various non-U.S. government agencies or
regulatory bodies, securities exchanges, self-regulatory organizations, and central banks, each of
which has been charged with the protection of the financial markets and the interests of those
participating in those markets.
| • |
|
These regulatory agencies in the United States include, among others, the SEC, the CFTC, the
Federal Energy Regulatory Commission (“FERC”), the FDIC, the Municipal Securities Rulemaking Board
(“MSRB”), the NJDBI, the NYSBD, the UTDFI and the Office of Thrift Supervision (“OTS”). |
| |
| • |
|
Outside the United States, these regulators include the FSA in the United Kingdom; the Irish
Financial Regulator; the Federal Financial Supervisory Authority in Germany; the Commission
Bancaire, the Comite des Establissements de Credit et des Enterprises d’Investissement and the
Autorite des marches financiers in France; the Swiss Federal Banking Commission; the Johannesburg
Securities Exchange; the JFSA; the Japanese Securities and Exchange Surveillance Commission; the
Monetary Authority of Singapore; the Office of Superintendent of Financial Institutions in Canada;
the National Securities Commission in Argentina; the Securities and Exchange Commission in Brazil;
the National Securities and Banking Commission in Mexico; and the Securities and Futures Commission
in Hong Kong, among many others. |
Additional legislation and regulations, and changes in rules promulgated by the SEC or other U.S.
Federal and state government regulatory authorities and self-regulatory organizations and by
non-U.S. government regulatory agencies may directly affect the manner of operation and
profitability of Merrill Lynch. Certain of the operations of Merrill Lynch are subject to
compliance with privacy regulations enacted by the U.S. Federal and state governments, the EU,
other jurisdictions and/or enacted by the various self-regulatory organizations or exchanges.
United States Regulatory Oversight and Supervision
Holding Company Supervision
In June 2004, the SEC approved the Consolidated Supervised Entity rule that created a voluntary
framework for comprehensive group-wide risk management procedures and consolidated supervision of
certain financial services holding companies by the SEC. Merrill Lynch has met all the requirements
and is currently a consolidated supervised entity subject to group-wide supervision by the SEC and
capital requirements generally consistent with the standards of the Basel Committee on Banking
Supervision. As such, Merrill Lynch is computing allowable capital and risk allowances thereto;
permitting the SEC to examine the books and records of the holding company and any affiliate that
does not have a principal regulator; and has adopted various additional SEC reporting,
record-keeping, and notification requirements. Refer to Note 16 to the Consolidated Financial
Statements for additional information.
Merrill Lynch is working to assess the impact of compliance with the new Basel II capital
standards, which the Basel Committee on Banking Supervision adopted in June 2004. Merrill Lynch has
commenced the process of complying with the Basel II standards for implementation in 2006.
Broker-Dealer Regulation
MLPF&S, Merrill Lynch Professional Clearing Corp. (“ML Pro”) and certain other subsidiaries of ML &
Co. are registered as broker-dealers with the SEC and, as such, are subject to regulation by the
SEC and by self-regulatory organizations, such as securities exchanges (including NYSE and the
National Association of Securities Dealers, Inc. (“NASD”)). Certain Merrill Lynch subsidiaries and
affiliates, including MLPF&S and the MLIM entities, are registered as investment advisers with the
SEC.
The Merrill Lynch entities that are broker-dealers registered with the SEC are subject to Rule
15c3-1 under the Securities Exchange Act of 1934 (“Exchange Act”) which is designed to measure the
general financial condition and liquidity of a broker-dealer. Under this rule, these entities are
required to maintain the minimum net capital deemed necessary to meet broker-dealers’ continuing
commitments to customers and others. Under certain circumstances, this rule limits the ability of
such broker-dealers to allow withdrawal of such capital by ML & Co. or other Merrill Lynch
affiliates. Additional information regarding certain net capital requirements is set forth in Note
16 to the Consolidated Financial Statements.
Merrill Lynch formed the Special Structured Products Committee as part of its agreement with the
Department of Justice. This Committee, which is comprised of senior managers across business,
support and risk functions, reviews a variety of transactions with the objective of advancing the
appropriateness and integrity of such client transactions.
Broker-dealers are also subject to other regulations covering the operations of their business,
including sales and trading practices, use of client funds and securities and the conduct of
directors, officers and employees. Broker-dealers are also subject to regulation by state
securities administrators in those states where they do business. Violations of the regulations
governing the actions of a broker-dealer can result in the revocation of broker-dealer licenses,
the imposition of censures or fines, the issuance of cease and desist orders and the suspension or
expulsion from the securities business of a firm, its officers or its employees. The SEC and the
national securities exchanges emphasize in particular the need for supervision and control by
broker-dealers of their employees.
On June 29, 2005, the SEC adopted final rules that modify significantly the registration,
communications and offering processes under the Securities Act of 1933 (the “Securities Act”). The
new rules took effect on December 1, 2005. The new rules are primarily designed to (i) liberalize
the flow of information from issuers to investors before and during offering periods; (ii)
streamline the Securities Act registration process, especially for large reporting issuers, such as
ML & Co., referred to as “well-known seasoned issuers” or “WKSIs”; (iii) implement a new “access
equals delivery” model for final prospectuses based upon electronic availability instead of
physical delivery; and (iv) alter, in certain respects, the prospectus liability framework under
the Securities Act by expressly premising liabilities for material misstatements or omissions
solely on the information conveyed to an investor, whether orally or in writing, at the time the
investor becomes committed to purchase securities. Merrill Lynch has established plans and
procedures designed to comply with these new rules.
Sarbanes-Oxley and Related Rules
Aspects of Merrill Lynch’s public disclosure, corporate governance principles and the roles of
auditors and counsel are subject to the Sarbanes-Oxley Act of 2002 (“Sarbanes-Oxley”) and certain
related regulations and rules proposed and/or adopted by the SEC, the NYSE and other
self-regulatory organizations. Sarbanes-Oxley requirements include requiring our Chief Executive
Officer and Chief Financial Officer to certify that Merrill Lynch’s financial information is fairly
presented and fully complies with disclosure requirements. Additionally, they must evaluate the
effectiveness of disclosure controls and procedures and disclose the results of their evaluation.
Additional areas of focus as a result of Sarbanes-Oxley include: disclosures of off balance sheet
arrangements and contractual obligations; management’s assessment of internal controls and
procedures for financial reporting; the adoption of a code of ethics for the Chief Executive
Officer and senior financial and accounting officers; and disclosure of whether the audit committee
of the Board of Directors includes an audit committee financial expert. Related NYSE and other
self-regulatory organization rules require that the Chief Executive Officer certify compliance with
applicable corporate governance standards. These rules also require listed companies to, among
other items, adopt corporate governance guidelines and a code of business conduct, tighten
applicable criteria for determining director and audit committee member independence, and increase
the authority and responsibilities of the audit committee.
Mutual Fund Industry Regulation
During 2003 and continuing into 2004, abuses by certain participants in the mutual fund industry,
including those relating to market timing, late trading, selective disclosure, and certain
sales-related practices prompted legislative and regulatory scrutiny of a wide range of
fund-related activities. This scrutiny resulted in the adoption of new rules and a number of
legislative and regulatory proposals relating to fund practices. In this regard, the SEC proposed
rules designed to strengthen existing prohibitions relating to late trading and adopted rules to
require enhanced disclosure and supervision of market timing policies and pricing. In addition, the
SEC proposed and adopted rules requiring additional disclosure concerning portfolio managers,
breakpoint discounts on the sale of fund shares, and the process for approving advisory contracts,
as well as enhanced periodic reports. The SEC also adopted and proposed additional rules requiring
corporate governance changes including the adoption of compliance policies and requiring that funds
designate a single chief compliance officer. It is expected that these actions and any additional
legislative and regulatory actions taken to address abuses will affect the manner in which funds
and their service providers conduct business and could increase fund expenses and therefore
adversely affect the profitability of these businesses.
Research Related Regulation
The NYSE and the NASD adopted rules relating to equity research, including a new registration
requirement for equity analysts, which were required to be fully implemented by March 31, 2005.
Merrill Lynch has also added disclosure on research reports to provide investors with additional
information about potential conflicts of interest in response to the requirements of regulators
outside of the U.S. Pursuant to the global regulatory settlement relating to research, in 2005, an
independent monitor reviewed Merrill Lynch’s compliance with its terms.
Over the previous several years, the research function at integrated broker-dealers has been the
subject of substantial regulatory and media attention. As a result of regulatory and legal mandates
as well as firm initiatives, Merrill Lynch enacted a number of new policies to enhance the quality
of its research product including: modifying the compensation system for research analysts; forming
a Research Recommendations Committee to review equity analysts’ investment recommendations;
adopting a new simplified securities rating system; implementing new policies and procedures to
comply with all legal requirements, including those limiting communications between equity research
analysts and investment banking and other origination personnel; and adding additional disclosures
128
Merrill Lynch 2005 Annual Report
on research reports regarding potential conflicts of interest. Merrill Lynch also appointed an
independent consultant who identified independent third-party research providers to provide
fundamental research on certain companies covered by Merrill Lynch. This research has been made
available to Merrill Lynch private clients in the United States beginning in July 2004 and, upon
request, to institutional clients in the United States in accordance with legal requirements. Under
the terms of the global research settlement, in 2005 Merrill Lynch appointed an independent monitor
who reported on Merrill Lynch’s compliance with the terms of the settlement.
The compensation system for research analysts includes an evaluation of the performance of
analysts’ recommendations, including the extent to which the analyst’s insights and recommendations
have benefited investors. The compensation of all analysts responsible for the substance of an
equity research report is required to be reviewed and approved by a committee reporting to the
Board of Directors of MLPF&S. The Management Development and Compensation Committee of the ML & Co.
Board of Directors, a Committee consisting entirely of independent directors, is also required to
review this compensation process for consistency with certain legal requirements. Merrill Lynch’s
Investment Banking Group has no input into research analyst compensation.
Client Information Regulation
Broker-dealers and certain other financial institutions are subject to the USA PATRIOT Act of 2001
(the “USA PATRIOT Act”), which amends the Bank Secrecy Act and was designed to detect and deter
money laundering and terrorist financing activity. The USA PATRIOT Act requires broker-dealers and
other financial institutions to establish anti-money laundering compliance programs which must
include policies and procedures to verify client identity at account opening and to detect and
report suspicious transactions to the government. Institutions subject to the USA PATRIOT Act must
also implement specialized employee training programs, designate an anti-money laundering
compliance officer and submit to independent audits of the effectiveness of the compliance program.
Merrill Lynch has established policies, procedures and systems designed to comply with these
regulations. Among other initiatives, Merrill Lynch adopted a Customer Identification Program in
October 2003. Compliance with the USA PATRIOT Act may result in additional financial expenses for
financial institutions, including Merrill Lynch, and may subject firms to additional liability.
Financial institutions, including Merrill Lynch, have also become subject to increasingly
comprehensive legal requirements concerning the use and protection of certain client information
including those adopted pursuant to the Gramm-Leach-Bliley Act in the United States and the
European Union Data Protection Directive in EU countries. Many states have also recently passed new
privacy and information security laws. Merrill Lynch has adopted additional policies and procedures
in response to such requirements and continues to track and respond to new requirements. This may
result in incremental operating and technology costs.
Additional Regulation of Certain U.S. Entities
MLPF&S and ML Pro are registered futures commission merchants and, as such, are regulated by the
CFTC and the National Futures Association (“NFA”). The CFTC and the NFA impose net capital
requirements on these companies. In addition, these companies are subject to the rules of the
futures exchanges and clearing associations of which they are members.
Merrill Lynch Commodities, Inc. (“MLCI”) is subject to regulation by the FERC, CFTC and other
agencies with respect to certain aspects of its activities. MLCI is also a member of the New York
Mercantile Exchange and is subject to its rules.
Each of Merrill Lynch Alternative Investments LLC and Merrill Lynch Investment Managers LLC is
registered with the CFTC as a commodity pool operator and a commodity trading advisor and each is a
member of the NFA in such capacities. IQ Advisors is registered with the CFTC.
MLGSI is subject to regulation by the NASD and, as a member of the Chicago Board of Trade, is
subject to the rules of that exchange. It is required to maintain minimum net capital pursuant to
rules of the U.S. Department of the Treasury. Merrill Lynch’s municipal finance professionals are
subject to various trading and underwriting regulations of the MSRB.
Merrill Lynch Trust Company, FSB, a federal savings bank, is subject to regulation by the OTS and
the FDIC, and, in addition, is an investment adviser subject to regulation by the SEC.
MLBUSA is regulated primarily by the UTDFI and the FDIC. Merrill Lynch Business Financial Services
Inc, (“MLBFS”), Merrill Lynch Credit Corporation (“MLCC”) and Merrill Lynch Private Finance Ltd.
are wholly-owned subsidiaries of MLBUSA, and certain of their activities are regulated and subject
to examination by the FDIC and the UTDFI. In addition to Utah and the FDIC, MLCC is also licensed
or registered to conduct its lending activities in 29 other jurisdictions and MLBFS is licensed or
registered in eight jurisdictions, subjecting each to regulation and examination by the appropriate
authorities in those jurisdictions.
Merrill Lynch’s banking and lending activities are supervised and regulated by a number of
different Federal and state regulatory agencies. MLB&T is regulated primarily by the NJDBI and the
FDIC.
Merrill Lynch’s insurance subsidiaries are subject to state insurance regulatory supervision. ML
Life is subject to regulation and supervision by the New York State Insurance Department. MLLIC is
subject to regulation and supervision by the Insurance Department of the State of Arkansas. Both
MLLIC and ML Life are subject to similar regulation in the other states in which they are licensed.
MLML is licensed or registered to conduct its commercial mortgage conduit business and its
residential mortgage trading business in multiple jurisdictions.
Merrill Lynch Financial Markets, Inc. (“MLFM”) is registered with, and received approval in January
2005 from, the SEC to act as an OTC Derivatives Dealer. A special set of SEC rules apply to OTC
Derivatives Dealers. MLFM is in the process of becoming operational.
Non-U.S. Regulatory Oversight and Supervision
Merrill Lynch’s business is also subject to extensive regulation by various non-U.S. regulators
including governments, securities exchanges, central banks and regulatory bodies. Certain Merrill
Lynch subsidiaries are regulated as broker-dealers under the laws of the jurisdictions in which
they operate. Subsidiaries engaged in banking and trust activities outside the United States are
regulated by various government entities in the particular jurisdiction where they are chartered,
incorporated and/or conduct their business activities. In some cases, the legislative and
regulatory developments outside the U.S. applicable to these subsidiaries may have a global impact.
Merrill Lynch Bank (Suisse) S.A. is regulated by the Swiss Federal Banking Commission, the FSA and
the NYSBD. Merrill Lynch Bank and Trust (Cayman) Limited is regulated by the Cayman Islands
Monetary Authority and its international representative office by the Federal Reserve and the
Florida Department of Banking.
MLI and MLIB, including certain of its subsidiaries, are regulated and supervised in the United
Kingdom by the FSA and in certain other jurisdictions, by local regulators. MLCMBL, which engages
in the derivatives business, is regulated by the Irish Financial Regulator. MLIB and MLCMBL are
also subject to regulation by the NYSBD. Merrill Lynch’s activities in Australia are regulated by
the Australian Securities and Investments Commission or the Australian Prudential Regulatory
Authority, and its Hong Kong and Singapore operations are regulated and supervised by the Hong Kong
Securities and Futures Commission and The Monetary Authority of Singapore, respectively. Merrill
Lynch’s Japanese business is subject to the regulation of the JFSA as well as other Japanese
regulatory authorities.
Merrill Lynch Commodities (Europe) Ltd. (“MLCE”) is a member of the International Petroleum
Exchange, Nordpool and other exchanges and is subject to their rules. Merrill Lynch Commodities
(Europe) Trading Limited (“MLCETL”) is regulated in the United Kingdom by the FSA.
The business of Merrill Lynch Investment Managers Limited and other non-U.S. investment advisors is
regulated by a number of non-U.S. regulatory agencies or bodies. Their activities in the United
Kingdom are regulated by the FSA and, in other jurisdictions, by local regulators. Several of
MLIM’s international funds (including MLIIF) are regulated for public distribution under the 1985
European Directive on Undertakings for Collective Investment in Transferable Securities (“UCITS”).
This directive was amended in October 2001 by two further directives (“UCITS III”) and the changes
are gradually being implemented by the Member States of the European Union. All UCITS funds must be
or have converted to UCITS III by a certain date. MLIIF converted to UCITS III during 2005.
Merrill Lynch’s activities in Canada, Mexico, Brazil and Argentina are regulated by their
respective securities commissions and exchanges as well as other regulatory authorities.
Legal Proceedings
ML & Co., certain of its subsidiaries, including MLPF&S, and other persons have been named as
parties in various legal actions and arbitration proceedings arising in connection with the
operation of ML & Co.’s businesses. In most cases, plaintiffs seek unspecified damages and other
relief. These actions include the following:
IPO Allocation Litigation
In re Initial Public Offering Antitrust Litigation: Merrill Lynch is named as one of ten
underwriting defendants in this consolidated class action filed in the United States District Court
for the Southern District of New York. The complaint alleges that the defendants and unnamed
co-conspirators violated antitrust laws by conspiring to “require from customers consideration in
addition to the underwriters’ discount for allocation of shares of initial public offerings of
certain technology companies...and to inflate the aftermarket prices for such securities.” On
November 3, 2003, the district court granted the defendants’ motions to dismiss the complaint. On
September 28, 2005, the Second Circuit reversed the district court’s decision dismissing the case,
holding that the alleged conduct
130
Merrill Lynch 2005 Annual Report
was not immune from the antitrust laws. On January 11, 2006, the Second Circuit denied
defendants’ petition for rehearing and rehearing en banc. The defendants are seeking a stay of
further proceedings while they petition for Supreme Court review of the Second Circuit’s decision.
In re Initial Public Offering Securities Litigation: Merrill Lynch has been named as one of the
defendants in approximately 110 securities class action complaints alleging that dozens of
underwriting defendants, including Merrill Lynch, artificially inflated and maintained the stock
prices of the relevant securities by creating an artificially high aftermarket demand for shares.
On October 13, 2004, the district court, having previously denied defendants’ motions to dismiss,
issued an order allowing certain of these cases to proceed against the underwriters as class
actions. On June 30, 2005, the United States Court of Appeals for the Second Circuit entered an
order agreeing to review the district court’s order granting plaintiffs’ motion for class
certification. The matter has now been fully briefed, and the parties are awaiting a decision from
the Court of Appeals.
IPO Underwriting Fee Litigation
In re Public Offering Fee Antitrust Litigation and In re Issuer Plaintiff Initial Public
Offering Fee Antitrust Litigation: Merrill Lynch is one of approximately two dozen defendants that
have been named in purported class actions filed in the United States District Court for the
Southern District of New York alleging that underwriters conspired to fix the “fee” paid to
purchase certain initial public offering securities at 7% in violation of antitrust laws. These
complaints have been filed by both investors and certain issuers in initial public offerings. On
September 25, 2002, the court denied defendants’ motion to dismiss the issuer claims. On February
24, 2004, the court granted defendants’ motion to dismiss the investor claims for damages and
penalties, and permitted the case to proceed only with regard to claim for injunctive relief. The
parties are awaiting a decision on plaintiffs’ motions for class certification in both the investor
and issuer class actions.
Enron Litigation
Newby v. Enron Corp. et al.: On April 8, 2002, Merrill Lynch was added as a defendant in a
consolidated class action filed in the United States District Court for the Southern District of
Texas against 69 defendants purportedly on behalf of the purchasers of Enron’s publicly traded
equity and debt securities during the period October 19, 1998 through November 27, 2001. The
complaint alleges, among other things, that Merrill Lynch engaged in improper transactions in the
fourth quarter of 1999 that helped Enron misrepresent its earnings and revenues in the fourth
quarter of 1999. The complaint also alleges that Merrill Lynch violated the securities laws in
connection with its role as an underwriter of Enron stock, its research analyst coverage of Enron
stock, and its role as placement agent for and limited partner in an Enron-controlled partnership
called LJM2. On December 19, 2002 and March 29, 2004, the court denied Merrill Lynch’s motions to
dismiss. On July 27, 2005, Merrill Lynch filed a Motion for Judgment on the Pleadings based, in
part, on the Supreme Court’s April 19, 2005, decision in Dura Pharmaceuticals v. Broudo, which
addressed the standards for pleading and proving loss causation. On August 3, 2005, plaintiff filed
a Motion for Partial Summary Judgment against Merrill Lynch, which seeks a judgment that Merrill
Lynch knowingly committed deceptive acts in furtherance of a scheme to defraud. Merrill Lynch is
opposing that motion. In addition, the defendants, including Merrill Lynch, are awaiting a decision
on plaintiffs’ motion for class certification. A trial date has been set for October 16, 2006.
In re Enron Corp.: On September 24, 2003, Enron Corporation filed an adversary proceeding in the
United States Bankruptcy Court for the Southern District of New York against a large collection of
financial institutions, including Merrill Lynch. An amended complaint was filed on December 5,
2003. The complaint alleges that the conduct of Merrill Lynch and other bank defendants contributed
to Enron’s bankruptcy.
Other Litigation: Dozens of other actions have been brought against Merrill Lynch and other
investment firms in connection with their Enron-related activities, including actions by state
pension plans and other state investment entities that purchased Enron securities and actions by
other purchasers of Enron securities. There has been no adjudication of the merits of these claims.
Research Litigation
In
re Merrill Lynch & Co., Inc. Research Reports Securities Litigation: Beginning in 2001,
Merrill Lynch was named in dozens of class actions that challenged the objectivity of Merrill
Lynch’s research recommendations related to securities of Internet companies. As a result of the
dismissal or abandonment of many of these cases and the February 16, 2006 settlements in principle
of others (which settlements are subject to further documentation and court approvals), only two of
these class actions are actively being litigated. Merrill Lynch is vigorously defending these two
remaining actions, one of which, Dabit v. Merrill Lynch, is now before the United States Supreme
Court, and the other of which, In re Merrill Lynch & Co., Inc. Shareholders Litigation, is pending
in the United States District Court for the Southern District of New York. Refer to Note 2 to the
Consolidated Financial Statements for further information.
In re Merrill Lynch Tyco Research Securities Litigation: On June 4, 2003, shareholders of Tyco
International filed a class action in the United States District Court for the Southern District of
New York alleging that a former Merrill Lynch research analyst engaged in a variety of improper
practices in connection with research analysis on Tyco International. On February 18, 2004, the
court granted Merrill Lynch’s motion to dismiss the claims related to Tyco. Plaintiffs have
appealed the dismissal of their action to the United States Court of Appeals for the Second
Circuit.
Tyco-Related Arbitration
On July 25, 2005, arbitration hearings began on a claim by a group of persons who allege that
as a result of allegedly misleading research issued by Merrill Lynch, they were induced not to sell
Tyco stock that they had acquired in connection with the sale of their business. They sought
damages of over $90 million. On October 10, 2005, the arbitration panel unanimously rejected all of
the claims against Merrill Lynch and held that the claimants were not entitled to any relief.
Global Crossing Litigation
In re Global Crossing Ltd. Securities Litigation: On or about January 28, 2003, several dozen
entities, including Merrill Lynch, were named as defendants in a class action filed in the United
States District Court for the Southern District of New York. Plaintiffs asserted claims against
Merrill Lynch in connection with a March 1999 fairness opinion that Merrill Lynch issued to the
Board of Directors of Global Crossing in connection with its acquisition of Frontier Corporation,
and in connection with two Global Crossing securities offerings that took place in April 2000 in
which Merrill Lynch was a member of the underwriting syndicate. On December 18, 2003, the court
granted Merrill Lynch’s motion to dismiss the claims related to the issuance of the fairness
opinion but denied Merrill Lynch’s motion to dismiss with regard to its role as an underwriter for
the April 2000 offerings.
Allegheny Energy Litigation
Merrill Lynch v. Allegheny Energy, Inc.: On September 24, 2002, Merrill Lynch filed an action
in the United States District Court for the Southern District of New York against Allegheny Energy,
Inc. The complaint alleges that Allegheny owes Merrill Lynch the final $115 million payment due in
connection with Allegheny’s purchase of Merrill Lynch’s energy trading business and assets in 2001.
The following day, Allegheny filed an action against Merrill Lynch in the Supreme Court of the
State of New York claiming misrepresentations in connection with Merrill Lynch’s sale of the energy
trading business to Allegheny. On July 18, 2005, following a bench trial, the court issued a
decision holding that Allegheny is required to pay Merrill Lynch $115 million plus interest and
that Allegheny is not entitled to any recovery against Merrill Lynch. On September 22, 2005,
Allegheny appealed the court’s July 18, 2005 decision awarding Merrill Lynch $115 million plus
interest on its claim and denying Allegheny any relief on its claim. That appeal is pending.
Boston Chicken Litigation
BCI Trustee Litigation: The Plan Trustee, appointed by the Boston Chicken Inc. (“BCI”) Plan of
Reorganization, has filed claims against numerous defendants, including Merrill Lynch and other
underwriters, alleging damages to BCI resulting from debt and equity offerings in which the
underwriters participated between 1993 and 1997. The Plan Trustee’s suit is pending in federal
district court in Phoenix, Arizona. In January 2006, this matter was settled (subject to court
approval) for an amount that did not have a material effect on ML & Co.’s financial condition or
results of operations. The detailed terms and conditions of the settlement are confidential.
Sale of Mutual Fund Shares
Since May 2004, four putative class actions have been filed in the United States District Court
for the Southern District of New York against Merrill Lynch. These cases allege that Merrill Lynch
failed to disclose incentives to mid-level managers to maximize the sale of mutual funds carrying
the Merrill Lynch brand name and that these mid-level managers pressured financial advisers to
maximize the sale of these funds. Merrill Lynch is seeking the dismissal of these actions. In
addition, Merrill Lynch is a defendant in a putative class action captioned Thomas J. DeBenedictis
v. Merrill Lynch & Co., et al., which was filed in the United States District Court for the
District of New Jersey. This putative class action alleges that the registration statements and
prospectuses for the Merrill Lynch Funds should have stated, but omitted to state, that for certain
investors Class B shares are inherently inferior to Class A, C, and D shares. On February 21, 2006,
the court granted Merrill Lynch’s motion to dismiss the action.
Market Timing Class Action
In October 2004, a securities class action was filed against a large number of defendants,
including Merrill Lynch, in the United States District Court for the District of Maryland and was
subsequently consolidated as part of In re Mutual Funds Investment Litigation, MDL 1586. With
regard to Merrill Lynch, the complaint alleges that between November 1, 1998 and September 3, 2003,
Merrill Lynch violated federal securities laws in connection with serving as a broker-dealer
intermediary on behalf of certain other defendants who allegedly engaged in market timing trading
strategies in mutual fund shares. On November 3, 2005, the court granted Merrill Lynch’s motion to
dismiss these actions.
132
Merrill Lynch 2005 Annual Report
McReynolds v. Merrill Lynch
On November 18, 2005, a purported class action was filed in the United States District Court
for the Northern District of Illinois seeking to certify a class of current and former African
American Merrill Lynch employees, as well as African Americans who applied for employment.
Plaintiff alleges that the firm has engaged in a pattern and practice of discrimination against
African Americans in violation of federal Civil Rights statutes. Merrill Lynch is vigorously
contesting these claims.
Parmalat
Merrill Lynch Capital Markets Bank Limited is one of dozens of defendants sued in Italy by Dr.
Enrico Bondi, the specially appointed administrator of Parmalat Finanziaria S.p.A. (“Parmalat”).
Parmalat was admitted into insolvency proceedings in Italy on December 27, 2003. The claim against
Merrill Lynch Capital Markets Bank Limited is that in 2003 it wrongfully helped Parmalat stay in
business, and thus continue to lose money, by buying options from Parmalat prior to Parmalat being
admitted into insolvency proceedings. The first hearing on this claim is scheduled for May 2006. In
addition, the Parmalat Administrator has charged Merrill Lynch International with wrongfully
facilitating the sale of a note to Parmalat that was linked to Parmalat’s credit in 1999. The first
hearing on this claim is scheduled for April 2006. Merrill Lynch is vigorously contesting these
claims.
Other
Merrill Lynch has been named as a defendant in various other legal actions, including
arbitrations, class actions, and other litigation arising in connection with its activities as a
global diversified financial services institution. The general decline of equity securities prices
between 2000 and 2003 resulted in increased legal actions against many firms, including Merrill
Lynch.
Some of the legal actions include claims for substantial compensatory and/or punitive damages or
claims for indeterminate amounts of damages. In some cases, the issuers that would otherwise be the
primary defendants in such cases are bankrupt or otherwise in financial distress. Merrill Lynch is
also involved in investigations and/or proceedings by governmental and self-regulatory agencies.
The number of these investigations has also increased in recent years with regard to many firms,
including Merrill Lynch.
Merrill Lynch believes it has strong defenses to, and where appropriate, will vigorously contest,
many of these matters. Given the number of these matters, some are likely to result in adverse
judgments, penalties, injunctions, fines, or other relief. Merrill Lynch may explore potential
settlements before a case is taken through trial because of the uncertainty and risks inherent in
the litigation process. In accordance with SFAS No. 5, Merrill Lynch will accrue a liability when
it is probable that a liability has been incurred and the amount of the loss can be reasonably
estimated. In many lawsuits and arbitrations, including most of the class action lawsuits disclosed
in ML & Co.’s public filings, it is not possible to determine whether a liability has been incurred
or to estimate the ultimate or minimum amount of that liability until the case is close to
resolution, in which case no accrual is made until that time. In view of the inherent difficulty of
predicting the outcome of such matters, particularly in cases in which claimants seek substantial
or indeterminate damages, Merrill Lynch cannot predict what the eventual loss or range of loss
related to such matters will be. Subject to the foregoing, Merrill Lynch continues to assess these
cases and believes, based on information available to it, that the resolution of these matters will
not have a material adverse effect on the financial condition of Merrill Lynch as set forth in the
Consolidated Financial Statements, but may be material to Merrill Lynch’s operating results or cash
flows for any particular period and may impact ML & Co.’s credit ratings.
Properties
Merrill Lynch has offices in various locations throughout the world. Other than those described
below as being owned, substantially all Merrill Lynch offices are located in leased premises.
Facilities owned or occupied by Merrill Lynch are believed to be adequate for the purposes for
which they are currently used and are well maintained. Set forth below is the location and the
approximate square footage of the principal facilities of Merrill Lynch. Each of these principal
facilities supports various Merrill Lynch business segments. Information regarding Merrill Lynch’s
property lease commitments is set forth in “Leases” in Note 12 to the Consolidated Financial
Statements.
Principal Facilities in the United States
Merrill Lynch’s executive offices and principal administrative offices are located in leased
premises at the World Financial Center in New York City. Merrill Lynch affiliates lease the North
Tower (1,800,000 square feet) and the South Tower (2,500,000 square feet); both leases expire in
2013. Another Merrill Lynch affiliate is a partner in the partnership that holds the ground
lessee’s interest in the North Tower. As of December 2005, Merrill Lynch occupies the entire North
Tower and approximately 20% of the South Tower.
In New York City, MLPF&S leases 662,000 square feet in lower Manhattan. The lease expires in 2007.
Merrill Lynch occupies 91% of a 760,000 square foot building at 222 Broadway, New York that is
owned by a Merrill Lynch subsidiary. In New Jersey, a Merrill Lynch affiliate owns a 669,000 square
foot office building in Plainsboro. MLPF&S leases 494,000 square feet (reduced to 178,511 square
feet after March 2007) at 101 Hudson Street in Jersey City, New Jersey. This lease expires in 2012
unless certain renewal rights are exercised. A Merrill Lynch affiliate leases and occupies,
pursuant to an operating lease with an unaffiliated lessor, 1,251,000 square feet of office space
and 273,000 square feet of ancillary buildings in Hopewell, New Jersey. The Merrill Lynch affiliate
that is the lessee under such operating lease owns the underlying land upon which the Hopewell
facilities are located. Merrill Lynch affiliates own a 54-acre campus in Jacksonville, Florida,
with four buildings (a large portion of one is leased to a third party).
Principal Facilities Outside the United States
Merrill Lynch occupies various sites in London. Merrill Lynch owns and occupies 100% of its
560,000 square foot London headquarters facility known as Merrill Lynch Financial Centre. In
addition to the Merrill Lynch Financial Centre, Merrill Lynch leases approximately 561,473 square
feet in other London locations with various terms, the longest of which lasts until 2015. It
occupies 339,104 square feet of this space and has either sublet or is currently marketing the
remainder. In Tokyo, a Merrill Lynch affiliate leases and occupies 280,000 square feet until 2014
for its headquarters.
Securities Issued Under Merrill Lynch’s Equity Compensation Plans
The following table provides information on the shares that are available under Merrill Lynch’s
equity compensation plans and, in the case of plans where stock options may be granted, the number
of shares of common stock issuable upon exercise of those stock options.
Merrill Lynch has five shareholder approved plans — the Long-Term Incentive Compensation Plan for
executive officers (for stock grants made to executive officers) (“LTICP-Executive”), the Equity
Capital Accumulation Plan (for restricted share grants made to a broad group of employees)
(“ECAP”), the Merrill Lynch & Co., Inc. 1986 Employee Stock Purchase Plan (“Employee Stock Purchase
Plan”), the Merrill Lynch & Co., Inc. Employee Stock Compensation Plan (for stock grants made to
key managers and producers) (“ESCP”) and the Merrill Lynch & Co., Inc. Deferred Stock Unit Plan for
Non-Employee Directors (for deferred stock unit grants to non-employee directors) (“New Director
Plan”).
Merrill Lynch has adopted stock compensation plans that are used to compensate non-executive
employees — the Financial Advisor Capital Accumulation Award Plan (stock-based compensation to the
financial advisor population) (“FACAAP”) and the Long-Term Incentive Compensation Plan for Managers
and Producers (for stock grants made to key managers and producers) (“LTICP-M&P”).
Merrill Lynch provided for the issuance of deferred stock units and non-qualified stock options to
the Merrill Lynch non-employee Directors as compensation for their Director services under the
Merrill Lynch & Co., Inc. Deferred Stock Unit and Stock Option Plan for Non-Employee Directors
(“Old Director Plan”). The New Director Plan was approved by stockholders in 2005 and replaced the
Old Director Plan.
The numbers in the table are as of December 30, 2005, the last day of Merrill Lynch’s 2005 fiscal
year.
| |
|
|
|
|
|
|
|
|
|
|
|
|
| |
|
Securities Issuable Upon |
|
Weighted-average Exercise |
|
|
Securities that Remain |
|
| Equity Compensation |
|
Exercise of Outstanding Options, |
|
Price of Outstanding Options, |
|
|
Available for Issuance |
|
| Plan Category |
|
Warrants, and Rights(1) |
|
Warrants, and Rights |
|
|
Under Plans |
|
| |
Plans approved by shareholders |
|
|
15,195,559 |
|
|
$ |
44.12 |
|
|
|
126,306,076 |
|
Plans not approved by
shareholders(2) |
|
|
161,659,633 |
|
|
$ |
49.57 |
|
|
|
49,853,672 |
|
| |
|
|
Total |
|
|
176,855,192 |
|
|
$ |
49.10 |
|
|
|
176,159,748 |
(3) |
| |
|
|
|
| (1) |
|
Merrill Lynch also has made the following grants under its stock compensation plans that
remain outstanding as of December 30, 2005 and are not included in this column: 37,250,319 units
(payable in stock) under FACAAP and 51,550,622 restricted shares and restricted units granted under
LTICP-Executive, LTICP-M&P and ESCP. In addition, in January 2006, 16,754,497 restricted shares and
3,418,576 restricted units were granted under both ESCP and LTICP-Executive, 325,939 stock options
were granted under LTICP-M&P and 3,041,175 units (payable in stock) were granted under FACAAP. |
| (2) |
|
These plans are: (i) FACAAP, (ii) LTICP-M&P and (iii) the Old Director Plan. The material
features of FACAAP, LTICP-M&P and the Old Director Plan are described in Note 14 to the
Consolidated Financial Statements included in this Annual Report on Form 10-K. Those descriptions
do not purport to be complete and are qualified in their entirety by reference to the plan
documents that are exhibits to this Annual Report on Form 10-K. |
| (3) |
|
This amount includes, as of December 30, 2005: 33,887,507 shares available for issuance
under LTICP-Executive; 31,524,712 shares available for issuance under LTICP-M&P; 10,832,121 shares
available for issuance under ECAP; 23,462,435 shares available for issuance under the Employee
Stock Purchase Plan; 18,301,782 shares available for issuance under FACAAP; 965,694 and 27,178
shares available for issuance under the New and Old Director Plans, respectively; and 57,158,319
shares available for issuance under ESCP. |
134
Merrill Lynch 2005 Annual Report
Executive Officers of Merrill Lynch & Co., Inc.
The following list sets forth the name, age, present title, principal occupation and certain
biographical information for the past five years for ML & Co.’s executive officers, all of whom
have been elected by the ML & Co. Board of Directors. Unless otherwise indicated, the officers
listed are of ML & Co. Under ML & Co.’s By-Laws, elected officers are elected annually to hold
office until their successors are elected and qualify or until their earlier resignation or
removal.
E. Stanley O’Neal (54)
Chairman of the Board since April 2003; Chief Executive Officer since December 2002; President
and Chief Operating Officer since July 2001; Executive Vice President from April 1997 to July 2001;
President of U.S. Private Client (now a part of Global Private Client) from February 2000 to July
2001; Chief Financial Officer from March 1998 to February 2000.
Rosemary T. Berkery (52)
Executive Vice President since October 2001; General Counsel since September 2001; Senior Vice
President and Head of U.S. Private Client (now a part of Global Private Client) Marketing and
Investments from June 2000 to September 2001; Co-Director of Global Securities Research and
Economics Group from April 1997 to June 2000.
Robert C. Doll (51)
Senior Vice President since April 2002; Chief Investment Officer and President of Merrill Lynch
Investment Managers (“MLIM”) since September 2001;
Co-Head of MLIM Americas from November 1999 to
September 2001; Chief Investment Officer for Equities for MLIM Americas from June 1999 to November
1999; prior to joining Merrill Lynch, Chief Investment Officer of OppenheimerFunds, Inc. from
January 1999 to June 1999.
Jeffrey N. Edwards (44)
Senior Vice President since April 2005; Chief Financial Officer since March 2005; Senior Vice
President and Head of Investment Banking for Americas region from September 2004 to March 2005;
Head of Global Capital Markets and Financing from August 2003 to September 2004; Co-Head of Global
Equity Markets (covering trading, sales and origination activities) from October 2001 to August
2003; prior to that, in March 2000, appointed Co-Head of Global Equity Capital Markets.
Ahmass L. Fakahany (47)
Executive Vice President since December 2002; Vice Chairman and Chief Administrative Officer
since March 2005; Chief Financial Officer from November 2002 to March 2005; Chief Operating Officer
for Global Markets and Investment Banking (“GMI”) from October 2001 to November 2002; Senior Vice
President and Finance Director from December 1998 to October 2001.
Gregory J. Fleming (43)
Executive Vice President since October 2003; President of GMI since August 2003; Chief
Operating Officer of the Global Investment Banking Group of GMI from January 2003 to August 2003;
Co-Head of the Global Financial Institutions Group of GMI from April 2001 to August 2003; Head of
the United States Financial Institutions Group of GMI from June 1999 to April 2001; Managing
Director of the Global Investment Banking Group of GMI from February 1999 to October 2003.
Dow Kim (43)
Executive Vice President since October 2003; President of GMI since August 2003; Head of the
Global Debt Markets Group of GMI from October 2001 to August 2003; Managing Director and Head of
Global Enterprise Risk Management within the Global Debt Markets Group of GMI from April 2000 to
October 2001; Head of the Fixed Income business in Japan from July 1997 to March 2000.
Robert J. McCann (47)
Executive Vice President since August 2003; Vice Chairman and President of Global Private
Client since June 2005; Vice Chairman, Wealth Management Group from August 2003 to June 2005; Vice
Chairman and Director of Distribution and Marketing for AXA Financial Inc. from March 2003 to August 2003; Head of the Global Securities Research and Economics Group of Merrill Lynch from October 2001 to March 2003; Chief Operating Officer of GMI from September 2000 to October 2001;
Head of the Global Institutional Client Division of GMI from August 1998 to September 2000.
Corporate Information
Common Stock
Exchange Listings
The common stock of Merrill Lynch (trading symbol MER) is listed on the New York Stock
Exchange, Chicago Stock Exchange, Pacific Exchange, London Stock Exchange and Tokyo Stock Exchange.
Transfer Agent and Registrar
Wells Fargo Bank, N.A. is the recordkeeping transfer agent for Merrill Lynch & Co., Inc.
common stock. Questions from registered shareholders on dividends, lost or stolen certificates, the
transfer of their physical stock certificates, changes of legal or dividend addresses and other
matters relating to registered shareholder status should be directed to:
Wells Fargo Bank, N.A.
Shareowner Services
161 North Concord Exchange
South St. Paul, MN 55075
1-888-460-7641
Preferred Stock
Exchange Listing
Depositary Shares representing 1/1200 of a share of Floating Rate Non-Cumulative Preferred
Stock, Series 1, Depositary Shares representing 1/1200 of a share of Floating Rate Non-Cumulative
Preferred Stock, Series 2, Depositary Shares representing 1/1200 of a share of 6.375%
Non-Cumulative Preferred Stock, Series 3, and Depositary Shares representing 1/1200 of a share of
Floating Rate Non-Cumulative Preferred Stock, Series 4, are listed on the New York Stock Exchange.
Transfer Agent and Registrar
JP Morgan Chase Bank
4 New York Plaza, 15th Floor
New York, NY 10014
Attn: Institutional Trust Services
Form 10-K Annual Report for 2005
For copies of Merrill Lynch’s 2005 Annual Report on Form 10-K (including financial schedules
but excluding other exhibits), visit our Investor Relations website at www.ir.ml.com or write to
Judith A. Witterschein, Corporate Secretary, Merrill Lynch & Co., Inc., 222 Broadway, 17th Floor,
New York, NY 10038-2510.
Equal Employment Opportunity
Merrill Lynch is fully committed to Equal Employment Opportunity and to attracting,
retaining, developing and promoting the most qualified employees regardless of race, national
origin, religion, sexual orientation, gender, age, disability or veteran status or any other
characteristic prohibited by state or local law. For more information, write to Judith A.
Witterschein, Corporate Secretary, Merrill Lynch & Co., Inc., 222 Broadway, 17th Floor, New York,
NY 10038-2510.
Charitable Contributions
A summary of Merrill Lynch’s charitable contributions is available on our Global Philanthropy
website at www.ml.com/philanthropy or upon written request to Judith A. Witterschein, Corporate
Secretary, Merrill Lynch & Co., Inc., 222 Broadway, 17th Floor, New York, NY 10038-2510.
Annual Meeting
The 2006 Annual Meeting of Merrill Lynch & Co., Inc. shareholders will take place at the
Harrison Conference Center & Hotel-Princeton Forrestal Center, 900 Scudders Mill Road, Plainsboro,
New Jersey. The meeting is scheduled for Friday, April 28, 2006, at 9:30 a.m.
Corporate Governance
Merrill Lynch has long adhered to best practices in corporate governance in fulfillment of
its responsibilities to shareholders. Its practices align management and shareholder interests.
Highlights of our corporate governance practices include:
| • |
|
A Board of Directors composed of eleven directors — ten of whom are independent — a Lead
Independent Director and Board Committees composed solely of independent directors |
| |
| • |
|
Corporate Governance Guidelines that set forth specific criteria for director qualifications,
Board and Board Committee composition, director responsibilities, orientation and education
requirements and annual Board self-evaluation |
| |
| • |
|
Director Independence Standards adopted by the Board of Directors to form the basis of director
independence determinations required by NYSE rules |
| |
| • |
|
Charters for each of our Board Committees reflecting current best corporate governance practices |
| |
| • |
|
Guidelines for Business Conduct adopted by the Board of Directors as our code of ethics for our
directors, officers and employees and supplemented by our Code of Ethics for Financial
Professionals |
| |
| • |
|
Designation of three Audit Committee members as audit committee financial experts in accordance
with SEC regulations |
| |
| • |
|
A formal disclosure committee composed of senior officers for the purpose of implementing,
monitoring and evaluating our disclosure controls and procedures |
Merrill Lynch’s Corporate Governance Guidelines, Director Independence Standards, charters for our
Board Committees, Guidelines for Business Conduct and Code of Ethics for Financial Professionals
are available on our Investor Relations website at www. ir.ml.com. Shareholders may obtain copies
of these materials, free of charge, upon written request to Judith A. Witterschein, Corporate
Secretary, Merrill Lynch & Co., Inc., 222 Broadway, 17th Floor, New York, NY 10038-2510.
Merrill Lynch has included as exhibits to its Annual Report on Form 10-K for the 2005 fiscal year
filed with the Securities and Exchange Commission certificates of its Chief Executive Officer and
Chief Financial Officer certifying the quality of Merrill Lynch’s public disclosure. Merrill Lynch
has submitted to each of the New York Stock Exchange and the Pacific Stock Exchange a certificate
of its Chief Executive Officer certifying that he is not aware of any violation by Merrill Lynch of
their corporate governance listing standards.
www.ml.com
136
Merrill Lynch 2005 Annual Report
EXHIBITS AND FINANCIAL STATEMENT SCHEDULES
Documents filed as part of this Report:
| |
|
|
1.
|
|
Consolidated Financial Statements
The consolidated financial statements required to be filed in this Annual Report on Form 10-K
are listed on page 19. |
2.
|
|
Financial Statement Schedule
The financial statement schedule required to be filed in this Annual Report on Form 10-K
is listed on Exhibit 99.8. The schedule also appears in Exhibit 99.8 and
is incorporated herein by reference. |
3.
|
|
Exhibits
Certain exhibits were previously filed by Merrill Lynch as exhibits to other reports or
registration statements and are incorporated herein by reference as indicated
parenthetically below. ML & Co.’s Exchange Act file
number is
001-07182. For
convenience, Quarterly Reports on Form 10-Q, Annual Reports on Form 10-K,
Current Reports on Form 8-K and Registration Statements on Form S-3 are
designated herein as “10-Q,” “10-K,” “8-K” and “S-3,” respectively. |
|
|
|
Plan of Acquisition, Reorganization, Arrangement, Liquidation or Succession
|
2
|
|
Transaction Agreement and Plan of Merger, dated February 15, 2006, by and among
Merrill Lynch & Co., Inc., BlackRock Inc., New Boise, Inc. and Boise Merger Sub, Inc.
(Exhibit 2.1 to 8-K dated February 22, 2006). |
|
|
|
Articles of Incorporation and By-Laws
|
3.1
|
|
Restated Certificate of Incorporation of ML & Co., effective as of May 3, 2001 (Exhibit 3.1 to 8-K dated November 14,
2005). |
|
|
|
3.2
|
|
Certificate of Designations for ML & Co. Floating Rate Non-Cumulative Preferred Stock, Series 1, par value $1.00 per share,
effective as of October 25, 2004 (Exhibit 3.2 and 4.1 to 8-K dated November 14, 2005). |
|
|
|
3.3
|
|
Certificate of Designations for ML & Co. Floating Rate Non-Cumulative Preferred Stock, Series 2, par value $1.00 per share,
effective as of March 9, 2005 (Exhibit 3.3 and 4.2 to 8-K dated November 14, 2005). |
|
|
|
3.4
|
|
Certificate of Designations for ML & Co. 6.375% Non-Cumulative Preferred Stock, Series 3, par value $1.00 per share, effective as
of November 14, 2005 (Exhibit 3.4 and 4.3 to 8-K dated November 14, 2005). |
|
|
|
3.5
|
|
Certificate of Designations for ML & Co. Floating Rate Non-Cumulative Preferred Stock, Series 4, par value $1.00 per share,
effective as of November 14, 2005 (Exhibit 3.5 and 4.4 to 8-K dated November 14, 2005). |
|
|
|
3.6
|
|
Amended By-Laws of ML & Co., effective as of June 6, 2005 (Exhibit 3 to 10-Q for the quarter ended July 1, 2005). |
|
|
|
Instruments Defining the Rights of Security Holders, Including Indentures
|
ML & Co. hereby undertakes to furnish to the SEC, upon request, copies
of any agreements not filed defining the rights of holders of long-term debt
securities of ML & Co., none of which authorize an amount of securities that exceed 10% of the total assets of ML & Co.
|
4.1
|
|
Senior Indenture, dated as of April 1, 1983, as amended and restated as of April 1, 1987, between ML & Co. and JPMorgan Chase
Bank, N.A.1 (“1983 Senior Indenture”) and the Supplemental Indenture thereto dated as of March 15, 1990 (filed as Exhibit 4(i)
to 10-K for fiscal year ended December 29, 1999 (“1999 10-K”)). |
|
|
|
4.2
|
|
Sixth Supplemental Indenture to the 1983 Senior Indenture, dated as of October 25, 1993, between ML & Co. and JPMorgan Chase Bank,
N.A. (filed as Exhibit 4(ii) to 1999 10-K). |
|
|
|
4.3
|
|
Twelfth Supplemental Indenture to the 1983 Senior Indenture, dated as of September 1, 1998, between ML & Co. and JPMorgan Chase Bank,
N.A. (filed as Exhibit 4(a) to 8-K dated October 21, 1998). |
|
|
|
4.4
|
|
Thirteenth Supplemental Indenture to the 1983 Senior Indenture, dated as of July 31, 2002, between ML & Co. and JPMorgan Chase Bank,
N.A. (filed as Exhibit 4(b) (vii) to S-3 (file no. 333-109802)). |
|
|
|
4.5
|
|
Fourteenth Supplemental Indenture to the 1983 Senior Indenture, dated as of September 23, 2002, between ML & Co. and JPMorgan Chase
Bank, N.A. (filed as Exhibit 4(b)(viii) to S-3 (file no. 333-109802)). |
|
|
|
4.6
|
|
Fifteenth Supplemental Indenture to the 1983 Senior Indenture, dated as of October 14, 2003, between ML & Co. and JPMorgan Chase Bank,
N.A. (filed as Exhibit 4(b)(ix) to S-3 (file no. 333-109802)) |
|
|
|
4.7
|
|
Sixteenth Supplemental Indenture to the 1983 Senior Indenture, dated as of June 4, 2004, between ML & Co. and JPMorgan Chase Bank,
N.A. (filed as Exhibit 4(b)(xii) to S-3 (file no. 333-122639)). |
|
|
|
| |
1
As used in this section of this Report, “JPMorgan Chase Bank,
N.A.” shall mean the entity formerly known as JPMorgan Chase Bank, The Chase Manhattan Bank and
Chemical Bank (successor by merger to Manufacturers Hanover Trust Company). |
137
| |
|
|
4.8
|
|
Seventeenth Supplemental Indenture to the 1983 Senior Indenture,
dated as of October 14, 2004, between ML & Co. and JPMorgan
Chase Bank, N.A. (filed as Exhibit 4(b)(xiii) to S-3 (file no. 333-122639)). |
|
|
|
4.9
|
|
Eighteenth Supplemental Indenture to the 1983 Senior Indenture, dated
as of October 21, 2004, between ML & Co. and JPMorgan Chase
Bank, N.A. (filed as Exhibit 4(b)(xiv) to S-3 (file no. 333-122639)). |
|
|
|
4.10
|
|
Senior Indenture, dated as of October 1, 1993 between ML &
Co. and JPMorgan Chase Bank, N.A. (“1993 Senior Indenture”) (filed as
Exhibit(4)(iv) to 10-K for fiscal year ended December 25,
1998 (“1998 10-K”)). |
|
|
|
4.11
|
|
First Supplemental Indenture to the 1993 Senior Indenture, dated as
of June 1, 1998, between ML & Co. and JPMorgan Chase Bank,
N.A. (filed as Exhibit 4(a) to 8-K dated July 2, 1998). |
|
|
|
4.12
|
|
Indenture, dated as of May 23, 2001, between ML & Co. and
JPMorgan Chase Bank, N.A. relating to ML & Co.’s Liquid Yield
Optiontm Notes due 2031 (Zero Coupon — Senior) (filed as Exhibit 4.4
to 10-Q for the quarter ended September 24, 2004
(“Third Quarter 2004 10-Q”). |
|
|
|
4.13
|
|
First Supplemental Indenture, dated as of November 1, 2004,
between ML & Co. and JPMorgan Chase Bank, N.A. relating to ML &
Co.’s Liquid Yield Optiontm Notes due 2031 (Zero Coupon —
Senior) (filed as Exhibit 4.5 to Third Quarter 2004 10-Q). |
|
|
|
4.14
|
|
Second Supplemental Indenture, dated as of November 9, 2004,
between ML & Co. and JPMorgan Chase Bank, N.A. relating to ML &
Co.’s Liquid Yield Optiontm Notes due 2031 (Zero Coupon —
Senior) (filed as Exhibit 4 to 8-K dated November 10,
2004). |
|
|
|
4.15
|
|
Indenture, dated as of March 13, 2002, between ML & Co. and
JPMorgan Chase Bank, N.A. relating to ML & Co.’s Liquid Yield
Optiontm Notes due 2032 (Zero Coupon — Floating Rate —
Senior) (filed as Exhibit 4.6 to Third Quarter 2004 10-Q). |
|
|
|
4.16
|
|
First Supplemental Indenture, dated as of November 1, 2004,
between ML & Co. and JPMorgan Chase Bank, N.A. relating to ML &
Co.’s Liquid Yield Optiontm Notes due 2032 (Zero Coupon —
Floating Rate — Senior) (filed as Exhibit 4.7 to Third
Quarter 2004 10-Q). |
|
|
|
4.17
|
|
Indenture, dated as of December 14, 2004, between ML & Co.
and JPMorgan Chase Bank, N.A., relating to ML & Co.’s Exchange
Liquid Yield Optiontm Notes due 2032 (Zero Coupon — Floating Rate
— Senior) (filed as Exhibit 4(a)(vii) to S-3 (file no.
333-122639)). |
|
|
|
4.18
|
|
Deposit Agreement, dated as of November 1, 2004, between ML &
Co., JPMorgan Chase Bank, N.A., as Depositary, and the holders from
time to time of the Floating Rate Non-Cumulative Preferred Stock,
Series 1 depositary shares of ML & Co. (Form of Deposit
Agreement filed as Exhibit 2 to Form 8-A dated October 26,
2004). |
|
|
|
4.19
|
|
Deposit Agreement, dated as of March 14, 2005, between ML &
Co., JPMorgan Chase Bank, N.A., as Depositary, and the holders from
time to time of the Floating Rate Non-Cumulative Preferred Stock,
Series 2 depositary shares of ML & Co. (Form of Deposit
Agreement filed as Exhibit 2 to Form 8-A dated March 11,
2005). |
|
|
|
4.20
|
|
Deposit Agreement, dated as of November 17, 2005, between ML &
Co., JPMorgan Chase Bank, N.A., as Depositary, and the holders from
time to time of the 6.375% Non-Cumulative Preferred Stock, Series 3
depositary shares of ML & Co. (Form of Deposit Agreement filed
as Exhibit 2 to Form 8-A dated November 14, 2005). |
|
|
|
4.21
|
|
Deposit Agreement, dated as of November 17, 2005, between ML &
Co., JPMorgan Chase Bank, N.A., as Depositary, and the holders from
time to time of the Floating Rate Non-Cumulative Preferred Stock,
Series 4 depositary shares of ML & Co. (Form of Deposit
Agreement filed as Exhibit 2 to Form 8-A dated November 14,
2005). |
|
|
|
4.22
|
|
Form of Amended and Restated Rights Agreement dated as of December 2,
1997, between ML & Co. and Wells Fargo Bank, N.A.
(successor to Mellon Investor Services, L.L.C.) (filed as Exhibit 4
to 8-K dated December 2, 1997). |
|
|
|
Material Contracts
|
|
|
|
10.1†
|
|
ML & Co. Equity Capital Accumulation Plan, as amended through July 26,
1999 (Exhibit 10(iii) to 10-Q for the quarter ended
June 25, 1999). |
|
|
|
10.2†
|
|
Written description of retirement programs for non-employee directors
(pages 29 and 30 of ML & Co.’s Proxy Statement for the 2005
Annual Meeting of Shareholders contained in ML & Co.’s Schedule 14A
filed on March 15, 2005). |
|
|
|
10.3†
|
|
Form of Severance Agreement between ML & Co. and certain of its
directors and executive officers (Exhibit 10.3 to 10-K for the
fiscal year ended December 31, 2004). |
|
|
|
10.4
|
|
Form of Indemnification Agreement entered into with all current
directors of ML & Co. and to be entered into with all future
directors of ML & Co. (Exhibit 10(viii) to 1998 10-K). |
|
|
|
10.5†
|
|
Written description of ML & Co.’s incentive compensation programs
(Exhibit 10(ix) to 1998 10-K). |
|
|
|
10.6†
|
|
Written description of ML & Co.’s compensation policy for
directors and executive officers (pages 28 to 30 and pages 37
to 46 of ML & Co.’s Proxy Statement for the 2005 Annual
Meeting of Shareholders contained in ML & Co.’s Schedule 14A
filed on March 15, 2005). |
138
| |
|
|
10.7
|
|
Form of Amended and Restated Agreement of Limited Partnership of
Merrill Lynch KECALP L.P. 1994 (Exhibit(a)(ii) to Registration
Statement on Form N-2 (file No. 33-51825)). |
|
|
|
10.8
|
|
Form of Amended and Restated Agreement of Limited Partnership of
Merrill Lynch KECALP L.P. 1997 (Exhibit(a)(ii) to Registration
Statement on Form N-2 (file No. 333-15035)). |
|
|
|
10.9
|
|
Form of Amended and Restated Agreement of Limited Partnership of
Merrill Lynch KECALP L.P. 1999 (Exhibit(a)(ii) to Registration
Statement on Form N-2 (file No. 333-59143)). |
|
|
|
10.10†
|
|
ML & Co. Deferred Restricted Unit Plan for Executive Officers
(Exhibit 10(xxiii) to 10-K for fiscal year ended December 27,
1996 (“1996 10-K”)). |
|
|
|
10.11†
|
|
Amendment dated February 12, 1998 to the ML & Co. Deferred
Restricted Unit Plan for Executive Officers (Exhibit 10.32 to 10-K
for the fiscal year ended December 26, 1997 (“1997 10-K”)). |
|
|
|
10.12†
|
|
ML & Co. Fee Deferral Plan for Non-Employee Directors, as amended
through April 15, 1997 (Exhibit 10 to 10-Q for the
quarter ended March 28, 1997). |
|
|
|
10.13†
|
|
Form of ML & Co. Amended and Restated 1994 Deferred Compensation
Agreement for a Select Group of Eligible Employees, as amended
through November 10, 1994 (Exhibit 10(ii) to 1999 10-K). |
|
|
|
10.14†
|
|
ML & Co. 1995 Deferred Compensation Plan for a Select Group of
Eligible Employees (Exhibit 10(xix) to 1999 10-K). |
|
|
|
10.15†
|
|
ML & Co. 1996 Deferred Compensation Plan for a Select Group of
Eligible Employees (Exhibit 10(i) to 10-Q for the quarter
ended September 29, 1995). |
|
|
|
10.16†
|
|
ML & Co. 1997 Deferred Compensation Plan for a Select Group of
Eligible Employees (Exhibit 10(xxvii) to 1996 10-K). |
|
|
|
10.17†
|
|
ML & Co. 1998 Deferred Compensation Plan for a Select Group of
Eligible Employees (Exhibit 10(i) to 10-Q for the quarter
ended September 26, 1997). |
|
|
|
10.18†
|
|
ML & Co. 1999 Deferred Compensation Plan for a Select Group of
Eligible Employees (Exhibit 10 to 10-Q for the quarter ended
September 25, 1998). |
|
|
|
10.19†
|
|
ML & Co. 2000 Deferred Compensation Plan for a Select Group of
Eligible Employees (Exhibit 10(xxiv) to 1999 10-K). |
|
|
|
10.20†
|
|
ML & Co. 2001 Deferred Compensation Plan for a Select Group of
Eligible Employees (Exhibit 10(xxiii) to 10-K for the fiscal
year ended December 28, 2001 (“2001 10-K”). |
|
|
|
10.21†
|
|
ML & Co. 2002 Deferred Compensation Plan for a Select Group of
Eligible Employees (Exhibit 10(xxv) to 2001 10-K). |
|
|
|
10.22†
|
|
ML & Co. 2003 Deferred Compensation Plan for a Select Group of
Eligible Employees (Exhibit 10.26 to 10-K for the fiscal year
ended December 27, 2002 (“2002 10-K”)). |
|
|
|
10.23†
|
|
ML & Co. 2004 Deferred Compensation Plan for a Select Group of
Eligible Employees (Exhibit 10 to 10-Q for the quarter ended
September 26, 2003). |
|
|
|
10.24†
|
|
ML & Co. 2005 Deferred Compensation Plan for a Select Group of
Eligible Employees (Exhibit 10 to 8-K dated October 8,
2004). |
|
|
|
10.25†
|
|
ML & Co. 1997 KECALP Deferred Compensation Plan for a Select
Group of Eligible Employees (Exhibit 10(i) to 10-Q for the
quarter ended June 27, 1997). |
|
|
|
10.26†
|
|
Amendment dated September 18, 1996 to Deferred Compensation Plans
(amending the Amended and Restated 1994 Deferred Compensation
Agreement for a Select Group of Eligible Employees, the ML & Co.
1995 Deferred Compensation Plan for a Select Group of Eligible
Employees and the ML & Co. 1996 Deferred Compensation Plan for a
Select Group of Eligible Employees) (Exhibit 10(xxxii) to 1996 10-K). |
|
|
|
10.27†
|
|
Amendment dated February 12, 1998 to the ML & Co. Deferred
Compensation Plans for a Select Group of Eligible Employees for the
years 1994, 1995, 1996 and 1997 (Exhibit 10.31 to 1997 10-K). |
|
|
|
10.28†
|
|
Merrill Lynch Financial Advisor Capital Accumulation Award Plan
(Exhibit 10.30 to 2002 10-K). |
|
|
|
10.29†
|
|
ML & Co. Deferred Stock Unit and Stock Option Plan for
Non-Employee Directors (Exhibit 10.32 to 10-K for the fiscal
year ended December 26, 2003). |
|
|
|
10.30†
|
|
ML & Co. Long-Term Incentive Compensation Plan for Managers and
Producers, as amended April 27, 2001 (Exhibit 10(xxx) to 2001 10-K). |
|
|
|
10.31†
|
|
ML & Co. Long-Term Incentive Compensation Plan for executive
officers, as amended April 27, 2001 (Exhibit 10(i) to 10-Q
for the quarter ended June 29, 2001). |
|
|
|
10.32†
|
|
Form of Executive Annuity Agreement by and between ML & Co. and
certain of its high level senior executive officers (Exhibit 10(xxxii)
to 2001 10-K). |
|
|
|
10.33†
|
|
ML & Co. Employee Stock Compensation Plan (Exhibit C to ML &
Co.’s Proxy Statement for the 2003 Annual Meeting of
Shareholders contained in ML & Co.’s Schedule 14A filed on
March 14, 2003). |
|
|
|
10.34†
|
|
Form of grant document for executive officers under the ML & Co.
Long-Term Incentive Compensation Plan (Exhibit 10.1 to 10-Q
for the quarter ended September 24, 2004). |
|
|
|
10.35†
|
|
Form of Restricted Covenant Agreement between ML & Co. and its
executive officers (Exhibit 10 to 8-K dated September 17,
2004). |
139
| |
|
|
10.36†
|
|
ML & Co. Deferred Stock Unit Plan For Non-Employee Directors
(Exhibit A to ML & Co.’s Proxy Statement for the 2005 Annual
Meeting of Shareholders contained in ML & Co.’s Schedule 14A
filed on March 15, 2005). |
|
|
|
10.37†
|
|
ML & Co. 2006 Deferred Compensation Plan for a Select Group of
Eligible Employees (Exhibit 10 to Registration Statement on Form S-8
(file No. 333-125109)). |
|
|
|
10.38†
|
|
ML & Co. Managing Partner Incentive Program (Exhibit 10 to 8-K
dated January 23, 2006). |
|
|
|
11
|
|
Statement re: computation of earnings per common share (the
calculation of per share earnings is in Part II, Item 8, Note 11
to the Consolidated Financial Statements (Stockholders’
Equity and Earnings Per Share) and is omitted in accordance with
Section(b)(11) of Item 601 of Regulation S-K). |
|
|
|
12*
|
|
Statement re: computation of ratios. |
|
|
|
14.1*
|
|
ML & Co. Guidelines for Business Conduct: Merrill Lynch’s Code of
Ethics for Directors, Officers and Employees. |
|
|
|
14.2
|
|
ML & Co. Code of Ethics for Financial Professionals (Exhibit 99.1
to 10-Q for the quarter ended September 26, 2003). |
|
|
|
21*
|
|
Subsidiaries of ML & Co. |
|
|
|
23*
|
|
Consent of Independent Registered Public Accounting Firm, Deloitte &
Touche LLP. |
|
|
|
31.1*
|
|
Rule 13a-14(a) Certification of the Chief Executive Officer. |
|
|
|
31.2*
|
|
Rule 13a-14(a) Certification of the Chief Financial Officer. |
|
|
|
32.1*
|
|
Certification Pursuant to 18 U.S.C. Section 1350, as Adopted
Pursuant to Section 906 of the Sarbanes-Oxley Act of 2002. |
|
|
|
32.2*
|
|
Certification Pursuant to 18 U.S.C. Section 1350, as Adopted
Pursuant to Section 906 of the Sarbanes-Oxley Act of 2002. |
|
|
|
| Additional Exhibits |
|
|
|
99.1*
|
|
Report of Independent Registered Public Accounting Firm, Deloitte &
Touche LLP, with respect to the information set forth in Exhibit 12
under the captions “Ratio of Earnings to Fixed Charges” and
“Ratio of Earnings to Combined Fixed Charges and Preferred Stock
Dividends”. |
|
|
|
99.2*
|
|
Report of Independent Registered Public Accounting Firm, Deloitte &
Touche LLP, with respect to information set forth in the “Selected
Financial Data” table set forth in this Report. |
|
|
|
99.3*
|
|
Charter of the Audit Committee of the ML & Co. Board of Directors. |
|
|
|
99.4*
|
|
Charter of the Finance Committee of the ML & Co. Board of
Directors. |
|
|
|
99.5*
|
|
Charter of the Management Development and Compensation Committee of
the ML & Co. Board of Directors. |
|
|
|
99.6*
|
|
Charter of the Nominating and Corporate Governance Committee of the ML &
Co. Board of Directors. |
|
|
|
99.7
|
|
Charter of the Public Policy and Responsibility Committee of the ML &
Co. Board of Directors (Exhibit 99.1 to 10-Q for the
quarter ended June 27, 2003). |
|
|
|
99.8*
|
|
Condensed Financial Information of Registrant Merrill Lynch &
Co., Inc. (Parent Company Only) |
| |
|
| * |
Filed herewith |
| |
| |
|
| † |
Management contract or compensatory plan or arrangement |
140
10-K CROSS-REFERENCE INDEX
This Annual Report on Form 10-K incorporates the requirements of the accounting profession
and the Securities and Exchange Commission, including a comprehensive explanation of 2005 results.
| |
|
|
| Item Number |
|
Page |
|
|
|
Part I |
|
|
1. Business |
|
21-22, 24-125, |
|
|
127-130, 135 |
1A. Risk Factors |
|
22-24 |
1B. Unresolved Staff Comments |
|
None |
2. Properties |
|
133-134 |
3. Legal Proceedings |
|
130-133 |
4. Submission of Matters to a Vote of Security Holders |
|
Not Applicable |
|
|
|
Part II |
|
|
5. Market for Registrant’s Common Equity, Related Stockholder
Matters, and Issuer Purchases of Equity Securities |
|
45-46, 126, 134 |
6. Selected Financial Data |
|
20 |
7. Management’s Discussion and Analysis of Financial Condition
and Results of Operations |
|
21-62 |
7A. Quantitative and Qualitative Disclosures about Market Risk |
|
51-53, 91-92 |
8. Financial Statements and Supplementary Data |
|
65-126 |
9. Changes in and Disagreements with Accountants on Accounting
and Financial Disclosure |
|
Not Applicable |
9A. Controls and Procedures |
|
64-65 |
9B. Other Information |
|
Not Applicable |
|
|
|
Part III |
|
|
10. Directors and Executive Officers of the Registrant |
|
21, 135* |
11. Executive Compensation |
|
** |
12. Security Ownership of Certain Beneficial Owners and
Management and Related Stockholder Matters |
|
134*** |
13. Certain Relationships and Related Transactions |
|
**** |
14. Principal Accountant Fees and Services |
|
***** |
|
|
|
Part IV |
|
|
15. Exhibits and Financial Statement Schedules |
|
137-140 |
SIGNATURES |
|
142 |
| |
|
|
|
|
|
*
|
|
For additional information regarding Directors, see the
material under the captions “Election of Directors,” “GOVERNANCE OF
THE COMPANY,” and “OTHER MATTERS” in the definitive Proxy Statement
for Merrill Lynch’s Annual Meeting of Stockholders to be held on
April 28, 2006, to be filed with the SEC (Proxy Statement),
incorporated herein by reference. |
**
|
|
See the material under the captions “Compensation of
Directors” and “EXECUTIVE COMPENSATION” in the Proxy Statement,
incorporated herein by reference. |
***
|
|
See also the material under the caption “BENEFICIAL
OWNERSHIP OF OUR COMMON STOCK” in the Proxy Statement,
incorporated herein by reference. |
****
|
|
See the material under the caption “Certain Transactions”
in the Proxy Statement, incorporated herein by reference. |
*****
|
|
See the material under the captions “Pre-Approval of
Services Provided by the Company’s Independent Registered Public
Accounting Firm” and “Fees Paid to the Company’s Independent
Registered Public Accounting Firm” in the Proxy Statement,
incorporated herein by reference.
None of the foregoing
incorporation by reference shall include the information referred
to in Item 402 (a)(8) of Regulation S-K. |
141
SIGNATURES
| |
|
|
|
|
|
|
| Pursuant to the requirements of Section 13 or 15(d)
of the Securities Exchange Act of 1934, the Registrant has duly caused this report to be signed on
its behalf by the undersigned, thereunto duly authorized on the 27th day of February 2006. |
|
ARMANDO M. CODINA |
|
/s/ Armando M. Codina |
| |
|
|
|
| |
|
|
Armando M. Codina
Director |
| |
|
|
|
|
|
|
Merrill Lynch & Co., Inc.
|
|
JILL K. CONWAY |
|
/s/ Jill K. Conway |
| |
|
|
|
|
|
|
Registrant
|
|
|
|
|
|
Jill K. Conway
Director |
|
|
|
|
|
|
|
JUDITH A. WITTERSCHEIN
|
|
/s/ Judith A. Witterschein
|
|
ALBERTO CRIBIORE
|
|
/s/ Alberto Cribiore |
|
|
Judith A. Witterschein
Secretary
|
|
|
|
Alberto Cribiore
Director |
|
|
|
|
|
|
|
Pursuant to the requirements of the Securities Exchange
Act of 1934, this report has been signed below by the following persons on behalf of the Registrant
in the capacities indicated on the 27th day of February 2006.
|
|
JOHN D. FINNEGAN |
|
/s/ John D. Finnegan
|
| |
|
|
|
| |
|
|
John D. Finnegan
Director |
|
|
|
|
|
|
|
E. STANLEY O’NEAL |
|
/s/ E. Stanley O’Neal |
|
HEINZ-JOACHIM |
|
/s/ Heinz-Joachim Neubürger |
|
|
E. Stanley O’Neal
Director, Chairman of the
Board and Chief Executive Officer
(Principal Executive Officer)
|
|
NEUBÜRGER |
|
Heinz-Joachim Neubürger
Director |
|
|
|
|
|
|
|
JEFFREY N. EDWARDS
|
|
/s/ Jeffrey N. Edwards
|
|
DAVID K. NEWBIGGING
|
|
/s/ David K. Newbigging
|
|
|
Jeffrey N. Edwards
Senior Vice President and
Chief Financial Officer
(Principal Financial Officer)
|
|
|
|
David K. Newbigging
Director |
|
|
|
|
|
|
|
LAURENCE A. TOSI
|
|
/s/ Laurence A. Tosi
|
|
AULANA L. PETERS
|
|
/s/ Aulana L. Peters |
|
|
|
|
|
|
|
|
|
Laurence A. Tosi
Vice President and
Finance Director
(Principal Accounting Officer)
|
|
|
|
Aulana L. Peters
Director |
|
|
|
|
|
|
|
|
|
|
|
JOSEPH W. PRUEHER
|
|
/s/ Joseph W. Prueher
|
|
|
|
|
|
|
|
|
|
|
|
|
|
Joseph W. Prueher
Director |
|
|
|
|
|
|
|
|
|
|
|
ANN N. REESE
|
|
/s/ Ann N. Reese
|
|
|
|
|
|
|
|
|
|
|
|
|
|
Ann N. Reese
Director |
|
|
|
|
|
|
|
|
|
|
|
CHARLES O. ROSSOTTI
|
|
/s/ Charles O. Rossotti
|
|
|
|
|
|
|
|
|
|
|
|
|
|
Charles O. Rossotti
Director |
142
EXHIBIT INDEX
| |
|
|
|
|
| Exhibits |
| |
2 |
|
|
Transaction Agreement and Plan of Merger, dated February 15,
2006, by and among Merrill Lynch & Co., Inc., BlackRock Inc., New
Boise, Inc. and Boise Merger Sub, Inc. (Exhibit 2.1 to 8-K
dated February 22, 2006). |
| |
3.1 |
|
|
Restated Certificate of Incorporation of ML & Co., effective as
of May 3, 2001 (Exhibit 3.1 to 8-K dated November 14,
2005). |
| |
3.2 |
|
|
Certificate of Designations for ML & Co. Floating Rate
Non-Cumulative Preferred Stock, Series 1, par value $1.00 per
share, effective as of October 25, 2004 (Exhibit 3.2 and
4.1 to 8-K dated November 14, 2005). |
| |
3.3 |
|
|
Certificate of Designations for ML & Co. Floating Rate
Non-Cumulative Preferred Stock, Series 2, par value $1.00 per
share, effective as of March 9, 2005 (Exhibit 3.3 and 4.2
to 8-K dated November 14, 2005). |
| |
3.4 |
|
|
Certificate of Designations for ML & Co. 6.375% Non-Cumulative
Preferred Stock, Series 3, par value $1.00 per share,
effective as of November 14, 2005 (Exhibit 3.4 and 4.3 to 8-K
dated November 14, 2005). |
| |
3.5 |
|
|
Certificate of Designations for ML & Co. Floating Rate
Non-Cumulative Preferred Stock, Series 4, par value $1.00 per
share, effective as of November 14, 2005 (Exhibit 3.5 and
4.4 to 8-K dated November 14, 2005). |
| |
3.6 |
|
|
Amended By-Laws of ML & Co., effective as of June 6, 2005
(Exhibit 3 to 10-Q for the quarter ended July 1, 2005). |
| |
4.1 |
|
|
Senior Indenture, dated as of April 1, 1983, as amended and
restated as of April 1, 1987, between ML & Co. and JPMorgan
Chase Bank, N.A.1 (“1983 Senior Indenture”) and the
Supplemental Indenture thereto dated as of March 15, 1990 (filed
as Exhibit 4(i) to 10-K for fiscal year ended December 29,
1999 (“1999 10-K”)). |
| |
4.2 |
|
|
Sixth Supplemental Indenture to the 1983 Senior Indenture, dated as
of October 25, 1993, between ML & Co. and JPMorgan Chase
Bank, N.A. (filed as Exhibit 4(ii) to 1999 10-K). |
| |
4.3 |
|
|
Twelfth Supplemental Indenture to the 1983 Senior Indenture, dated as
of September 1, 1998, between ML & Co. and JPMorgan Chase
Bank, N.A. (filed as Exhibit 4(a) to 8-K dated October 21,
1998). |
| |
4.4 |
|
|
Thirteenth Supplemental Indenture to the 1983 Senior Indenture, dated
as of July 31, 2002, between ML & Co. and JPMorgan Chase
Bank, N.A. (filed as Exhibit 4(b) (vii) to S-3 (file no.
333-109802)). |
| |
4.5 |
|
|
Fourteenth Supplemental Indenture to the 1983 Senior Indenture, dated
as of September 23, 2002, between ML & Co. and JPMorgan Chase
Bank, N.A. (filed as Exhibit 4(b)(viii) to S-3 (file no.
333-109802)). |
| |
4.6 |
|
|
Fifteenth Supplemental Indenture to the 1983 Senior Indenture, dated
as of October 14, 2003, between ML & Co. and JPMorgan Chase
Bank, N.A. (filed as Exhibit 4(b)(ix) to S-3 (file no.
333-109802)). |
| |
4.7 |
|
|
Sixteenth Supplemental Indenture to the 1983 Senior Indenture, dated
as of June 4, 2004, between ML & Co. and JPMorgan Chase Bank,
N.A. (filed as Exhibit 4(b)(xii) to S-3 (file no.
333-122639)). |
| |
4.8 |
|
|
Seventeenth Supplemental Indenture to the 1983 Senior Indenture,
dated as of October 14, 2004, between ML & Co. and JPMorgan
Chase Bank, N.A. (filed as Exhibit 4(b)(xiii) to S-3 (file
no. 333-122639)). |
| |
4.9 |
|
|
Eighteenth Supplemental Indenture to the 1983 Senior Indenture, dated
as of October 21, 2004, between ML & Co. and JPMorgan Chase
Bank, N.A. (filed as Exhibit 4(b)(xiv) to S-3 (file no.
333-122639)). |
| |
4.10 |
|
|
Senior Indenture, dated as of October 1, 1993 between ML &
Co. and JPMorgan Chase Bank, N.A. (“1993 Senior Indenture”) (filed as
Exhibit (4)(iv) to 10-K for fiscal year ended December 25,
1998 (“1998 10-K”)). |
| |
4.11 |
|
|
First Supplemental Indenture to the 1993 Senior Indenture, dated as
of June 1, 1998, between ML & Co. and JPMorgan Chase Bank,
N.A. (filed as Exhibit 4(a) to 8-K dated July 2, 1998). |
| |
4.12 |
|
|
Indenture, dated as of May 23, 2001, between ML & Co. and
JPMorgan Chase Bank, N.A. relating to ML & Co.’s Liquid Yield
Optiontm Notes due 2031 (Zero Coupon — Senior)
(filed as Exhibit 4.4 to 10-Q for the quarter ended September 24,
2004 (“Third Quarter 2004 10-Q”). |
| |
4.13 |
|
|
First Supplemental Indenture, dated as of November 1, 2004,
between ML & Co. and JPMorgan Chase Bank, N.A. relating to ML &
Co.’s Liquid Yield Optiontm Notes due 2031 (Zero
Coupon — Senior) (filed as Exhibit 4.5 to Third Quarter 2004 10-Q). |
| |
4.14 |
|
|
Second Supplemental Indenture, dated as of November 9, 2004,
between ML & Co. and JPMorgan Chase Bank, N.A. relating to ML &
Co.’s Liquid Yield Optiontm Notes due 2031 (Zero
Coupon — Senior) (filed as Exhibit 4 to 8-K dated
November 10, 2004). |
| |
4.15 |
|
|
Indenture, dated as of March 13, 2002, between ML & Co. and
JPMorgan Chase Bank, N.A. relating to ML & Co.’s Liquid Yield
Optiontm Notes due 2032 (Zero Coupon — Floating
Rate — Senior) (filed as Exhibit 4.6 to Third Quarter 2004 10-Q). |
| |
4.16 |
|
|
First Supplemental Indenture, dated as of November 1, 2004,
between ML & Co. and JPMorgan Chase Bank, N.A. relating to ML &
Co.’s Liquid Yield Optiontm Notes due 2032 (Zero
Coupon — Floating Rate — Senior) (filed as Exhibit 4.7 to
Third Quarter 2004 10-Q). |
| |
4.17 |
|
|
Indenture, dated as of December 14, 2004, between ML & Co.
and JPMorgan Chase Bank, N.A., relating to ML & Co.’s Exchange
Liquid Yield Optiontm Notes due 2032 (Zero Coupon
— Floating Rate — Senior) (filed as Exhibit 4(a)(vii) to S-3
(file no. 333-122639)). |
| |
4.18 |
|
|
Deposit Agreement, dated as of November 1, 2004, between ML &
Co., JPMorgan Chase Bank, N.A., as Depositary, and the holders from
time to time of the Floating Rate Non-Cumulative Preferred Stock,
Series 1 depositary shares of ML & Co. (Form of Deposit Agreement
filed as Exhibit 2 to Form 8-A dated October 26, 2004). |
| |
4.19 |
|
|
Deposit Agreement, dated as of March 14, 2005, between ML &
Co., JPMorgan Chase Bank, N.A., as Depositary, and the holders from
time to time of the Floating Rate Non-Cumulative Preferred Stock,
Series 2 depositary shares of ML & Co. (Form of Deposit Agreement
filed as Exhibit 2 to Form 8-A dated March 11, 2005). |
| |
4.20 |
|
|
Deposit Agreement, dated as of November 17, 2005, between ML &
Co., JPMorgan Chase Bank, N.A., as Depositary, and the holders from
time to time of the 6.375% Non-Cumulative Preferred Stock, Series 3
depositary shares of ML & Co. (Form of Deposit Agreement filed as
Exhibit 2 to Form 8-A dated November 14, 2005). |
| |
4.21 |
|
|
Deposit Agreement, dated as of November 17, 2005, between ML &
Co., JPMorgan Chase Bank, N.A., as Depositary, and the holders from
time to time of the Floating Rate Non-Cumulative Preferred Stock,
Series 4 depositary shares of ML & Co. (Form of Deposit Agreement
filed as Exhibit 2 to Form 8-A dated November 14, 2005). |
| |
|
|
|
|
| Exhibits |
| |
4.22 |
|
|
Form of Amended and Restated Rights Agreement dated as of December 2,
1997, between ML & Co. and Wells Fargo Bank, N.A.
(successor to Mellon Investor Services, L.L.C.) (filed as Exhibit 4
to 8-K dated December 2, 1997). |
| |
10.1 |
|
|
ML & Co. Equity Capital Accumulation Plan, as amended through July 26,
1999 (Exhibit 10(iii) to 10-Q for the quarter ended
June 25, 1999). |
| |
10.2 |
|
|
Written description of retirement programs for non-employee directors
(pages 29 and 30 of ML & Co.’s Proxy Statement for the 2005
Annual Meeting of Shareholders contained in ML & Co.’s Schedule
14A filed on March 15, 2005). |
| |
10.3 |
|
|
Form of Severance Agreement between ML & Co. and certain of its
directors and executive officers (Exhibit 10.3 to 10K for the
fiscal year ended December 31, 2004). |
| |
10.4 |
|
|
Form of Indemnification Agreement entered into with all current
directors of ML & Co. and to be entered into with all future
directors of ML & Co. (Exhibit 10(viii) to 1998 10-K). |
| |
10.5 |
|
|
Written description of ML & Co.’s incentive compensation programs
(Exhibit 10(ix) to 1998 10-K). |
| |
10.6 |
|
|
Written description of ML & Co.’s compensation policy for
directors and executive officers (pages 28 to 30 and pages 37
to 46 of ML & Co.’s Proxy Statement for the 2005 Annual
Meeting of Shareholders contained in ML & Co.’s Schedule 14A
filed on March 15, 2005). |
| |
10.7 |
|
|
Form of Amended and Restated Agreement of Limited Partnership of
Merrill Lynch KECALP L.P. 1994 (Exhibit (a)(ii) to Registration
Statement on Form N-2 (file No. 33-51825)). |
| |
10.8 |
|
|
Form of Amended and Restated Agreement of Limited Partnership of
Merrill Lynch KECALP L.P. 1997 (Exhibit (a)(ii) to Registration
Statement on Form N-2 (file No. 333-15035)). |
| |
10.9 |
|
|
Form of Amended and Restated Agreement of Limited Partnership of
Merrill Lynch KECALP L.P. 1999 (Exhibit (a)(ii) to Registration
Statement on Form N-2 (file No. 333-59143)). |
| |
10.10 |
|
|
ML & Co. Deferred Restricted Unit Plan for Executive Officers
(Exhibit 10(xxiii) to 10-K for fiscal year ended December 27,
1996 (“1996 10-K”)). |
| |
10.11 |
|
|
Amendment dated February 12, 1998 to the ML & Co. Deferred
Restricted Unit Plan for Executive Officers (Exhibit 10.32 to 10-K
for the fiscal year ended December 26, 1997 (“1997 10-K”)). |
| |
10.12 |
|
|
ML & Co. Fee Deferral Plan for Non-Employee Directors, as amended
through April 15, 1997 (Exhibit 10 to 10-Q for the
quarter ended March 28, 1997). |
| |
10.13 |
|
|
Form of ML & Co. Amended and Restated 1994 Deferred Compensation
Agreement for a Select Group of Eligible Employees, as amended
through November 10, 1994 (Exhibit 10(ii) to 1999 10-K). |
| |
10.14 |
|
|
ML & Co. 1995 Deferred Compensation Plan for a Select Group of
Eligible Employees (Exhibit 10(xix) to 1999 10-K). |
| |
10.15 |
|
|
ML & Co. 1996 Deferred Compensation Plan for a Select Group of
Eligible Employees (Exhibit 10(i) to 10-Q for the quarter
ended September 29, 1995). |
| |
10.16 |
|
|
ML & Co. 1997 Deferred Compensation Plan for a Select Group of
Eligible Employees (Exhibit 10(xxvii) to 1996 10-K). |
| |
10.17 |
|
|
ML & Co. 1998 Deferred Compensation Plan for a Select Group of
Eligible Employees (Exhibit 10(i) to 10-Q for the quarter
ended September 26, 1997). |
| |
10.18 |
|
|
ML & Co. 1999 Deferred Compensation Plan for a Select Group of
Eligible Employees (Exhibit 10 to 10-Q for the quarter ended
September 25, 1998). |
| |
10.19 |
|
|
ML & Co. 2000 Deferred Compensation Plan for a Select Group of
Eligible Employees (Exhibit 10(xxiv) to 1999 10-K). |
| |
10.20 |
|
|
ML & Co. 2001 Deferred Compensation Plan for a Select Group of
Eligible Employees (Exhibit 10(xxiii) to 10-K for the fiscal
year ended December 28, 2001 (“2001 10-K”). |
| |
10.21 |
|
|
ML & Co. 2002 Deferred Compensation Plan for a Select Group of
Eligible Employees (Exhibit 10(xxv) to 2001 10-K). |
| |
10.22 |
|
|
ML & Co. 2003 Deferred Compensation Plan for a Select Group of
Eligible Employees (Exhibit 10.26 to 10-K for the fiscal year
ended December 27, 2002 (“2002 10-K”)). |
| |
10.23 |
|
|
ML & Co. 2004 Deferred Compensation Plan for a Select Group of
Eligible Employees (Exhibit 10 to 10-Q for the quarter ended
September 26, 2003). |
| |
10.24 |
|
|
ML & Co. 2005 Deferred Compensation Plan for a Select Group of
Eligible Employees (Exhibit 10 to 8-K dated October 8,
2004). |
| |
10.25 |
|
|
ML & Co. 1997 KECALP Deferred Compensation Plan for a Select
Group of Eligible Employees (Exhibit 10(i) to 10-Q for the
quarter ended June 27, 1997). |
| |
10.26 |
|
|
Amendment dated September 18, 1996 to Deferred Compensation Plans
(amending the Amended and Restated 1994 Deferred Compensation
Agreement for a Select Group of Eligible Employees, the ML & Co.
1995 Deferred Compensation Plan for a Select Group of Eligible
Employees and the ML & Co. 1996 Deferred Compensation Plan for a
Select Group of Eligible Employees) (Exhibit 10(xxxii) to 1996 10-K). |
| |
10.27 |
|
|
Amendment dated February 12, 1998 to the ML & Co. Deferred
Compensation Plans for a Select Group of Eligible Employees for the
years 1994, 1995, 1996 and 1997 (Exhibit 10.31 to 1997 10-K). |
| |
10.28 |
|
|
Merrill Lynch Financial Advisor Capital Accumulation Award Plan
(Exhibit 10.30 to 2002 10-K). |
| |
10.29 |
|
|
ML & Co. Deferred Stock Unit and Stock Option Plan for
Non-Employee Directors (Exhibit 10.32 to 10-K for the fiscal
year ended December 26, 2003). |
| |
10.30 |
|
|
ML & Co. Long-Term Incentive Compensation Plan for Managers and
Producers, as amended April 27, 2001 (Exhibit 10(xxx) to 2001 10-K). |
| |
10.31 |
|
|
ML & Co. Long-Term Incentive Compensation Plan for executive
officers, as amended April 27, 2001 (Exhibit 10(i) to 10-Q
for the quarter ended June 29, 2001). |
| |
10.32 |
|
|
Form of Executive Annuity Agreement by and between ML & Co. and
certain of its high level senior executive officers (Exhibit 10(xxxii)
to 2001 10-K). |
| |
10.33 |
|
|
ML & Co. Employee Stock Compensation Plan (Exhibit C to ML &
Co.’s Proxy Statement for the 2003 Annual Meeting of
Shareholders contained in ML & Co.’s Schedule 14A filed on March 14,
2003). |
| |
10.34 |
|
|
Form of grant document for executive officers under the ML & Co.
Long-Term Incentive Compensation Plan (Exhibit 10.1 to 10-Q
for the quarter ended September 24, 2004). |
| |
|
|
|
|
| Exhibits |
| |
10.35 |
|
|
Form of Restricted Covenant Agreement between ML & Co. and its
executive officers (Exhibit 10 to 8-K dated September 17,
2004). |
| |
10.36 |
|
|
ML & Co. Deferred Stock Unit Plan For Non-Employee Directors
(Exhibit A to ML & Co.’s Proxy Statement for the 2005 Annual
Meeting of Shareholders contained in ML & Co.’s Schedule 14A
filed on March 15, 2005). |
| |
10.37 |
|
|
ML & Co. 2006 Deferred Compensation Plan for a Select Group of
Eligible Employees (Exhibit 10 to Registration Statement on Form S-8
(file No. 333-125109)). |
| |
10.38 |
|
|
ML & Co. Managing Partner Incentive Program (Exhibit 10 to 8-K
dated January 23, 2006). |
| |
11 |
|
|
Statement re: computation of earnings per common share (the
calculation of per share earnings is in Part II, Item 8, Note 11
to the Consolidated Financial Statements (Stockholders’
Equity and Earnings Per Share) and is omitted in accordance with
Section (b)(11) of Item 601 of Regulation S-K). |
| |
12* |
|
|
Statement re: computation of ratios. |
| |
14.1* |
|
|
ML & Co. Guidelines for Business Conduct: Merrill Lynch’s Code of
Ethics for Directors, Officers and Employees. |
| |
14.2 |
|
|
ML & Co. Code of Ethics for Financial Professionals (Exhibit 99.1
to 10-Q for the quarter ended September 26, 2003). |
| |
21* |
|
|
Subsidiaries of ML & Co. |
| |
23* |
|
|
Consent of Independent Registered Public Accounting Firm, Deloitte &
Touche LLP. |
| |
31.1* |
|
|
Rule 13a-14(a) Certification of the Chief Executive Officer. |
| |
31.2* |
|
|
Rule 13a-14(a) Certification of the Chief Financial Officer. |
| |
32.1* |
|
|
Certification Pursuant to 18 U.S.C. Section 1350, as Adopted
Pursuant to Section 906 of the Sarbanes-Oxley Act of 2002. |
| |
32.2* |
|
|
Certification Pursuant to 18 U.S.C. Section 1350, as Adopted
Pursuant to Section 906 of the Sarbanes-Oxley Act of 2002. |
| |
99.1* |
|
|
Report of Independent Registered Public Accounting Firm, Deloitte &
Touche LLP, with respect to the information set forth in Exhibit 12
under the captions “Ratio of Earnings to Fixed Charges” and
“Ratio of Earnings to Combined Fixed Charges and Preferred Stock
Dividends”. |
| |
99.2* |
|
|
Report of Independent Registered Public Accounting Firm, Deloitte &
Touche LLP, with respect to information set forth in the “Selected
Financial Data” table set forth in this Report. |
| |
99.3* |
|
|
Charter of the Audit Committee of the ML & Co. Board of Directors. |
| |
99.4* |
|
|
Charter of the Finance Committee of the ML & Co. Board of
Directors. |
| |
99.5* |
|
|
Charter of the Management Development and Compensation Committee of
the ML & Co. Board of Directors. |
| |
99.6* |
|
|
Charter of the Nominating and Corporate Governance Committee of the ML &
Co. Board of Directors. |
| |
99.7 |
|
|
Charter of the Public Policy and Responsibility Committee of the ML &
Co. Board of Directors (Exhibit 99.1 to 10-Q for the
quarter ended June 27, 2003). |
| |
99.8* |
|
|
Condensed Financial Information of Registrant Merrill Lynch &
Co., Inc. (Parent Company Only) |