10-Q: Quarterly report pursuant to Section 13 or 15(d)
Published on May 7, 2013
UNITED STATES
SECURITIES AND EXCHANGE COMMISSION
Washington, D.C. 20549
FORM 10-Q
(Mark One)
[ü] QUARTERLY REPORT PURSUANT TO SECTION 13 OR 15(d) OF THE SECURITIES
EXCHANGE ACT OF 1934
For the Quarterly Period Ended March 31, 2013
or
[ ] TRANSITION REPORT PURSUANT TO SECTION 13 OR 15(d) OF THE SECURITIES
EXCHANGE ACT OF 1934
For the transition period from to
Commission file number:
1-6523
Exact Name of Registrant as Specified in its Charter:
Bank of America Corporation
State or Other Jurisdiction of Incorporation or Organization:
Delaware
IRS Employer Identification Number:
56-0906609
Address of Principal Executive Offices:
Bank of America Corporate Center
100 N. Tryon Street
Charlotte, North Carolina 28255
Registrant's telephone number, including area code:
(704) 386-5681
Former name, former address and former fiscal year, if changed since last report:
Indicate by check mark whether the registrant (1) has filed all reports required to be filed by Section 13 or 15(d) of the Securities Exchange Act of 1934 during the preceding 12 months (or for such shorter period that the registrant was required to file such reports), and (2) has been subject to such filing requirements for the past 90 days.
Yes ü No
Indicate by check mark whether the registrant has submitted electronically and posted on its corporate Web site, if any, every Interactive Data File required to be submitted and posted pursuant to Rule 405 of Regulation S-T (§ 232.405 of this chapter) during the preceding 12 months (or for such shorter period that the registrant was required to submit and post such files).
Yes ü No
Indicate by check mark whether the registrant is a large accelerated filer, an accelerated filer, a non-accelerated filer, or a smaller reporting company. See the definitions of "large accelerated filer," "accelerated filer" and "smaller reporting company" in Rule 12b-2 of the Exchange Act (check one).
Large accelerated filer ü
|
Accelerated filer |
Non-accelerated filer
(do not check if a smaller
reporting company)
|
Smaller reporting company |
|||
Indicate by check mark whether the registrant is a shell company (as defined in Exchange Act Rule 12b-2).
Yes No ü
On May 3, 2013, there were 10,780,377,285 shares of Bank of America Corporation Common Stock outstanding.
Bank of America Corporation |
||
March 31, 2013 |
||
Form 10-Q |
||
INDEX |
Page |
|
1
2
Item 2. MANAGEMENT'S DISCUSSION AND ANALYSIS OF FINANCIAL CONDITION AND RESULTS OF OPERATIONS |
This report on Form 10-Q, the documents that it incorporates by reference and the documents into which it may be incorporated by reference may contain, and from time to time Bank of America Corporation (collectively with its subsidiaries, the Corporation) and its management may make certain statements that constitute forward-looking statements within the meaning of the Private Securities Litigation Reform Act of 1995. These statements can be identified by the fact that they do not relate strictly to historical or current facts. Forward-looking statements often use words such as "expects," "anticipates," "believes," "estimates," "targets," "intends," "plans," "goal" and other similar expressions or future or conditional verbs such as "will," "may," "might," "should," "would" and "could." The forward-looking statements made represent the current expectations, plans or forecasts of the Corporation regarding the Corporation's future results and revenues, and future business and economic conditions more generally, including statements concerning: expectations regarding the effects of U.S. budget sequestration; expectations regarding the anticipated transfers of, and the possibility of future additional agreements to sell, mortgage servicing rights; expectations regarding planned actions pursuant to the Corporation's capital plan; the expectation that borrower assistance programs will not result in any incremental credit provision and that the existing allowance for credit losses is adequate to absorb any costs that have not already been recorded as charge-offs; expectations of achieving cost savings as a result of Project New BAC of $8 billion per year on an annualized basis, or $2 billion per quarter, by mid-2015, with $1.5 billion in quarterly cost savings achieved by the fourth quarter of 2013; that the Corporation may purchase outstanding debt instruments depending on prevailing market conditions, liquidity and other factors; expectations regarding the timing and impact of proposed U.K. corporate income tax rate reductions; the expectation that unresolved repurchase claims related to private-label securitizations will continue to increase; the resolution of representation and warranties repurchase and other claims; the belief that increases in requests for loan files from certain private-label securitization trustees and requests for tolling agreements to toll the applicable statutes of limitation related to representations and warranties repurchase claims will likely lead to an increase in repurchase claims from private-label securitization trustees with standing to bring such claims; expectations regarding the MBIA Settlement, the payments to be made thereunder, the claims to be extinguished by the settlement and the actions to be taken by the parties in furtherance thereof; beliefs and expectations concerning the impact of the National Mortgage Settlement, including the impact of uniform servicing standards; the substance and timing of the final rules implementing Basel 3; the expectation that the Corporation will comply with the final Basel 3 rules when issued and effective; that estimates under the Basel 3 Advanced Approach will be refined over time as a result of further rulemaking or clarification by U.S. banking regulators and as the Corporation's understanding and interpretation of the rules evolve; that the final rules when adopted and fully implemented are likely to influence regulatory capital and liquidity planning processes and may impose additional operational and compliance costs on the Corporation; that, if the Corporation's analytical models for capital measurement under Basel 3 are not approved by the U.S. regulatory agencies, it would likely lead to an increase in the Corporation's risk-weighted assets, which in some cases could be significant; that the Basel 3 Advanced Approach, if adopted as proposed, is expected to substantially increase the Corporation's capital requirements; expectations regarding preferred dividends; the Corporation's belief that it can quickly obtain cash for certain securities, even in stressed market conditions, through repurchase agreements or outright sales; the Corporation's belief that a portion of structured liability obligations will remain outstanding beyond the earliest put or redemption date; the Corporation's anticipation that debt levels will decline due to maturities through 2013; expectations regarding loans in the pay option portfolio; effects of the ongoing debt crisis in certain EU countries, including the expectation of continued market volatility, the expectation that the Corporation will continue to support client activities in the region and that exposures may vary over time as the Corporation monitors the situation and manages its risk profile; the expectation that, absent unexpected deterioration in the economy, there will be reductions in the allowance for credit losses; the expectation that the maximum potential exposure for chargebacks would not exceed the total amount of merchant transactions processed through Visa, MasterCard and Discover for the last six months; and other matters relating to the Corporation and the securities that it may offer from time to time or steps it may take to manage the risk of these securities. The foregoing is not an exclusive list of all forward-looking statements the Corporation makes. These statements are not guarantees of future results or performance and involve certain risks, uncertainties and assumptions that are difficult to predict and are often beyond the Corporation's control. Actual outcomes and results may differ materially from those expressed in, or implied by, any of these forward-looking statements.
You should not place undue reliance on any forward-looking statement and should consider the following uncertainties and risks, as well as the risks and uncertainties more fully discussed elsewhere in this report, under Item 1A. Risk Factors of the Corporation's 2012 Annual Report on Form 10-K, and in any of the Corporation's subsequent Securities and Exchange Commission filings: the Corporation's ability to resolve representations and warranties repurchase claims made by monolines and private-label and other investors, including as a result of any adverse court rulings, and the chance that the Corporation could face related servicing, securities, fraud, indemnity or other claims from one or more of the government-sponsored enterprises, monolines or private-label and other investors; the possibility that future representations and warranties losses may occur in excess of the Corporation's recorded liability and estimated range of possible loss for its representations and warranties exposures; the possibility that the Corporation may not collect mortgage insurance claims; the possible impact of a future FASB standard on accounting for credit losses; uncertainties about the financial stability of several countries in the EU, the increasing risk that those countries may default on their sovereign debt or exit the EU and related stresses on financial markets, the Euro and the EU and the Corporation's exposures to such risks, including direct, indirect and operational; the possibility of future inquiries or investigations regarding pending or completed foreclosure activities; the uncertainty regarding the timing and final substance of any capital or liquidity standards, including the final Basel 3 requirements and their
3
implementation for U.S. banks through rulemaking by the Federal Reserve, including anticipated requirements to hold higher levels of regulatory capital, liquidity and meet higher regulatory capital ratios as a result of final Basel 3 or other capital or liquidity standards; the negative impact of the Financial Reform Act on the Corporation's businesses and earnings, including as a result of additional regulatory interpretation and rulemaking and the success of the Corporation's actions to mitigate such impacts; adverse changes to the Corporation's credit ratings from the major credit rating agencies; estimates of the fair value of certain of the Corporation's assets and liabilities; unexpected claims, damages and fines resulting from pending or future litigation and regulatory proceedings; the Corporation's ability to fully realize the cost savings and other anticipated benefits from Project New BAC, including in accordance with currently anticipated timeframes; and other similar matters.
Forward-looking statements speak only as of the date they are made, and the Corporation undertakes no obligation to update any forward-looking statement to reflect the impact of circumstances or events that arise after the date the forward-looking statement was made.
Notes to the Consolidated Financial Statements referred to in the Management's Discussion and Analysis of Financial Condition and Results of Operations (MD&A) are incorporated by reference into the MD&A. Certain prior period amounts have been reclassified to conform to current period presentation. Throughout the MD&A, the Corporation uses certain acronyms and abbreviations which are defined in the Glossary.
Executive Summary |
Business Overview |
The Corporation is a Delaware corporation, a bank holding company and a financial holding company. When used in this report, "the Corporation" may refer to Bank of America Corporation individually, Bank of America Corporation and its subsidiaries, or certain of Bank of America Corporation's subsidiaries or affiliates. Our principal executive offices are located in Charlotte, North Carolina. Through our banking and various nonbanking subsidiaries throughout the U.S. and in international markets, we provide a diversified range of banking and nonbanking financial services and products through five business segments: Consumer & Business Banking (CBB), Consumer Real Estate Services (CRES), Global Banking, Global Markets and Global Wealth & Investment Management (GWIM), with the remaining operations recorded in All Other. We operate our banking activities primarily under two national bank charters: Bank of America, National Association (Bank of America, N.A. or BANA) and FIA Card Services, National Association (FIA Card Services, N.A. or FIA). At March 31, 2013, the Corporation had approximately $2.2 trillion in assets and approximately 263,000 full-time equivalent employees.
As of March 31, 2013, we operated in all 50 states, the District of Columbia and more than 40 countries. Our retail banking footprint covers approximately 80 percent of the U.S. population and we serve approximately 52 million consumer and small business relationships with approximately 5,400 banking centers, 16,300 ATMs, nationwide call centers, and leading online and mobile banking platforms. We offer industry-leading support to more than three million small business owners. We are a global leader in corporate and investment banking and trading across a broad range of asset classes serving corporations, governments, institutions and individuals around the world.
4
Table 1 provides selected consolidated financial data for the three months ended March 31, 2013 and 2012, and at March 31, 2013 and December 31, 2012.
Table 1 | |||||||
Selected Financial Data | |||||||
Three Months Ended March 31 |
|||||||
(Dollars in millions, except per share information) |
2013 |
2012 |
|||||
Income statement |
|||||||
Revenue, net of interest expense (FTE basis) (1)
|
$ |
23,408 |
$ |
22,485 |
|||
Net income |
1,483 |
653 |
|||||
Diluted earnings per common share |
0.10 |
0.03 |
|||||
Dividends paid per common share |
0.01 |
0.01 |
|||||
Performance ratios |
|||||||
Return on average assets |
0.27 |
% |
0.12 |
% |
|||
Return on average tangible shareholders' equity (1)
|
3.69 |
1.67 |
|||||
Efficiency ratio (FTE basis) (1)
|
83.31 |
85.13 |
|||||
Asset quality |
|||||||
Allowance for loan and lease losses at period end |
$ |
22,441 |
$ |
32,211 |
|||
Allowance for loan and lease losses as a percentage of total loans and leases outstanding at period end (2)
|
2.49 |
% |
3.61 |
% |
|||
Nonperforming loans, leases and foreclosed properties at period end (2)
|
$ |
22,842 |
$ |
27,790 |
|||
Net charge-offs (3)
|
2,517 |
4,056 |
|||||
Annualized net charge-offs as a percentage of average loans and leases outstanding (2, 3)
|
1.14 |
% |
1.80 |
% |
|||
Annualized net charge-offs as a percentage of average loans and leases outstanding, excluding the purchased credit-impaired loan portfolio (2)
|
1.18 |
1.87 |
|||||
Annualized net charge-offs and purchased credit-impaired write-offs as a percentage of average loans and leases outstanding (2, 4)
|
1.52 |
1.80 |
|||||
Ratio of the allowance for loan and lease losses at period end to annualized net charge-offs (3)
|
2.20 |
1.97 |
|||||
Ratio of the allowance for loan and lease losses at period end to annualized net charge-offs, excluding the purchased credit-impaired loan portfolio |
1.76 |
1.43 |
|||||
Ratio of the allowance for loan and lease losses at period end to annualized net charge-offs and purchased credit-impaired write-offs (4)
|
1.65 |
1.97 |
|||||
March 31 2013 |
December 31 2012 |
||||||
Balance sheet |
|||||||
Total loans and leases |
$ |
911,592 |
$ |
907,819 |
|||
Total assets |
2,174,819 |
2,209,974 |
|||||
Total deposits |
1,095,183 |
1,105,261 |
|||||
Total common shareholders' equity |
218,513 |
218,188 |
|||||
Total shareholders' equity |
237,293 |
236,956 |
|||||
Capital ratios (5)
|
|||||||
Tier 1 common capital |
10.49 |
% |
11.06 |
% |
|||
Tier 1 capital |
12.22 |
12.89 |
|||||
Total capital |
15.50 |
16.31 |
|||||
Tier 1 leverage |
7.49 |
7.37 |
|||||
(1) |
Fully taxable-equivalent (FTE) basis, return on average tangible shareholders' equity and the efficiency ratio are non-GAAP financial measures. Other companies may define or calculate these measures differently. For additional information on these measures and ratios, and a corresponding reconciliation to GAAP financial measures, see Supplemental Financial Data on page 16.
|
(2) |
Balances and ratios do not include loans accounted for under the fair value option. For additional exclusions from nonperforming loans, leases and foreclosed properties, see Consumer Portfolio Credit Risk Management – Nonperforming Consumer Loans and Foreclosed Properties Activity on page 89 and corresponding Table 38, and Commercial Portfolio Credit Risk Management – Nonperforming Commercial Loans, Leases and Foreclosed Properties Activity on page 98 and corresponding Table 47.
|
(3) |
Net charge-offs exclude $839 million of write-offs in the purchased credit-impaired loan portfolio for the three months ended March 31, 2013. These write-offs decreased the purchased credit-impaired valuation allowance included as part of the allowance for loan and lease losses. For information on purchased credit-impaired write-offs, see Consumer Portfolio Credit Risk Management – Purchased Credit-impaired Loan Portfolio on page 83.
|
(4) |
There were no write-offs of purchased credit-impaired loans in the three months ended March 31, 2012.
|
(5) |
Presents capital ratios in accordance with the Basel 1 – 2013 Rules, which includes the Market Risk Final Rule at March 31, 2013. Basel 1 did not include the Basel 1 – 2013 Rules at December 31, 2012.
|
5
First Quarter 2013 Economic and Business Environment |
In the U.S., economic growth accelerated in the first quarter of 2013 and many key economic factors continued to gradually improve. With economic growth suppressed in the fourth quarter of 2012 by a combination of weather-related events and an unusually sharp decline in federal defense expenditures, some acceleration had been anticipated, but actual economic performance exceeded consensus expectations in the first quarter, especially in light of fiscal cliff related anxiety. Consumer spending advanced at its most rapid pace in at least two years, with strong merchandise sales even as service spending continued to lag. In addition to the continued improvement of the housing sector and a pickup in business spending, real gross domestic product grew approximately 2.5 percent annualized during the first quarter of 2013. Employment gains were steady during the quarter, while the unemployment rate continued its gradual decline to 7.6 percent at March 31, 2013.
The Board of Governors of the Federal Reserve System (Federal Reserve) continued its $40 billion in monthly purchases of agency mortgage-backed securities (MBS), began the $45 billion in monthly purchases of long-term U.S. Treasury securities and maintained its forward guidance on interest rates expressed in terms of economic thresholds, which began in December 2012. Following the compromise on the fiscal cliff reached in early 2013, which allowed the two-year reduction in payroll taxes to expire and put in place select income tax rate hikes, attention turned to extending the continuing resolution authorizing federal spending and avoiding the automatic spending cuts (the sequestration) mandated if deficit reduction could not be achieved by other means. The continuing resolution was extended, avoiding any government shutdown and sequestration became effective on March 1, 2013. However, we expect that the impact of sequestration will likely be modest. Despite remaining fiscal uncertainties and international economic difficulties, U.S. equities posted a strong quarter and long-term U.S. Treasury yields rose moderately early in the quarter, but reversed their gains late in the quarter.
International developments in the first quarter of 2013 reflected increased economic momentum. Most European economies continued to contract but at a diminishing pace. As a whole, yield spreads for periphery nations continued to benefit from the 2012 European Central Bank clarification of its role as lender of last resort. Japan's economy also improved as the impacts of a depreciating Yen and expectations of increased monetary accommodation proved beneficial. China's economy exhibited signs of stabilization, while other emerging Asian economies have accelerated. For more information on our international exposure, see Non-U.S. Portfolio on page 104.
Recent Events |
MBIA Settlement
On May 7, 2013, we entered into our previously announced comprehensive settlement (MBIA Settlement) with MBIA Inc. and certain of its affiliates (MBIA) to resolve all outstanding litigation between the parties, as well as other claims between the parties, including outstanding and potential claims from MBIA related to alleged representations and warranties breaches and other claims involving certain first- and second-lien residential mortgage-backed securities (RMBS) trusts for which MBIA provided financial guarantee insurance, certain of which claims are the subject of litigation. As of March 31, 2013, the mortgages (first- and second-lien) in RMBS trusts covered by the MBIA Settlement had an original principal balance of $54.8 billion and an unpaid principal balance of $19.2 billion.
Under the MBIA Settlement, all pending litigation between the parties will be dismissed and each party will receive a global release of those claims. The Corporation will make a settlement payment to MBIA of $1.565 billion in cash and transfer to MBIA approximately $95 million in fair market value of notes issued by MBIA and currently held by the Corporation. In addition, MBIA will issue to the Corporation warrants to purchase up to approximately 4.9 percent of MBIA's currently outstanding common stock, at an exercise price of $9.59 per share, which may be exercised at any time prior to May 2018. In addition, we will provide a senior secured $500 million credit facility to an affiliate of MBIA.
The parties will also terminate various credit default swap (CDS) transactions entered into between us and a MBIA-affiliate, LaCrosse Financial Products, LLC, and guaranteed by MBIA, which constitute all of the outstanding CDS protection agreements purchased by us from MBIA on commercial mortgage-backed securities (CMBS). Collectively, those CDS transactions had a notional value of $7.4 billion and a fair value of $813 million as of March 31, 2013. The parties will also terminate certain other trades in order to close out positions between the parties; the termination of these trades will not have a material impact on the financial statements.
6
The cost associated with the MBIA Settlement and related matters is covered by pre-existing reserves and additional charges recorded as of March 31, 2013. Because the MBIA Settlement occurred after quarter end, but before the Corporation filed this Form 10-Q and the MBIA Settlement related to conditions that existed at March 31, 2013, it is considered to be a subsequent event under the applicable accounting guidance. Accordingly, the Corporation recorded approximately $1.6 billion of pre-tax additional charges in the first quarter of 2013, of which approximately $1.3 billion is litigation expense and $300 million is a related receivable write-down recorded in other noninterest income. The litigation expense includes charges related to the MBIA Settlement as well as adjustments to litigation reserves for other monoline matters, primarily as a result of the experience gained in connection with the MBIA Settlement. For additional information, see Global Markets – Sales and Trading Revenue on page 40, Off-Balance Sheet Arrangements and Contractual Obligations – Representations and Warranties on page 45, Commercial Portfolio Credit Risk Management – Monoline Exposure on page 100, Note 8 – Representations and Warranties Obligations and Corporate Guarantees and Note 11 – Commitments and Contingencies to the Consolidated Financial Statements.
Countrywide RMBS Class Action Settlement
On April 16, 2013, we reached an agreement in principle to settle three class action lawsuits involving certain Countrywide Financial Corporation (Countrywide) entities and various institutional and individual plaintiffs (Maine State Retirement System v. Countrywide Financial Corporation, David H. Luther v. Countrywide Financial Corporation, and Western Conference of Teamsters Pension Trust Fund v. Countrywide Financial Corporation) concerning RMBS issued by subsidiaries of Countrywide (RMBS Settlement).
The first of these class action lawsuits was filed in November 2007, and they collectively concern the disclosures that were made in connection with 429 Countrywide RMBS offerings issued from 2005 through 2007. The original principal balance of the RMBS involved in these cases exceeded $350 billion, and the unpaid principal balance of these securities as of February 2013, excluding securities that are the subject of filed or threatened individual actions, was $95 billion.
Under the RMBS Settlement, the lawsuits will be dismissed in their entirety and defendants will receive a global release in exchange for a settlement payment of $500 million. The settlement will not affect investors' rights to receive trust distributions upon final court approval of the $8.5 billion settlement with Bank of New York Mellon, as trustee. The RMBS Settlement is subject to final court approval. There can be no assurance that final court approval of the RMBS Settlement will be obtained or that all conditions to such settlement will be satisfied. If approved, and all class members who have not already filed or threatened individual suits participate, the settlement is expected to resolve approximately 80 percent of the unpaid principal balance of the Countrywide-issued RMBS as to which securities disclosure claims have been filed or threatened, and approximately 70 percent of the unpaid principal balance of all RMBS as to which securities disclosure claims have been filed or threatened as to all Bank of America-related entities. The amounts to be paid in the RMBS Settlement are covered by a combination of pre-existing litigation reserves and additional litigation reserves recorded in the first quarter of 2013.
Capital and Liquidity Related Matters
On March 14, 2013, the Federal Reserve announced the results of its 2013 Comprehensive Capital Analysis and Review project (CCAR). The Federal Reserve's stress scenario projections for the Corporation estimated a minimum Tier 1 common capital ratio under the Basel 1 – 2013 Rules, which includes the Market Risk Final Rule, based on the 2013 capital plan, of 6.0 percent under severe adverse economic conditions with all proposed capital actions through the end of 2014, exceeding the five percent reference rate for all institutions involved in the CCAR. The capital plan that the Corporation submitted to the Federal Reserve included a request to repurchase up to $5.0 billion of common stock over the next four quarters, beginning in the second quarter of 2013, the redemption of approximately $5.5 billion in preferred stock and the continuation of the quarterly common stock dividend at $0.01 per share. The Federal Reserve did not object to the Corporation's 2013 capital plan, including all proposed capital actions. On April 1, 2013, a notice of redemption was sent to holders of the Corporation's 8.625% Non-Cumulative Preferred Stock, Series 8, including holders of depositary shares representing interests therein, to redeem approximately $2.7 billion of the Series 8 Preferred Stock on May 28, 2013. On May 1, 2013, pursuant to the capital plan, we redeemed approximately $2.9 billion of our 8.20% Non-Cumulative Preferred Stock, Series H. For additional information, see Capital Management – Regulatory Capital on page 58.
7
Sales of Mortgage Servicing Rights
As previously disclosed, during the first quarter of 2013, Bank of America entered into definitive agreements with three counterparties to sell the servicing rights on certain residential mortgage loans serviced for Fannie Mae (FNMA), Freddie Mac (FHLMC), the Government National Mortgage Association (GNMA) and certain private-label securitizations. In addition, on April 1, 2013, we entered into a definitive agreement with an additional counterparty to sell mortgage servicing rights (MSRs) for additional loans serviced for FNMA. In total, the aggregate unpaid principal balance of these serviced loans is approximately $327 billion. The sales involve 2.2 million loans serviced by us as of the applicable contract dates, including approximately 245,000 residential mortgage loans and approximately 24,000 home equity loans that were 60 days or more past due.
The transfers of servicing rights are expected to occur in stages throughout 2013, and began in the first quarter. Certain of the transfers are subject to the approval or consent of certain third parties. There is no assurance that all the required approvals and consents will be obtained, and accordingly, some of these transfers may not be consummated. For additional information, see CRES – Mortgage Servicing Rights on page 35.
Fannie Mae Settlement
As previously disclosed, on January 6, 2013, we entered into an agreement with FNMA to resolve substantially all outstanding and potential repurchase and certain other claims relating to the origination, sale and delivery of residential mortgage loans originated and sold directly to FNMA from January 1, 2000 through December 31, 2008 by entities related to Countrywide and BANA. As part of this agreement, in the first quarter of 2013, we made a cash payment to FNMA of $3.6 billion and also repurchased for $6.6 billion certain residential mortgage loans that had previously been sold to FNMA, which we have valued at less than the purchase price. The Corporation was fully reserved at December 31, 2012 for the settlement with FNMA. For additional information, see Note 8 – Representations and Warranties Obligations and Corporate Guarantees to the Consolidated Financial Statements and to the Consolidated Financial Statements of the Corporation's 2012 Annual Report on Form 10-K, and Consumer Portfolio Credit Risk Management on page 72.
8
Performance Overview |
Net income was $1.5 billion, or $0.10 per diluted share for the three months ended March 31, 2013 compared to $653 million, or $0.03 per diluted share for the same period in 2012. The following highlights the significant changes.
Net interest income on a fully taxable-equivalent (FTE) basis decreased $178 million to $10.9 billion for the three months ended March 31, 2013. The decrease was primarily due to the impact of lower consumer loan balances as well as lower asset yields, partially offset by reductions in long-term debt balances, lower rates paid on deposits and improved trading-related net interest income.
Noninterest income increased $1.1 billion to $12.5 billion for the three months ended March 31, 2013. The most significant drivers of the increase were lower negative fair value adjustments on structured liabilities of $90 million compared to $3.3 billion and debit valuation adjustment (DVA) losses on derivatives, net of hedges, of $54 million compared to $1.5 billion for the three months ended March 31, 2013 and 2012. These items were partially offset by $1.2 billion of gains related to subordinated debt repurchases and exchanges of trust preferred securities in the year-ago quarter, lower mortgage banking income and lower net gains on sales of debt securities of $68 million compared to $752 million.
The provision for credit losses decreased $705 million to $1.7 billion for the three months ended March 31, 2013. The improvement was primarily in the home loans portfolio, due to improved portfolio trends as well as the impact of increased home prices.
Noninterest expense increased $359 million for the three months ended March 31, 2013. The most significant driver of the increase was higher litigation expense primarily associated with the MBIA Settlement, partially offset by cost savings associated with Project New BAC initiatives to streamline processes.
Income tax expense was $501 million on $2.0 billion of pre-tax income for the three months ended March 31, 2013 compared to $66 million on $719 million of pre-tax income and resulted in an effective tax rate of 25.3 percent compared to 9.2 percent.
For additional summary information on the Corporation's results, see Financial Highlights on page 10 and Business Segment Operations on page 25.
Table 2 | |||||||
Summary Income Statement | |||||||
Three Months Ended March 31 |
|||||||
(Dollars in millions) |
2013 |
2012 |
|||||
Net interest income (FTE basis) (1)
|
$ |
10,875 |
$ |
11,053 |
|||
Noninterest income |
12,533 |
11,432 |
|||||
Total revenue, net of interest expense (FTE basis) (1)
|
23,408 |
22,485 |
|||||
Provision for credit losses |
1,713 |
2,418 |
|||||
Noninterest expense |
19,500 |
19,141 |
|||||
Income before income taxes |
2,195 |
926 |
|||||
Income tax expense (FTE basis) (1)
|
712 |
273 |
|||||
Net income |
1,483 |
653 |
|||||
Preferred stock dividends |
373 |
325 |
|||||
Net income applicable to common shareholders |
$ |
1,110 |
$ |
328 |
|||
Per common share information |
|||||||
Earnings |
$ |
0.10 |
$ |
0.03 |
|||
Diluted earnings |
0.10 |
0.03 |
|||||
(1) |
FTE basis is a non-GAAP financial measure. For additional information on this measure and for a corresponding reconciliation to GAAP financial measures, see Supplemental Financial Data on page 16.
|
9
Financial Highlights |
Net Interest Income
Net interest income on a FTE basis decreased $178 million to $10.9 billion for the three months ended March 31, 2013 compared to the same period in 2012. The decrease was primarily due to the impact of lower consumer loan balances as well as lower asset yields driven by the low rate environment, partially offset by reductions in long-term debt balances, lower rates paid on deposits and improved trading-related net interest income. The net interest yield on a FTE basis decreased eight basis points (bps) for the three months ended March 31, 2013 compared to the same period in 2012 as the yield continued to be under pressure due to the aforementioned items.
Noninterest Income
Table 3 | |||||||
Noninterest Income | |||||||
Three Months Ended March 31 |
|||||||
(Dollars in millions) |
2013 |
2012 |
|||||
Card income |
$ |
1,410 |
$ |
1,457 |
|||
Service charges |
1,799 |
1,912 |
|||||
Investment and brokerage services |
3,027 |
2,876 |
|||||
Investment banking income |
1,535 |
1,217 |
|||||
Equity investment income |
563 |
765 |
|||||
Trading account profits |
2,989 |
2,075 |
|||||
Mortgage banking income |
1,263 |
1,612 |
|||||
Gains on sales of debt securities |
68 |
752 |
|||||
Other loss |
(112 |
) |
(1,194 |
) |
|||
Net impairment losses recognized in earnings on AFS debt securities |
(9 |
) |
(40 |
) |
|||
Total noninterest income |
$ |
12,533 |
$ |
11,432 |
|||
Noninterest income increased $1.1 billion to $12.5 billion for the three months ended March 31, 2013 compared to the same period in 2012. The following highlights the significant changes.
• |
Service charges decreased $113 million primarily due to a shift in product mix on consumer checking accounts and lower commercial banking fees.
|
• |
Investment and brokerage services income increased $151 million primarily driven by higher market levels and long-term assets under management (AUM) flows.
|
• |
Investment banking income increased $318 million due to an increase in capital markets underwriting and advisory fees.
|
• |
Equity investment income decreased $202 million due primarily to lower gains in our Global Principal Investments (GPI) portfolio.
|
• |
Trading account profits increased $914 million. Net DVA losses on derivatives were $54 million for the three months ended March 31, 2013 compared to $1.5 billion a year ago. Excluding net DVA, trading account profits decreased $491 million primarily due to decreases within our fixed income, currencies and commodities (FICC) businesses reflecting less favorable market conditions primarily in credit-related products and commodities.
|
• |
Mortgage banking income decreased $349 million primarily driven by a decrease in servicing income due to a smaller servicing portfolio and to a lesser extent, a decline in core production income.
|
• |
Other loss of $112 million in the current-year period decreased from a loss a year ago of $1.2 billion primarily driven by lower negative fair value adjustments on our structured liabilities of $90 million compared to $3.3 billion a year ago, partially offset by $1.2 billion of gains related to subordinated debt repurchases and exchanges of trust preferred securities a year ago.
|
10
Provision for Credit Losses
The provision for credit losses decreased $705 million to $1.7 billion for the three months ended March 31, 2013 compared to the same period in 2012. For the three months ended March 31, 2013, the provision for credit losses was $804 million lower than net charge-offs, resulting in a reduction in the allowance for credit losses primarily due to continued improvement in the home loans portfolio, as well as improvement in the credit card portfolio. Absent unexpected deterioration in the economy, we expect reductions in the allowance for credit losses to continue in the near term, though at a slower pace than in 2012.
Net charge-offs totaled $2.5 billion, or 1.14 percent of average loans and leases for the three months ended March 31, 2013 compared to $4.1 billion, or 1.80 percent for the same period in 2012. The decrease in net charge-offs was primarily driven by credit quality improvement across all portfolios. For more information on the provision for credit losses, see Provision for Credit Losses on page 108.
Noninterest Expense
Table 4 | |||||||
Noninterest Expense | |||||||
Three Months Ended March 31 |
|||||||
(Dollars in millions) |
2013 |
2012 |
|||||
Personnel |
$ |
9,891 |
$ |
10,188 |
|||
Occupancy |
1,154 |
1,142 |
|||||
Equipment |
550 |
611 |
|||||
Marketing |
429 |
465 |
|||||
Professional fees |
649 |
783 |
|||||
Amortization of intangibles |
276 |
319 |
|||||
Data processing |
812 |
856 |
|||||
Telecommunications |
409 |
400 |
|||||
Other general operating |
5,330 |
4,377 |
|||||
Total noninterest expense |
$ |
19,500 |
$ |
19,141 |
|||
Noninterest expense increased $359 million to $19.5 billion for the three months ended March 31, 2013 compared to same period in 2012. The increase was driven by a $953 million increase in other general operating expense primarily due to higher litigation expense associated with the MBIA Settlement, partially offset by a $297 million decrease in personnel expense as we continue to streamline processes and achieve cost savings. Noninterest expense also included $893 million of annual expense associated with retirement-eligible stock compensation for the three months ended March 31, 2013 compared to $892 million in the year ago quarter.
In connection with Project New BAC, which was first announced in the third quarter of 2011, we continue to achieve cost savings in certain noninterest expense categories as we further streamline workflows, simplify processes and align expenses with our overall strategic plan and operating principles. We expect total cost savings from Project New BAC to reach $8 billion per year on an annualized basis, or $2 billion per quarter, by mid-2015. We expect to achieve approximately $1.5 billion in quarterly cost savings by the fourth quarter of 2013, representing 75 percent of the quarterly target.
Income Tax Expense
Income tax expense was $501 million on pre-tax income of $2.0 billion for the three months ended March 31, 2013 compared to $66 million on pre-tax income of $719 million a year ago and resulted in an effective tax rate of 25.3 percent compared to 9.2 percent.
The effective tax rate for the three months ended March 31, 2013 was primarily driven by our recurring tax preference items, and the effective tax rate in the year-ago quarter was primarily driven by discrete tax benefits and recurring tax preference items.
A proposal to further reduce the U.K. corporate income tax rate by three percent to 20 percent is expected to be enacted in July 2013. It is expected that two percent of the reduction will be effective on April 1, 2014 and the additional one percent reduction on April 1, 2015. These reductions would favorably affect income tax expense on future U.K. earnings but also would require us to remeasure, in the period of enactment, our U.K. net deferred tax assets using the lower tax rates. Upon enactment, we would expect to record a charge to income tax expense of nearly $1.2 billion for these aggregate reductions, assuming no change in the deferred tax asset balance.
11
Balance Sheet Overview | |||||||||||||||
Table 5 | |||||||||||||||
Selected Balance Sheet Data | |||||||||||||||
Average Balance |
|||||||||||||||
March 31 2013 |
December 31 2012 |
Three Months Ended March 31 |
|||||||||||||
(Dollars in millions) |
2013 |
2012 |
|||||||||||||
Assets |
|||||||||||||||
Federal funds sold and securities borrowed or purchased under agreements to resell |
$ |
220,623 |
$ |
219,924 |
$ |
237,463 |
$ |
233,061 |
|||||||
Trading account assets |
223,028 |
227,775 |
239,964 |
193,359 |
|||||||||||
Debt securities |
354,709 |
360,331 |
356,399 |
341,619 |
|||||||||||
Loans and leases |
911,592 |
907,819 |
906,259 |
913,722 |
|||||||||||
Allowance for loan and lease losses |
(22,441 |
) |
(24,179 |
) |
(23,593 |
) |
(33,210 |
) |
|||||||
All other assets |
487,308 |
518,304 |
495,938 |
538,623 |
|||||||||||
Total assets |
$ |
2,174,819 |
$ |
2,209,974 |
$ |
2,212,430 |
$ |
2,187,174 |
|||||||
Liabilities |
|||||||||||||||
Deposits |
$ |
1,095,183 |
$ |
1,105,261 |
$ |
1,075,280 |
$ |
1,030,112 |
|||||||
Federal funds purchased and securities loaned or sold under agreements to repurchase |
248,149 |
293,259 |
300,938 |
256,405 |
|||||||||||
Trading account liabilities |
90,547 |
73,587 |
92,047 |
71,872 |
|||||||||||
Short-term borrowings |
42,148 |
30,731 |
36,706 |
36,651 |
|||||||||||
Long-term debt |
279,641 |
275,585 |
273,999 |
363,518 |
|||||||||||
All other liabilities |
181,858 |
194,595 |
196,465 |
196,050 |
|||||||||||
Total liabilities |
1,937,526 |
1,973,018 |
1,975,435 |
1,954,608 |
|||||||||||
Shareholders' equity |
237,293 |
236,956 |
236,995 |
232,566 |
|||||||||||
Total liabilities and shareholders' equity |
$ |
2,174,819 |
$ |
2,209,974 |
$ |
2,212,430 |
$ |
2,187,174 |
|||||||
Period-end balance sheet amounts may vary from average balance sheet amounts due to liquidity and balance sheet management activities, primarily involving our portfolios of highly liquid assets. These portfolios are designed to ensure the adequacy of capital while enhancing our ability to manage liquidity requirements for the Corporation and our customers, and to position the balance sheet in accordance with the Corporation's risk appetite. The execution of these activities requires the use of balance sheet and capital-related limits including spot, average and risk-weighted asset limits, particularly within the market-making activities of our trading businesses. One of our key regulatory metrics, Tier 1 leverage ratio, is calculated based on adjusted quarterly average total assets.
12
Assets
At March 31, 2013, total assets were approximately $2.2 trillion, a decrease of $35.2 billion, or two percent, from December 31, 2012. This decrease was driven by declines in cash and cash equivalent balances; other earning assets primarily driven by a decrease in margin loan balances; consumer loan balances due to paydowns and charge-offs outpacing new originations; debt securities as sales, maturities and paydowns outpaced purchases; and trading account assets primarily due to reduced holdings of U.S. government and agency securities. These decreases were partially offset by higher commercial loan balances.
Average total assets increased $25.3 billion for the three months ended March 31, 2013 compared to the same period in 2012. The increase was driven by higher trading account assets primarily due to increases in short-term U.S. government and agency securities, an increase in debt securities primarily driven by net purchases of agency MBS, higher commercial loan balances, and lower allowance for loan and lease losses primarily due to improvements in the home loans and credit card portfolios. These increases were partially offset by declines in consumer loan balances due to paydowns and charge-offs outpacing new originations, cash and cash equivalent balances, and derivative dealer assets.
Liabilities and Shareholders' Equity
At March 31, 2013, total liabilities were approximately $1.9 trillion, a decrease of $35.5 billion, or two percent, from December 31, 2012. This decrease was driven by lower securities sold under agreements to repurchase due to lower matched-book activity and trading inventory, and a decline in noninterest-bearing deposits primarily due to the expiration of the Transaction Account Guarantee Program at December 31, 2012. These decreases were partially offset by higher trading account liabilities due to increased short positions in equity securities.
Average total liabilities increased $20.8 billion for the three months ended March 31, 2013 compared to the same period in 2012. The increase was primarily driven by growth in deposits driven by higher client balances, higher securities loaned or sold under agreements to repurchase driven by funding of trading inventory resulting from customer demand, and higher trading account liabilities. These increases were partially offset by planned reductions in long-term debt.
At March 31, 2013, shareholders' equity was $237.3 billion, an increase of $337 million from December 31, 2012 driven by earnings, partially offset by a decrease in unrealized gains in accumulated other comprehensive income (OCI) on available-for-sale (AFS) debt securities.
Average shareholders' equity increased $4.4 billion for the three months ended March 31, 2013 compared to the same period in 2012 driven by earnings, an increase in unrealized gains in accumulated OCI on AFS debt securities, and common stock issued under employee benefit plans and in connection with exchanges of preferred stock and trust preferred securities in 2012.
13
Table 6 |
|||||||||||||||||||
Selected Quarterly Financial Data |
|||||||||||||||||||
2013 Quarter |
2012 Quarters |
||||||||||||||||||
(In millions, except per share information) |
First |
Fourth |
Third |
Second |
First |
||||||||||||||
Income statement |
|||||||||||||||||||
Net interest income |
$ |
10,664 |
$ |
10,324 |
$ |
9,938 |
$ |
9,548 |
$ |
10,846 |
|||||||||
Noninterest income |
12,533 |
8,336 |
10,490 |
12,420 |
11,432 |
||||||||||||||
Total revenue, net of interest expense |
23,197 |
18,660 |
20,428 |
21,968 |
22,278 |
||||||||||||||
Provision for credit losses |
1,713 |
2,204 |
1,774 |
1,773 |
2,418 |
||||||||||||||
Noninterest expense |
19,500 |
18,360 |
17,544 |
17,048 |
19,141 |
||||||||||||||
Income (loss) before income taxes |
1,984 |
(1,904 |
) |
1,110 |
3,147 |
719 |
|||||||||||||
Income tax expense (benefit) |
501 |
(2,636 |
) |
770 |
684 |
66 |
|||||||||||||
Net income |
1,483 |
732 |
340 |
2,463 |
653 |
||||||||||||||
Net income (loss) applicable to common shareholders |
1,110 |
367 |
(33 |
) |
2,098 |
328 |
|||||||||||||
Average common shares issued and outstanding |
10,799 |
10,777 |
10,776 |
10,776 |
10,651 |
||||||||||||||
Average diluted common shares issued and outstanding (1)
|
11,155 |
10,885 |
10,776 |
11,556 |
10,762 |
||||||||||||||
Performance ratios |
|||||||||||||||||||
Return on average assets |
0.27 |
% |
0.13 |
% |
0.06 |
% |
0.45 |
% |
0.12 |
% |
|||||||||
Four quarter trailing return on average assets (2)
|
0.23 |
0.19 |
0.25 |
0.51 |
n/m |
||||||||||||||
Return on average common shareholders' equity |
2.06 |
0.67 |
n/m |
3.89 |
0.62 |
||||||||||||||
Return on average tangible common shareholders' equity (3)
|
3.12 |
1.01 |
n/m |
5.95 |
0.95 |
||||||||||||||
Return on average tangible shareholders' equity (3)
|
3.69 |
1.77 |
0.84 |
6.16 |
1.67 |
||||||||||||||
Total ending equity to total ending assets |
10.91 |
10.72 |
11.02 |
10.92 |
10.66 |
||||||||||||||
Total average equity to total average assets |
10.71 |
10.79 |
10.86 |
10.73 |
10.63 |
||||||||||||||
Dividend payout |
9.75 |
29.33 |
n/m |
5.60 |
34.97 |
||||||||||||||
Per common share data |
|||||||||||||||||||
Earnings |
$ |
0.10 |
$ |
0.03 |
$ |
0.00 |
$ |
0.19 |
$ |
0.03 |
|||||||||
Diluted earnings (1)
|
0.10 |
0.03 |
0.00 |
0.19 |
0.03 |
||||||||||||||
Dividends paid |
0.01 |
0.01 |
0.01 |
0.01 |
0.01 |
||||||||||||||
Book value |
20.19 |
20.24 |
20.40 |
20.16 |
19.83 |
||||||||||||||
Tangible book value (3)
|
13.36 |
13.36 |
13.48 |
13.22 |
12.87 |
||||||||||||||
Market price per share of common stock |
|||||||||||||||||||
Closing |
$ |
12.18 |
$ |
11.61 |
$ |
8.83 |
$ |
8.18 |
$ |
9.57 |
|||||||||
High closing |
12.78 |
11.61 |
9.55 |
9.68 |
9.93 |
||||||||||||||
Low closing |
11.03 |
8.93 |
7.04 |
6.83 |
5.80 |
||||||||||||||
Market capitalization |
$ |
131,817 |
$ |
125,136 |
$ |
95,163 |
$ |
88,155 |
$ |
103,123 |
|||||||||
(1) |
Due to a net loss applicable to common shareholders for the third quarter of 2012, the impact of antidilutive equity instruments was excluded from diluted earnings per share and average diluted common shares. |
(2) |
Calculated as total net income for four consecutive quarters divided by annualized average assets for four consecutive quarters. |
(3) |
Tangible equity ratios and tangible book value per share of common stock are non-GAAP financial measures. Other companies may define or calculate these measures differently. For additional information on these ratios and for corresponding reconciliations to GAAP financial measures, see Supplemental Financial Data on page 16.
|
(4) |
For more information on the impact of the purchased credit-impaired loan portfolio on asset quality, see Consumer Portfolio Credit Risk Management on page 72.
|
(5) |
Includes the allowance for loan and lease losses and the reserve for unfunded lending commitments. |
(6) |
Balances and ratios do not include loans accounted for under the fair value option. For additional exclusions from nonperforming loans, leases and foreclosed properties, see Consumer Portfolio Credit Risk Management – Nonperforming Consumer Loans and Foreclosed Properties Activity on page 89 and corresponding Table 38, and Commercial Portfolio Credit Risk Management – Nonperforming Commercial Loans, Leases and Foreclosed Properties Activity on page 98 and corresponding Table 47.
|
(7) |
Primarily includes amounts allocated to the U.S. credit card and unsecured consumer lending portfolios in CBB, purchased credit-impaired loans and the non-U.S. credit card portfolio in All Other.
|
(8) |
Net charge-offs exclude $839 million, $1.1 billion and $1.7 billion of write-offs in the purchased credit-impaired loan portfolio for the first quarter of 2013 and the fourth and third quarters of 2012. These write-offs decreased the purchased credit-impaired valuation allowance included as part of the allowance for loan and lease losses. For more information on purchased credit-impaired write-offs, see Consumer Portfolio Credit Risk Management – Purchased Credit-impaired Loan Portfolio on page 83.
|
(9) |
There were no write-offs in the purchased credit-impaired loan portfolio for the second and first quarters of 2012. |
(10) |
Presents capital ratios in accordance with the Basel 1 – 2013 Rules at March 31, 2013. Basel 1 did not include the Basel 1 – 2013 Rules at December 31, 2012.
|
n/m = not meaningful
14
Table 6 |
|||||||||||||||||||
Selected Quarterly Financial Data (continued) |
|||||||||||||||||||
2013 Quarter |
2012 Quarters |
||||||||||||||||||
(Dollars in millions) |
First |
Fourth |
Third |
Second |
First |
||||||||||||||
Average balance sheet |
|||||||||||||||||||
Total loans and leases |
$ |
906,259 |
$ |
893,166 |
$ |
888,859 |
$ |
899,498 |
$ |
913,722 |
|||||||||
Total assets |
2,212,430 |
2,210,365 |
2,173,312 |
2,194,563 |
2,187,174 |
||||||||||||||
Total deposits |
1,075,280 |
1,078,076 |
1,049,697 |
1,032,888 |
1,030,112 |
||||||||||||||
Long-term debt |
273,999 |
277,894 |
291,684 |
333,173 |
363,518 |
||||||||||||||
Common shareholders' equity |
218,225 |
219,744 |
217,273 |
216,782 |
214,150 |
||||||||||||||
Total shareholders' equity |
236,995 |
238,512 |
236,039 |
235,558 |
232,566 |
||||||||||||||
Asset quality (4)
|
|||||||||||||||||||
Allowance for credit losses (5)
|
$ |
22,927 |
$ |
24,692 |
$ |
26,751 |
$ |
30,862 |
$ |
32,862 |
|||||||||
Nonperforming loans, leases and foreclosed properties (6)
|
22,842 |
23,555 |
24,925 |
25,377 |
27,790 |
||||||||||||||
Allowance for loan and lease losses as a percentage of total loans and leases outstanding (6)
|
2.49 |
% |
2.69 |
% |
2.96 |
% |
3.43 |
% |
3.61 |
% |
|||||||||
Allowance for loan and lease losses as a percentage of total nonperforming loans and leases (6)
|
102 |
107 |
111 |
127 |
126 |
||||||||||||||
Allowance for loan and lease losses as a percentage of total nonperforming loans and leases, excluding the PCI loan portfolio (5)
|
82 |
82 |
81 |
90 |
91 |
||||||||||||||
Amounts included in allowance that are excluded from nonperforming loans and leases (7)
|
$ |
10,690 |
$ |
12,021 |
$ |
13,978 |
$ |
16,327 |
$ |
17,006 |
|||||||||
Allowance as a percentage of total nonperforming loans and leases, excluding amounts included in the allowance that are excluded from nonperforming loans and leases (7)
|
53 |
% |
54 |
% |
52 |
% |
59 |
% |
60 |
% |
|||||||||
Net charge-offs (8)
|
$ |
2,517 |
$ |
3,104 |
$ |
4,122 |
$ |
3,626 |
$ |
4,056 |
|||||||||
Annualized net charge-offs as a percentage of average loans and leases outstanding (6, 8)
|
1.14 |
% |
1.40 |
% |
1.86 |
% |
1.64 |
% |
1.80 |
% |
|||||||||
Annualized net charge-offs as a percentage of average loans and leases outstanding, excluding the PCI loan portfolio (6)
|
1.18 |
1.44 |
1.93 |
1.69 |
1.87 |
||||||||||||||
Annualized net charge-offs and PCI write-offs as a percentage of average loans and leases outstanding (6, 9)
|
1.52 |
1.90 |
2.63 |
1.64 |
1.80 |
||||||||||||||
Nonperforming loans and leases as a percentage of total loans and leases outstanding (6)
|
2.44 |
2.52 |
2.68 |
2.70 |
2.85 |
||||||||||||||
Nonperforming loans, leases and foreclosed properties as a percentage of total loans, leases and foreclosed properties (6)
|
2.53 |
2.62 |
2.81 |
2.87 |
3.10 |
||||||||||||||
Ratio of the allowance for loan and lease losses at period end to annualized net charge-offs (8)
|
2.20 |
1.96 |
1.60 |
2.08 |
1.97 |
||||||||||||||
Ratio of the allowance for loan and lease losses at period end to annualized net charge-offs, excluding the PCI loan portfolio |
1.76 |
1.51 |
1.17 |
1.46 |
1.43 |
||||||||||||||
Ratio of the allowance for loan and lease losses at period end to annualized net charge-offs and PCI write-offs (9)
|
1.65 |
1.44 |
1.13 |
2.08 |
1.97 |
||||||||||||||
Capital ratios (period end) (10)
|
|||||||||||||||||||
Risk-based capital: |
|||||||||||||||||||
Tier 1 common capital |
10.49 |
% |
11.06 |
% |
11.41 |
% |
11.24 |
% |
10.78 |
% |
|||||||||
Tier 1 capital |
12.22 |
12.89 |
13.64 |
13.80 |
13.37 |
||||||||||||||
Total capital |
15.50 |
16.31 |
17.16 |
17.51 |
17.49 |
||||||||||||||
Tier 1 leverage |
7.49 |
7.37 |
7.84 |
7.84 |
7.79 |
||||||||||||||
Tangible equity (3)
|
7.78 |
7.62 |
7.85 |
7.73 |
7.48 |
||||||||||||||
Tangible common equity (3)
|
6.88 |
6.74 |
6.95 |
6.83 |
6.58 |
||||||||||||||
For footnotes see page 14.
15
Supplemental Financial Data |
We view net interest income and related ratios and analyses on a FTE basis, which when presented on a consolidated basis, are non-GAAP financial measures. We believe managing the business with net interest income on a FTE basis provides a more accurate picture of the interest margin for comparative purposes. To derive the FTE basis, net interest income is adjusted to reflect tax-exempt income on an equivalent before-tax basis with a corresponding increase in income tax expense. For purposes of this calculation, we use the federal statutory tax rate of 35 percent. This measure ensures comparability of net interest income arising from taxable and tax-exempt sources.
Certain performance measures including the efficiency ratio and net interest yield utilize net interest income (and thus total revenue) on a FTE basis. The efficiency ratio measures the costs expended to generate a dollar of revenue, and net interest yield measures the bps we earn over the cost of funds.
We also evaluate our business based on certain ratios that utilize tangible equity, a non-GAAP financial measure. Tangible equity represents an adjusted shareholders' equity or common shareholders' equity amount which has been reduced by goodwill and intangible assets (excluding MSRs), net of related deferred tax liabilities. These measures are used to evaluate our use of equity. In addition, profitability, relationship and investment models all use return on average tangible shareholders' equity as key measures to support our overall growth goals. These ratios are as follows:
• |
Return on average tangible common shareholders' equity measures our earnings contribution as a percentage of adjusted common shareholders' equity. The tangible common equity ratio represents adjusted common shareholders' equity divided by total assets less goodwill and intangible assets (excluding MSRs), net of related deferred tax liabilities. |
• |
Return on average tangible shareholders' equity measures our earnings contribution as a percentage of adjusted average total shareholders' equity. The tangible equity ratio represents adjusted total shareholders' equity divided by total assets less goodwill and intangible assets (excluding MSRs), net of related deferred tax liabilities. |
• |
Tangible book value per common share represents adjusted ending common shareholders' equity divided by ending common shares outstanding. |
The aforementioned supplemental data and performance measures are presented in Table 6.
We evaluate our business segment results based on measures that utilize return on average allocated capital, and prior to January 1, 2013, the return on average economic capital, both of which represent non-GAAP measures. These ratios are calculated as net income adjusted for cost of funds and earnings credits and certain expenses related to intangibles, divided by average allocated capital or average economic capital, as applicable. In addition, for purposes of goodwill impairment testing, the Corporation utilizes allocated equity as a proxy for the carrying value of its reporting units. Allocated equity for the business segments is comprised of allocated capital (or economic capital prior to 2013) plus capital for the portion of goodwill and intangibles specifically assigned to the business segment. For more information, see Business Segment Operations on page 25 and Note 9 – Goodwill and Intangible Assets to the Consolidated Financial Statements.
Tables 7 and 8 provide reconciliations of these non-GAAP financial measures with GAAP financial measures. We believe the use of these non-GAAP financial measures provides additional clarity in assessing the results of the Corporation and our segments. Other companies may define or calculate these measures and ratios differently.
Table 7 | |||||||||||||||||||
Quarterly Supplemental Financial Data and Reconciliations to GAAP Financial Measures | |||||||||||||||||||
2013 Quarter |
2012 Quarters |
||||||||||||||||||
(Dollars in millions) |
First |
Fourth |
Third |
Second |
First |
||||||||||||||
Fully taxable-equivalent basis data |
|||||||||||||||||||
Net interest income |
$ |
10,875 |
$ |
10,555 |
$ |
10,167 |
$ |
9,782 |
$ |
11,053 |
|||||||||
Total revenue, net of interest expense |
23,408 |
18,891 |
20,657 |
22,202 |
22,485 |
||||||||||||||
Net interest yield (1)
|
2.43 |
% |
2.35 |
% |
2.32 |
% |
2.21 |
% |
2.51 |
% |
|||||||||
Efficiency ratio |
83.31 |
97.19 |
84.93 |
76.79 |
85.13 |
||||||||||||||
(1) |
Calculation includes fees earned on overnight deposits placed with the Federal Reserve and, beginning in the third quarter of 2012, fees earned on deposits, primarily overnight, placed with certain non-U.S. central banks, of $33 million for the first quarter of 2013, and $42 million, $48 million, $52 million and $47 million for the fourth, third, second and first quarters of 2012, respectively.
|
16
Table 7 | |||||||||||||||||||
Quarterly Supplemental Financial Data and Reconciliations to GAAP Financial Measures (continued) | |||||||||||||||||||
2013 Quarter |
2012 Quarters |
||||||||||||||||||
(Dollars in millions) |
First |
Fourth |
Third |
Second |
First |
||||||||||||||
Reconciliation of net interest income to net interest income on a fully taxable-equivalent basis |
|||||||||||||||||||
Net interest income |
$ |
10,664 |
$ |
10,324 |
$ |
9,938 |
$ |
9,548 |
$ |
10,846 |
|||||||||
Fully taxable-equivalent adjustment |
211 |
231 |
229 |
234 |
207 |
||||||||||||||
Net interest income on a fully taxable-equivalent basis |
$ |
10,875 |
$ |
10,555 |
$ |
10,167 |
$ |
9,782 |
$ |
11,053 |
|||||||||
Reconciliation of total revenue, net of interest expense to total revenue, net of interest expense on a fully taxable-equivalent basis |
|||||||||||||||||||
Total revenue, net of interest expense |
$ |
23,197 |
$ |
18,660 |
$ |
20,428 |
$ |
21,968 |
$ |
22,278 |
|||||||||
Fully taxable-equivalent adjustment |
211 |
231 |
229 |
234 |
207 |
||||||||||||||
Total revenue, net of interest expense on a fully taxable-equivalent basis |
$ |
23,408 |
$ |
18,891 |
$ |
20,657 |
$ |
22,202 |
$ |
22,485 |
|||||||||
Reconciliation of income tax expense (benefit) to income tax expense (benefit) on a fully taxable-equivalent basis |
|||||||||||||||||||
Income tax expense (benefit) |
$ |
501 |
$ |
(2,636 |
) |
$ |
770 |
$ |
684 |
$ |
66 |
||||||||
Fully taxable-equivalent adjustment |
211 |
231 |
229 |
234 |
207 |
||||||||||||||
Income tax expense (benefit) on a fully taxable-equivalent basis |
$ |
712 |
$ |
(2,405 |
) |
$ |
999 |
$ |
918 |
$ |
273 |
||||||||
Reconciliation of average common shareholders' equity to average tangible common shareholders' equity |
|||||||||||||||||||
Common shareholders' equity |
$ |
218,225 |
$ |
219,744 |
$ |
217,273 |
$ |
216,782 |
$ |
214,150 |
|||||||||
Goodwill |
(69,945 |
) |
(69,976 |
) |
(69,976 |
) |
(69,976 |
) |
(69,967 |
) |
|||||||||
Intangible assets (excluding MSRs) |
(6,549 |
) |
(6,874 |
) |
(7,194 |
) |
(7,533 |
) |
(7,869 |
) |
|||||||||
Related deferred tax liabilities |
2,425 |
2,490 |
2,556 |
2,626 |
2,700 |
||||||||||||||
Tangible common shareholders' equity |
$ |
144,156 |
$ |
145,384 |
$ |
142,659 |
$ |
141,899 |
$ |
139,014 |
|||||||||
Reconciliation of average shareholders' equity to average tangible shareholders' equity |
|||||||||||||||||||
Shareholders' equity |
$ |
236,995 |
$ |
238,512 |
$ |
236,039 |
$ |
235,558 |
$ |
232,566 |
|||||||||
Goodwill |
(69,945 |
) |
(69,976 |
) |
(69,976 |
) |
(69,976 |
) |
(69,967 |
) |
|||||||||
Intangible assets (excluding MSRs) |
(6,549 |
) |
(6,874 |
) |
(7,194 |
) |
(7,533 |
) |
(7,869 |
) |
|||||||||
Related deferred tax liabilities |
2,425 |
2,490 |
2,556 |
2,626 |
2,700 |
||||||||||||||
Tangible shareholders' equity |
$ |
162,926 |
$ |
164,152 |
$ |
161,425 |
$ |
160,675 |
$ |
157,430 |
|||||||||
Reconciliation of period-end common shareholders' equity to period-end tangible common shareholders' equity |
|||||||||||||||||||
Common shareholders' equity |
$ |
218,513 |
$ |
218,188 |
$ |
219,838 |
$ |
217,213 |
$ |
213,711 |
|||||||||
Goodwill |
(69,930 |
) |
(69,976 |
) |
(69,976 |
) |
(69,976 |
) |
(69,976 |
) |
|||||||||
Intangible assets (excluding MSRs) |
(6,379 |
) |
(6,684 |
) |
(7,030 |
) |
(7,335 |
) |
(7,696 |
) |
|||||||||
Related deferred tax liabilities |
2,363 |
2,428 |
2,494 |
2,559 |
2,628 |
||||||||||||||
Tangible common shareholders' equity |
$ |
144,567 |
$ |
143,956 |
$ |
145,326 |
$ |
142,461 |
$ |
138,667 |
|||||||||
Reconciliation of period-end shareholders' equity to period-end tangible shareholders' equity |
|||||||||||||||||||
Shareholders' equity |
$ |
237,293 |
$ |
236,956 |
$ |
238,606 |
$ |
235,975 |
$ |
232,499 |
|||||||||
Goodwill |
(69,930 |
) |
(69,976 |
) |
(69,976 |
) |
(69,976 |
) |
(69,976 |
) |
|||||||||
Intangible assets (excluding MSRs) |
(6,379 |
) |
(6,684 |
) |
(7,030 |
) |
(7,335 |
) |
(7,696 |
) |
|||||||||
Related deferred tax liabilities |
2,363 |
2,428 |
2,494 |
2,559 |
2,628 |
||||||||||||||
Tangible shareholders' equity |
$ |
163,347 |
$ |
162,724 |
$ |
164,094 |
$ |
161,223 |
$ |
157,455 |
|||||||||
Reconciliation of period-end assets to period-end tangible assets |
|||||||||||||||||||
Assets |
$ |
2,174,819 |
$ |
2,209,974 |
$ |
2,166,162 |
$ |
2,160,854 |
$ |
2,181,449 |
|||||||||
Goodwill |
(69,930 |
) |
(69,976 |
) |
(69,976 |
) |
(69,976 |
) |
(69,976 |
) |
|||||||||
Intangible assets (excluding MSRs) |
(6,379 |
) |
(6,684 |
) |
(7,030 |
) |
(7,335 |
) |
(7,696 |
) |
|||||||||
Related deferred tax liabilities |
2,363 |
2,428 |
2,494 |
2,559 |
2,628 |
||||||||||||||
Tangible assets |
$ |
2,100,873 |
$ |
2,135,742 |
$ |
2,091,650 |
$ |
2,086,102 |
$ |
2,106,405 |
|||||||||
17
Table 8 | |||||||
Segment Supplemental Financial Data Reconciliations to GAAP Financial Measures (1)
| |||||||
Three Months Ended March 31 |
|||||||
(Dollars in millions) |
2013 |
2012 |
|||||
Consumer & Business Banking |
|||||||
Reported net income |
$ |
1,382 |
$ |
1,445 |
|||
Adjustment related to intangibles (2)
|
2 |
3 |
|||||
Adjusted net income |
$ |
1,384 |
$ |
1,448 |
|||
Average allocated equity (3)
|
$ |
58,388 |
$ |
52,890 |
|||
Adjustment related to goodwill and a percentage of intangibles |
(30,388 |
) |
(30,522 |
) |
|||
Average allocated capital/economic capital |
$ |
28,000 |
$ |
22,368 |
|||
Global Banking |
|||||||
Reported net income |
$ |
1,338 |
$ |
1,573 |
|||
Adjustment related to intangibles (2)
|
1 |
1 |
|||||
Adjusted net income |
$ |
1,339 |
$ |
1,574 |
|||
Average allocated equity (3)
|
$ |
49,828 |
$ |
45,060 |
|||
Adjustment related to goodwill and a percentage of intangibles |
(24,828 |
) |
(24,860 |
) |
|||
Average allocated capital/economic capital |
$ |
25,000 |
$ |
20,200 |
|||
Global Markets |
|||||||
Reported net income |
$ |
1,169 |
$ |
828 |
|||
Adjustment related to intangibles (2)
|
2 |
2 |
|||||
Adjusted net income |
$ |
1,171 |
$ |
830 |
|||
Average allocated equity (3)
|
$ |
34,645 |
$ |
19,032 |
|||
Adjustment related to goodwill and a percentage of intangibles |
(4,645 |
) |
(4,648 |
) |
|||
Average allocated capital/economic capital |
$ |
30,000 |
$ |
14,384 |
|||
Global Wealth & Investment Management |
|||||||
Reported net income |
$ |
720 |
$ |
550 |
|||
Adjustment related to intangibles (2)
|
4 |
6 |
|||||
Adjusted net income |
$ |
724 |
$ |
556 |
|||
Average allocated equity (3)
|
$ |
20,323 |
$ |
16,822 |
|||
Adjustment related to goodwill and a percentage of intangibles |
(10,323 |
) |
(10,402 |
) |
|||
Average allocated capital/economic capital |
$ |
10,000 |
$ |
6,420 |
|||
(1) |
There are no adjustments to reported net income (loss) or average allocated equity for CRES.
|
(2) |
Represents cost of funds, earnings credits and certain expenses related to intangibles. |
(3) |
Average allocated equity is comprised of average allocated capital (or economic capital prior to 2013) plus capital for the portion of goodwill and intangibles specifically assigned to the business segment. For more information on allocated capital and economic capital, see Business Segment Operations on page 25 and Note 9 – Goodwill and Intangible Assets to the Consolidated Financial Statements.
|
18
Table 8 | |||||||
Segment Supplemental Financial Data Reconciliations to GAAP Financial Measures (continued) (1)
| |||||||
Three Months Ended March 31 |
|||||||
(Dollars in millions) |
2013 |
2012 |
|||||
Consumer & Business Banking |
|||||||
Deposits |
|||||||
Reported net income |
$ |
398 |
$ |
403 |
|||
Adjustment related to intangibles (2)
|
— |
— |
|||||
Adjusted net income |
$ |
398 |
$ |
403 |
|||
Average allocated equity (3)
|
$ |
35,407 |
$ |
32,219 |
|||
Adjustment related to goodwill and a percentage of intangibles |
(20,007 |
) |
(20,030 |
) |
|||
Average allocated capital/economic capital |
$ |
15,400 |
$ |
12,189 |
|||
Card Services |
|||||||
Reported net income |
$ |
984 |
$ |
1,042 |
|||
Adjustment related to intangibles (2)
|
2 |
3 |
|||||
Adjusted net income |
$ |
986 |
$ |
1,045 |
|||
Average allocated equity (3)
|
$ |
22,981 |
$ |
20,671 |
|||
Adjustment related to goodwill and a percentage of intangibles |
(10,381 |
) |
(10,492 |
) |
|||
Average allocated capital/economic capital |
$ |
12,600 |
$ |
10,179 |
|||
For footnotes see page 18.
19
Net Interest Income Excluding Trading-related Net Interest Income |
We manage net interest income on a FTE basis and excluding the impact of trading-related activities. As discussed in Global Markets on page 39, we evaluate our sales and trading results and strategies on a total market-based revenue approach by combining net interest income and noninterest income for Global Markets. An analysis of net interest income, average earning assets and net interest yield on earning assets, all of which adjust for the impact of trading-related net interest income from reported net interest income on a FTE basis, is shown below. We believe the use of this non-GAAP presentation in Table 9 provides additional clarity in assessing our results.
Table 9 | |||||||
Net Interest Income Excluding Trading-related Net Interest Income | |||||||
Three Months Ended March 31 |
|||||||
(Dollars in millions) |
2013 |
2012 |
|||||
Net interest income (FTE basis) |
|||||||
As reported (1)
|
$ |
10,875 |
$ |
11,053 |
|||
Impact of trading-related net interest income |
(1,010 |
) |
(796 |
) |
|||
Net interest income excluding trading-related net interest income (2)
|
$ |
9,865 |
$ |
10,257 |
|||
Average earning assets |
|||||||
As reported |
$ |
1,800,786 |
$ |
1,768,105 |
|||
Impact of trading-related earning assets |
(497,730 |
) |
(424,414 |
) |
|||
Average earning assets excluding trading-related earning assets (2)
|
$ |
1,303,056 |
$ |
1,343,691 |
|||
Net interest yield contribution (FTE basis) (3)
|
|||||||
As reported (1)
|
2.43 |
% |
2.51 |
% |
|||
Impact of trading-related activities |
0.62 |
0.55 |
|||||
Net interest yield on earning assets excluding trading-related activities (2)
|
3.05 |
% |
3.06 |
% |
|||
(1) |
Net interest income and net interest yield include fees earned on overnight deposits placed with the Federal Reserve and, beginning in the third quarter of 2012, fees earned on deposits, primarily overnight, placed with certain non-U.S. central banks, of $33 million and $47 million for the three months ended March 31, 2013 and 2012.
|
(2) |
Represents a non-GAAP financial measure. |
(3) |
Calculated on an annualized basis. |
For the three months ended March 31, 2013, net interest income excluding trading-related net interest income decreased $392 million to $9.9 billion compared to the same period in 2012. The decrease was primarily due to the impact of lower consumer loan balances as well as lower asset yields driven by the low rate environment, partially offset by reductions in long-term debt balances and lower rates paid on deposits.
Average earning assets excluding trading-related earning assets decreased $40.6 billion to $1,303.1 billion compared to the same period in 2012. The decrease was primarily due to declines in consumer loans and time deposits placed, partially offset by increases in commercial loans and investment securities.
For the three months ended March 31, 2013, net interest yield on earning assets excluding trading-related activities decreased one bp to 3.05 percent compared to the same period in 2012 as the yield continued to be under pressure due to the factors noted above for net interest income.
20
Table 10 | |||||||||||||||||||||
Quarterly Average Balances and Interest Rates – FTE Basis | |||||||||||||||||||||
First Quarter 2013 |
Fourth Quarter 2012 |
||||||||||||||||||||
(Dollars in millions) |
Average
Balance
|
Interest
Income/
Expense
|
Yield/
Rate
|
Average
Balance
|
Interest
Income/
Expense
|
Yield/
Rate
|
|||||||||||||||
Earning assets |
|||||||||||||||||||||
Time deposits placed and other short-term investments (1)
|
$ |
16,129 |
$ |
46 |
1.17 |
% |
$ |
16,967 |
$ |
50 |
1.14 |
% |
|||||||||
Federal funds sold and securities borrowed or purchased under agreements to resell |
237,463 |
315 |
0.54 |
241,950 |
329 |
0.54 |
|||||||||||||||
Trading account assets |
194,364 |
1,380 |
2.87 |
186,252 |
1,362 |
2.91 |
|||||||||||||||
Debt securities (2)
|
356,399 |
2,556 |
2.87 |
360,213 |
2,201 |
2.44 |
|||||||||||||||
Loans and leases (3):
|
|||||||||||||||||||||
Residential mortgage (4)
|
258,772 |
2,342 |
3.62 |
256,729 |
2,293 |
3.57 |
|||||||||||||||
Home equity |
105,797 |
995 |
3.80 |
110,105 |
1,067 |
3.86 |
|||||||||||||||
U.S. credit card |
91,712 |
2,249 |
9.95 |
92,849 |
2,336 |
10.01 |
|||||||||||||||
Non-U.S. credit card |
11,027 |
329 |
12.10 |
13,081 |
383 |
11.66 |
|||||||||||||||
Direct/Indirect consumer (5)
|
82,364 |
620 |
3.06 |
82,583 |
662 |
3.19 |
|||||||||||||||
Other consumer (6)
|
1,666 |
19 |
4.36 |
1,602 |
19 |
4.57 |
|||||||||||||||
Total consumer |
551,338 |
6,554 |
4.79 |
556,949 |
6,760 |
4.84 |
|||||||||||||||
U.S. commercial |
210,706 |
1,666 |
3.20 |
209,496 |
1,729 |
3.28 |
|||||||||||||||
Commercial real estate (7)
|
39,179 |
326 |
3.38 |
38,192 |
341 |
3.55 |
|||||||||||||||
Commercial lease financing |
23,534 |
236 |
4.01 |
22,839 |
184 |
3.23 |
|||||||||||||||
Non-U.S. commercial |
81,502 |
467 |
2.32 |
65,690 |
433 |
2.62 |
|||||||||||||||
Total commercial |
354,921 |
2,695 |
3.07 |
336,217 |
2,687 |
3.18 |
|||||||||||||||
Total loans and leases |
906,259 |
9,249 |
4.12 |
893,166 |
9,447 |
4.21 |
|||||||||||||||
Other earning assets |
90,172 |
733 |
3.29 |
90,388 |
771 |
3.40 |
|||||||||||||||
Total earning assets (8)
|
1,800,786 |
14,279 |
3.20 |
1,788,936 |
14,160 |
3.16 |
|||||||||||||||
Cash and cash equivalents (1)
|
92,846 |
33 |
111,671 |
42 |
|||||||||||||||||
Other assets, less allowance for loan and lease losses |
318,798 |
309,758 |
|||||||||||||||||||
Total assets |
$ |
2,212,430 |
$ |
2,210,365 |
|||||||||||||||||
(1) |
For this presentation, fees earned on overnight deposits placed with the Federal Reserve are included in the cash and cash equivalents line, consistent with the Consolidated Balance Sheet presentation of these deposits. In addition, beginning in the third quarter of 2012, fees earned on deposits, primarily overnight, placed with certain non-U.S. central banks, which are included in the time deposits placed and other short-term investments line in prior periods, have been included in the cash and cash equivalents line. Net interest income and net interest yield are calculated excluding these fees. |
(2) |
Yields on debt securities carried at fair value are calculated based on fair value rather than the cost basis. The use of fair value does not have a material impact on net interest yield. |
(3) |
Nonperforming loans are included in the respective average loan balances. Income on these nonperforming loans is recognized on a cost recovery basis. PCI loans were recorded at fair value upon acquisition and accrete interest income over the remaining life of the loan. |
(4) |
Includes non-U.S. residential mortgage loans of $90 million in the first quarter of 2013, and $93 million, $92 million, $89 million and $86 million in the fourth, third, second and first quarters of 2012, respectively.
|
(5) |
Includes non-U.S. consumer loans of $7.7 billion in the first quarter of 2013, and $8.1 billion, $7.8 billion, $7.8 billion and $7.5 billion in the fourth, third, second and first quarters of 2012, respectively.
|
(6) |
Includes consumer finance loans of $1.4 billion in the first quarter of 2013, and $1.4 billion, $1.5 billion, $1.6 billion and $1.6 billion in the fourth, third, second and first quarters of 2012, respectively; other non-U.S. consumer loans of $5 million in the first quarter of 2013, and $4 million, $997 million, $895 million and $903 million in the fourth, third, second and first quarters of 2012, respectively; and consumer overdrafts of $142 million in the first quarter of 2013, and $156 million, $158 million, $108 million and $90 million in the fourth, third, second and first quarters of 2012, respectively.
|
(7) |
Includes U.S. commercial real estate loans of $37.7 billion in the first quarter of 2013, and $36.7 billion, $35.4 billion, $36.0 billion and $37.4 billion in the fourth, third, second and first quarters of 2012, respectively; and non-U.S. commercial real estate loans of $1.5 billion in the first quarter of 2013, and $1.5 billion, $1.5 billion, $1.6 billion and $1.8 billion in the fourth, third, second and first quarters of 2012, respectively.
|
(8) |
Interest income includes the impact of interest rate risk management contracts, which decreased interest income on the underlying assets by $141 million in the first quarter of 2013, and $146 million, $136 million, $366 million and $106 million in the fourth, third, second and first quarters of 2012, respectively. Interest expense includes the impact of interest rate risk management contracts, which decreased interest expense on the underlying liabilities by $618 million in the first quarter of 2013, and $598 million, $454 million, $591 million and $658 million in the fourth, third, second and first quarters of 2012, respectively. For further information on interest rate contracts, see Interest Rate Risk Management for Nontrading Activities on page 118.
|
21
Table 10 |
||||||||||||||||||||||||||||||||
Quarterly Average Balances and Interest Rates – FTE Basis (continued) | ||||||||||||||||||||||||||||||||
Third Quarter 2012 |
Second Quarter 2012 |
First Quarter 2012 |
||||||||||||||||||||||||||||||
(Dollars in millions) |
Average
Balance
|
Interest
Income/
Expense
|
Yield/
Rate
|
Average
Balance
|
Interest
Income/
Expense
|
Yield/
Rate
|
Average
Balance
|
Interest
Income/
Expense
|
Yield/
Rate
|
|||||||||||||||||||||||
Earning assets |
||||||||||||||||||||||||||||||||
Time deposits placed and other short-term investments (1)
|
$ |
15,849 |
$ |
58 |
1.47 |
% |
$ |
27,476 |
$ |
64 |
0.94 |
% |
$ |
31,404 |
$ |
65 |
0.83 |
% |
||||||||||||||
Federal funds sold and securities borrowed or purchased under agreements to resell |
234,955 |
353 |
0.60 |
234,148 |
360 |
0.62 |
233,061 |
460 |
0.79 |
|||||||||||||||||||||||
Trading account assets |
166,192 |
1,243 |
2.98 |
165,906 |
1,302 |
3.15 |
164,114 |
1,399 |
3.42 |
|||||||||||||||||||||||
Debt securities (2)
|
355,302 |
2,068 |
2.33 |
357,081 |
1,910 |
2.14 |
341,619 |
2,752 |
3.22 |
|||||||||||||||||||||||
Loans and leases (3):
|
||||||||||||||||||||||||||||||||
Residential mortgage (4)
|
261,461 |
2,412 |
3.69 |
266,493 |
2,556 |
3.84 |
272,655 |
2,592 |
3.80 |
|||||||||||||||||||||||
Home equity |
116,184 |
1,097 |
3.77 |
119,657 |
1,090 |
3.66 |
122,933 |
1,164 |
3.80 |
|||||||||||||||||||||||
U.S. credit card |
93,292 |
2,353 |
10.04 |
95,018 |
2,356 |
9.97 |
98,334 |
2,459 |
10.06 |
|||||||||||||||||||||||
Non-U.S. credit card |
13,329 |
385 |
11.48 |
13,641 |
396 |
11.68 |
14,151 |
408 |
11.60 |
|||||||||||||||||||||||
Direct/Indirect consumer (5)
|
82,635 |
704 |
3.39 |
84,198 |
733 |
3.50 |
88,321 |
801 |
3.65 |
|||||||||||||||||||||||
Other consumer (6)
|
2,654 |
40 |
6.03 |
2,565 |
41 |
6.41 |
2,617 |
40 |
6.24 |
|||||||||||||||||||||||
Total consumer |
569,555 |
6,991 |
4.89 |
581,572 |
7,172 |
4.95 |
599,011 |
7,464 |
5.00 |
|||||||||||||||||||||||
U.S. commercial |
201,072 |
1,752 |
3.47 |
199,644 |
1,742 |
3.51 |
195,111 |
1,756 |
3.62 |
|||||||||||||||||||||||
Commercial real estate (7)
|
36,929 |
329 |
3.54 |
37,627 |
323 |
3.46 |
39,190 |
339 |
3.48 |
|||||||||||||||||||||||
Commercial lease financing |
21,545 |
202 |
3.75 |
21,446 |
216 |
4.02 |
21,679 |
272 |
5.01 |
|||||||||||||||||||||||
Non-U.S. commercial |
59,758 |
401 |
2.67 |
59,209 |
369 |
2.50 |
58,731 |
391 |
2.68 |
|||||||||||||||||||||||
Total commercial |
319,304 |
2,684 |
3.35 |
317,926 |
2,650 |
3.35 |
314,711 |
2,758 |
3.52 |
|||||||||||||||||||||||
Total loans and leases |
888,859 |
9,675 |
4.34 |
899,498 |
9,822 |
4.38 |
913,722 |
10,222 |
4.49 |
|||||||||||||||||||||||
Other earning assets |
89,118 |
760 |
3.40 |
88,459 |
716 |
3.24 |
84,185 |
723 |
3.46 |
|||||||||||||||||||||||
Total earning assets (8)
|
1,750,275 |
14,157 |
3.22 |
1,772,568 |
14,174 |
3.21 |
1,768,105 |
15,621 |
3.55 |
|||||||||||||||||||||||
Cash and cash equivalents (1)
|
122,716 |
48 |
116,025 |
52 |
112,512 |
47 |
||||||||||||||||||||||||||
Other assets, less allowance for loan and lease losses |
300,321 |
305,970 |
306,557 |
|||||||||||||||||||||||||||||
Total assets |
$ |
2,173,312 |
$ |
2,194,563 |
$ |
2,187,174 |
||||||||||||||||||||||||||
For footnotes see page 21.
22
Table 10 | |||||||||||||||||||||
Quarterly Average Balances and Interest Rates – FTE Basis (continued) | |||||||||||||||||||||
First Quarter 2013 |
Fourth Quarter 2012 |
||||||||||||||||||||
(Dollars in millions) |
Average
Balance
|
Interest
Income/
Expense
|
Yield/
Rate
|
Average
Balance
|
Interest
Income/
Expense
|
Yield/
Rate
|
|||||||||||||||
Interest-bearing liabilities |
|||||||||||||||||||||
U.S. interest-bearing deposits: |
|||||||||||||||||||||
Savings |
$ |
42,934 |
$ |
6 |
0.05 |
% |
$ |
41,294 |
$ |
6 |
0.06 |
% |
|||||||||
NOW and money market deposit accounts |
501,177 |
117 |
0.09 |
479,130 |
146 |
0.12 |
|||||||||||||||
Consumer CDs and IRAs |
88,376 |
138 |
0.63 |
91,256 |
156 |
0.68 |
|||||||||||||||
Negotiable CDs, public funds and other deposits |
20,880 |
26 |
0.52 |
19,904 |
27 |
0.54 |
|||||||||||||||
Total U.S. interest-bearing deposits |
653,367 |
287 |
0.18 |
631,584 |
335 |
0.21 |
|||||||||||||||
Non-U.S. interest-bearing deposits: |
|||||||||||||||||||||
Banks located in non-U.S. countries |
12,153 |
19 |
0.64 |
11,964 |
22 |
0.71 |
|||||||||||||||
Governments and official institutions |
901 |
1 |
0.23 |
876 |
1 |
0.29 |
|||||||||||||||
Time, savings and other |
54,599 |
75 |
0.56 |
53,655 |
80 |
0.60 |
|||||||||||||||
Total non-U.S. interest-bearing deposits |
67,653 |
95 |
0.57 |
66,495 |
103 |
0.62 |
|||||||||||||||
Total interest-bearing deposits |
721,020 |
382 |
0.22 |
698,079 |
438 |
0.25 |
|||||||||||||||
Federal funds purchased, securities loaned or sold under agreements to repurchase and short-term borrowings |
337,644 |
749 |
0.90 |
336,341 |
855 |
1.01 |
|||||||||||||||
Trading account liabilities |
92,047 |
472 |
2.08 |
80,084 |
420 |
2.09 |
|||||||||||||||
Long-term debt |
273,999 |
1,834 |
2.70 |
277,894 |
1,934 |
2.77 |
|||||||||||||||
Total interest-bearing liabilities (8)
|
1,424,710 |
3,437 |
0.98 |
1,392,398 |
3,647 |
1.04 |
|||||||||||||||
Noninterest-bearing sources: |
|||||||||||||||||||||
Noninterest-bearing deposits |
354,260 |
379,997 |
|||||||||||||||||||
Other liabilities |
196,465 |
199,458 |
|||||||||||||||||||
Shareholders' equity |
236,995 |
238,512 |
|||||||||||||||||||
Total liabilities and shareholders' equity |
$ |
2,212,430 |
$ |
2,210,365 |
|||||||||||||||||
Net interest spread |
2.22 |
% |
2.12 |
% |
|||||||||||||||||
Impact of noninterest-bearing sources |
0.21 |
0.22 |
|||||||||||||||||||
Net interest income/yield on earning assets (1)
|
$ |
10,842 |
2.43 |
% |
$ |
10,513 |
2.34 |
% |
|||||||||||||
For footnotes see page 21.
23
Table 10 |
||||||||||||||||||||||||||||||||
Quarterly Average Balances and Interest Rates – FTE Basis (continued) | ||||||||||||||||||||||||||||||||
Third Quarter 2012 |
Second Quarter 2012 |
First Quarter 2012 |
||||||||||||||||||||||||||||||
(Dollars in millions) |
Average
Balance
|
Interest
Income/
Expense
|
Yield/
Rate
|
Average
Balance
|
Interest
Income/
Expense
|
Yield/
Rate
|
Average
Balance
|
Interest
Income/
Expense
|
Yield/
Rate
|
|||||||||||||||||||||||
Interest-bearing liabilities |
||||||||||||||||||||||||||||||||
U.S. interest-bearing deposits: |
||||||||||||||||||||||||||||||||
Savings |
$ |
41,581 |
$ |
11 |
0.10 |
% |
$ |
42,394 |
$ |
14 |
0.13 |
% |
$ |
40,543 |
$ |
14 |
0.14 |
% |
||||||||||||||
NOW and money market deposit accounts |
465,679 |
173 |
0.15 |
460,788 |
188 |
0.16 |
458,649 |
186 |
0.16 |
|||||||||||||||||||||||
Consumer CDs and IRAs |
94,140 |
172 |
0.73 |
96,858 |
171 |
0.71 |
100,044 |
194 |
0.78 |
|||||||||||||||||||||||
Negotiable CDs, public funds and other deposits |
19,587 |
30 |
0.61 |
21,661 |
35 |
0.65 |
22,586 |
36 |
0.64 |
|||||||||||||||||||||||
Total U.S. interest-bearing deposits |
620,987 |
386 |
0.25 |
621,701 |
408 |
0.26 |
621,822 |
430 |
0.28 |
|||||||||||||||||||||||
Non-U.S. interest-bearing deposits: |
||||||||||||||||||||||||||||||||
Banks located in non-U.S. countries |
13,883 |
19 |
0.56 |
14,598 |
25 |
0.69 |
18,170 |
28 |
0.62 |
|||||||||||||||||||||||
Governments and official institutions |
1,019 |
1 |
0.31 |
895 |
1 |
0.37 |
1,286 |
1 |
0.41 |
|||||||||||||||||||||||
Time, savings and other |
52,175 |
78 |
0.59 |
52,584 |
85 |
0.65 |
55,241 |
90 |
0.66 |
|||||||||||||||||||||||
Total non-U.S. interest-bearing deposits |
67,077 |
98 |
0.58 |
68,077 |
111 |
0.65 |
74,697 |
119 |
0.64 |
|||||||||||||||||||||||
Total interest-bearing deposits |
688,064 |
484 |
0.28 |
689,778 |
519 |
0.30 |
696,519 |
549 |
0.32 |
|||||||||||||||||||||||
Federal funds purchased, securities loaned or sold under agreements to repurchase and short-term borrowings |
325,023 |
893 |
1.09 |
318,909 |
943 |
1.19 |
293,056 |
881 |
1.21 |
|||||||||||||||||||||||
Trading account liabilities |
77,528 |
418 |
2.14 |
84,728 |
448 |
2.13 |
71,872 |
477 |
2.67 |
|||||||||||||||||||||||
Long-term debt |
291,684 |
2,243 |
3.07 |
333,173 |
2,534 |
3.05 |
363,518 |
2,708 |
2.99 |
|||||||||||||||||||||||
Total interest-bearing liabilities (8)
|
1,382,299 |
4,038 |
1.16 |
1,426,588 |
4,444 |
1.25 |
1,424,965 |
4,615 |
1.30 |
|||||||||||||||||||||||
Noninterest-bearing sources: |
||||||||||||||||||||||||||||||||
Noninterest-bearing deposits |
361,633 |
343,110 |
333,593 |
|||||||||||||||||||||||||||||
Other liabilities |
193,341 |
189,307 |
196,050 |
|||||||||||||||||||||||||||||
Shareholders' equity |
236,039 |
235,558 |
232,566 |
|||||||||||||||||||||||||||||
Total liabilities and shareholders' equity |
$ |
2,173,312 |
$ |
2,194,563 |
$ |
2,187,174 |
||||||||||||||||||||||||||
Net interest spread |
2.06 |
% |
1.96 |
% |
2.25 |
% |
||||||||||||||||||||||||||
Impact of noninterest-bearing sources |
0.25 |
0.24 |
0.25 |
|||||||||||||||||||||||||||||
Net interest income/yield on earning assets (1)
|
$ |
10,119 |
2.31 |
% |
$ |
9,730 |
2.20 |
% |
$ |
11,006 |
2.50 |
% |
||||||||||||||||||||
For footnotes see page 21.
24
Business Segment Operations |
Segment Description and Basis of Presentation |
We report the results of our operations through five business segments: CBB, CRES, Global Banking, Global Markets and GWIM, with the remaining operations recorded in All Other. We prepare and evaluate segment results using certain non-GAAP financial measures. For additional information, see Supplemental Financial Data on page 16. Table 11 provides selected summary financial data for our business segments and All Other for the three months ended March 31, 2013 compared to the same period in 2012. For additional detailed information on these results, see the business segment and All Other discussions which follow.
Table 11 |
|||||||||||||||||||||||||||||||
Business Segment Results |
|||||||||||||||||||||||||||||||
Three Months Ended March 31 |
|||||||||||||||||||||||||||||||
Total Revenue (1)
|
Provision for Credit Losses |
Noninterest Expense |
Net Income (Loss) |
||||||||||||||||||||||||||||
(Dollars in millions) |
2013 |
2012 |
2013 |
2012 |
2013 |
2012 |
2013 |
2012 |
|||||||||||||||||||||||
Consumer & Business Banking |
$ |
7,214 |
$ |
7,422 |
$ |
906 |
$ |
877 |
$ |
4,108 |
$ |
4,263 |
$ |
1,382 |
$ |
1,445 |
|||||||||||||||
Consumer Real Estate Services |
2,312 |
2,664 |
335 |
507 |
5,407 |
3,884 |
(2,157 |
) |
(1,138 |
) |
|||||||||||||||||||||
Global Banking |
4,225 |
4,236 |
195 |
(245 |
) |
1,900 |
1,997 |
1,338 |
1,573 |
||||||||||||||||||||||
Global Markets |
4,872 |
4,411 |
5 |
(13 |
) |
3,076 |
3,239 |
1,169 |
828 |
||||||||||||||||||||||
Global Wealth & Investment Management |
4,421 |
4,147 |
22 |
46 |
3,253 |
3,232 |
720 |
550 |
|||||||||||||||||||||||
All Other |
364 |
(395 |
) |
250 |
1,246 |
1,756 |
2,526 |
(969 |
) |
(2,605 |
) |
||||||||||||||||||||
Total FTE basis |
23,408 |
22,485 |
1,713 |
2,418 |
19,500 |
19,141 |
1,483 |
653 |
|||||||||||||||||||||||
FTE adjustment |
(211 |
) |
(207 |
) |
— |
— |
— |
— |
— |
— |
|||||||||||||||||||||
Total Consolidated |
$ |
23,197 |
$ |
22,278 |
$ |
1,713 |
$ |
2,418 |
$ |
19,500 |
$ |
19,141 |
$ |
1,483 |
$ |
653 |
|||||||||||||||
(1) Total revenue is net of interest expense and is on a FTE basis which for consolidated revenue is a non-GAAP financial measure. For more information on this measure and for a corresponding reconciliation to a GAAP financial measure, see Supplemental Financial Data on page 16.
The management accounting and reporting process derives segment and business results by utilizing allocation methodologies for revenue and expense. The net income derived for the businesses is dependent upon revenue and cost allocations using an activity-based costing model, funds transfer pricing, and other methodologies and assumptions management believes are appropriate to reflect the results of the business.
Total revenue, net of interest expense, includes net interest income on a FTE basis and noninterest income. The adjustment of net interest income to a FTE basis results in a corresponding increase in income tax expense. The segment results also reflect certain revenue and expense methodologies that are utilized to determine net income. The net interest income of the businesses includes the results of a funds transfer pricing process that matches assets and liabilities with similar interest rate sensitivity and maturity characteristics. For presentation purposes, in segments where the total of liabilities and equity exceeds assets, which are generally deposit-taking segments, we allocate assets to match liabilities. Net interest income of the business segments also includes an allocation of net interest income generated by certain of our asset and liability management (ALM) activities.
25
Our ALM activities include an overall interest rate risk management strategy that incorporates the use of various derivatives and cash instruments to manage fluctuations in earnings and capital that are caused by interest rate volatility. Our goal is to manage interest rate sensitivity so that movements in interest rates do not significantly adversely affect earnings and capital. The results of a majority of our ALM activities are allocated to the business segments and fluctuate based on the performance of the ALM activities. ALM activities include external product pricing decisions including deposit pricing strategies, the effects of our internal funds transfer pricing process and the net effects of other ALM activities.
Certain expenses not directly attributable to a specific business segment are allocated to the segments. The most significant of these expenses include data and item processing costs and certain centralized or shared functions. Data processing costs are allocated to the segments based on equipment usage. Item processing costs are allocated to the segments based on the volume of items processed for each segment. The costs of certain other centralized or shared functions are allocated based on methodologies that reflect utilization.
Effective January 1, 2013, on a prospective basis, we adjusted the amount of capital being allocated to our business segments. The adjustment reflects a refinement to the prior-year methodology (economic capital) which focused solely on internal risk-based economic capital models. The refined methodology (allocated capital) now also considers the effect of regulatory capital requirements in addition to internal risk-based economic capital models. The Corporation's internal risk-based capital models use a risk-adjusted methodology incorporating each segment's credit, market, interest rate, business and operational risk components. See Managing Risk and Strategic Risk Management on page 56 for more information on the nature of these risks. The capital allocated to the business segments is currently referred to as allocated capital and in prior years was referred to as economic capital, both of which represent non-GAAP financial measures. Allocated capital in the business segments is subject to change over time.
For purposes of goodwill impairment testing, the Corporation utilizes allocated equity as a proxy for the carrying value of its reporting units. For more information, see Note 9 – Goodwill and Intangible Assets to the Consolidated Financial Statements.
For more information on the business segments and reconciliations to consolidated total revenue, net income (loss) and period-end total assets, see Note 20 – Business Segment Information to the Consolidated Financial Statements.
26
Consumer & Business Banking |
Three Months Ended March 31 |
||||||||||||||||||||||||||
Deposits |
Card
Services
|
Total Consumer &
Business Banking
|
||||||||||||||||||||||||
(Dollars in millions) |
2013 |
2012 |
2013 |
2012 |
2013 |
2012 |
% Change |
|||||||||||||||||||
Net interest income (FTE basis) |
$ |
2,387 |
$ |
2,454 |
$ |
2,433 |
$ |
2,616 |
$ |
4,820 |
$ |
5,070 |
(5 |
)% |
||||||||||||
Noninterest income: |
||||||||||||||||||||||||||
Card income |
15 |
12 |
1,192 |
1,277 |
1,207 |
1,289 |
(6 |
) |
||||||||||||||||||
Service charges |
1,013 |
1,062 |
— |
— |
1,013 |
1,062 |
(5 |
) |
||||||||||||||||||
All other income (loss) |
102 |
85 |
72 |
(84 |
) |
174 |
1 |
n/m |
||||||||||||||||||
Total noninterest income |
1,130 |
1,159 |
1,264 |
1,193 |
2,394 |
2,352 |
2 |
|||||||||||||||||||
Total revenue, net of interest expense (FTE basis) |
3,517 |
3,613 |
3,697 |
3,809 |
7,214 |
7,422 |
(3 |
) |
||||||||||||||||||
Provision for credit losses |
63 |
87 |
843 |
790 |
906 |
877 |
3 |
|||||||||||||||||||
Noninterest expense |
2,820 |
2,890 |
1,288 |
1,373 |
4,108 |
4,263 |
(4 |
) |
||||||||||||||||||
Income before income taxes |
634 |
636 |
1,566 |
1,646 |
2,200 |
2,282 |
(4 |
) |
||||||||||||||||||
Income tax expense (FTE basis) |
236 |
233 |
582 |
604 |
818 |
837 |
(2 |
) |
||||||||||||||||||
Net income |
$ |
398 |
$ |
403 |
$ |
984 |
$ |
1,042 |
$ |
1,382 |
$ |
1,445 |
(4 |
) |
||||||||||||
Net interest yield (FTE basis) |
1.91 |
% |
2.11 |
% |
9.19 |
% |
8.95 |
% |
3.75 |
% |
4.23 |
% |
||||||||||||||
Return on average allocated capital (1)
|
10.49 |
— |
31.74 |
— |
20.05 |
— |
||||||||||||||||||||
Return on average economic capital (1)
|
— |
13.31 |
— |
41.30 |
— |
26.05 |
||||||||||||||||||||
Efficiency ratio (FTE basis) |
80.20 |
79.98 |
34.82 |
36.05 |
56.95 |
57.43 |
||||||||||||||||||||
Balance Sheet |
||||||||||||||||||||||||||
Average |
||||||||||||||||||||||||||
Total loans and leases |
$ |
22,616 |
$ |
24,074 |
$ |
106,954 |
$ |
116,267 |
$ |
129,570 |
$ |
140,341 |
(8 |
) |
||||||||||||
Total earning assets (2)
|
506,530 |
467,011 |
107,396 |
117,580 |
520,899 |
482,297 |
8 |
|||||||||||||||||||
Total assets (2)
|
539,319 |
500,436 |
114,429 |
123,179 |
560,721 |
521,321 |
8 |
|||||||||||||||||||
Total deposits |
502,063 |
463,715 |
n/m |
n/m |
502,483 |
464,023 |
8 |
|||||||||||||||||||
Allocated capital (1)
|
15,400 |
— |
12,600 |
— |
28,000 |
— |
n/m |
|||||||||||||||||||
Economic capital (1)
|
— |
12,189 |
— |
10,179 |
— |
22,368 |
n/m |
|||||||||||||||||||
Period end |
March 31 2013 |
December 31 2012 |
March 31 2013 |
December 31 2012 |
March 31 2013 |
December 31 2012 |
||||||||||||||||||||
Total loans and leases |
$ |
22,488 |
$ |
22,907 |
$ |
105,014 |
$ |
110,380 |
$ |
127,502 |
$ |
133,287 |
(4 |
) |
||||||||||||
Total earning assets (2)
|
534,098 |
498,150 |
105,460 |
110,831 |
548,776 |
511,961 |
7 |
|||||||||||||||||||
Total assets (2)
|
567,346 |
531,354 |
112,846 |
117,904 |
589,410 |
552,238 |
7 |
|||||||||||||||||||
Total deposits |
529,501 |
495,711 |
n/m |
n/m |
530,552 |
496,127 |
7 |
|||||||||||||||||||
(1)
|
Effective January 1, 2013, we revised, on a prospective basis, the methodology for allocating capital to the business segments. In connection with the change in methodology, we updated the applicable terminology in the above table to allocated capital from economic capital as reported in prior periods. For more information, see Business Segment Operations on page 25.
|
(2)
|
For presentation purposes, in segments and businesses where the total of liabilities and equity exceeds assets, we allocate assets from All Other to match the segments' and businesses' liabilities and allocated shareholders' equity. As a result, total earning assets and total assets of the businesses may not equal total CBB.
|
n/m = not meaningful
CBB, which is comprised of Deposits and Card Services, offers a diversified range of credit, banking and investment products and services to consumers and businesses. Our customers and clients have access to a franchise network that stretches coast to coast through 32 states and the District of Columbia. The franchise network includes approximately 5,400 banking centers, 16,300 ATMs, nationwide call centers, and online and mobile platforms. During the first quarter of 2013, Business Banking results were moved into Deposits as we continue to integrate these businesses. Prior periods were reclassified to conform to current period presentation.
27
CBB Results
Net income for CBB decreased $63 million to $1.4 billion in the three months ended March 31, 2013 compared to the same period in 2012 primarily due to lower revenue and higher provision for credit losses, partially offset by lower noninterest expense. Net interest income decreased $250 million to $4.8 billion driven by the impact of lower average loan balances primarily in Card Services as well as compressed deposit spreads due to the continued low rate environment. Noninterest income increased $42 million to $2.4 billion primarily as a result of charges related to our consumer protection products in the prior-year period, partially offset by a decrease in service charges.
The provision for credit losses increased $29 million to $906 million largely due to an increase in Card Services. For more information, see Provision for Credit Losses on page 108. Noninterest expense decreased $155 million to $4.1 billion primarily due to lower operating and personnel expenses, partially offset by an increase in litigation expense.
Deposits
Deposits includes the results of consumer deposit activities which consist of a comprehensive range of products provided to consumers and small businesses. Our deposit products include traditional savings accounts, money market savings accounts, CDs and IRAs, noninterest- and interest-bearing checking accounts, as well as investment accounts and products. The revenue is allocated to the deposit products using our funds transfer pricing process that matches assets and liabilities with similar interest rate sensitivity and maturity characteristics. Deposits generates fees such as account service fees, non-sufficient funds fees, overdraft charges and ATM fees, as well as investment and brokerage fees from Merrill Edge accounts. Merrill Edge is an integrated investing and banking service targeted at customers with less than $250,000 in investable assets. Merrill Edge provides investment advice and guidance, brokerage services, a self-directed online investing platform and key banking capabilities including access to the Corporation's network of banking centers and ATMs.
Deposits also provides a wide range of lending-related products and services, integrated working capital management and treasury solutions to clients through our network of offices and client relationship teams along with various product partners. Our clients include U.S.-based companies generally with annual sales of $1 million to $50 million. Our lending products and services include commercial loans, lines of credit and real estate lending. Our capital management and treasury solutions include treasury management, foreign exchange and short-term investing options. Deposits also includes the results of our merchant services joint venture.
Deposits includes the net impact of migrating customers and their related deposit balances between Deposits and GWIM as well as other client-managed businesses. For more information on the migration of customer balances to or from GWIM, see GWIM on page 41.
Net income for Deposits of $398 million remained relatively unchanged in the three months ended March 31, 2013 compared to the same period in 2012 as lower revenue was offset by lower noninterest expense and provision for credit losses. Net interest income declined $67 million to $2.4 billion driven by compressed deposit spreads due to the continued low rate environment, partially offset by ALM activities, growth in deposit balances, a customer shift to higher spread liquid products and continued pricing discipline. Noninterest income decreased $29 million to $1.1 billion primarily due to a decrease in service charges.
The provision for credit losses decreased $24 million to $63 million due to improvements in credit quality. Noninterest expense decreased $70 million to $2.8 billion as lower operating expense was partially offset by higher litigation expense.
Average loans decreased $1.5 billion to $22.6 billion primarily driven by loan prepayments and continued run-off of non-core portfolios. Average deposits increased $38.3 billion to $502.1 billion driven by a customer shift to more liquid products in the low rate environment and the net transfer of certain deposits from other businesses. Growth in checking, traditional savings and money market savings of $44.9 billion was partially offset by a decline in time deposits of $6.6 billion. As a result of our continued pricing discipline and the shift in the mix of deposits, the rate paid on average deposits declined by seven bps to 13 bps.
28
Key Statistics |
||||||||
Three Months Ended March 31 |
||||||||
2013 |
2012 |
|||||||
Total deposit spreads (excludes noninterest costs) |
1.52 |
% |
1.96 |
% |
||||
Period end |
||||||||
Client brokerage assets (in millions) |
$ |
82,616 |
$ |
73,422 |
||||
Online banking active accounts (units in thousands) |
30,102 |
30,439 |
||||||
Mobile banking active accounts (units in thousands) |
12,641 |
9,702 |
||||||
Banking centers |
5,389 |
5,651 |
||||||
ATMs |
16,311 |
17,255 |
||||||
Mobile banking customers increased 2.9 million reflecting a change in our customers' banking preferences. The number of banking centers declined by 262 and ATMs declined by 944 as we continue to improve our cost-to-serve and optimize our consumer banking network.
Card Services
Card Services is one of the leading issuers of credit and debit cards to consumers and small businesses in the U.S. In addition to earning net interest spread revenue on its lending activities, Card Services generates interchange revenue from credit and debit card transactions as well as annual credit card fees and other miscellaneous fees.
Net income for Card Services decreased $58 million to $984 million in the three months ended March 31, 2013 compared to the same period in 2012 primarily driven by a decrease in revenue and an increase in the provision for credit losses, partially offset by lower noninterest expense. Net interest income decreased $183 million to $2.4 billion driven by the impact of lower average loan balances. The net interest yield increased 24 bps to 9.19 percent primarily due to lower funding costs. Noninterest income increased $71 million to $1.3 billion primarily as a result of charges related to our consumer protection products in the prior-year period.
The provision for credit losses increased $53 million to $843 million as portfolio trends stabilized. Noninterest expense decreased $85 million to $1.3 billion primarily due to lower operating and personnel expenses.
Average loans decreased $9.3 billion to $107.0 billion primarily driven by charge-offs and continued run-off of non-core portfolios.
Key Statistics |
||||||||
Three Months Ended March 31 |
||||||||
(Dollars in millions) |
2013 |
2012 |
||||||
U.S. credit card |
||||||||
Gross interest yield |
9.95 |
% |
10.06 |
% |
||||
Risk-adjusted margin |
8.39 |
6.54 |
||||||
New accounts (in thousands) |
906 |
782 |
||||||
Purchase volumes |
$ |
46,632 |
$ |
44,797 |
||||
Debit card purchase volumes |
$ |
64,635 |
$ |
63,032 |
||||
The U.S. credit card risk-adjusted margin increased 185 bps due to a decrease in net charge-offs driven by an improvement in credit quality. U.S. credit card purchase volumes increased $1.8 billion to $46.6 billion and debit card purchase volumes increased $1.6 billion to $64.6 billion reflecting higher levels of consumer spending.
29
Consumer Real Estate Services |
Three Months Ended March 31 |
|||||||||||||||||||||||
Home Loans |
Legacy Assets
& Servicing
|
Total Consumer Real
Estate Services
|
|||||||||||||||||||||
(Dollars in millions) |
2013 |
2012 |
2013 |
2012 |
2013 |
2012 |
% Change |
||||||||||||||||
Net interest income (FTE basis) |
$ |
347 |
$ |
347 |
$ |
396 |
$ |
421 |
$ |
743 |
$ |
768 |
(3 |
)% |
|||||||||
Noninterest income: |
|||||||||||||||||||||||
Mortgage banking income |
697 |
714 |
790 |
1,114 |
1,487 |
1,828 |
(19 |
) |
|||||||||||||||
All other income (loss) |
(64 |
) |
29 |
146 |
39 |
82 |
68 |
21 |
|||||||||||||||
Total noninterest income |
633 |
743 |
936 |
1,153 |
1,569 |
1,896 |
(17 |
) |
|||||||||||||||
Total revenue, net of interest expense (FTE basis) |
980 |
1,090 |
1,332 |
1,574 |
2,312 |
2,664 |
(13 |
) |
|||||||||||||||
Provision for credit losses |
92 |
53 |
243 |
454 |
335 |
507 |
(34 |
) |
|||||||||||||||
Noninterest expense |
814 |
857 |
4,593 |
3,027 |
5,407 |
3,884 |
39 |
||||||||||||||||
Income (loss) before income taxes |
74 |
180 |
(3,504 |
) |
(1,907 |
) |
(3,430 |
) |
(1,727 |
) |
99 |
||||||||||||
Income tax expense (benefit) (FTE basis) |
28 |
66 |
(1,301 |
) |
(655 |
) |
(1,273 |
) |
(589 |
) |
116 |
||||||||||||
Net income (loss) |
$ |
46 |
$ |
114 |
$ |
(2,203 |
) |
$ |
(1,252 |
) |
$ |
(2,157 |
) |
$ |
(1,138 |
) |
90 |
||||||
Net interest yield (FTE basis) |
2.62 |
% |
2.43 |
% |
3.09 |
% |
2.37 |
% |
2.85 |
% |
2.39 |
% |
|||||||||||
Efficiency ratio (FTE basis) |
83.06 |
78.62 |
n/m |
n/m |
n/m |
n/m |
|||||||||||||||||
Balance Sheet |
|||||||||||||||||||||||
Average |
|||||||||||||||||||||||
Total loans and leases |
$ |
47,228 |
$ |
51,663 |
$ |
45,735 |
$ |
57,938 |
$ |
92,963 |
$ |
109,601 |
(15 |
) |
|||||||||
Total earning assets |
53,746 |
57,474 |
51,969 |
71,565 |
105,715 |
129,039 |
(18 |
) |
|||||||||||||||
Total assets |
54,505 |
58,348 |
73,826 |
99,609 |
128,331 |
157,957 |
(19 |
) |
|||||||||||||||
Allocated capital (1)
|
6,000 |
— |
18,000 |
— |
24,000 |
— |
n/m |
||||||||||||||||
Economic capital (1)
|
— |
3,467 |
— |
11,324 |
— |
14,791 |
n/m |
||||||||||||||||
Period end |
March 31 2013 |
December 31 2012 |
March 31 2013 |
December 31 2012 |
March 31 2013 |
December 31 2012 |
|||||||||||||||||
Total loans and leases |
$ |
46,929 |
$ |
47,742 |
$ |
44,042 |
$ |
46,918 |
$ |
90,971 |
$ |
94,660 |
(4 |
) |
|||||||||
Total earning assets |
55,111 |
54,394 |
50,433 |
52,580 |
105,544 |
106,974 |
(1 |
) |
|||||||||||||||
Total assets |
55,581 |
55,463 |
73,535 |
75,584 |
129,116 |
131,047 |
(1 |
) |
|||||||||||||||
(1) |
Effective January 1, 2013, we revised, on a prospective basis, the methodology for allocating capital to the business segments. In connection with the change in methodology, we updated the applicable terminology in the above table to allocated capital from economic capital as reported in prior periods. For more information, see Business Segment Operations on page 25.
|
n/m = not meaningful
CRES operations include Home Loans and Legacy Assets & Servicing. Home Loans is responsible for ongoing loan production activities and the CRES home equity loan portfolio not selected for inclusion in the Legacy Assets & Servicing owned portfolio. Legacy Assets & Servicing is responsible for all of our mortgage servicing activities related to loans serviced for others and loans held by the Corporation, including loans that have been designated as the Legacy Assets & Servicing Portfolios. The Legacy Assets & Servicing Portfolios (both owned and serviced), herein referred to as the Legacy Owned and Legacy Serviced Portfolios, respectively (together, the Legacy Portfolios), and as further defined below, include those loans that would not have been originated under our underwriting standards as of December 31, 2010. For additional information on our Legacy Portfolios, see page 32. In addition, Legacy Assets & Servicing is responsible for managing legacy exposures related to CRES (e.g., representations and warranties). This alignment allows CRES management to lead the ongoing Home Loans business while also providing greater focus on legacy mortgage issues and servicing activities.
CRES, primarily through Home Loans operations, generates revenue by providing an extensive line of consumer real estate products and services to customers nationwide. CRES products offered by Home Loans include fixed- and adjustable-rate first-lien mortgage loans for home purchase and refinancing needs, home equity lines of credit (HELOCs) and home equity loans. First mortgage products are either sold into the secondary mortgage market to investors, while we generally retain MSRs (which are on the balance sheet of Legacy Assets & Servicing) and the Bank of America customer relationships, or are held on the balance sheet in All Other for ALM purposes. Home Loans is compensated for loans held for ALM purposes on a management accounting basis with the corresponding offset in All Other. Newly originated HELOCs and home equity loans are retained on the CRES balance sheet in Home Loans.
30
CRES includes the impact of transferring customers and their related loan balances between GWIM and CRES. For more information on the migration of customer balances, see GWIM on page 41.
CRES Results
The net loss for CRES increased $1.0 billion to $2.2 billion in the three months ended March 31, 2013 compared to the same period in 2012 primarily driven by higher noninterest expense and lower mortgage banking income, partially offset by lower provision for credit losses. Mortgage banking income decreased $341 million due to both lower servicing income and lower core production income. The decrease in servicing income was due to a decline in the size of our servicing portfolio driven by strategic sales of MSRs as well as loan prepayment activity. Loan prepayment activity exceeded new originations during the first quarter largely due to our exit from the correspondent lending channel in late 2011. The provision for credit losses decreased $172 million due to improved portfolio trends and increased home prices. Noninterest expense increased $1.5 billion primarily due to higher litigation expense driven in large part by the MBIA Settlement combined with higher default-related servicing expenses. These increases were partially offset by lower mortgage-related costs and lower costs due to the divestiture of certain ancillary servicing business units.
Home Loans
Home Loans products are available to our customers through our retail network of approximately 5,400 banking centers, mortgage loan officers in approximately 340 locations and a sales force offering our customers direct telephone and online access to our products.
Net income for Home Loans decreased $68 million to $46 million in the three months ended March 31, 2013 compared to the same period in 2012 primarily driven by a decrease in noninterest income and higher provision for credit losses, partially offset by lower noninterest expense. Noninterest income decreased $110 million primarily due to the write-down of a receivable. The provision for credit losses increased $39 million as portfolio trends remain stable. Noninterest expense decreased $43 million primarily due to lower litigation and reduced infrastructure costs, partially offset by higher production costs associated with higher origination volume.
Legacy Assets & Servicing
Legacy Assets & Servicing is responsible for all of our servicing activities related to the residential mortgage and home equity loan portfolios, including owned loans and loans serviced for others (collectively, the mortgage serviced portfolio). A portion of this portfolio has been designated as the Legacy Serviced Portfolio, which represents 37 percent and 42 percent of the total mortgage serviced portfolio, as measured by unpaid principal balance, at March 31, 2013 and 2012.
Legacy Assets & Servicing results reflect the net cost of legacy exposures that are included in the results of CRES, including representations and warranties provision, litigation costs, financial results of the CRES home equity portfolio selected as part of the Legacy Owned Portfolio, the financial results of the servicing operations and the results of MSR activities, including net hedge results. The financial results of the servicing operations reflect certain revenues and expenses on loans serviced for others, including owned loans serviced for Home Loans, GWIM and All Other.
Servicing activities include collecting cash for principal, interest and escrow payments from borrowers, and disbursing customer draws for lines of credit and accounting for and remitting principal and interest payments to investors and escrow payments to third parties along with responding to customer inquiries. Our home retention efforts, including single point of contact resources, are also part of our servicing activities, along with supervising foreclosures and property dispositions. In an effort to help our customers avoid foreclosure, Legacy Assets & Servicing evaluates various workout options prior to foreclosure sales which, combined with our temporary halt of foreclosures announced in October 2010, has resulted in elongated default timelines. Although we have resumed foreclosure proceedings in all states, there continues to be significant inventory levels in judicial states. For additional information on our servicing activities, including the impact of foreclosure delays, see Off-Balance Sheet Arrangements and Contractual Obligations – Other Mortgage-related Matters on page 61 of the MD&A of the Corporation's 2012 Annual Report on Form 10-K.
The net loss for Legacy Assets & Servicing increased $951 million to $2.2 billion in the three months ended March 31, 2013 compared to the same period in 2012 primarily driven by an increase in noninterest expense and a decrease in noninterest income, partially offset by a decrease in the provision for credit losses. Noninterest income decreased $217 million primarily due to lower servicing income due to a decrease in the servicing portfolio and the divestiture of certain ancillary servicing business units in 2012, partially offset by lower representations and warranties provision. The provision for credit losses decreased $211 million due to improved portfolio trends, as well as increased home prices in the non-PCI loan portfolio and an improved home price outlook in the PCI home equity loan portfolio.
Noninterest expense increased $1.6 billion primarily due to a $1.7 billion increase in litigation expense driven in large part by the MBIA Settlement and $178 million in higher default-related servicing expenses. These increases were partially offset by a $211 million reduction in mortgage-related assessments, waivers and similar costs related to foreclosure delays and a decrease of $125 million due to the divestiture of certain ancillary servicing business units in 2012.
31
Legacy Portfolios
The Legacy Portfolios (both owned and serviced) include those loans that would not have been originated under our underwriting standards at December 31, 2010. The PCI portfolios as well as certain loans that met a pre-defined delinquency status or probability of default threshold as of January 1, 2011 are also included in the Legacy Portfolios. Since determining the pool of loans to be included in the Legacy Portfolios as of January 1, 2011, the criteria have not changed for these portfolios, but will continue to be evaluated over time.
Legacy Owned Portfolio
The Legacy Owned Portfolio includes those loans that met the criteria as described above and are on the balance sheet of the Corporation. The home equity loan portfolio is held on the balance sheet of Legacy Assets & Servicing; whereas, the residential mortgage loan portfolio is held on the balance sheet of All Other. The financial results of the on-balance sheet loans are reported in the segment that owns the loans or in All Other. Total loans in the Legacy Owned Portfolio increased $685 million during the three months ended March 31, 2013 to $131.8 billion, of which $44.0 billion was reflected on the Legacy Assets & Servicing balance sheet and the remainder was held on the balance sheet of All Other. The increase was primarily related to the portion of the loans purchased in connection with the FNMA Settlement that met the criteria for inclusion in the Legacy Owned Portfolio, offset by payoffs, paydowns, charge-offs and PCI write-offs. For more information on the FNMA Settlement, see Consumer Portfolio Credit Risk Management on page 72.
Legacy Serviced Portfolio
The Legacy Serviced Portfolio includes the Legacy Owned Portfolio and those loans serviced for outside investors that met the criteria as described above. The following table summarizes the balances of the residential mortgage loans included in the Legacy Serviced Portfolio (the Legacy Residential Mortgage Serviced Portfolio) representing 37 percent and 40 percent of the total residential mortgage serviced portfolio, as measured by unpaid principal balance, of $1.1 trillion and $1.5 trillion at March 31, 2013 and 2012. The decline in the Legacy Residential Mortgage Serviced Portfolio was primarily related to servicing transfers, paydowns and payoffs.
Legacy Residential Mortgage Serviced Portfolio, a subset of the Residential Mortgage Serviced Portfolio (1, 2)
| |||||||
Three Months Ended March 31 |
|||||||
(Dollars in billions) |
2013 |
2012 |
|||||
Unpaid principal balance |
|||||||
Residential mortgage loans |
|||||||
Total |
$ |
395 |
$ |
627 |
|||
60 days or more past due |
121 |
218 |
|||||
Number of loans serviced (in thousands) |
|||||||
Residential mortgage loans |
|||||||
Total |
2,062 |
3,302 |
|||||
60 days or more past due |
557 |
981 |
|||||
(1) |
Excludes $48 billion and $76 billion of home equity loans and HELOCs at March 31, 2013 and 2012.
|
(2) |
Excludes loans for which servicing transferred to third parties as of March 31, 2013, with an effective MSR sale date of April 1, 2013, totaling approximately $34 billion.
|
32
Non-Legacy Portfolio
As previously discussed, Legacy Assets & Servicing is responsible for all of our servicing activities. The following table summarizes the balances of the residential mortgage loans that are not included in the Legacy Serviced Portfolio (the Non-Legacy Residential Mortgage Serviced Portfolio) representing 63 percent and 60 percent of the total residential mortgage serviced portfolio, as measured by unpaid principal balance, at March 31, 2013 and 2012. The decline in the Non-Legacy Residential Mortgage Serviced Portfolio was primarily related to servicing transfers, paydowns and payoffs.
Non-Legacy Residential Mortgage Serviced Portfolio, a subset of the Residential Mortgage Serviced Portfolio (1, 2)
| |||||||
Three Months Ended March 31 |
|||||||
(Dollars in billions) |
2013 |
2012 |
|||||
Unpaid principal balance |
|||||||
Residential mortgage loans |
|||||||
Total |
$ |
687 |
$ |
922 |
|||
60 days or more past due |
20 |
20 |
|||||
Number of loans serviced (in thousands) |
|||||||
Residential mortgage loans |
|||||||
Total |
4,378 |
5,553 |
|||||
60 days or more past due |
111 |
108 |
|||||
(1) |
Excludes $55 billion and $61 billion of home equity loans and HELOCs at March 31, 2013 and 2012.
|
(2) |
Excludes loans for which servicing transferred to third parties as of March 31, 2013, with an effective MSR sale date of April 1, 2013, totaling approximately $19 billion.
|
33
Mortgage Banking Income |
CRES mortgage banking income is categorized into production and servicing income. Core production income is comprised primarily of revenue from the fair value gains and losses recognized on our interest rate lock commitments (IRLCs) and loans held-for-sale (LHFS), the related secondary market execution, costs related to representations and warranties in the sales transactions along with other obligations incurred in the sales of mortgage loans and revenues earned in production-related ancillary businesses. Ongoing costs related to representations and warranties and other obligations that were incurred in the sales of mortgage loans in prior periods are also included in production income.
Servicing income includes income earned in connection with servicing activities and MSR valuation adjustments, net of results from risk management activities used to hedge certain market risks of the MSRs. The costs associated with our servicing activities are included in noninterest expense.
The table below summarizes the components of mortgage banking income.
Mortgage Banking Income |
|||||||
Three Months Ended March 31 |
|||||||
(Dollars in millions) |
2013 |
2012 |
|||||
Production income: |
|||||||
Core production revenue |
$ |
815 |
$ |
928 |
|||
Representations and warranties provision |
(250 |
) |
(282 |
) |
|||
Total production income |
565 |
646 |
|||||
Servicing income: |
|||||||
Servicing fees |
913 |
1,329 |
|||||
Impact of customer payments (1)
|
(314 |
) |
(521 |
) |
|||
Fair value changes of MSRs, net of risk management activities used to hedge certain market risks (2)
|
312 |
194 |
|||||
Other servicing-related revenue |
11 |
180 |
|||||
Total net servicing income |
922 |
1,182 |
|||||
Total CRES mortgage banking income
|
1,487 |
1,828 |
|||||
Eliminations (3)
|
(224 |
) |
(216 |
) |
|||
Total consolidated mortgage banking income |
$ |
1,263 |
$ |
1,612 |
|||
(1) |
Represents the change in the market value of the MSR asset due to the impact of customer payments received during the period. |
(2) |
Includes gains (losses) on sales of MSRs. |
(3) |
Includes the effect of transfers of mortgage loans from CRES to the ALM portfolio in All Other.
|
CRES first mortgage loan originations increased $7.1 billion, or 58 percent, for the three months ended March 31, 2013 compared to the same period in 2012, reflecting both a higher market demand for refinances due to favorable interest rates and an increase in our estimated retail market share. Our increase in market share was due to expanded fulfillment capacity which allowed us to reduce the outstanding pipeline of applications and improve our competitive pricing position. Core production revenue decreased $113 million as higher origination volumes were more than offset by lower margins primarily due to industry-wide margin compression. In addition, less favorable valuations of LHFS combined with lower volumes in certain production-related businesses contributed to the decline in core production revenue. During the three months ended March 31, 2013, 91 percent of our first mortgage production volume was for refinance originations and nine percent was for purchase originations compared to 84 percent and 16 percent for the same period in 2012. Home Affordable Refinance Program (HARP) refinance originations were 27 percent of all refinance originations in the three months ended March 31, 2013 as a result of expanded HARP programs over the past year compared to 15 percent for the same period in 2012. Making Home Affordable non-HARP refinance originations were 21 percent of all refinance originations in the three months ended March 31, 2013 as compared to 13 percent for the same period in 2012. The remaining 52 percent of refinance originations related to normal conventional refinances as compared to 72 percent for the same period in 2012.
Net servicing income decreased $260 million for the three months ended March 31, 2013 compared to the same period in 2012. The decline was driven by lower servicing fees due to a smaller servicing portfolio and lower ancillary income due to the divestiture of certain servicing business units in 2012. The decline in the size of our servicing portfolio is driven by strategic sales of MSRs as well as loan prepayment activity, which exceeded new originations, primarily due to our exit from the correspondent lending channel in late 2011. These declines were partially offset by $207 million in reduced impact of customer payments driven by a lower MSR asset and more favorable MSR results, net of hedges. For additional information, see Note 19 – Mortgage Servicing Rights to the Consolidated Financial Statements.
34
Key Statistics |
|||||||||
Three Months Ended March 31 |
|||||||||
(Dollars in millions, except as noted) |
2013 |
2012 |
|||||||
Loan production |
|||||||||
Total Corporation (1):
|
|||||||||
First mortgage |
$ |
23,920 |
$ |
15,238 |
|||||
Home equity |
1,116 |
760 |
|||||||
CRES: |
|||||||||
First mortgage |
$ |
19,269 |
$ |
12,185 |
|||||
Home equity |
942 |
597 |
|||||||
Period end |
March 31 2013 |
December 31 2012 |
|||||||
Mortgage serviced portfolio (in billions) (2, 3)
|
$ |
1,185 |
$ |
1,332 |
|||||
Mortgage loans serviced for investors (in billions) |
949 |
1,045 |
|||||||
Mortgage servicing rights: |
|||||||||
Balance |
5,776 |
5,716 |
|||||||
Capitalized mortgage servicing rights (% of loans serviced for investors) |
61 |
bps |
55 |
bps |
|||||
(1) |
In addition to loan production in CRES, the remaining first mortgage and home equity loan production is primarily in GWIM.
|
(2) |
Servicing of residential mortgage loans, HELOCs and home equity loans. |
(3) |
Excludes loans for which servicing transferred to third parties as of March 31, 2013, with an effective MSR sale date of April 1, 2013, totaling approximately $53 billion.
|
Retail first mortgage loan originations for the total Corporation were $23.9 billion for the three months ended March 31, 2013 compared to $15.2 billion a year ago. The increase of $8.7 billion was primarily driven by an increase in the overall market and increased market share.
Home equity production was $1.1 billion for the three months ended March 31, 2013 compared to $760 million for the same period in 2012 due to a higher demand in the market based on improving housing trends, and increased market share driven by improved banking center engagement with customers and more competitive pricing.
Mortgage Servicing Rights
At March 31, 2013, the consumer MSR balance was $5.8 billion, which represented 61 bps of the related unpaid principal balance compared to $5.7 billion or 55 bps of the related unpaid principal balance at December 31, 2012. The consumer MSR balance increased $60 million in the three months ended March 31, 2013 primarily driven by higher mortgage rates, which resulted in lower forecasted prepayment speeds partially offset by the change in the MSR asset value due to customer payments received during the period. For additional information on our servicing activities, see Off-Balance Sheet Arrangements and Contractual Obligations – Servicing Matters and Foreclosure Processes on page 52. For additional information on MSRs, see Note 19 – Mortgage Servicing Rights to the Consolidated Financial Statements.
Sales of Mortgage Servicing Rights
As previously disclosed, during the first quarter of 2013, Bank of America entered into definitive agreements with certain counterparties, and on April 1, 2013 with an additional counterparty to sell the servicing rights on certain residential mortgage loans serviced for others, with an aggregate unpaid principal balance of approximately $327 billion. The sales involve approximately 2.2 million loans serviced by us as of the applicable contract dates, including approximately 245,000 residential mortgage loans and approximately 24,000 home equity loans that were 60 days or more past due.
The transfers of servicing rights are expected to occur in stages throughout 2013, and began in the first quarter. Certain of the transfers are subject to the approval or consent of certain third parties. There is no assurance that all the required approvals and consents will be obtained, and accordingly, some of these transfers may not be consummated. We expect that the sales, when completed, will ultimately lead to a reduction in revenue of approximately $150 million per quarter compared to the fourth quarter of 2012.
35
Global Banking | |||||||||||
Three Months Ended March 31 |
||||||||||
(Dollars in millions) |
2013 |
2012 |
% Change |
|||||||
Net interest income (FTE basis) |
$ |
2,351 |
$ |
2,296 |
2 |
% |
||||
Noninterest income: |
||||||||||
Service charges |
685 |
721 |
(5 |
) |
||||||
Investment banking fees |
790 |
651 |
21 |
|||||||
All other income |
399 |
568 |
(30 |
) |
||||||
Total noninterest income |
1,874 |
1,940 |
(3 |
) |
||||||
Total revenue, net of interest expense (FTE basis) |
4,225 |
4,236 |
— |
|||||||
Provision for credit losses |
195 |
(245 |
) |
n/m |
||||||
Noninterest expense |
1,900 |
1,997 |
(5 |
) |
||||||
Income before income taxes |
2,130 |
2,484 |
(14 |
) |
||||||
Income tax expense (FTE basis) |
792 |
911 |
(13 |
) |
||||||
Net income |
$ |
1,338 |
$ |
1,573 |
(15 |
) |
||||
Net interest yield (FTE basis) |
3.29 |
% |
3.33 |
% |
||||||
Return on average allocated capital (1)
|
21.72 |
— |
||||||||
Return on average economic capital (1)
|
— |
31.34 |
||||||||
Efficiency ratio (FTE basis) |
44.96 |
47.13 |
||||||||
Balance Sheet |
||||||||||
Average |
||||||||||
Total loans and leases |
$ |
280,305 |
$ |
266,206 |
5 |
|||||
Total earning assets |
289,452 |
277,039 |
4 |
|||||||
Total assets |
332,781 |
320,252 |
4 |
|||||||
Total deposits |
221,492 |
210,940 |
5 |
|||||||
Allocated capital (1)
|
25,000 |
— |
n/m |
|||||||
Economic capital (1)
|
— |
20,200 |
n/m |
|||||||
Period end |
March 31 2013 |
December 31 2012 |
||||||||
Total loans and leases |
$ |
287,263 |
$ |
278,286 |
3 |
|||||
Total earning assets |
297,382 |
289,455 |
3 |
|||||||
Total assets |
340,281 |
334,264 |
2 |
|||||||
Total deposits |
227,647 |
242,596 |
(6 |
) |
||||||
(1) |
Effective January 1, 2013, we revised, on a prospective basis, the methodology for allocating capital to the business segments. In connection with the change in methodology, we updated the applicable terminology in the above table to allocated capital from economic capital as reported in prior periods. For more information, see Business Segment Operations on page 25.
|
n/m = not meaningful
Global Banking, which includes Global Corporate and Global Commercial Banking, and Investment Banking, provides a wide range of lending-related products and services, integrated working capital management and treasury solutions to clients, and underwriting and advisory services through our network of offices and client relationship teams. Our lending products and services include commercial loans, leases, commitment facilities, trade finance, real estate lending, asset-based lending and direct/indirect consumer loans. Our treasury solutions business includes treasury management, foreign exchange and short-term investing options. We also work with our clients to provide investment banking products such as debt and equity underwriting and distribution, and merger-related and other advisory services. Underwriting debt and equity issuances, fixed-income and equity research, and certain market-based activities are executed through our global broker/dealer affiliates which are our primary dealers in several countries. Within Global Banking, Global Commercial Banking clients generally include middle-market companies, commercial real estate firms, auto dealerships and not-for-profit companies. Global Corporate Banking includes large global corporations, financial institutions and leasing clients.
36
Net income for Global Banking decreased $235 million to $1.3 billion in the three months ended March 31, 2013 compared to the same period in 2012 primarily driven by an increase in the provision for credit losses, partially offset by lower noninterest expense.
Revenue remained relatively unchanged as higher investment banking fees and net interest income were offset by lower other income which included gains on liquidation of certain portfolios in the prior-year period.
The provision for credit losses increased $440 million to $195 million primarily as a result of stabilization of asset quality and core commercial loan growth.
Noninterest expense decreased $97 million to $1.9 billion primarily due to lower personnel expenses.
Global Corporate and Global Commercial Banking |
Global Corporate and Global Commercial Banking include Global Treasury Services and Business Lending activities. Global Treasury Services includes deposits, treasury management, credit card, foreign exchange, short-term investment and custody solutions to corporate and commercial banking clients. Business Lending includes various lending-related products and services including commercial loans, leases, commitment facilities, trade finance, real estate lending, asset-based lending and direct/indirect consumer loans. The table below presents a summary of Global Corporate and Global Commercial Banking results.
Global Corporate and Global Commercial Banking |
|||||||||||||||||||||||
Three Months Ended March 31 |
|||||||||||||||||||||||
Global Corporate Banking |
Global Commercial Banking |
Total |
|||||||||||||||||||||
(Dollars in millions) |
2013 |
2012 |
2013 |
2012 |
2013 |
2012 |
|||||||||||||||||
Revenue |
|||||||||||||||||||||||
Business Lending |
$ |
845 |
$ |
861 |
$ |
1,143 |
$ |
1,098 |
$ |
1,988 |
$ |
1,959 |
|||||||||||
Global Treasury Services |
671 |
655 |
716 |
777 |
1,387 |
1,432 |
|||||||||||||||||
Total revenue, net of interest expense |
$ |
1,516 |
$ |
1,516 |
$ |
1,859 |
$ |
1,875 |
$ |
3,375 |
$ |
3,391 |
|||||||||||
Balance Sheet |
|||||||||||||||||||||||
Average |
|||||||||||||||||||||||
Total loans and leases |
$ |
118,791 |
$ |
112,991 |
$ |
161,502 |
$ |
152,318 |
$ |
280,293 |
$ |
265,309 |
|||||||||||
Total deposits |
119,191 |
105,763 |
102,261 |
105,147 |
221,452 |
210,910 |
|||||||||||||||||
Period end |
|||||||||||||||||||||||
Total loans and leases |
$ |
123,705 |
$ |
109,327 |
$ |
163,559 |
$ |
151,194 |
$ |
287,264 |
$ |
260,521 |
|||||||||||
Total deposits |
127,146 |
108,250 |
100,455 |
103,082 |
227,601 |
211,332 |
|||||||||||||||||
Global Corporate and Global Commercial Banking revenue remained relatively unchanged for the three months ended March 31, 2013 compared to the same period in 2012 as higher revenue in Business Lending was offset by a decrease in Global Treasury Services revenue.
Business Lending revenue in Global Corporate Banking remained relatively unchanged as the impact on revenue of growth in loan balances was offset by lower accretion on acquired portfolios and gains on liquidation of certain portfolios in the prior-year period. Business Lending revenue in Global Commercial Banking increased $45 million as increases in the commercial and industrial, and commercial real estate portfolios offset the impact of the low rate environment and declines in the consumer auto loan portfolio from run-off of a liquidating portfolio.
Global Treasury Services revenue remained relatively unchanged as the impact of the low rate environment was partially offset by growth in U.S. and non-U.S. deposit balances.
Average loans and leases in Global Corporate and Global Commercial Banking increased six percent for the three months ended March 31, 2013 compared to the same period in 2012 driven by growth in U.S. and non-U.S. commercial and industrial, leasing and commercial real estate portfolios from higher client demand, partially offset by declines in the consumer auto loan portfolio from run-off of a liquidating auto loan portfolio. Average deposits in Global Corporate and Global Commercial Banking increased five percent as balances continued to grow due to client liquidity, international growth and limited alternative investment options.
37
Investment Banking |
Client teams and product specialists underwrite and distribute debt, equity and other loan products, and provide advisory services and tailored risk management solutions. The economics of certain investment banking and underwriting activities are shared primarily between Global Banking and Global Markets based on the contribution by and involvement of each segment. To provide a complete discussion of our consolidated investment banking fees, the table below presents total Corporation investment banking fees as well as the portion attributable to Global Banking.
Investment Banking Fees |
|||||||||||||||
Three Months Ended March 31 |
|||||||||||||||
Global Banking |
Total Corporation |
||||||||||||||
(Dollars in millions) |
2013 |
2012 |
2013 |
2012 |
|||||||||||
Products |
|||||||||||||||
Advisory |
$ |
233 |
$ |
190 |
$ |
257 |
$ |
203 |
|||||||
Debt issuance |
428 |
347 |
1,022 |
775 |
|||||||||||
Equity issuance |
129 |
114 |
323 |
305 |
|||||||||||
Gross investment banking fees |
790 |
651 |
1,602 |
1,283 |
|||||||||||
Self-led |
(28 |
) |
(20 |
) |
(67 |
) |
(66 |
) |
|||||||
Total investment banking fees |
$ |
762 |
$ |
631 |
$ |
1,535 |
$ |
1,217 |
|||||||
Total Corporation investment banking fees of $1.5 billion, excluding self-led deals, included within Global Banking and Global Markets, increased 26 percent for the three months ended March 31, 2013 compared to the same period in 2012 due to strong performance in debt underwriting and advisory fees.
38
Global Markets |
Three Months Ended March 31 |
||||||||||
(Dollars in millions) |
2013 |
2012 |
% Change |
|||||||
Net interest income (FTE basis) |
$ |
1,111 |
$ |
910 |
22 |
% |
||||
Noninterest income: |
||||||||||
Investment and brokerage services |
528 |
514 |
3 |
|||||||
Investment banking fees |
679 |
556 |
22 |
|||||||
Trading account profits |
2,890 |
2,037 |
42 |
|||||||
All other income (loss) |
(336 |
) |
394 |
n/m |
||||||
Total noninterest income |
3,761 |
3,501 |
7 |
|||||||
Total revenue, net of interest expense (FTE basis) |
4,872 |
4,411 |
10 |
|||||||
Provision for credit losses |
5 |
(13 |
) |
n/m |
||||||
Noninterest expense |
3,076 |
3,239 |
(5 |
) |
||||||
Income before income taxes |
1,791 |
1,185 |
51 |
|||||||
Income tax expense (FTE basis) |
622 |
357 |
74 |
|||||||
Net income |
$ |
1,169 |
$ |
828 |
41 |
|||||
Return on average allocated capital (1)
|
15.83 |
% |
— |
|||||||
Return on average economic capital (1)
|
— |
23.22 |
% |
|||||||
Efficiency ratio (FTE basis) |
63.13 |
73.44 |
||||||||
Balance Sheet |
||||||||||
Average |
||||||||||
Total trading-related assets (2)
|
$ |
504,266 |
$ |
448,731 |
12 |
|||||
Total earning assets (2)
|
509,732 |
436,871 |
17 |
|||||||
Total assets |
666,626 |
573,305 |
16 |
|||||||
Allocated capital (1)
|
30,000 |
— |
n/m |
|||||||
Economic capital (1)
|
— |
14,384 |
n/m |
|||||||
Period end |
March 31 2013 |
December 31 2012 |
||||||||
Total trading-related assets (2)
|
$ |
467,826 |
$ |
465,836 |
— |
|||||
Total earning assets (2)
|
480,077 |
486,503 |
(1 |
) |
||||||
Total assets |
625,434 |
629,896 |
(1 |
) |
||||||
(1) |
Effective January 1, 2013, we revised, on a prospective basis, the methodology for allocating capital to the business segments. In connection with the change in methodology, we updated the applicable terminology in the above table to allocated capital from economic capital as reported in prior periods. For more information, see Business Segment Operations on page 25.
|
(2) |
Trading-related assets include derivative assets, which are considered non-earning assets. |
n/m = not meaningful
Global Markets offers sales and trading services, including research, to institutional clients across fixed-income, credit, currency, commodity and equity businesses. Global Markets product coverage includes securities and derivative products in both the primary and secondary markets. Global Markets provides market-making, financing, securities clearing, settlement and custody services globally to our institutional investor clients in support of their investing and trading activities. We also work with our commercial and corporate clients to provide risk management products using interest rate, equity, credit, currency and commodity derivatives, foreign exchange, fixed-income and mortgage-related products. As a result of our market-making activities in these products, we may be required to manage risk in government securities, equity and equity-linked securities, high-grade and high-yield corporate debt securities, MBS, commodities and asset-backed securities (ABS). In addition, the economics of certain investment banking and underwriting activities are shared primarily between Global Markets and Global Banking based on the activities performed by each segment. Global Banking originates certain deal-related transactions with our corporate and commercial clients that are executed and distributed by Global Markets. For additional information on investment banking fees on a consolidated basis, see page 38.
39
Net income for Global Markets increased $341 million to $1.2 billion for the three months ended March 31, 2013 compared to the same period in 2012. In the three months ended March 31, 2013, net DVA losses on derivatives were $55 million compared to $1.4 billion for the same period in 2012. Excluding net DVA, net income decreased $527 million to $1.2 billion primarily driven by lower FICC revenue partially offset by lower noninterest expense. Noninterest expense decreased $163 million to $3.1 billion due to a reduction in operating costs.
Average earning assets increased $72.9 billion to $509.7 billion largely driven by increased client financing activity in the equities business as well as increases in trading-related assets and securities borrowed transactions.
Sales and Trading Revenue |
Sales and trading revenue includes unrealized and realized gains and losses on trading and other assets, net interest income, and fees primarily from commissions on equity securities. Sales and trading revenue is segregated into fixed income (government debt obligations, investment and non-investment grade corporate debt obligations, CMBS, RMBS and collateralized debt obligations (CDOs)), currencies (interest rate and foreign exchange contracts), commodities (primarily futures, forwards, swaps and options) and equities (equity-linked derivatives and cash equity activity). The table below and related discussion present sales and trading revenue, substantially all of which is in Global Markets with the remainder in Global Banking. In addition, the table below and related discussion present sales and trading revenue excluding DVA, which is a non-GAAP financial measure. We believe the use of this non-GAAP financial measure provides clarity in assessing the underlying performance of these businesses.
Sales and Trading Revenue (1, 2)
|
|||||||
Three Months Ended March 31 |
|||||||
(Dollars in millions) |
2013 |
2012 |
|||||
Sales and trading revenue |
|||||||
Fixed income, currencies and commodities |
$ |
2,936 |
$ |
2,843 |
|||
Equities |
1,159 |
912 |
|||||
Total sales and trading revenue |
$ |
4,095 |
$ |
3,755 |
|||
Sales and trading revenue, excluding net DVA (3)
|
|||||||
Fixed income, currencies and commodities |
$ |
3,001 |
$ |
4,130 |
|||
Equities |
1,149 |
1,059 |
|||||
Total sales and trading revenue, excluding net DVA |
$ |
4,150 |
$ |
5,189 |
|||
(1) |
Includes FTE adjustments of $46 million and $50 million for the three months ended March 31, 2013 and 2012. For additional information on sales and trading revenue, see Note 3 – Derivatives to the Consolidated Financial Statements.
|
(2) |
Includes Global Banking sales and trading revenue of $68 million and $114 million for the three months ended March 31, 2013 and 2012.
|
(3) |
For this presentation, sales and trading revenue excludes the impact of credit spreads on DVA which represents a non-GAAP financial measure. Net DVA losses included in FICC revenue were $65 million and net DVA gains included in equities revenue were $10 million for the three months ended March 31, 2013 compared to net DVA losses of $1.3 billion and $147 million for the same period in 2012.
|
FICC revenue, including net DVA, increased $93 million to $2.9 billion. Excluding the impact of credit spreads on net DVA, FICC revenue decreased $1.1 billion to $3.0 billion partially driven by a $450 million write-down of a receivable, of which $300 million of the aforementioned fair value decrease was attributable to increased risk of MBIA going into rehabilitation or liquidation proceedings in the near term, significantly lower spreads primarily in credit-related products, and less favorable market conditions in commodities, as well as a gain on the sale of an equity investment in our mortgage business in the prior-year period. For additional information regarding the MBIA Settlement, see Recent Events – MBIA Settlement on page 6. Equities revenue, including net DVA, increased $247 million to $1.2 billion. Excluding the impact of credit spreads on net DVA, equities revenue increased $90 million to $1.1 billion primarily due to higher client financing balances. Sales and trading revenue included total commissions and brokerage fee revenue of $528 million for the three months ended March 31, 2013 compared to $514 million for the same period in 2012, substantially all from equities in both periods. The $14 million increase in commissions and brokerage fee revenue was primarily due to a higher equity market share.
40
Global Wealth & Investment Management |
Three Months Ended March 31 |
||||||||||
(Dollars in millions) |
2013 |
2012 |
% Change |
|||||||
Net interest income (FTE basis) |
$ |
1,596 |
$ |
1,531 |
4 |
% |
||||
Noninterest income: |
||||||||||
Investment and brokerage services |
2,331 |
2,175 |
7 |
|||||||
All other income |
494 |
441 |
12 |
|||||||
Total noninterest income |
2,825 |
2,616 |
8 |
|||||||
Total revenue, net of interest expense (FTE basis) |
4,421 |
4,147 |
7 |
|||||||
Provision for credit losses |
22 |
46 |
(52 |
) |
||||||
Noninterest expense |
3,253 |
3,232 |
1 |
|||||||
Income before income taxes |
1,146 |
869 |
32 |
|||||||
Income tax expense (FTE basis) |
426 |
319 |
34 |
|||||||
Net income |
$ |
720 |
$ |
550 |
31 |
|||||
Net interest yield (FTE basis) |
2.46 |
% |
2.46 |
% |
||||||
Return on average allocated capital (1)
|
29.38 |
— |
||||||||
Return on average economic capital (1)
|
— |
34.85 |
||||||||
Efficiency ratio (FTE basis) |
73.58 |
77.92 |
||||||||
Balance Sheet |
||||||||||
Average |
||||||||||
Total loans and leases |
$ |
106,082 |
$ |
98,016 |
8 |
|||||
Total earning assets |
263,484 |
250,727 |
5 |
|||||||
Total assets |
282,298 |
269,674 |
5 |
|||||||
Total deposits |
253,413 |
239,859 |
6 |
|||||||
Allocated capital (1)
|
10,000 |
— |
n/m |
|||||||
Economic capital (1)
|
— |
6,420 |
n/m |
|||||||
Period end |
March 31 2013 |
December 31 2012 |
||||||||
Total loans and leases |
$ |
107,048 |
$ |
105,928 |
1 |
|||||
Total earning assets |
248,960 |
277,103 |
(10 |
) |
||||||
Total assets |
268,263 |
297,326 |
(10 |
) |
||||||
Total deposits |
239,853 |
266,188 |
(10 |
) |
||||||
(1) |
Effective January 1, 2013, we revised, on a prospective basis, the methodology for allocating capital to the business segments. In connection with the change in methodology, we updated the applicable terminology in the above table to allocated capital from economic capital as reported in prior periods. For more information, see Business Segment Operations on page 25.
|
n/m = not meaningful
GWIM consists of two primary businesses: Merrill Lynch Global Wealth Management (MLGWM) and U.S. Trust, Bank of America Private Wealth Management (U.S. Trust).
MLGWM's advisory business provides a high-touch client experience through a network of financial advisors focused on clients with over $250,000 in total investable assets. MLGWM provides tailored solutions to meet our clients' needs through a full set of brokerage, banking and retirement products.
U.S. Trust, together with MLGWM's Private Banking & Investments Group, provides comprehensive wealth management solutions targeted to wealthy and ultra-wealthy clients with investable assets of more than $5 million, as well as customized solutions to meet clients' wealth structuring, investment management, trust and banking needs, including specialty asset management services.
41
Net income increased $170 million to $720 million, a record since the Merrill Lynch & Co., Inc. (Merrill Lynch) merger, in the three months ended March 31, 2013 compared to the same period in 2012 driven by higher revenue and lower provision for credit losses, partially offset by higher noninterest expense. Revenue increased $274 million to $4.4 billion, also a post-merger record, primarily driven by higher asset management fees related to higher market levels and long-term AUM flows, increased transactional revenue and higher net interest income. The provision for credit losses decreased $24 million to $22 million driven by improvement in the home equity portfolio. Noninterest expense of $3.3 billion increased slightly as higher volume-driven expenses and litigation expenses were partially offset by lower non-volume driven personnel costs.
For the three months ended March 31, 2013, revenue from MLGWM was $3.7 billion, up seven percent, and revenue from U.S. Trust was $721 million, up six percent, both driven by higher noninterest income and net interest income.
Net Migration Summary |
GWIM results are impacted by the migration of clients and their related deposit and loan balances to or from CBB, CRES and the ALM portfolio, as presented in the table below. The migration this quarter included $18.9 billion of deposits from clients that were identified as being better aligned with CBB. We move clients, from time to time, between business segments where we can best meet the needs of our clients.
Migration Summary | |||||||
Three Months Ended March 31 |
|||||||
(Dollars in millions) |
2013 |
2012 |
|||||
Average |
|||||||
Total deposits, net – GWIM to CBB
|
$ |
(7,291 |
) |
$ |
(89 |
) |
|
Total loans, net – GWIM to CRES and the ALM portfolio
|
(14 |
) |
(95 |
) |
|||
Period end |
|||||||
Total deposits, net – GWIM to CBB
|
$ |
(18,548 |
) |
$ |
(87 |
) |
|
Total loans, net – GWIM to CRES and the ALM portfolio
|
(29 |
) |
(144 |
) |
|||
Client Balances |
The table below presents client balances which consist of AUM, brokerage assets, assets in custody, deposits, and loans and leases.
Client Balances by Type | |||||||
(Dollars in millions) |
March 31 2013 |
December 31 2012 |
|||||
Assets under management |
$ |
745,260 |
$ |
698,095 |
|||
Brokerage assets |
1,026,495 |
975,388 |
|||||
Assets in custody |
127,013 |
117,686 |
|||||
Deposits |
239,853 |
266,188 |
|||||
Loans and leases (1)
|
110,103 |
109,305 |
|||||
Total client balances |
$ |
2,248,724 |
$ |
2,166,662 |
|||
(1) |
Includes margin receivables which are classified in customer and other receivables on the Consolidated Balance Sheet. |
The increase of $82.1 billion, or four percent, in client balances was primarily driven by higher market levels and post-merger record long-term AUM flows, partially offset by deposit balance migration to CBB as described above.
42
All Other |
Three Months Ended March 31 |
||||||||||
(Dollars in millions) |
2013 |
2012 |
% Change |
|||||||
Net interest income (FTE basis) |
$ |
254 |
$ |
478 |
(47 |
)% |
||||
Noninterest income: |
||||||||||
Card income |
85 |
87 |
(2 |
) |
||||||
Equity investment income |
520 |
429 |
21 |
|||||||
Gains on sales of debt securities |
67 |
712 |
(91 |
) |
||||||
All other loss |
(562 |
) |
(2,101 |
) |
(73 |
) |
||||
Total noninterest income (loss) |
110 |
(873 |
) |
n/m |
||||||
Total revenue, net of interest expense (FTE basis) |
364 |
(395 |
) |
n/m |
||||||
Provision for credit losses |
250 |
1,246 |
(80 |
) |
||||||
Noninterest expense |
1,756 |
2,526 |
(30 |
) |
||||||
Loss before income taxes |
(1,642 |
) |
(4,167 |
) |
(61 |
) |
||||
Income tax benefit (FTE basis) |
(673 |
) |
(1,562 |
) |
(57 |
) |
||||
Net loss |
$ |
(969 |
) |
$ |
(2,605 |
) |
(63 |
) |
||
Balance Sheet |
||||||||||
Average |
||||||||||
Loans and leases: |
||||||||||
Residential mortgage |
$ |
215,342 |
$ |
232,806 |
(8 |
) |
||||
Non-U.S. credit card |
11,027 |
14,151 |
(22 |
) |
||||||
Other |
18,188 |
23,271 |
(22 |
) |
||||||
Total loans and leases |
244,557 |
270,228 |
(9 |
) |
||||||
Total assets (1)
|
241,673 |
344,665 |
(30 |
) |
||||||
Total deposits |
35,550 |
52,529 |
(32 |
) |
||||||
Period end |
March 31 2013 |
December 31 2012 |
||||||||
Loans and leases: |
||||||||||
Residential mortgage |
$ |
213,272 |
$ |
211,620 |
1 |
|||||
Non-U.S. credit card |
10,620 |
11,697 |
(9 |
) |
||||||
Other |
17,515 |
18,663 |
(6 |
) |
||||||
Total loans and leases |
241,407 |
241,980 |
— |
|||||||
Total assets (1)
|
222,315 |
265,203 |
(16 |
) |
||||||
Total deposits |
35,758 |
36,060 |
(1 |
) |
||||||
(1) |
For presentation purposes, in segments where the total of liabilities and equity exceeds assets, which are generally deposit-taking segments, we allocate assets from All Other to those segments to match liabilities (i.e., deposits) and allocated shareholders' equity. Such allocated assets were $538.0 billion and $486.5 billion for the three months ended March 31, 2013 and 2012, and $552.8 billion and $537.8 billion at March 31, 2013 and December 31, 2012.
|
n/m = not meaningful
All Other consists of ALM activities, equity investments, liquidating businesses, residual expense allocations and other. ALM activities encompass the whole-loan residential mortgage portfolio and investment securities, interest rate and foreign currency risk management activities including the residual net interest income allocation, gains/losses on structured liabilities, the impact of certain allocation methodologies and accounting hedge ineffectiveness. For more information on our ALM activities, see Interest Rate Risk Management for Nontrading Activities on page 118. Equity investments include GPI which is comprised of a diversified portfolio of equity, real estate and other alternative investments. These investments are made either directly in a company or held through a fund with related income recorded in equity investment income. Equity investments also include strategic investments, which include our investment in China Construction Bank Corporation (CCB) and certain other investments. Additionally, All Other includes certain residential mortgage loans that are managed by Legacy Assets & Servicing.
43
The net loss for All Other decreased $1.6 billion to $969 million in the three months ended March 31, 2013 compared to the same period in 2012 primarily due to negative fair value adjustments on structured liabilities of $90 million related to the improvement in our credit spreads compared to $3.3 billion in the same period in 2012, a $996 million reduction in the provision for credit losses and a decrease in noninterest expense of $770 million. Partially offsetting these items were $1.2 billion in gains related to exchanges of trust preferred securities in the year-ago period, a decrease of $645 million in gains on sales of debt securities.
The provision for credit losses decreased $996 million to $250 million in the three months ended March 31, 2013 compared to the same period in 2012 primarily driven by the impact of an improved home price outlook on the residential mortgage PCI portfolio driving a reserve reduction in the current quarter compared to a reserve build in the year-ago quarter.
Noninterest expense decreased $770 million to $1.8 billion due to lower litigation and personnel expenses. The income tax benefit was $673 million compared to a benefit of $1.6 billion for the same period in 2012, with the decrease primarily attributable to the decline in pre-tax loss in All Other.
In January 2013, in connection with the FNMA Settlement, we repurchased certain residential mortgage loans, all of which are held in All Other. For additional information, see Note 8 – Representations and Warranties Obligations and Corporate Guarantees to the Consolidated Financial Statements.
Equity Investment Activity |
The tables below present the components of equity investments included in All Other at March 31, 2013 and December 31, 2012, and also a reconciliation to the total consolidated equity investment income for the three months ended March 31, 2013 and 2012.
Equity Investments |
|||||||
(Dollars in millions) |
March 31 2013 |
December 31 2012 |
|||||
Global Principal Investments |
$ |
2,786 |
$ |
3,470 |
|||
Strategic and other investments |
2,072 |
2,038 |
|||||
Total equity investments included in All Other
|
$ |
4,858 |
$ |
5,508 |
|||
Equity Investment Income |
|||||||
Three Months Ended March 31 |
|||||||
(Dollars in millions) |
2013 |
2012 |
|||||
Global Principal Investments |
$ |
104 |
$ |
403 |
|||
Strategic and other investments |
416 |
26 |
|||||
Total equity investment income included in All Other
|
520 |
429 |
|||||
Total equity investment income included in the business segments |
43 |
336 |
|||||
Total consolidated equity investment income |
$ |
563 |
$ |
765 |
|||
Equity investments included in All Other decreased $650 million to $4.9 billion at March 31, 2013, with the decrease due to sales in the GPI portfolio. In addition, GPI had unfunded equity commitments of $198 million at March 31, 2013 compared to $224 million at December 31, 2012.
At March 31, 2013 and December 31, 2012, we owned 2.0 billion shares representing approximately one percent of CCB. Sales restrictions on these shares continue until August 2013. Because the sales restrictions on these shares will expire within one year, these securities are classified as AFS marketable equity securities and carried at fair value with the after-tax unrealized gain included in accumulated OCI. At March 31, 2013, the cost basis was $716 million and the fair value was $1.5 billion.
Equity investment income included in All Other was $520 million in the three months ended March 31, 2013, an increase of $91 million from the same period in 2012, reflecting gains on the sale of other investments, partially offset by lower results in GPI. Total Corporation equity investment income was $563 million in the three months ended March 31, 2013, a decrease of $202 million from the same period in 2012, as the year-ago quarter included gains on the sale of an investment in Global Markets.
44
Off-Balance Sheet Arrangements and Contractual Obligations |
We have contractual obligations to make future payments on debt and lease agreements. Additionally, in the normal course of business, we enter into contractual arrangements whereby we commit to future purchases of products or services from unaffiliated parties. For additional information on our obligations and commitments, see Note 11 – Commitments and Contingencies to the Consolidated Financial Statements, Off-Balance Sheet Arrangements and Contractual Obligations on page 54 of the MD&A of the Corporation's 2012 Annual Report on Form 10-K, as well as Note 12 – Long-term Debt and Note 13 – Commitments and Contingencies to the Consolidated Financial Statements of the Corporation's 2012 Annual Report on Form 10-K.
Representations and Warranties |
We securitize first-lien residential mortgage loans generally in the form of MBS guaranteed by the government-sponsored enterprises (GSEs) or by GNMA in the case of Federal Housing Administration (FHA)-insured, U.S. Department of Veterans Affairs (VA)-guaranteed and Rural Housing Service-guaranteed mortgage loans. In addition, in prior years, legacy companies and certain subsidiaries sold pools of first-lien residential mortgage loans and home equity loans as private-label securitizations (in certain of these securitizations, monolines or financial guarantee providers insured all or some of the securities) or in the form of whole loans. In connection with these transactions, we or certain of our subsidiaries or legacy companies make or have made various representations and warranties. Breaches of these representations and warranties may result in the requirement to repurchase mortgage loans or to otherwise make whole or provide other remedies to the GSEs, U.S. Department of Housing and Urban Development (HUD) with respect to FHA-insured loans, VA, whole-loan investors, securitization trusts, monoline insurers or other financial guarantors (collectively, repurchases). In all such cases, we would be exposed to any credit loss on the repurchased mortgage loans after accounting for any mortgage insurance (MI) or mortgage guarantee payments that we may receive.
Subject to the requirements and limitations of the applicable sales and securitization agreements, these representations and warranties can be enforced by the GSEs, HUD, VA, the whole-loan investor, the securitization trustee or others as governed by the applicable agreement or, in certain first-lien and home equity securitizations where monoline insurers or other financial guarantee providers have insured all or some of the securities issued, by the monoline insurer or other financial guarantor, where the contract so provides. In the case of private-label securitizations, the applicable agreements may permit investors, which may include the GSEs, with contractually sufficient holdings to direct or influence action by the securitization trustee. In the case of loans sold to parties other than the GSEs or GNMA, the contractual liability to repurchase typically arises only if there is a breach of the representations and warranties that materially and adversely affects the interest of the investor, or investors, or of the monoline insurer or other financial guarantor (as applicable) in the loan. Contracts with the GSEs do not contain equivalent language, while GNMA generally limits repurchases to loans that are not insured or guaranteed as required.
For additional information about accounting for representations and warranties and our representations and warranties repurchase claims and exposures, see Note 8 – Representations and Warranties Obligations and Corporate Guarantees and Note 13 – Commitments and Contingencies to the Consolidated Financial Statements of the Corporation's 2012 Annual Report on Form 10-K and Item 1A. Risk Factors of the Corporation's 2012 Annual Report on Form 10-K.
Representations and Warranties Bulk Settlement Actions
We have settled, or entered into agreements to settle, certain bulk representations and warranties claims (1) with a trustee (the Trustee) for certain Countrywide private-label securitization trusts in 2011 (the BNY Mellon Settlement), (2) with three monoline insurers, Assured Guaranty Ltd. and subsidiaries in 2011(the Assured Guaranty Settlement), Syncora Guarantee Inc. and Syncora Holdings, Ltd. in 2012 (the Syncora Settlement) and MBIA Inc. and subsidiaries pursuant to the MBIA Settlement in 2013, (3) with each of the GSEs in 2010 (2010 GSE Agreements), and (4) with FNMA pursuant to the FNMA Settlement in 2013.
We have vigorously contested any request for repurchase when we conclude that a valid basis for repurchase does not exist and will continue to do so in the future. However, in an effort to resolve these legacy mortgage-related issues, we have reached bulk settlements, or agreements for bulk settlements, including settlement amounts which have been material, with the above-referenced counterparties in lieu of a loan-by-loan review process. For instance, in the first quarter of 2013 we entered into the FNMA Settlement to resolve substantially all outstanding and potential repurchase and certain other claims relating to the origination, sale and delivery of residential mortgage loans originated from January 1, 2000 through December 31, 2008 and sold directly to FNMA by entities related to Countrywide and BANA. We may reach other settlements in the future if opportunities arise on terms we believe to be advantageous. However, there can be no assurance that we will reach future settlements or, if we do, that the terms of past settlements can be relied upon to predict the terms of future settlements. For a summary of the larger bulk settlement actions and the related impact on the representations and warranties provision and liability, see Note 8 – Representations and Warranties Obligations and Corporate Guarantees herein and Note 13 – Commitments and Contingencies to the Consolidated Financial Statements of the Corporation's 2012 Annual Report on Form 10-K. These
45
bulk settlements generally did not cover all transactions with the relevant counterparties or all potential claims that may arise, including in some instances securities law, fraud and servicing claims, and our liability in connection with the transactions and claims not covered by these settlements could be material.
The BNY Mellon Settlement, entered into in June 2011, is subject to final court approval and certain other conditions. The court approval hearing on the settlement is scheduled to begin on May 30, 2013. Although we are not a party to the proceeding, certain of our rights and obligations under the settlement agreement are conditioned on final court approval of the settlement.
There can be no assurance that final court approval of the BNY Mellon Settlement will be obtained, that all conditions to the BNY Mellon Settlement will be satisfied or, if certain conditions to the BNY Mellon Settlement permitting withdrawal are met, that we and Countrywide will not withdraw from the settlement. If final court approval is not obtained or if we and Countrywide withdraw from the BNY Mellon Settlement in accordance with its terms, our future representations and warranties losses could be substantially different than existing accruals and the estimated range of possible loss over existing accruals. For more information about the risks associated with the BNY Mellon Settlement, see Item 1A. Risk Factors of the Corporation's 2012 Annual Report on Form 10-K.
MBIA Settlement
On May 7, 2013, we entered into the MBIA Settlement which resolved all outstanding litigation between the parties, as well as other claims between the parties, including outstanding and potential claims from MBIA related to alleged representations and warranties breaches and other claims involving certain first- and second-lien RMBS trusts for which MBIA provided financial guarantee insurance, certain of which claims are the subject of litigation. As of March 31, 2013, the mortgages (first- and second-lien) in RMBS trusts covered by the MBIA Settlement had an original principal balance of $54.8 billion and an unpaid principal balance of $19.2 billion. For additional information, see Recent Events – MBIA Settlement on page 6, the Experience with Investors Other than Government-sponsored Enterprises – Monoline Insurers section herein and Note 8 – Representations and Warranties Obligations and Corporate Guarantees and Note 11 – Commitments and Contingencies to the Consolidated Financial Statements.
Unresolved Claims Status
Unresolved Repurchase Claims
During the three months ended March 31, 2013, we received $1.8 billion in new repurchase claims, including $398 million submitted by the GSEs for both Countrywide and legacy Bank of America originations not covered by the bulk settlements with the GSEs, $1.3 billion submitted by private-label securitization trustees, $134 million submitted by whole-loan investors, primarily third-party securitization sponsors, and $42 million submitted by monoline insurers. During the three months ended March 31, 2013, $13.0 billion in claims were resolved, primarily with the GSEs, including $12.2 billion in GSE claims resolved through the FNMA Settlement. Of the remaining claims that were resolved, $409 million were resolved through rescissions and $311 million were resolved through mortgage repurchases and make-whole payments. For more information on unresolved repurchase claims from the GSEs, monoline insurers, private-label securitization trustees, whole-loan investors and others, and the resolution of such claims, see Note 8 – Representations and Warranties Obligations and Corporate Guarantees to the Consolidated Financial Statements.
At March 31, 2013, the total notional amount of our unresolved representations and warranties repurchase claims was approximately $17.1 billion compared to $28.3 billion at December 31, 2012. These repurchase claims do not include any repurchase claims related to the trusts covered by the BNY Mellon Settlement. Unresolved repurchase claims represent the notional amount of repurchase claims made by counterparties, typically the outstanding principal balance or the unpaid principal balance at the time of default. In the case of first-lien mortgages, the claim amount is often significantly greater than the expected loss amount due to the benefit of collateral and, in some cases, MI or mortgage guarantee payments. Claims received from a counterparty remain outstanding until the underlying loan is repurchased, the claim is rescinded by the counterparty, or the claim is otherwise resolved. When a claim is denied and we do not receive a response from the counterparty, the claim remains in the unresolved repurchase claims balance until resolution.
The notional amount of unresolved GSE repurchase claims totaled $1.1 billion at March 31, 2013 compared to $13.5 billion at December 31, 2012. As a result of the FNMA Settlement, $12.2 billion of GSE repurchase claims outstanding at December 31, 2012 were resolved in January 2013.
46
The notional amount of unresolved monoline repurchase claims totaled $2.5 billion at March 31, 2013 compared to $2.4 billion at December 31, 2012. We have had limited loan-level repurchase claims experience with the majority of the monoline insurers due to ongoing litigation. In our experience, the monolines have been generally unwilling to withdraw repurchase claims, regardless of whether and what evidence was offered to refute a claim. Substantially all of the unresolved monoline claims pertain to second-lien loans and are currently the subject of litigation. As a result of the MBIA Settlement, $945 million of monoline repurchase claims outstanding at March 31, 2013 were resolved in May 2013.
The notional amount of unresolved repurchase claims from private-label securitization trustees, third-party securitization sponsors, whole-loan investors and others increased to $13.5 billion at March 31, 2013 compared to $12.3 billion at December 31, 2012. The increase in the notional amount of unresolved repurchase claims is primarily due to continued submission of claims by private-label securitization trustees and a third-party securitization sponsor; the level of detail, support and analysis which impacts overall claim quality and, therefore, claims resolution; and the lack of an established process to resolve disputes related to these claims. We expect unresolved repurchase claims related to private-label securitizations to continue to increase as claims continue to be submitted by private-label securitization trustees and third-party securitization sponsors and there is not an established process for the ultimate resolution of claims on which there is a disagreement.
In addition to, and not included in, the total unresolved repurchase claims of $17.1 billion at March 31, 2013, we have received repurchase demands from private-label securitization investors and a master servicer where we believe the claimants have not satisfied the contractual thresholds to direct the securitization trustee to take action and/or that these demands are otherwise procedurally or substantively invalid. The total amounts outstanding of such demands were $1.6 billion at both March 31, 2013 and December 31, 2012, comprised of $1.3 billion in claims received during 2012 and approximately $300 million related to trusts covered by the BNY Mellon Settlement. We do not believe that the $1.6 billion in demands outstanding at March 31, 2013 represents valid repurchase claims and, therefore, it is not possible to predict the resolution with respect to such demands.
Open Mortgage Insurance Rescission Notices
In addition to repurchase claims, we receive notices from mortgage insurance companies of claim denials, cancellations or coverage rescission (collectively, MI rescission notices) and the number of such notices has remained elevated. At March 31, 2013, we had approximately 109,000 open MI rescission notices compared to 110,000 at December 31, 2012, including 48,000 pertaining principally to first-lien mortgages serviced for others, 11,000 pertaining to loans held-for-investment (HFI) and 50,000 pertaining to ongoing litigation for second-lien mortgages. Approximately 26,000 of the open MI rescission notices pertaining to first-lien mortgages serviced for others are related to loans sold to FNMA. As of March 31, 2013, 35 percent of the MI rescission notices received have been resolved. Of those resolved, 19 percent were resolved through our acceptance of the MI rescission, 61 percent were resolved through reinstatement of coverage or payment of the claim by the mortgage insurance company, and 20 percent were resolved on an aggregate basis through settlement, policy commutation or similar arrangement. As of March 31, 2013, 65 percent of the MI rescission notices we have received have not yet been resolved. Of those not yet resolved, 46 percent are implicated by ongoing litigation where no loan-level review is currently contemplated or required to preserve our legal rights. In this litigation, the litigating mortgage insurance companies are also seeking bulk rescission of certain policies, separate and apart from loan-by-loan denials or rescissions. We are in the process of reviewing 31 percent of the remaining open MI rescission notices, and we have reviewed and are contesting the MI rescission with respect to 69 percent of these remaining open MI rescission notices. Of the remaining open MI rescission notices, 41 percent are also the subject of ongoing litigation; although, at present, these MI rescissions are being processed in a manner generally consistent with those not affected by litigation.
Although the FNMA Settlement did not resolve underlying MI rescission notices, the FNMA Settlement resolved significant representations and warranties exposures, including unresolved and potential repurchase claims from FNMA resulting solely from MI rescission notices relating to loans covered by the FNMA Settlement. Our pipeline of unresolved repurchase claims from the GSEs resulting solely from MI rescission notices decreased to $427 million at March 31, 2013 from $2.3 billion at December 31, 2012 as the FNMA Settlement resolved approximately $1.9 billion of such unresolved repurchase claims. Many of these claims represent repurchase claims on loans for which we received an MI rescission notice that is included in the 26,000 open MI rescission notices referenced in the paragraph above. In addition, the FNMA Settlement clarified the parties' obligations with respect to MI rescission notices including establishing timeframes for certain payments and other actions, setting parameters for potential bulk settlements and providing for cooperation in future dealings with mortgage insurers. As a result, we are required to pay the amount of certain MI coverage to FNMA as a result of MI claims rescissions in advance of collection from the mortgage insurance companies and have remitted the amounts required under the agreement related to the 26,000 open MI rescission notices. In certain cases, we may not ultimately collect all such amounts from the mortgage insurance companies. For additional information, see Off-Balance Sheet Arrangements and Contractual Obligations – Unresolved Claims Status – Open Mortgage Insurance Rescission Notices on page 57 of the MD&A of the Corporation's 2012 Annual Report on Form 10-K.
47
Representations and Warranties Liability
The liability for representations and warranties and corporate guarantees is included in accrued expenses and other liabilities on the Consolidated Balance Sheet and the related provision is included in mortgage banking income.
The liability for obligations under representations and warranties and the corresponding estimated range of possible loss for these representations and warranties exposures do not consider any losses related to litigation matters, including litigation brought by monoline insurers, nor do they include any separate foreclosure costs and related costs, assessments and compensatory fees or any other possible losses related to potential claims for breaches of performance of servicing obligations, except as such losses are included as potential costs of the BNY Mellon Settlement, potential securities law or fraud claims or potential indemnity or other claims against us, including claims related to loans insured by the FHA. We are not able to reasonably estimate the amount of any possible loss with respect to any such servicing, securities law, fraud or other claims against us, except to the extent reflected in the aggregate estimated range of possible loss for litigation and regulatory matters disclosed in Note 11 – Commitments and Contingencies to the Consolidated Financial Statements; however, such loss could be material.
At March 31, 2013 and December 31, 2012, the liability for representations and warranties and corporate guarantees was $14.1 billion and $19.0 billion, with the decrease primarily driven by the payment and repurchase of loans related to the FNMA Settlement. For the three months ended March 31, 2013 and 2012, the representations and warranties and corporate guarantees provision was $250 million and $282 million. The provision for the three months ended March 31, 2013 was primarily driven by remaining GSE exposures and, to a lesser extent, by our obligations related to MI rescissions.
Estimated Range of Possible Loss
Our estimated liability at March 31, 2013 for obligations under representations and warranties is necessarily dependent on, and limited by, a number of factors, including for private-label securitizations, the implied repurchase experience based on the BNY Mellon Settlement, as well as certain other assumptions and judgmental factors. Accordingly, future provisions associated with obligations under representations and warranties may be materially impacted if actual experiences are different from historical experience or our understandings, interpretations or assumptions.
In the case of non-GSE exposures, including private-label securitizations, our estimate of the representations and warranties liability and the corresponding estimated range of possible loss considers, among other things, repurchase experience based on the BNY Mellon Settlement, adjusted to reflect differences between the trusts covered by the BNY Mellon Settlement (Covered Trusts) and the remainder of the population of private-label securitizations, and assumes that the conditions to the BNY Mellon Settlement will be met. Where relevant, we also take into account more recent experience, such as increased claims and other facts and circumstances, such as bulk settlements, as we believe appropriate.
The representations and warranties liability represents our best estimate of probable incurred losses as of March 31, 2013. However, it is reasonably possible that future representations and warranties losses may occur in excess of the amounts recorded for these exposures. In addition, we have not recorded any representations and warranties liability for certain potential private-label securitization and whole-loan exposures where we have little to no claim activity. We currently estimate that the range of possible loss for representations and warranties exposures could be up to $4 billion over accruals at both March 31, 2013 and December 31, 2012. The estimated range of possible loss reflects the impact of the FNMA Settlement and, as a result, addresses principally non-GSE exposures. The estimated range of possible loss related to these representations and warranties exposures does not represent a probable loss, and is based on currently available information, significant judgment and a number of assumptions that are subject to change. Our estimated range of possible loss related to representations and warranties exposures does not include possible losses related to monoline insurers.
48
Future provisions and/or ranges of possible loss for representations and warranties may be significantly impacted if actual experiences are different from our assumptions in our predictive models, including, without limitation, ultimate resolution of the BNY Mellon Settlement, estimated repurchase rates, estimated MI rescission rates, economic conditions, estimated home prices, consumer and counterparty behavior, and a variety of other judgmental factors. Adverse developments with respect to one or more of the assumptions underlying the liability for representations and warranties and the corresponding estimated range of possible loss could result in significant increases to future provisions and/or the estimated range of possible loss. For example, an appellate court, in the context of claims brought by a monoline insurer, recently disagreed with our interpretation that a loan must be in default in order to satisfy the underlying agreements' requirement that a breach have a material and adverse effect. If that decision is extended to non-monoline contexts, it could significantly impact our provision and/or the estimated range of possible loss. Additionally, if court rulings related to monoline litigation, including one related to us, that have allowed sampling of loan files instead of requiring a loan-by-loan review to determine if a representations and warranties breach has occurred, are followed generally by the courts in future monoline litigation, private-label securitization counterparties may view litigation as a more attractive alternative compared to a loan-by-loan review. Finally, although we believe that the representations and warranties typically given in non-GSE transactions are less rigorous and actionable than those given in GSE transactions, we do not have significant experience resolving loan-level claims in non-GSE transactions to measure the impact of these differences on the probability that a loan will be required to be repurchased.
For additional information about the methodology used to estimate the representations and warranties liability and the corresponding estimated range of possible loss for representations and warranties exposures, see Note 8 – Representations and Warranties Obligations and Corporate Guarantees to the Consolidated Financial Statements and, for information related to the sensitivity of the assumptions used to estimate our liability for obligations under representations and warranties, see Complex Accounting Estimates – Representations and Warranties on page 126 of the MD&A of the Corporation's 2012 Annual Report on Form 10-K.
Experience with Government-sponsored Enterprises
As a result of the FNMA Settlement and earlier bulk settlements with the GSEs, our exposure to repurchase claims from the GSEs for vintages prior to 2009 has been significantly reduced. After these settlements, our exposure to representations and warranties liability for loans originated prior to 2009 and sold to the GSEs is limited to loans with an original principal balance of $205.9 billion and loans with certain defects excluded from the settlements that we do not believe will be material, such as title defects and certain specified violations of FNMA's charter. As of March 31, 2013, of the $205.9 billion, approximately $165.3 billion in principal has been paid, $10.9 billion in principal has defaulted or was severely delinquent and the notional amount of unresolved repurchase claims submitted by the GSEs was $861 million related to these vintages. We have performed an initial review with respect to $690 million of these claims and do not believe a valid basis for repurchase has been established by the claimant and are still in the process of reviewing the remaining $171 million of these claims.
The FNMA Settlement and earlier bulk settlements did not address loans originated after 2008. However, we believe that changes made to our operations and underwriting policies have reduced our exposure to the GSEs related to loans originated after 2008. In addition, we estimate that lifetime losses on these vintages will be significantly less than the losses we have experienced with respect to vintages prior to 2009. We have sold $497.7 billion of loans originated after 2008 to the GSEs. At March 31, 2013, approximately $213.4 billion in principal has been paid, $4.2 billion in principal has defaulted or was severely delinquent and the notional amount of unresolved repurchase claims submitted by the GSEs was $277 million related to these vintages. We have performed an initial review with respect to $244 million of these claims and do not believe a valid basis for repurchase has been established by the claimant and are still in the process of reviewing the remaining $33 million of these claims.
Experience with Investors Other than Government-sponsored Enterprises
In prior years, legacy companies and certain subsidiaries sold pools of first-lien mortgage loans and home equity loans as private-label securitizations or in the form of whole loans originated from 2004 through 2008 with an original principal balance of $963 billion to investors other than GSEs (although the GSEs are investors in certain private-label securitizations), of which approximately $534 billion in principal has been paid, $244 billion in principal has defaulted or was severely delinquent, and $185 billion is current or less than 180 days past due at March 31, 2013. For additional information, see Off-Balance Sheet Arrangements and Contractual Obligations – Experience with Investors Other than Government-sponsored Enterprises on page 59 of the MD&A of the Corporation's 2012 Annual Report on Form 10-K.
49
Table 12 details the population of loans originated between 2004 and 2008 and the population of loans sold as whole loans or in non-agency securitizations by entity and product together with the defaulted and severely delinquent loans stratified by the number of payments the borrower made prior to default or becoming severely delinquent as of March 31, 2013. We believe many of the defaults observed in these securitizations have been, and continue to be, driven by external factors like the substantial depreciation in home prices, persistently high unemployment and other negative economic trends, diminishing the likelihood that any loan defect (assuming one exists at all) was the cause of a loan's default. As of March 31, 2013, approximately 25 percent of the loans sold to non-GSEs that were originated between 2004 and 2008 have defaulted or are severely delinquent. Of the original principal balance for Countrywide, $409 billion is included in the BNY Mellon Settlement and, of this amount, $111 billion was defaulted or severely delinquent at March 31, 2013.
Table 12 | |||||||||||||||||||||||||||||||||||
Overview of Non-Agency Securitization and Whole Loan Balances | |||||||||||||||||||||||||||||||||||
Principal Balance |
Defaulted or Severely Delinquent |
||||||||||||||||||||||||||||||||||
(Dollars in billions) |
Original Principal Balance |
Outstanding Principal Balance March 31 2013 |
Outstanding Principal Balance 180 Days or More Past Due |
Defaulted Principal Balance |
Defaulted or Severely Delinquent |
Borrower Made Less than 13 Payments |
Borrower Made 13 to 24 Payments |
Borrower Made 25 to 36 Payments |
Borrower Made More than 36 Payments |
||||||||||||||||||||||||||
By Entity |
|||||||||||||||||||||||||||||||||||
Bank of America |
$ |
100 |
$ |
21 |
$ |
4 |
$ |
6 |
$ |
10 |
$ |
1 |
$ |
2 |
$ |
2 |
$ |
5 |
|||||||||||||||||
Countrywide |
716 |
195 |
52 |
137 |
189 |
25 |
45 |
46 |
73 |
||||||||||||||||||||||||||
Merrill Lynch |
65 |
16 |
3 |
14 |
17 |
3 |
4 |
3 |
7 |
||||||||||||||||||||||||||
First Franklin |
82 |
17 |
5 |
23 |
28 |
5 |
6 |
5 |
12 |
||||||||||||||||||||||||||
Total (1, 2)
|
$ |
963 |
$ |
249 |
$ |
64 |
$ |
180 |
$ |
244 |
$ |
34 |
$ |
57 |
$ |
56 |
$ |
97 |
|||||||||||||||||
By Product |
|||||||||||||||||||||||||||||||||||
Prime |
$ |
302 |
$ |
79 |
$ |
10 |
$ |
24 |
$ |
34 |
$ |
2 |
$ |
6 |
$ |
7 |
$ |
19 |
|||||||||||||||||
Alt-A |
172 |
55 |
13 |
37 |
50 |
8 |
12 |
12 |
18 |
||||||||||||||||||||||||||
Pay option |
150 |
41 |
16 |
40 |
56 |
5 |
14 |
16 |
21 |
||||||||||||||||||||||||||
Subprime |
245 |
60 |
21 |
61 |
82 |
17 |
20 |
16 |
29 |
||||||||||||||||||||||||||
Home equity |
88 |
12 |
— |
18 |
18 |
2 |
5 |
4 |
7 |
||||||||||||||||||||||||||
Other |
6 |
2 |
4 |
— |
4 |
— |
— |
1 |
3 |
||||||||||||||||||||||||||
Total |
$ |
963 |
$ |
249 |
$ |
64 |
$ |
180 |
$ |
244 |
$ |
34 |
$ |
57 |
$ |
56 |
$ |
97 |
|||||||||||||||||
(1) |
Excludes transactions sponsored by Bank of America and Merrill Lynch where no representations or warranties were made. |
(2) |
Includes exposures on third-party sponsored transactions related to legacy entity originations. |
Monoline Insurers
Legacy companies sold $184.5 billion of loans originated between 2004 and 2008 into monoline-insured securitizations, which are included in Table 12, including $103.9 billion of first-lien mortgages and $80.6 billion of second-lien mortgages. Of these balances, $48.0 billion of the first-lien mortgages and $52.1 billion of the second-lien mortgages have been paid in full, and $35.4 billion of the first-lien mortgages and $17.7 billion of the second-lien mortgages have defaulted or are severely delinquent at March 31, 2013. At least 25 payments have been made on approximately 58 percent of the defaulted and severely delinquent loans. Of the first-lien mortgages sold, $39.1 billion, or 38 percent, were sold as whole loans to other institutions which subsequently included these loans with those of other originators in private-label securitization transactions in which the monolines insured one or more securities. During the three months ended March 31, 2013, there was minimal repurchase claim activity with the monolines.
At March 31, 2013, for loans originated between 2004 and 2008, the unpaid principal balance of loans related to unresolved monoline repurchase claims was $2.5 billion compared to $2.4 billion at December 31, 2012. At March 31, 2013, the unpaid principal balance of loans in these vintages for which the monolines had requested loan files for review but for which no repurchase claim had been received was $5.3 billion, excluding loans that had been paid in full or resolved through settlements. Of these file requests, $4.0 billion are aged and subject to ongoing litigation. There will likely be additional requests for loan files in the future leading to repurchase claims. In addition, we have received claims from private-label securitization trustees and a third-party securitization sponsor related to first-lien third-party sponsored securitizations that include monoline insurance.
50
The MBIA Settlement resolved outstanding and potential claims between the parties to the settlement involving 31 first- and 17 second-lien RMBS trusts for which MBIA provided financial guarantee insurance, including $945 million of monoline repurchase claims outstanding at March 31, 2013. In addition, this settlement covered loans with an unpaid principal balance of $2.6 billion for which we have received file requests but for which no repurchase claim was received as of March 31, 2013. The first- and second-lien mortgages in the covered RMBS trusts had an original principal balance of $29.3 billion and $25.5 billion, and an unpaid principal balance of $9.8 billion and $9.4 billion as of March 31, 2013.
For additional information on historical repurchase claim activity, see Off-Balance Sheet Arrangements and Contractual Obligations – Experience with Investors Other than Government-sponsored Enterprises – Monoline Insurers on page 60 of the MD&A of the Corporation's 2012 Annual Report on Form 10-K.
Whole Loans and Private-label Securitizations
Legacy entities, and to a lesser extent Bank of America, sold loans to investors as whole loans or via private-label securitizations. The majority of the loans sold were included in private-label securitizations, including third-party sponsored transactions. We provided representations and warranties to the whole-loan investors and these investors may retain those rights even when the whole loans were aggregated with other collateral into private-label securitizations sponsored by the whole-loan investors. The loans sold with an original total principal balance of $778.2 billion, included in Table 12, were originated between 2004 and 2008, of which $433.7 billion have been paid in full and $190.8 billion are defaulted or severely delinquent at March 31, 2013. At least 25 payments have been made on approximately 64 percent of the defaulted and severely delinquent loans. We have received approximately $20.7 billion of representations and warranties repurchase claims from whole-loan investors, including third-party sponsors, and private-label securitization investors and trustees related to these vintages, including $11.8 billion from private-label securitization trustees, $8.1 billion from whole-loan investors and $813 million from one private-label securitization counterparty. In private-label securitizations, certain presentation thresholds need to be met in order for investors to direct a trustee to assert repurchase claims. Continued high levels of new private-label claims are primarily related to repurchase requests received from trustees and third-party sponsors for private-label securitization transactions not included in the BNY Mellon Settlement, including claims related to first-lien third-party sponsored securitizations that include monoline insurance. Over time, there has been an increase in requests for loan files from certain private-label securitization trustees, as well as requests for tolling agreements to toll the applicable statute of limitations relating to representations and warranties repurchase claims, and we believe it is likely that these requests will lead to an increase in repurchase claims from private-label securitization trustees with standing to bring such claims. In addition, private-label securitization trustees may have obtained loan files through other means, including litigation and administrative subpoenas.
We have resolved $7.4 billion of the claims received from whole-loan investors and private-label securitization investors and trustees with losses of $1.7 billion. The majority of these resolved claims were from third-party whole-loan investors. Approximately $3.0 billion of these claims were resolved through repurchase or indemnification and $4.4 billion were rescinded by the investor. At March 31, 2013, for loans originated between 2004 and 2008, the notional amount of unresolved repurchase claims submitted by private-label securitization trustees and whole-loan investors was $13.3 billion. We have performed an initial review with respect to $12.4 billion of these claims and do not believe a valid basis for repurchase has been established by the claimant and are still in the process of reviewing the remaining $908 million of these claims.
Certain whole-loan investors have engaged with us in a consistent repurchase process and we have used that and other experience to record a liability related to existing and future claims from such counterparties. The BNY Mellon Settlement and subsequent activity with certain counterparties led to the determination that we had sufficient experience to record a liability related to our exposure on certain private-label securitizations but did not provide sufficient experience related to certain private-label securitizations sponsored by third-party whole-loan investors. As it relates to the other private-label securitizations sponsored by third-party whole-loan investors and certain other whole loan sales, it is not possible to determine whether a loss has occurred or is probable and, therefore, no representations and warranties liability has been recorded in connection with these transactions. Until we receive a repurchase claim, we generally do not review loan files related to private-label securitizations sponsored by third-party whole-loan investors (and are not required by the governing documents to do so). Our estimated range of possible loss related to representations and warranties exposures as of March 31, 2013 included possible losses related to these whole loan sales and private-label securitizations sponsored by third-party whole-loan investors.
Private-label securitization investors generally do not have the contractual right to demand repurchase of loans directly or the right to access loan files. We have received repurchase demands totaling $1.6 billion from private-label securitization investors and a master servicer where in each case we believe the claimant has not satisfied the contractual thresholds to direct the securitization trustee to take action and/or that the demands are otherwise procedurally or substantively invalid.
51
Servicing Matters and Foreclosure Processes |
We service a large portion of the loans we or our subsidiaries have securitized and also service loans on behalf of third-party securitization vehicles and other investors. Our servicing obligations are set forth in servicing agreements with the applicable counterparty. These obligations may include, but are not limited to, loan repurchase requirements in certain circumstances, indemnifications, payment of fees, advances for foreclosure costs that are not reimbursable, or responsibility for losses in excess of partial guarantees for VA loans.
Servicing agreements with the GSEs generally provide the GSEs with broader rights relative to the servicer than are found in servicing agreements with private investors. For example, each GSE typically claims the right to demand that the servicer repurchase loans that breach the seller's representations and warranties made in connection with the initial sale of the loans even if the servicer was not the seller. The GSEs claim that they have the contractual right to demand indemnification or loan repurchase for certain servicing breaches. In addition, the GSEs' first-lien mortgage seller/servicer guides provide for timelines to resolve delinquent loans through workout efforts or liquidation, if necessary, and purport to require the imposition of compensatory fees if those deadlines are not satisfied except for reasons beyond the control of the servicer, although we believe that the governing contracts, our course of dealing, and collective past practices and understandings should inform resolution of these matters. In addition, many non-agency RMBS and whole-loan servicing agreements state that the servicer may be liable for failure to perform its servicing obligations in keeping with industry standards or for acts or omissions that involve willful malfeasance, bad faith or gross negligence in the performance of, or reckless disregard of, the servicer's duties.
It is not possible to reasonably estimate our liability with respect to certain potential servicing-related claims. While we have recorded certain accruals for servicing-related claims, the amount of potential liability in excess of existing accruals could be material. For additional information, see Off-Balance Sheet Arrangements and Contractual Obligations – Servicing Matters and Foreclosure Processes on page 61 of the MD&A of the Corporation's 2012 Annual Report on Form 10-K.
In October 2010, we voluntarily stopped taking residential mortgage foreclosure proceedings to judgment in states where foreclosure requires a court order following a legal proceeding (judicial states) and stopped foreclosure sales in all states in order to complete an assessment of related business processes. We have resumed foreclosure sales in all states, but our progress on foreclosure sales in judicial states has been much slower than in states where foreclosure does not require a court order (nonjudicial states).
2013 IFR Acceleration Agreement
On January 7, 2013, Bank of America and other mortgage servicing institutions entered into an agreement with the Office of the Comptroller of the Currency (OCC) and the Federal Reserve to cease the Independent Foreclosure Review (IFR) that had commenced pursuant to a consent order entered into by Bank of America with the Federal Reserve and by BANA with the OCC on April 13, 2011 (2011 OCC Consent Order) and replace it with an accelerated remediation process (2013 IFR Acceleration Agreement). The 2013 IFR Acceleration Agreement requires us to provide $1.8 billion of borrower assistance in the form of loan modifications and other foreclosure prevention actions, and in addition, we made a cash payment of $1.1 billion into a qualified settlement fund in the first quarter of 2013, which was fully reserved at December 31, 2012. The borrower assistance program is not expected to result in any incremental credit provision, as we believe that the existing allowance for credit losses is adequate to absorb any costs that have not already been recorded as charge-offs.
National Mortgage Settlement
In March 2012, we entered into settlement agreements (collectively, the National Mortgage Settlement) with (1) the U.S. Department of Justice, various federal regulatory agencies and 49 state Attorneys General to resolve federal and state investigations into certain residential mortgage origination, servicing and foreclosure practices, (2) HUD to resolve certain claims relating to the origination of FHA-insured mortgage loans, primarily originated by Countrywide prior to and for a period following our acquisition of that lender, and (3) each of the Federal Reserve and the OCC regarding civil monetary penalties related to conduct that was the subject of consent orders entered into with the banking regulators in April 2011. The National Mortgage Settlement was entered by the court as a consent judgment on April 5, 2012. The National Mortgage Settlement provided for the establishment of certain uniform servicing standards, upfront cash payments of approximately $1.9 billion to the state and federal governments and for borrower restitution, approximately $7.6 billion in borrower assistance in the form of, among other things, credits earned for principal reduction, short sales, deeds-in-lieu of foreclosure and approximately $1.0 billion of credits earned for interest rate reduction modifications. In addition, the settlement with HUD provided for an upfront cash payment of $500 million to settle certain claims related to FHA-insured loans. We will also be obligated to provide additional cash payments of up to $850 million if we fail to earn an additional $850 million of credits stemming from incremental first-lien principal reductions over a three-year period.
52
We also entered into agreements with several states under which we committed to perform certain minimum levels of principal reduction and related activities within those states in connection with the National Mortgage Settlement, and under which we could be required to make additional payments if we fail to meet such minimum levels.
Subject to confirmation by the independent monitor appointed as a result of the National Mortgage Settlement to review and certify compliance with its provisions, we believe we have substantially fulfilled all borrower assistance, rate reduction modification and principal reduction commitments and, therefore, do not expect to be required to make additional cash payments. The borrower assistance program did not result in any incremental credit losses as of the settlement date, as the existing allowance for credit losses was adequate to absorb any losses that had not already been charged-off. Under the interest rate reduction program, modifications of approximately 20,200 loans with an aggregate unpaid principal balance of $5.4 billion have been completed as of March 31, 2013, including approximately 12,600 modifications that were completed during the first quarter. These modifications, which are not accounted for as troubled debt restructurings (TDRs), provided for an average interest rate reduction of approximately two percent, resulting in an estimated decrease in fair value of the modified loans of approximately $600 million and a reduction in annual interest income of approximately $104 million. An additional 2,500 loans are expected to be modified under this program. Although we may incur additional operating costs such as servicing costs to implement parts of the National Mortgage Settlement in future periods, we do not expect that those costs will be material.
Under the terms of the National Mortgage Settlement, the federal and participating state governments agreed to release us from further liability for certain alleged residential mortgage origination, servicing and foreclosure deficiencies. In settling origination issues related to FHA-guaranteed loans originated on or before April 30, 2009, we received a release from further liability for all origination claims with respect to such loans if an insurance claim had been submitted to the FHA prior to January 1, 2012 and a release of multiple damages and penalties, but not single damages, if no such claim had been submitted. In addition, provided we meet our assistance and remediation commitments, the OCC agreed not to assess, and we will not be obligated to pay to the Federal Reserve, any civil monetary penalties.
The National Mortgage Settlement does not cover certain claims arising out of origination, securitization (including representations made to investors with respect to MBS), criminal claims, private claims by borrowers, claims by certain states for injunctive relief or actual economic damages to borrowers related to the Mortgage Electronic Registration Systems, Inc. (MERS), and claims by the GSEs (including repurchase demands), among other items. For additional information on MERS, see Off-Balance Sheet Arrangements and Contractual Obligations – Mortgage Electronic Registration Systems, Inc. on page 63 of the MD&A of the Corporation's 2012 Annual Report on Form 10-K.
Additionally, we continue to be subject to additional borrower and non-borrower litigation and governmental and regulatory scrutiny related to our past and current origination, servicing and foreclosure activities, including those claims not covered by the National Mortgage Settlement. This scrutiny may extend beyond our pending foreclosure matters to issues arising out of alleged irregularities with respect to previously completed foreclosure activities. The current environment of heightened regulatory scrutiny may subject us to inquiries or investigations that could significantly adversely affect our reputation and result in material costs to us.
53
Impact of Foreclosure Delays
Foreclosure delays impact our default-related servicing costs. We believe default-related servicing costs peaked in late 2012 and we anticipate that these costs will decline in 2013. However, unexpected foreclosure delays in 2013 could impact the rate of decline. Default-related servicing costs include costs related to resources needed for implementing new servicing standards mandated for the industry, including as part of the National Mortgage Settlement, other operational changes and operational costs due to delayed foreclosures, and do not include mortgage-related assessments, waivers and similar costs related to foreclosure delays.
Other areas of our operations are also impacted by foreclosure delays. In the three months ended March 31, 2013, we recorded $199 million of mortgage-related assessments, waivers and similar costs related to foreclosure delays. It is also possible that the delays in foreclosure sales may result in additional costs and expenses, including costs associated with the maintenance of properties or possible home price declines while foreclosures are delayed. Finally, the time to complete foreclosure sales may continue to be protracted, which may result in a greater number of nonperforming loans and increased servicing advances, and may impact the collectability of such advances and the value of our MSR asset, MBS and real estate owned properties. Accordingly, the ultimate resolution of disagreements with counterparties, delays in foreclosure sales beyond those currently anticipated, and any issues that may arise out of alleged irregularities in our foreclosure process could significantly increase the costs associated with our mortgage operations.
Mortgage-related Settlements – Servicing Matters
In connection with the BNY Mellon Settlement, BANA has agreed to implement certain servicing changes. The Trustee and BANA have agreed to clarify and conform certain servicing standards related to loss mitigation. In particular, the BNY Mellon Settlement clarifies that it is permissible to apply the same loss mitigation strategies to the Covered Trusts as are applied to BANA affiliates' HFI portfolios. This portion of the agreement was effective in the second quarter of 2011 and is not conditioned on final court approval.
BANA also agreed to transfer the servicing rights related to certain high-risk loans to qualified subservicers on a schedule that began with the signing of the BNY Mellon Settlement. This servicing transfer protocol will reduce the servicing fees payable to BANA in the future. Upon final court approval of the BNY Mellon Settlement, failure to meet the established benchmarking standards for loans not in subservicing arrangements can trigger the payment of agreed-upon fees. Additionally, we and Countrywide have agreed to work to resolve with the Trustee certain mortgage documentation issues related to the enforceability of mortgages in foreclosure and to reimburse the related Covered Trust for any loss if BANA is unable to foreclose on the mortgage and the Covered Trust is not made whole by a title policy because of these issues. These agreements will terminate if final court approval of the BNY Mellon Settlement is not obtained, although we could still have exposure under the pooling and servicing agreements related to the mortgages in the Covered Trusts for these issues.
In connection with the National Mortgage Settlement, BANA has agreed to implement certain additional servicing changes. The uniform servicing standards established under the National Mortgage Settlement are broadly consistent with the residential mortgage servicing practices imposed by the 2011 OCC Consent Order; however, they are more prescriptive and cover a broader range of our residential mortgage servicing activities. These standards are intended to strengthen procedural safeguards and documentation requirements associated with foreclosure, bankruptcy and loss mitigation activities, as well as addressing the imposition of fees and the integrity of documentation, with a goal of ensuring greater transparency for borrowers. These uniform servicing standards also obligate us to implement compliance processes reasonably designed to provide assurance of the achievement of these objectives. Compliance with the uniform servicing standards will be assessed by a monitor based on the measurement of outcomes with respect to these objectives. Implementation of these uniform servicing standards is expected to contribute to elevated costs associated with the servicing process, but is not expected to result in material delays or dislocation in the performance of our mortgage servicing obligations, including the completion of foreclosures. For additional information, see Off-Balance Sheet Arrangements and Contractual Obligations – Mortgage-related Settlements – Servicing Matters on page 63 of the MD&A of the Corporation's 2012 Annual Report on Form 10-K.
54
Regulatory Matters |
U.K. Regulatory Framework
Prior to April 1, 2013, our financial services operations in the U.K. were subject to regulation by and supervision of the Financial Services Authority (FSA). On April 1, 2013, the U.K. abolished the FSA, replacing it with two new regulators, the Prudential Regulatory Authority (PRA) and the Financial Conduct Authority (FCA). The PRA operates as a subsidiary of the Bank of England with responsibility for prudential regulation and supervision of banks, insurers and systemically significant investment firms. The FCA regulates and supervises the market conduct of all U.K. financial firms and prudentially regulates those firms not within the scope of the PRA. Our financial services operations in the U.K. are now subject to regulation and supervision by both the PRA and FCA.
Financial Reform Act
The Dodd-Frank Wall Street Reform and Consumer Protection Act (Financial Reform Act), which was signed into law on July 21, 2010, enacted sweeping financial regulatory reform and has altered and will continue to alter the way in which we conduct certain businesses, increase our costs and reduce our revenues. Many aspects of the Financial Reform Act remain subject to final rulemaking which will take effect over several years, making it difficult to anticipate the precise impact on the Corporation, our customers or the financial services industry.
Derivatives
The Financial Reform Act includes measures to broaden the scope of derivative instruments subject to regulation by requiring clearing and exchange trading of certain derivatives; imposing new capital, margin, reporting, registration and business conduct requirements for certain market participants; and imposing position limits on certain over-the-counter (OTC) derivatives. The Financial Reform Act grants the Commodity Futures Trading Commission (CFTC) and the Securities and Exchange Commission (SEC) substantial new authority and requires numerous rulemakings by these agencies. Swap dealers conducting dealing activity with U.S. persons above a specified dollar threshold were required to register with the CFTC on or before December 31, 2012. We registered BANA, Merrill Lynch Commodities Inc., Merrill Lynch Capital Services Inc., Merrill Lynch Financial Markets Inc., Merrill Lynch International and Merrill Lynch International Bank Limited as swap dealers on December 31, 2012. Upon registration, swap dealers became subject to additional CFTC rules relating to business conduct and reporting, and will continue to become subject to additional CFTC rules as and when such rules take effect. Those rules include, but are not limited to, measures that require clearing and exchange trading of certain derivatives, new capital and margin requirements for certain market participants, and additional reporting requirements for derivatives under the jurisdiction of the CFTC. The CFTC also granted relief from some of the rules that would have become effective during the fourth quarter of 2012, delaying the application of most external business conduct requirements until May 1, 2013 (with a further delay to May 15, 2013 for prime brokerage arrangements), and trading relationship and trade processing rules until July 1, 2013. Regulatory reporting requirements on a real-time basis for all derivatives subject to CFTC jurisdiction became effective for swap dealers in the first quarter of 2013. The Financial Reform Act will also require BANA to "push out" certain derivatives activity to one or more non-bank affiliates as of July 13, 2013; however, the effective date for this requirement may be extended for up to two years at the option of the relevant banking regulators in consultation with the SEC and CFTC. While the CFTC has provided temporary exemptive relief from application of derivatives requirements of the Financial Reform Act for certain non-U.S. derivatives activity, there remains some uncertainty as to how the derivatives requirements of the Financial Reform Act will apply to non-U.S. derivatives activity because the CFTC has not yet adopted final cross-border guidance.
The CFTC has completed much of its other rulemakings, with the exception of final margin, capital and exchange trading rules, while the SEC has finalized a small number of clearing-related rules. The ultimate impact of the derivatives regulations that have not yet been finalized and the time it will take to comply remain uncertain. The final regulations will impose additional operational and compliance costs on us and may require us to restructure certain businesses and may negatively impact our results of operations.
The Consumer Financial Protection Bureau
The Financial Reform Act established the Consumer Financial Protection Bureau (CFPB), which principally regulates the offering of consumer financial products or services under federal consumer financial laws, and which has commenced its supervisory oversight. Certain federal consumer financial laws to which the Corporation is subject including, but not limited to, the Equal Credit Opportunity Act, Home Mortgage Disclosure Act, Electronic Fund Transfers Act, Fair Credit Reporting Act, Truth in Lending and Truth in Savings Acts are enforced by the CFPB, subject to certain statutory limitations. Through its rulemaking authority, the CFPB has promulgated several proposed and final rules that will affect our consumer businesses. Among these initiatives is a recently-issued final rule implementing sections of the Financial Reform Act establishing "ability to repay" and "qualified mortgage" standards under the Truth in Lending Act. In addition, the CFPB issued a final rule establishing mortgage loan servicing standards through amendments to the Real Estate Settlement Procedures Act. The CFPB has also finalized rules addressing items such as remittance transfer services, appraisal
55
requirements and loan originator compensation requirements. The Corporation is evaluating the various CFPB rules and proposals and devoting substantial compliance, legal and operational business resources to facilitate compliance with these rules by their respective effective dates. In addition, the Corporation has cooperated with the CFPB on several industry-related information collection requests involving consumer financial products and services, including overdraft fees and practices.
For information regarding other significant regulatory matters, see Note 11 – Commitments and Contingencies to the Consolidated Financial Statements herein, Regulatory Matters on page 64 of the MD&A of the Corporation's 2012 Annual Report on Form 10-K, and Item 1A. Risk Factors of the Corporation's 2012 Annual Report on Form 10-K.
Managing Risk |
Overview |
Risk is inherent in every material business activity that we undertake. Our business exposes us to strategic, credit, market, liquidity, compliance, operational and reputational risks. We must manage these risks to maximize our long-term results by ensuring the integrity of our assets and the quality of our earnings.
We take a comprehensive approach to risk management. We have a defined risk framework and articulated risk appetite which was approved on January 23, 2013 by the Corporation's Board of Directors (the Board). Risk management planning is integrated with strategic, financial and customer/client planning so that goals and responsibilities are aligned across the organization. Risk is managed in a systematic manner by focusing on the Corporation as a whole as well as managing risk across the enterprise and within individual business units, products, services and transactions, and across all geographic locations. We maintain a governance structure that delineates the responsibilities for risk management activities, as well as governance and oversight of those activities.
Enterprise-wide Stress Testing
As a part of our core risk management practices, we conduct enterprise-wide stress tests on a periodic basis to better understand balance sheet, earnings, capital and liquidity sensitivities to certain economic and business scenarios, including economic and market conditions that are more severe than anticipated. These enterprise-wide stress tests provide illustrative hypothetical potential impacts from our risk profile on our balance sheet, earnings, capital and liquidity and serve as a key component of our capital, liquidity and risk management practices. Scenarios are selected by the Asset Liability and Market Risk Committee (ALMRC) and approved by the Chief Financial Officer and the Chief Risk Officer. Impacts to each business from each scenario are then determined and analyzed, primarily by leveraging the models and processes utilized in everyday management routines. Impacts are assessed along with potential mitigating actions that may be taken. Analysis from such stress scenarios is compiled for and reviewed through our Chief Financial Officer Risk Committee, ALMRC and the Board's Enterprise Risk Committee. For a more detailed discussion of our risk management activities, see pages 66 through 121 of the MD&A of the Corporation's 2012 Annual Report on Form 10-K.
Strategic Risk Management |
Strategic risk is embedded in every business and is one of the major risk categories along with credit, market, liquidity, compliance, operational and reputational risks. It is the risk that results from adverse business decisions, ineffective or inappropriate business plans, or failure to respond to changes in the macroeconomic environment, such as business cycles, competitor actions, changing customer preferences, product obsolescence, technology developments and regulatory environment. We face significant strategic risk due to the changing regulatory environment and the fast-paced development of new products and technologies in the financial services industries. Our appetite for strategic risk is assessed based on the strategic plan, with strategic risks selectively and carefully considered against the backdrop of the evolving marketplace. Strategic risk is managed in the context of our overall financial condition, risk appetite, and stress results, among other considerations. The Chief Executive Officer and executive management team manage and act on significant strategic actions, such as material acquisitions or capital actions subsequent to required review and approval by the Board.
For more information on our Strategic Risk Management activities, see page 70 of the MD&A of the Corporation's 2012 Annual Report on Form 10-K.
56
Capital Management |
The Corporation manages its capital position to maintain sufficient capital to support its business activities and maintain capital, risk and risk appetite commensurate with one another. Additionally, we seek to maintain safety and soundness at all times including under adverse conditions, take advantage of organic growth opportunities, maintain ready access to financial markets, continue to serve as a credit intermediary, remain a source of strength for our subsidiaries, and satisfy current and future regulatory capital requirements.
To determine the appropriate level of capital, we assess the results of our Internal Capital Adequacy Assessment Process (ICAAP), the current economic and market environment, and feedback from key stakeholders including investors, rating agencies and regulators. Based upon this analysis, we set goals for capital ratios to maintain an adequate capital position, including in severe adverse economic scenarios.
The ICAAP incorporates capital forecasts, stress test results, economic capital (which is a component of allocated capital), qualitative risk assessments and assessment of regulatory changes. Throughout the year, we generate regulatory capital and economic capital forecasts that are aligned to the most recent earnings, balance sheet and risk forecasts. We utilize quarterly stress tests to assess the potential impacts to our balance sheet, earnings, capital and liquidity of a variety of stress scenarios. We perform qualitative risk assessments to identify and assess material risks not fully captured in the forecasts, stress tests or economic capital. We regularly assess the capital impacts of proposed changes to regulatory capital requirements. Management regularly assesses ICAAP results and provides documented quarterly assessments of the adequacy of the capital guidelines and capital position to the Board or its committees.
Capital management is integrated into our risk and governance processes, as capital is a key consideration in the development of the strategic plan, risk appetite and risk limits. Effective January 1, 2013, on a prospective basis, we adjusted the amount of capital being allocated to our business segments. The adjustment reflects a refinement to the prior-year methodology (economic capital) which focused solely on internal risk-based economic capital models. The refined methodology (allocated capital) now also considers the effect of regulatory capital requirements in addition to internal risk-based economic capital models. The Corporation's internal risk-based capital models use a risk-adjusted methodology incorporating each segment's credit, market, interest rate, business and operational risk components. See Managing Risk and Strategic Risk Management on page 56 for more information on the nature of these risks. The capital allocated to the business segments is referred to as allocated capital and in prior years was referred to as economic capital, which represent non-GAAP financial measures. Allocated capital in the business segments is subject to change over time. For additional information on the refined methodology, see Business Segment Operations on page 25.
57
Regulatory Capital |
As a financial services holding company, we are subject to the risk-based capital guidelines issued by federal banking regulators which was Basel 1 through December 31, 2012. On January 1, 2013, Basel 1 was amended prospectively, introducing changes to the measurement of risk-weighted assets for exposures subject to market risk (Market Risk Final Rule) and is referred to herein as the Basel 1 – 2013 Rules. Under these guidelines, the Corporation and its affiliated banking entities, BANA and FIA, measure capital adequacy based on Tier 1 common capital, Tier 1 capital and Total capital (Tier 1 plus Tier 2 capital). Capital ratios are calculated by dividing each capital amount by risk-weighted assets. Additionally, Tier 1 capital is divided by adjusted quarterly average total assets to derive the Tier 1 leverage ratio. For additional information on the Market Risk Final Rule, see Capital Management – Regulatory Capital Changes on page 60.
Certain corporate-sponsored trust companies which issued qualifying trust preferred securities (Trust Securities) are not consolidated. In accordance with Federal Reserve guidance effective March 31, 2011, Trust Securities continue to qualify as Tier 1 capital with revised quantitative limits. As a result, the Corporation includes Trust Securities in Tier 1 capital in accordance with the Basel 1 – 2013 Rules. The Financial Reform Act includes a provision under which Trust Securities will no longer qualify as Tier 1 capital. Under one of three notices of proposed rulemaking on Basel 3 issued by U.S. banking regulatory agencies, the Corporation's previously issued and outstanding Trust Securities in the aggregate qualifying amount of $6.7 billion (approximately 52 bps of Tier 1 capital) at March 31, 2013 will no longer qualify as Tier 1 capital. While not yet final, the proposed rules provide a three-year transition period in which the exclusion of Trust Securities from Tier 1 capital will be phased-in incrementally each year.
The Federal Reserve requires bank holding companies (BHCs) to submit a capital plan and requests for capital actions on an annual basis, consistent with the rules governing the Comprehensive Capital Analysis and Review (CCAR). The CCAR is the central element to the Federal Reserve's approach to ensuring that large BHCs have adequate capital and robust processes for managing their capital. In January 2013, we submitted our 2013 capital plan, and received results on March 14, 2013. The Federal Reserve's stress scenario projections for the Corporation, based on the 2013 capital plan, estimated a minimum Tier 1 common capital ratio of 6.0 percent under severe adverse economic conditions with all proposed capital actions through the end of 2014, exceeding the five percent reference rate for all institutions involved in the CCAR. The capital plan submitted by the Corporation included a request to repurchase up to $5.0 billion of common stock over the next four quarters, beginning in the second quarter of 2013, the redemption of approximately $5.5 billion in preferred stock and a continuation of the quarterly common stock dividend at $0.01 per share. The Federal Reserve did not object to our 2013 capital plan, including all proposed capital actions.
The timing and exact amount of common stock repurchases will be consistent with the Corporation's capital plan and will be subject to various factors, including the Corporation's capital position, liquidity, financial performance and alternative uses of capital, stock trading price, and general market conditions, and may be suspended at any time. The common stock repurchases may be effected through open market purchases or privately negotiated transactions, including Rule 10b5-1 plans. On April 1, 2013, a notice of redemption was sent to holders of the Corporation's 8.625% Non-Cumulative Preferred Stock, Series 8, including holders of depositary shares representing interests therein, to redeem approximately $2.7 billion of the Series 8 Preferred Stock on May 28, 2013. On May 1, 2013, pursuant to the capital plan, we redeemed approximately $2.9 billion of our 8.20% Non-Cumulative Preferred Stock, Series H.
For additional information, see Capital Management – Regulatory Capital on page 70 of the MD&A of the Corporation's 2012 Annual Report on Form 10-K and Note 17 – Regulatory Requirements and Restrictions to the Consolidated Financial Statements of the Corporation's 2012 Annual Report on Form 10-K.
Capital Composition and Ratios
Under the Basel 1 – 2013 Rules, Tier 1 common capital was $136.1 billion at March 31, 2013, an increase of $2.7 billion from December 31, 2012. The increase was primarily driven by earnings eligible to be included in capital, which positively impacted the Tier 1 common capital ratio by approximately 12 bps and a decline in the deduction for disallowed deferred tax assets. These were partially offset by dividends, which negatively impacted the Tier 1 common capital ratio by approximately four bps. On a pro-forma basis, at December 31, 2012, the Tier 1 common capital ratio, assuming the Basel 1 – 2013 Rules were then in effect, would have been 10.38 percent compared to 11.06 percent on an as reported basis, reflecting the impact of $78.8 billion in additional risk-weighted assets. Tier 1 common capital would have remained unchanged at $133.4 billion. Total capital increased $4.5 billion during the three months ended March 31, 2013 primarily driven by the increase in Tier 1 common capital and an increase in the portion of the allowance for loan and lease losses eligible to be included in capital.
58
Risk-weighted assets increased $92.2 billion during the three months ended March 31, 2013 to $1,298 billion. This increase adversely impacted Tier 1 common, Tier 1 and Total capital ratios by 79 bps, 92 bps and 117 bps, respectively. The increase was primarily due to the net impact of the implementation of the Basel 1 – 2013 Rules which added $87.5 billion in risk-weighted assets and reduced the Tier 1 common capital ratio by approximately 75 bps. The Tier 1 leverage ratio increased 12 bps during the three months ended March 31, 2013 primarily driven by the increase in Tier 1 capital.
Table 13 presents Bank of America Corporation's risk-weighted assets activity for the three months ended March 31, 2013.
Table 13 |
|||
Risk-weighted Assets Activity |
|||
(Dollars in billions) |
Three Months Ended March 31, 2013 |
||
Risk-weighted assets, January 1 |
$ |
1,206 |
|
Changes to risk-weighted assets |
|||
Increase related to Comprehensive Risk Measure (1)
|
22 |
||
Increase related to Incremental Risk Charge (1)
|
7 |
||
Increase related to market risk regulatory VaR |
21 |
||
Standard specific risk (2)
|
28 |
||
Increase due to items no longer eligible to be included in market risk |
9 |
||
Increases related to implementation of Basel 1 – 2013 Rules |
87 |
||
Increase related to banking book (i.e. nontrading) and other exposures |
3 |
||
Other changes |
2 |
||
Total risk-weighted assets, March 31 |
$ |
1,298 |
|
(1) |
For additional information, see Capital Management – Regulatory Capital Changes on page 60.
|
(2) |
A measure of the risk of loss on a position that could result from factors other than broad market movements. |
Table 14 presents Bank of America Corporation's capital ratios and related information in accordance with the Basel 1 – 2013 Rules as measured at March 31, 2013 and Basel 1 at December 31, 2012.
Table 14 | |||||||||||||||||||||
Bank of America Corporation Regulatory Capital | |||||||||||||||||||||
March 31, 2013 |
December 31, 2012 |
||||||||||||||||||||
Actual |
Actual |
||||||||||||||||||||
(Dollars in millions) |
Ratio |
Amount |
Minimum
Required (1)
|
Ratio |
Amount |
Minimum
Required (1)
|
|||||||||||||||
Tier 1 common capital |
10.49 |
% |
$ |
136,119 |
n/a |
11.06 |
% |
$ |
133,403 |
n/a |
|||||||||||
Tier 1 common capital (pro-forma) (2)
|
n/a |
n/a |
n/a |
10.38 |
133,403 |
n/a |
|||||||||||||||
Tier 1 capital |
12.22 |
158,677 |
$ |
77,891 |
12.89 |
155,461 |
$ |
72,359 |
|||||||||||||
Total capital |
15.50 |
201,211 |
129,819 |
16.31 |
196,680 |
120,598 |
|||||||||||||||
Tier 1 leverage |
7.49 |
158,677 |
84,700 |
7.37 |
155,461 |
84,429 |
|||||||||||||||
March 31 2013 |
December 31 2012 |
||||||||||||||||||||
Risk-weighted assets (in billions) |
$ |
1,298 |
$ |
1,206 |
|||||||||||||||||
Adjusted quarterly average total assets (in billions) (3)
|
2,118 |
2,111 |
|||||||||||||||||||
(1) |
Dollar amount required to meet guidelines to be considered well-capitalized. |
(2) |
Pro-forma Tier 1 common capital ratio at December 31, 2012 includes the estimated impact of the Basel 1 – 2013 Rules. Represents a non-GAAP financial measure. On a pro-forma basis, risk-weighted assets would have been approximately $1,285 billion with the inclusion of $78.8 billion in pro-forma risk-weighted assets.
|
(3) |
Reflects adjusted average total assets for the three months ended March 31, 2013 and December 31, 2012.
|
n/a = not applicable
59
Table 15 presents the capital composition in accordance with the Basel 1 – 2013 Rules as measured at March 31, 2013 and Basel 1 at December 31, 2012.
Table 15 | |||||||
Capital Composition | |||||||
(Dollars in millions) |
March 31 2013 |
December 31 2012 |
|||||
Total common shareholders' equity |
$ |
218,513 |
$ |
218,188 |
|||
Goodwill |
(69,930 |
) |
(69,976 |
) |
|||
Nonqualifying intangible assets (includes core deposit intangibles, affinity relationships, customer relationships and other intangibles) |
(4,801 |
) |
(4,994 |
) |
|||
Net unrealized gains on AFS debt and marketable equity securities and net losses on derivatives recorded in accumulated OCI, net-of-tax |
(1,302 |
) |
(2,036 |
) |
|||
Unamortized net periodic benefit costs recorded in accumulated OCI, net-of-tax |
4,371 |
4,456 |
|||||
Fair value adjustment related to structured liabilities (1)
|
4,140 |
4,084 |
|||||
Disallowed deferred tax asset |
(16,497 |
) |
(17,940 |
) |
|||
Other |
1,625 |
1,621 |
|||||
Total Tier 1 common capital |
136,119 |
133,403 |
|||||
Qualifying preferred stock |
15,862 |
15,851 |
|||||
Trust preferred securities |
6,696 |
6,207 |
|||||
Total Tier 1 capital |
158,677 |
155,461 |
|||||
Long-term debt qualifying as Tier 2 capital |
24,459 |
24,287 |
|||||
Allowance for loan and lease losses |
22,441 |
24,179 |
|||||
Reserve for unfunded lending commitments |
486 |
513 |
|||||
Allowance for loan and lease losses exceeding 1.25 percent of risk-weighted assets |
(6,579 |
) |
(9,459 |
) |
|||
45 percent of the pre-tax net unrealized gains on AFS marketable equity securities |
358 |
329 |
|||||
Other |
1,369 |
1,370 |
|||||
Total capital |
$ |
201,211 |
$ |
196,680 |
|||
(1) |
Represents loss on structured liabilities, net-of-tax, that is excluded from Tier 1 common capital, Tier 1 capital and Total capital for regulatory capital purposes. |
Regulatory Capital Changes
At March 31, 2013, we measured and reported our capital ratios and related information in accordance with the Basel 1 – 2013 Rules, which introduced new measures of market risk including a charge related to stressed Value-at-Risk (VaR), an incremental risk charge and the comprehensive risk measure (CRM), as well as other technical modifications. The implementation of the Basel 1 – 2013 Rules was the primary driver of the changes in total risk-weighted assets, and Tier 1 capital, Tier 1 common capital and Total capital ratios from December 31, 2012. We manage regulatory capital to adhere to internal capital guidelines and regulatory standards of capital adequacy based on our current understanding of the rules and the application of such rules to our business as currently conducted. For additional information regarding Market Risk Management and VaR, see Trading Risk Management on page 113.
The regulatory capital rules continue to expand and evolve. In December 2007, U.S. banking regulators published final Basel 2 rules (Basel 2). We measure and report our capital ratios and related information under Basel 2 on a confidential basis to U.S. banking regulators during the required parallel period, during which we provide the U.S. banking regulators both the Basel 1 – 2013 Rules and Basel 2 related information in parallel. The parallel period will continue until we receive regulatory approval to exit parallel reporting and subsequently begin publicly reporting our Basel 2 regulatory capital results and related disclosures.
In June 2012, U.S. banking regulators issued three notices of proposed rulemaking (collectively, the Basel 3 NPRs) which, if adopted as proposed, would materially change Tier 1 common, Tier 1 and Total capital calculations. The Basel 3 NPRs also introduce new minimum capital ratios and buffer requirements, expand and modify the calculation of risk-weighted assets for credit and market risk (the Advanced Approach) and introduce a Standardized Approach for the calculation of risk-weighted assets, which would replace the Basel 1 – 2013 Rules and provide a floor for minimum, adequately capitalized regulatory capital requirements under the Prompt Corrective Action framework. The Prompt Corrective Action framework establishes categories of capitalization, including "well-capitalized," based on regulatory ratio requirements. U.S. banking regulators are required to take certain mandatory actions depending on the category of capitalization, with no mandatory actions required for "well-capitalized" banking entities.
60
Under the Basel 3 NPRs, Trust Securities will be phased out of Tier 1 capital in equal annual installments over a three-year transition period. Many of the changes to the composition of regulatory capital are subject to a transition period where the impact is recognized in 20 percent increments, phased in incrementally each year over a five-year period. The phase-in period for the new minimum capital requirements and related buffers is proposed to occur from the effective date of the Basel 3 NPRs through 2019. While U.S. banking regulators have not yet issued final rules for Basel 3, we expect them to issue final rules in 2013 with a January 1, 2014 effective date for the Advanced Approach described below.
Under the Basel 3 NPRs, we will be subject to the Advanced Approach for measuring risk-weighted assets (Basel 3 Advanced Approach) when finalized and implemented. The Basel 3 Advanced Approach also requires approval by the U.S. regulatory agencies of analytical models used as part of capital measurement. If these models are not approved, it would likely lead to an increase in our risk-weighted assets, which in some cases could be significant. The Basel 3 Advanced Approach, if adopted as proposed, is expected to substantially increase our capital requirements as discussed below.
In 2011, the Basel Committee on Banking Supervision (the Basel Committee) issued proposed guidance on capital requirements for global, systemically important financial institutions, of which we are one, including the methodology for measuring systemic importance, the additional capital required (the SIFI buffer), and the arrangements by which the guidance will be phased in. As proposed, the SIFI buffer would increase minimum capital requirements for Tier 1 common capital from one percent to 2.5 percent, and in certain circumstances, 3.5 percent. As of March 31, 2013, we estimate our SIFI buffer would be 1.5 percent, in line with the Financial Stability Board's report, "Update of Group of Global Systemically Important Banks," issued on November 1, 2012. U.S. banking regulators have not yet issued proposed or final rules related to the SIFI buffer.
On December 20, 2011, the Federal Reserve issued proposed rules to implement enhanced supervisory and prudential requirements, and the early remediation requirements established under the Financial Reform Act. The enhanced standards include liquidity standards, requirements for overall risk management, single-counterparty credit limits, stress test requirements and a debt-to-equity limit for certain companies determined to pose a threat to financial stability. The final rules, when adopted and fully implemented, are likely to influence our regulatory capital and liquidity planning process, and may impose additional operational and compliance costs on us.
Preparing for the implementation of the new capital rules is a top strategic priority, and we expect to comply with the final rules when issued and effective. Based on Basel 2 and our current understanding of the Basel 3 Advanced Approach issued by U.S. regulators, we estimated our Basel 3 Advanced Approach Tier 1 common capital ratio, on a fully phased-in basis, to be 9.52 percent at March 31, 2013. As of March 31, 2013, we estimated that our Tier 1 common capital would be $128.8 billion and total risk-weighted assets would be $1,354 billion, also on a fully phased-in basis. This assumes approval by U.S. banking regulators of our internal analytical models, but does not include the benefit of the removal of the surcharge applicable to the CRM. The CRM is used to determine the risk-weighted assets for correlation trading positions. Under the Basel 3 NPRs, Tier 1 common capital includes components that exhibit heightened sensitivity to changes in interest rates, such as the cumulative change in the fair value of AFS debt securities and at least 10 percent of the fair value of MSRs recognized on the Consolidated Balance Sheet.
Important differences between Basel 1, the Basel 1 – 2013 Rules and Basel 3 include capital deductions related to our MSRs, deferred tax assets and defined benefit pension assets, and the inclusion of unrealized gains and losses on debt and equity securities recognized in accumulated OCI, each of which will be impacted by future changes in interest rates, overall earnings performance or other corporate actions. Our estimates under the Basel 3 Advanced Approach will be refined over time as a result of further rulemaking or clarification by U.S. banking regulators and as our understanding and interpretation of the rules evolve.
Basel 3 regulatory capital metrics are non-GAAP measures until they are fully adopted and required by U.S. banking regulators. Table 16 presents a reconciliation of our Tier 1 common capital and risk-weighted assets in accordance with the Basel 1 – 2013 Rules to our Basel 3 estimates at March 31, 2013 and Basel 1 to Basel 3 estimates at December 31, 2012, assuming fully phased-in measures according to the Basel 3 Advanced Approach.
For additional information regarding Basel 2, Basel 3 and other proposed regulatory capital changes, see Note 17 – Regulatory Requirements and Restrictions to the Consolidated Financial Statements of the Corporation's 2012 Annual Report on Form 10-K.
61
Table 16 | ||||||
Basel 1 to Basel 3 (fully phased-in) Reconciliation (1)
| ||||||
(Dollars in millions) |
March 31 2013 |
December 31 2012 |
||||
Regulatory capital – Basel 1 to Basel 3 (fully phased-in) | ||||||
Basel 1 Tier 1 capital |
$ |
158,677 |
$ |
155,461 |
||
Deduction of qualifying preferred stock and trust preferred securities |
(22,558 |
) |
(22,058 |
) |
||
Basel 1 Tier 1 common capital |
136,119 |
133,403 |
||||
Deduction of defined benefit pension assets |
(776 |
) |
(737 |
) |
||
Change in deferred tax assets and threshold deductions (deferred tax asset temporary differences, MSRs and significant investments) |
(4,501 |
) |
(3,020 |
) |
||
Change in all other deductions, net |
(2,032 |
) |
(1,020 |
) |
||
Basel 3 (fully phased-in) Tier 1 common capital |
$ |
128,810 |
$ |
128,626 |
||
Risk-weighted assets – Basel 1 to Basel 3 (fully phased-in) |
||||||
Basel 1 risk-weighted assets |
$ |
1,298,187 |
$ |
1,205,976 |
||
Net change in credit and other risk-weighted assets |
55,454 |
103,085 |
||||
Increase due to Market Risk Final Rule (2)
|
— |
81,811 |
||||
Basel 3 (fully phased-in) risk-weighted assets |
$ |
1,353,641 |
$ |
1,390,872 |
||
Tier 1 common capital ratios |
||||||
Basel 1 |
10.49 |
% |
11.06 |
% |
||
Basel 3 (fully phased-in) |
9.52 |
9.25 |
||||
(1) |
Includes the Market Risk Final Rule at March 31, 2013. At December 31, 2012, the Basel 1 information did not include the Market Risk Final Rule.
|
(2) |
Excludes the benefit of certain hedges at December 31, 2012. Including these hedges, the increase due to the Market Risk Final Rule would have been $78.8 billion. For more information, see Capital Management – Capital Composition and Ratios on page 58.
|
Bank of America, N.A. and FIA Card Services, N.A. Regulatory Capital
Table 17 presents regulatory capital information for BANA and FIA at March 31, 2013 and December 31, 2012.
Table 17 | |||||||||||||||||||||
Bank of America, N.A. and FIA Card Services, N.A. Regulatory Capital (1)
| |||||||||||||||||||||
March 31, 2013 |
December 31, 2012 |
||||||||||||||||||||
Actual |
Actual |
||||||||||||||||||||
(Dollars in millions) |
Ratio |
Amount |
Minimum
Required (2)
|
Ratio |
Amount |
Minimum
Required (2)
|
|||||||||||||||
Tier 1 capital |
|||||||||||||||||||||
Bank of America, N.A. |
12.28 |
% |
$ |
121,272 |
$ |
59,239 |
12.44 |
% |
$ |
118,431 |
$ |
57,099 |
|||||||||
FIA Card Services, N.A. |
17.37 |
20,938 |
7,232 |
17.34 |
22,061 |
7,632 |
|||||||||||||||
Total capital |
|||||||||||||||||||||
Bank of America, N.A. |
14.31 |
141,329 |
98,732 |
14.76 |
140,434 |
95,165 |
|||||||||||||||
FIA Card Services, N.A. |
18.67 |
22,499 |
12,054 |
18.64 |
23,707 |
12,719 |
|||||||||||||||
Tier 1 leverage |
|||||||||||||||||||||
Bank of America, N.A. |
8.82 |
121,272 |
68,760 |
8.59 |
118,431 |
68,957 |
|||||||||||||||
FIA Card Services, N.A. |
12.73 |
20,938 |
8,224 |
13.67 |
22,061 |
8,067 |
|||||||||||||||
(1) |
BANA regulatory capital information included the Basel 1 – 2013 Rules at March 31, 2013. At December 31, 2012, BANA regulatory capital information did not include the Basel 1 – 2013 Rules. FIA is not impacted by the Basel 1 – 2013 Rules.
|
(2) |
Dollar amount required to meet guidelines for well-capitalized institutions. |
62
BANA's Tier 1 capital ratio decreased 16 bps to 12.28 percent and the Total capital ratio decreased 45 bps to 14.31 percent at March 31, 2013 compared to December 31, 2012. The Tier 1 leverage ratio increased 23 bps to 8.82 percent at March 31, 2013 compared to December 31, 2012. The decrease in the Tier 1 capital ratio was driven by an increase in risk-weighted assets of $35.7 billion compared to December 31, 2012 and returns of capital of $2.2 billion to the Corporation for the three months ended March 31, 2013, partially offset by earnings eligible to be included in capital of $5.2 billion. The decrease in the Total capital ratio was driven by the same factors as discussed for Tier 1 capital ratio above as well as a $2.4 billion decrease in qualifying subordinated debt. The increase in the Tier 1 leverage ratio was primarily driven by an increase in Tier 1 capital. The increase in risk-weighted assets was primarily due to the impact of implementing the Basel 1 – 2013 Rules.
FIA's Tier 1 capital ratio increased three bps to 17.37 percent and the Total capital ratio increased three bps to 18.67 percent at March 31, 2013 compared to December 31, 2012. The Tier 1 leverage ratio decreased 94 bps to 12.73 percent at March 31, 2013 compared to December 31, 2012. The increase in the Tier 1 capital and Total capital ratios was driven by a decrease in risk-weighted assets of $6.7 billion compared to December 31, 2012, primarily due to a decrease in loans, and earnings eligible to be included in capital of $931 million for the three months ended March 31, 2013, partially offset by returns of capital of $2.1 billion to the Corporation. The decrease in the Tier 1 leverage ratio was driven by the decrease in Tier 1 capital and an increase in adjusted quarterly average total assets of $3.1 billion. FIA was not impacted by the implementation of the Basel 1 – 2013 Rules.
Broker/Dealer Regulatory Capital
The Corporation's principal U.S. broker/dealer subsidiaries are Merrill Lynch, Pierce, Fenner & Smith (MLPF&S) and Merrill Lynch Professional Clearing Corp (MLPCC). MLPCC is a fully-guaranteed subsidiary of MLPF&S and provides clearing and settlement services. Both entities are subject to the net capital requirements of SEC Rule 15c3-1. Both entities are also registered as futures commission merchants and are subject to the Commodity Futures Trading Commission Regulation 1.17.
MLPF&S has elected to compute the minimum capital requirement in accordance with the Alternative Net Capital Requirement as permitted by SEC Rule 15c3-1. At March 31, 2013, MLPF&S's regulatory net capital as defined by Rule 15c3-1 was $10.2 billion and exceeded the minimum requirement of $776 million by $9.4 billion. MLPCC's net capital of $1.6 billion exceeded the minimum requirement of $235 million by $1.4 billion. In accordance with the Alternative Net Capital Requirements, MLPF&S is required to maintain tentative net capital in excess of $1.0 billion, net capital in excess of $500 million and notify the SEC in the event its tentative net capital is less than $5.0 billion. At March 31, 2013, MLPF&S had tentative net capital and net capital in excess of the minimum and notification requirements.
63
Common and Preferred Stock Dividends |
For a summary of our declared quarterly cash dividends on common stock during the first quarter of 2013 and through May 7, 2013, see Note 12 – Shareholders' Equity to the Consolidated Financial Statements.
Table 18 is a summary of our cash dividend declarations on preferred stock during the first quarter of 2013 and through May 7, 2013. During the first quarter of 2013, preferred dividends were $373 million. In connection with the announced redemptions, we expect second quarter preferred stock dividends to be comprised of the $364 million in dividends declared on April 2, 2013 plus approximately $75 million, representing the difference between the redemption price at par and the carrying value of the redeemed securities. We expect preferred dividends during the second half of 2013 to decline to approximately $255 million per quarter as a result of the announced redemptions. For additional information on preferred stock, see Note 14 – Shareholders' Equity to the Consolidated Financial Statements of the Corporation's 2012 Annual Report on Form 10-K.
Table 18 |
||||||||||||||||
Preferred Stock Cash Dividend Summary | ||||||||||||||||
Preferred Stock |
Outstanding
Notional
Amount
(in millions)
|
Declaration Date |
Record Date |
Payment Date |
Per Annum
Dividend Rate
|
Dividend Per
Share
|
||||||||||
Series B (1)
|
$ |
1 |
January 23, 2013 |
April 11, 2013 |
April 25, 2013 |
7.00 |
% |
$ |
1.75 |
|||||||
April 30, 2013 |
July 11, 2013 |
July 25, 2013 |
7.00 |
1.75 |
||||||||||||
Series D (2)
|
$ |
654 |
January 3, 2013 |
February 28, 2013 |
March 14, 2013 |
6.204 |
% |
$ |
0.38775 |
|||||||
April 2, 2013 |
May 31, 2013 |
June 14, 2013 |
6.204 |
0.38775 |
||||||||||||
Series E (2)
|
$ |
317 |
January 3, 2013 |
January 31, 2013 |
February 15, 2013 |
Floating |
$ |
0.25556 |
||||||||
April 2, 2013 |
April 30, 2013 |
May 15, 2013 |
Floating |
0.24722 |
||||||||||||
Series F |
$ |
141 |
January 3, 2013 |
February 28, 2013 |
March 15, 2013 |
Floating |
$ |
1,000.00 |
||||||||
April 2, 2013 |
May 31, 2013 |
June 17, 2013 |
Floating |
1,044.44 |
||||||||||||
Series G |
$ |
493 |
January 3, 2013 |
February 28, 2013 |
March 15, 2013 |
Adjustable |
$ |
1,000.00 |
||||||||
April 2, 2013 |
May 31, 2013 |
June 17, 2013 |
Adjustable |
1,044.44 |
||||||||||||
Series H (2, 3)
|
$ |
2,862 |
January 3, 2013 |
January 15, 2013 |
February 1, 2013 |
8.20 |
% |
$ |
0.51250 |
|||||||
April 2, 2013 |
April 15, 2013 |
May 1, 2013 |
8.20 |
0.51250 |
||||||||||||
Series I (2)
|
$ |
365 |
January 3, 2013 |
March 15, 2013 |
April 1, 2013 |
6.625 |
% |
$ |
0.41406 |
|||||||
April 2, 2013 |
June 15, 2013 |
July 1, 2013 |
6.625 |
0.41406 |
||||||||||||
Series J (2)
|
$ |
951 |
January 3, 2013 |
January 15, 2013 |
February 1, 2013 |
7.25 |
% |
$ |
0.45312 |
|||||||
April 2, 2013 |
April 15, 2013 |
May 1, 2013 |
7.25 |
0.45312 |
||||||||||||
Series K (4, 5)
|
$ |
1,544 |
January 3, 2013 |
January 15, 2013 |
January 30, 2013 |
Fixed-to-floating |
$ |
40.00 |
||||||||
Series L |
$ |
3,080 |
March 15, 2013 |
April 1, 2013 |
April 30, 2013 |
7.25 |
% |
$ |
18.125 |
|||||||
Series M (4, 5)
|
$ |
1,310 |
April 2, 2013 |
April 30, 2013 |
May 15, 2013 |
Fixed-to-floating |
$ |
40.625 |
||||||||
Series T (1)
|
$ |
5,000 |
March 15, 2013 |
March 26, 2013 |
April 10, 2013 |
6.00 |
% |
$ |
1,500.00 |
|||||||
For footnotes see page 65.
64
Table 18 |
||||||||||||||||
Preferred Stock Cash Dividend Summary (continued) | ||||||||||||||||
Preferred Stock |
Outstanding
Notional
Amount
(in millions)
|
Declaration Date |
Record Date |
Payment Date |
Per Annum
Dividend Rate
|
Dividend Per
Share
|
||||||||||
Series 1 (6)
|
$ |
98 |
January 3, 2013 |
February 15, 2013 |
February 28, 2013 |
Floating |
$ |
0.18750 |
||||||||
April 2, 2013 |
May 15, 2013 |
May 28, 2013 |
Floating |
0.18750 |
||||||||||||
Series 2 (6)
|
$ |
299 |
January 3, 2013 |
February 15, 2013 |
February 28, 2013 |
Floating |
$ |
0.19167 |
||||||||
April 2, 2013 |
May 15, 2013 |
May 28, 2013 |
Floating |
0.18542 |
||||||||||||
Series 3 (6)
|
$ |
653 |
January 3, 2013 |
February 15, 2013 |
February 28, 2013 |
6.375 |
% |
$ |
0.39843 |
|||||||
April 2, 2013 |
May 15, 2013 |
May 28, 2013 |
6.375 |
0.39843 |
||||||||||||
Series 4 (6)
|
$ |
210 |
January 3, 2013 |
February 15, 2013 |
February 28, 2013 |
Floating |
$ |
0.25556 |
||||||||
April 2, 2013 |
May 15, 2013 |
May 28, 2013 |
Floating |
0.24722 |
||||||||||||
Series 5 (6)
|
$ |
422 |
January 3, 2013 |
February 1, 2013 |
February 21, 2013 |
Floating |
$ |
0.25556 |
||||||||
April 2, 2013 |
May 1, 2013 |
May 21, 2013 |
Floating |
0.24722 |
||||||||||||
Series 6 (7)
|
$ |
59 |
January 3, 2013 |
March 15, 2013 |
March 29, 2013 |
6.70 |
% |
$ |
0.41875 |
|||||||
April 2, 2013 |
June 15, 2013 |
June 28, 2013 |
6.70 |
0.41875 |
||||||||||||
Series 7 (7)
|
$ |
17 |
January 3, 2013 |
March 15, 2013 |
March 29, 2013 |
6.25 |
% |
$ |
0.39062 |
|||||||
April 2, 2013 |
June 15, 2013 |
June 28, 2013 |
6.25 |
0.39062 |
||||||||||||
Series 8 (6, 8)
|
$ |
2,673 |
January 3, 2013 |
February 15, 2013 |
February 28, 2013 |
8.625 |
% |
$ |
0.53906 |
|||||||
April 2, 2013 |
May 15, 2013 |
May 28, 2013 |
8.625 |
0.53906 |
||||||||||||
(1) |
Dividends are cumulative. |
(2) |
Dividends per depositary share, each representing a 1/1,000th interest in a share of preferred stock.
|
(3) |
This series was redeemed on May 1, 2013. |
(4) |
Initially pays dividends semi-annually. |
(5) |
Dividends per depositary share, each representing a 1/25th interest in a share of preferred stock.
|
(6) |
Dividends per depositary share, each representing a 1/1,200th interest in a share of preferred stock.
|
(7) |
Dividends per depositary share, each representing a 1/40th interest in a share of preferred stock.
|
(8) |
Notice of redemption sent on April 1, 2013; preferred stock to be redeemed on May 28, 2013. |
Liquidity Risk |
Funding and Liquidity Risk Management |
We define liquidity risk as the potential inability to meet our contractual and contingent financial obligations, on- or off-balance sheet, as they come due. Our primary liquidity objective is to provide adequate funding for our businesses throughout market cycles, including periods of financial stress. To achieve that objective, we analyze and monitor our liquidity risk, maintain excess liquidity and access diverse funding sources including our stable deposit base. We define excess liquidity as readily available assets, limited to cash and high-quality, liquid, unencumbered securities that we can use to meet our funding requirements as those obligations arise.
Global funding and liquidity risk management activities are centralized within Corporate Treasury. We believe that a centralized approach to funding and liquidity risk management enhances our ability to monitor liquidity requirements, maximizes access to funding sources, minimizes borrowing costs and facilitates timely responses to liquidity events. For additional information regarding global funding and liquidity risk management, see Liquidity Risk – Funding and Liquidity Risk Management on page 75 of the MD&A of the Corporation's 2012 Annual Report on Form 10-K.
65
Global Excess Liquidity Sources and Other Unencumbered Assets
We maintain excess liquidity available to Bank of America Corporation, or the parent company and selected subsidiaries in the form of cash and high-quality, liquid, unencumbered securities. These assets, which we call our Global Excess Liquidity Sources, serve as our primary means of liquidity risk mitigation. Our cash is primarily on deposit with the Federal Reserve and central banks outside of the U.S. We limit the composition of high-quality, liquid, unencumbered securities to U.S. government securities, U.S. agency securities, U.S. agency MBS and a select group of non-U.S. government and supranational securities. We believe we can quickly obtain cash for these securities, even in stressed market conditions, through repurchase agreements or outright sales. We hold our Global Excess Liquidity Sources in entities that allow us to meet the liquidity requirements of our global businesses, and we consider the impact of potential regulatory, tax, legal and other restrictions that could limit the transferability of funds among entities.
Our Global Excess Liquidity Sources were $372 billion at both March 31, 2013 and December 31, 2012 and were maintained as presented in Table 19.
Table 19 | |||||||||||
Global Excess Liquidity Sources | |||||||||||
(Dollars in billions) |
March 31 2013 |
December 31 2012 |
Average for Three Months Ended March 31, 2013 |
||||||||
Parent company |
$ |
100 |
$ |
103 |
$ |
93 |
|||||
Bank subsidiaries |
249 |
247 |
238 |
||||||||
Broker/dealers |
23 |
22 |
23 |
||||||||
Total global excess liquidity sources |
$ |
372 |
$ |
372 |
$ |
354 |
|||||
As shown in Table 19, parent company Global Excess Liquidity Sources totaled $100 billion and $103 billion at March 31, 2013 and December 31, 2012. The decrease in parent company liquidity was primarily due to the payment related to the FNMA Settlement, partially offset by net issuances of debt, and dividends and capital repayments from subsidiaries. Typically, parent company cash is deposited overnight with BANA.
Global Excess Liquidity Sources available to our bank subsidiaries totaled $249 billion and $247 billion at March 31, 2013 and December 31, 2012. These amounts are distinct from the cash deposited by the parent company. In addition to their Global Excess Liquidity Sources, our bank subsidiaries hold other unencumbered investment-grade securities that we believe could also be used to generate liquidity. Our bank subsidiaries can also generate incremental liquidity by pledging a range of other unencumbered loans and securities to certain Federal Home Loan Banks (FHLBs) and the Federal Reserve Discount Window. The cash we could have obtained by borrowing against this pool of specifically-identified eligible assets was approximately $199 billion and $194 billion at March 31, 2013 and December 31, 2012. We have established operational procedures to enable us to borrow against these assets, including regularly monitoring our total pool of eligible loans and securities collateral. Eligibility is defined by guidelines outlined by the FHLBs and the Federal Reserve and is subject to change at their discretion. Due to regulatory restrictions, liquidity generated by the bank subsidiaries can only be used to fund obligations within the bank subsidiaries and can only be transferred to the parent company or nonbank subsidiaries with prior regulatory approval.
Global Excess Liquidity Sources available to our broker/dealer subsidiaries totaled $23 billion and $22 billion at March 31, 2013 and December 31, 2012. Our broker/dealers also held other unencumbered investment-grade securities and equities that we believe could also be used to generate additional liquidity. Liquidity held in a broker/dealer subsidiary is available to meet the obligations of that entity and can only be transferred to the parent company or to any other subsidiary with prior regulatory approval due to regulatory restrictions and minimum requirements.
66
Table 20 presents the composition of Global Excess Liquidity Sources at March 31, 2013 and December 31, 2012.
Table 20 | |||||||
Global Excess Liquidity Sources Composition | |||||||
(Dollars in billions) |
March 31 2013 |
December 31 2012 |
|||||
Cash on deposit |
$ |
58 |
$ |
65 |
|||
U.S. Treasuries |
22 |
21 |
|||||
U.S. agency securities and mortgage-backed securities |
277 |
271 |
|||||
Non-U.S. government and supranational securities |
15 |
15 |
|||||
Total global excess liquidity sources |
$ |
372 |
$ |
372 |
|||
Time to Required Funding and Stress Modeling
We use a variety of metrics to determine the appropriate amounts of excess liquidity to maintain at the parent company and our bank and broker/dealer subsidiaries. One metric we use to evaluate the appropriate level of excess liquidity at the parent company is "Time to Required Funding." This debt coverage measure indicates the number of months that the parent company can continue to meet its unsecured contractual obligations as they come due using only its Global Excess Liquidity Sources without issuing any new debt or accessing any additional liquidity sources. We define unsecured contractual obligations for purposes of this metric as maturities of senior or subordinated debt issued or guaranteed by Bank of America Corporation or Merrill Lynch. These include certain unsecured debt instruments, primarily structured liabilities, which we may be required to settle for cash prior to maturity. Our Time to Required Funding was 30 months at March 31, 2013 (29 months including the impact of the MBIA Settlement – for additional information, see Recent Events – MBIA Settlement on page 6), which is above the Corporation's target minimum of 21 months. For purposes of calculating Time to Required Funding, at March 31, 2013, we have included in the amount of unsecured contractual obligations the $8.6 billion liability related to the BNY Mellon Settlement and the planned redemption of $5.5 billion in preferred stock. The BNY Mellon Settlement is subject to final court approval and certain other conditions, and the timing of payment is not certain. On April 1, 2013, a notice of redemption was sent to holders of the Corporation's 8.625% Non-Cumulative Preferred Stock, Series 8, including holders of depositary shares representing interests therein, to redeem approximately $2.7 billion of the Series 8 Preferred Stock on May 28, 2013. On May 1, 2013, we redeemed approximately $2.9 billion of our 8.20% Non-Cumulative Preferred Stock, Series H.
We utilize liquidity stress models to assist us in determining the appropriate amounts of excess liquidity to maintain at the parent company and our bank and broker/dealer subsidiaries. These models are risk sensitive and have become increasingly important in analyzing our potential contractual and contingent cash outflows beyond those outflows considered in the Time to Required Funding analysis. We evaluate the liquidity requirements under a range of scenarios with varying levels of severity and time horizons. The scenarios we consider and utilize incorporate market-wide and Corporation-specific events, including potential credit rating downgrades for the parent company and our subsidiaries, and are based on historical experience, regulatory guidance, and both expected and unexpected future events.
The types of potential contractual and contingent cash outflows we consider in our scenarios may include, but are not limited to, upcoming contractual maturities of unsecured debt and reductions in new debt issuance; diminished access to secured financing markets; potential deposit withdrawals and reduced rollover of maturing term deposits by customers; increased draws on loan commitments, liquidity facilities and letters of credit, including Variable Rate Demand Notes; additional collateral that counterparties could call if our credit ratings were downgraded; collateral, margin and subsidiary capital requirements arising from losses; and potential liquidity required to maintain businesses and finance customer activities. Changes in certain market factors, including, but not limited to, credit rating downgrades, could negatively impact potential contractual and contingent outflows and the related financial instruments, and in some cases these impacts could be material to our financial results.
We consider all sources of funds that we could access during each stress scenario and focus particularly on matching available sources with corresponding liquidity requirements by legal entity. We also use the stress modeling results to manage our asset-liability profile and establish limits and guidelines on certain funding sources and businesses.
67
Basel 3 Liquidity Standards
In December 2010, the Basel Committee proposed two measures of liquidity risk which are considered part of Basel 3. The first proposed liquidity measure is the Liquidity Coverage Ratio (LCR), which is calculated as the amount of a financial institution's unencumbered, high-quality, liquid assets relative to the net cash outflows the institution could encounter under a significant 30-day stress scenario. The Basel Committee announced in January 2013 that an initial minimum LCR requirement of 60 percent will be implemented in January 2015, and will thereafter increase in 10 percent annual increments through January 2019. The second proposed liquidity measure is the Net Stable Funding Ratio (NSFR), which measures the amount of longer-term, stable sources of funding employed by a financial institution relative to the liquidity profiles of the assets funded and the potential for contingent calls on funding liquidity arising from off-balance sheet commitments and obligations over a one-year period. The Basel Committee is currently reviewing the NSFR requirement and announced that it intends to implement the requirement by January 2018, following an observation period that is currently underway. We continue to monitor the development and the potential impact of these proposals and assuming adoption by U.S. banking regulators, we expect to meet the final standards within the regulatory timelines.
Diversified Funding Sources
We fund our assets primarily with a mix of deposits and secured and unsecured liabilities through a globally coordinated funding strategy. We diversify our funding globally across products, programs, markets, currencies and investor groups.
We fund a substantial portion of our lending activities through our deposits, which were $1.10 trillion and $1.11 trillion at March 31, 2013 and December 31, 2012. Deposits are primarily generated by our CBB, GWIM and Global Banking segments. These deposits are diversified by clients, product type and geography, and the majority of our U.S. deposits are insured by the Federal Deposit Insurance Corporation. We consider a substantial portion of our deposits to be a stable, low-cost and consistent source of funding. We believe this deposit funding is generally less sensitive to interest rate changes, market volatility or changes in our credit ratings than wholesale funding sources. Our lending activities may also be financed through secured borrowings, including securitizations with GSEs, the FHA and private-label investors, as well as FHLB loans.
Our trading activities in broker/dealer subsidiaries are primarily funded on a secured basis through securities lending and repurchase agreements and these amounts will vary based on customer activity and market conditions. We believe funding these activities in the secured financing markets is more cost-efficient and less sensitive to changes in our credit ratings than unsecured financing. Repurchase agreements are generally short-term and often overnight. Disruptions in secured financing markets for financial institutions have occurred in prior market cycles which resulted in adverse changes in terms or significant reductions in the availability of such financing. We manage the liquidity risks arising from secured funding by sourcing funding globally from a diverse group of counterparties, providing a range of securities collateral and pursuing longer durations, when appropriate.
We issue the majority of our long-term unsecured debt at the parent company. During the three months ended March 31, 2013, the parent company issued $13.1 billion of long-term unsecured debt, including structured liabilities of $1.6 billion. We may also issue long-term unsecured debt through BANA in a variety of maturities and currencies to achieve cost-efficient funding and to maintain an appropriate maturity profile, although there were no new issuances through BANA during the three months ended March 31, 2013. While the cost and availability of unsecured funding may be negatively impacted by general market conditions or by matters specific to the financial services industry or the Corporation, we seek to mitigate refinancing risk by actively managing the amount of our borrowings that we anticipate will mature within any month or quarter.
The primary benefits expected from our centralized funding strategy include greater control, reduced funding costs, wider name recognition by investors and greater flexibility to meet the variable funding requirements of subsidiaries. Where regulations, time zone differences or other business considerations make parent company funding impractical, certain other subsidiaries may issue their own debt.
68
Table 21 presents the carrying value of aggregate annual contractual maturities of long-term debt at March 31, 2013.
Table 21 | |||||||||||||||||||||||||||
Long-term Debt By Maturity | |||||||||||||||||||||||||||
(Dollars in millions) |
2013 |
2014 |
2015 |
2016 |
2017 |
Thereafter |
Total |
||||||||||||||||||||
Bank of America Corporation |
$ |
9,319 |
$ |
21,196 |
$ |
17,537 |
$ |
22,086 |
$ |
19,651 |
$ |
52,406 |
$ |
142,195 |
|||||||||||||
Merrill Lynch & Co., Inc. and subsidiaries |
13,572 |
18,911 |
6,367 |
4,281 |
8,450 |
35,706 |
87,287 |
||||||||||||||||||||
Bank of America, N.A. and subsidiaries |
67 |
2 |
— |
1,092 |
6,439 |
1,821 |
9,421 |
||||||||||||||||||||
Other debt |
3,388 |
1,490 |
1,656 |
1,514 |
18 |
1,211 |
9,277 |
||||||||||||||||||||
Total long-term debt excluding consolidated VIEs |
26,346 |
41,599 |
25,560 |
28,973 |
34,558 |
91,144 |
248,180 |
||||||||||||||||||||
Long-term debt of consolidated VIEs |
10,527 |
9,551 |
1,462 |
1,850 |
1,726 |
6,345 |
31,461 |
||||||||||||||||||||
Total long-term debt |
$ |
36,873 |
$ |
51,150 |
$ |
27,022 |
$ |
30,823 |
$ |
36,284 |
$ |
97,489 |
$ |
279,641 |
|||||||||||||
Table 22 presents our long-term debt by major currency at March 31, 2013 and December 31, 2012.
Table 22 | |||||||
Long-term Debt By Major Currency | |||||||
(Dollars in millions) |
March 31 2013 |
December 31 2012 |
|||||
U.S. Dollar |
$ |
189,917 |
$ |
180,329 |
|||
Euro |
55,554 |
58,985 |
|||||
Japanese Yen |
11,541 |
12,749 |
|||||
British Pound |
10,320 |
11,126 |
|||||
Canadian Dollar |
3,425 |
3,560 |
|||||
Australian Dollar |
2,680 |
2,760 |
|||||
Swiss Franc |
1,831 |
1,917 |
|||||
Other |
4,373 |
4,159 |
|||||
Total long-term debt |
$ |
279,641 |
$ |
275,585 |
|||
Total long-term debt increased $4.1 billion during the three months ended March 31, 2013, due in part to the acceleration of 2013 planned issuances. We anticipate that debt levels will decline due to maturities through 2013, reflecting our ongoing initiative to reduce our debt balances over time. We may, from time to time, purchase outstanding debt instruments in various transactions, depending on prevailing market conditions, liquidity and other factors. In addition, our broker/dealer subsidiaries may make markets in our debt instruments to provide liquidity for investors. For additional information on long-term debt funding, see Note 12 – Long-term Debt to the Consolidated Financial Statements of the Corporation's 2012 Annual Report on Form 10-K and for additional information regarding funding and liquidity risk management, see pages 75 through 79 of the MD&A of the Corporation's 2012 Annual Report on Form 10-K.
We use derivative transactions to manage the duration, interest rate and currency risks of our borrowings, considering the characteristics of the assets they are funding. For further details on our ALM activities, see Interest Rate Risk Management for Nontrading Activities on page 118.
We also diversify our unsecured funding sources by issuing various types of debt instruments including structured liabilities, which are debt obligations that pay investors returns linked to other debt or equity securities, indices, currencies or commodities. We typically hedge the returns we are obligated to pay on these liabilities with derivative positions and/or investments in the underlying instruments, so that from a funding perspective, the cost is similar to our other unsecured long-term debt. We could be required to settle certain structured liability obligations for cash or other securities prior to maturity under certain circumstances, which we consider for liquidity planning purposes. We believe, however, that a portion of such borrowings will remain outstanding beyond the earliest put or redemption date. We had outstanding structured liabilities with a carrying value of $52.3 billion and $51.7 billion at March 31, 2013 and December 31, 2012.
Substantially all of our senior and subordinated debt obligations contain no provisions that could trigger a requirement for an early repayment, require additional collateral support, result in changes to terms, accelerate maturity or create additional financial obligations upon an adverse change in our credit ratings, financial ratios, earnings, cash flows or stock price.
69
Contingency Planning
We maintain contingency funding plans that outline our potential responses to liquidity stress events at various levels of severity. These policies and plans are based on stress scenarios and include potential funding strategies and communication and notification procedures that we would implement in the event we experienced stressed liquidity conditions. We periodically review and test the contingency funding plans to validate efficacy and assess readiness.
Our U.S. bank subsidiaries can access contingency funding through the Federal Reserve Discount Window. Certain non-U.S. subsidiaries have access to central bank facilities in the jurisdictions in which they operate. While we do not rely on these sources in our liquidity modeling, we maintain the policies, procedures and governance processes that would enable us to access these sources if necessary.
Credit Ratings
Our borrowing costs and ability to raise funds are impacted by our credit ratings. In addition, credit ratings may be important to customers or counterparties when we compete in certain markets and when we seek to engage in certain transactions, including OTC derivatives. Thus, it is our objective to maintain high-quality credit ratings.
Credit ratings and outlooks are opinions expressed by rating agencies on our creditworthiness and that of our obligations or securities, including long-term debt, short-term borrowings, preferred stock and other securities, including asset securitizations. Our credit ratings are subject to ongoing review by the rating agencies which consider a number of factors, including our own financial strength, performance, prospects and operations as well as factors not under our control. The rating agencies could make adjustments to our ratings at any time and they provide no assurances that they will maintain our ratings at current levels.
Other factors that influence our credit ratings include changes to the rating agencies' methodologies for our industry or certain security types, the rating agencies' assessment of the general operating environment for financial services companies, our mortgage exposures, our relative positions in the markets in which we compete, reputation, liquidity position, diversity of funding sources, funding costs, the level and volatility of earnings, corporate governance and risk management policies, capital position, capital management practices, and current or future regulatory and legislative initiatives.
The major rating agencies have each indicated that, as a systemically important financial institution, our credit ratings currently reflect their expectation that, if necessary, we would receive significant support from the U.S. government, and that they will continue to assess such support in the context of sovereign financial strength and regulatory and legislative developments.
On March 27, 2013, Moody's Investor Service, Inc. (Moody's) published an update on systemic support in U.S. bank ratings and indicated the agency expects to resolve the current negative outlooks on its ratings for systemically important U.S. BHCs, including that of the Corporation, during 2013. On December 20, 2012, Standard & Poor's Ratings Services (S&P) published a full credit analysis report on the Corporation, leaving the credit ratings for the company and its subsidiaries unchanged as of that date. On October 10, 2012, Fitch Ratings (Fitch) announced the results of its periodic review of its ratings for 12 large, complex securities trading and universal banks, including the Corporation. As part of this action, Fitch affirmed the Corporation's credit ratings.
Currently, the Corporation's long-term/short-term senior debt ratings and outlooks expressed by the rating agencies are as follows: Baa2/P-2 (negative) by Moody's, A-/A-2 (negative) by S&P, and A/F1 (stable) by Fitch. BANA's long-term/short-term senior debt ratings and outlooks are as follows: A3/P-2 (stable) by Moody's, A/A-1 (negative) by S&P, and A/F1 (stable) by Fitch. The credit ratings of Merrill Lynch from the three major credit rating agencies are the same as those of the Corporation. The major credit rating agencies have indicated that the primary drivers of Merrill Lynch's credit ratings are the Corporation's credit ratings. MLPF&S's long-term/short-term senior debt ratings and outlooks are A/A-1 (negative) by S&P and A/F1 (stable) by Fitch. Merrill Lynch International's long-term/short-term senior debt rating is A/A-1 (negative) by S&P.
A reduction in certain of our credit ratings or the ratings of certain asset-backed securitizations may have a material adverse effect on our liquidity, potential loss of access to credit markets, the related cost of funds, our businesses and on certain trading revenues, particularly in those businesses where counterparty creditworthiness is critical. In addition, under the terms of certain OTC derivative contracts and other trading agreements, in the event of downgrades of our or our rated subsidiaries' credit ratings, the counterparties to those agreements may require us to provide additional collateral, or to terminate these contracts or agreements, which could cause us to sustain losses and/or adversely impact our liquidity. If the short-term credit ratings of our parent company, bank or broker/dealer subsidiaries were downgraded by one or more levels, the potential loss of access to short-term funding sources such as repo financing and the effect on our incremental cost of funds could be material.
70
At March 31, 2013, if the rating agencies had downgraded their long-term senior debt ratings for the Corporation or certain subsidiaries by one incremental notch, the amount of additional collateral contractually required by derivative contracts and other trading agreements would have been approximately $2.7 billion, comprised of $2.3 billion for BANA and $407 million for Merrill Lynch and certain of its subsidiaries. If the rating agencies had downgraded their long-term senior debt ratings for these entities by a second incremental notch, approximately $5.4 billion in additional incremental collateral, comprised of $1.4 billion for BANA and $4.0 billion for Merrill Lynch and certain of its subsidiaries, would have been required.
Also, if the rating agencies had downgraded their long-term senior debt ratings for the Corporation or certain subsidiaries by one incremental notch, the derivative liability that would be subject to unilateral termination by counterparties as of March 31, 2013 was $3.9 billion, against which $3.1 billion of collateral has been posted. If the rating agencies had downgraded their long-term senior debt ratings for the Corporation and certain subsidiaries by a second incremental notch, the derivative liability that would be subject to unilateral termination by counterparties as of March 31, 2013 was an incremental $1.5 billion, against which $972 million of collateral has been posted.
While certain potential impacts are contractual and quantifiable, the full scope of consequences of a credit ratings downgrade to a financial institution is inherently uncertain, as it depends upon numerous dynamic, complex and inter-related factors and assumptions, including whether any downgrade of a firm's long-term credit ratings precipitates downgrades to its short-term credit ratings, and assumptions about the potential behaviors of various customers, investors and counterparties. For additional information on potential impacts of credit rating downgrades, see Liquidity Risk – Time to Required Funding and Stress Modeling on page 67.
For information regarding the additional collateral and termination payments that could be required in connection with certain OTC derivative contracts and other trading agreements as a result of such a credit rating downgrade, see Note 3 – Derivatives to the Consolidated Financial Statements and Item 1A. Risk Factors of the Corporation's 2012 Annual Report on Form 10-K.
Credit Risk Management |
Credit quality continued to improve during the first quarter of 2013 due in part to improving economic conditions. Economic conditions and our proactive credit risk management activities positively impacted the credit portfolio as charge-offs and delinquencies continued to improve, primarily in the consumer portfolios and risk ratings improved in the commercial portfolios. For more information, see Executive Summary – First Quarter 2013 Economic and Business Environment on page 6.
We proactively refine our underwriting and credit management practices as well as credit standards to meet the changing economic environment. To actively mitigate losses and enhance customer support in our consumer businesses, we have in place collection programs and loan modification and customer assistance infrastructures. We utilize a number of actions to mitigate losses in the commercial businesses including increasing the frequency and intensity of portfolio monitoring, hedging activity and our practice of transferring management of deteriorating commercial exposures to independent special asset officers as credits enter criticized categories.
Certain European countries, including Greece, Ireland, Italy, Portugal and Spain, have experienced varying degrees of financial stress. For additional information on our exposures and related risks in non-U.S. countries, see Non-U.S. Portfolio on page 104 and Item 1A. Risk Factors of the Corporation's 2012 Annual Report on Form 10-K.
For information on our Credit Risk Management activities, see Consumer Portfolio Credit Risk Management on page 72, Commercial Portfolio Credit Risk Management on page 92, Non-U.S. Portfolio on page 104, Provision for Credit Losses and Allowance for Credit Losses both on page 108, Note 5 – Outstanding Loans and Leases and Note 6 – Allowance for Credit Losses to the Consolidated Financial Statements.
71
Consumer Portfolio Credit Risk Management |
Credit risk management for the consumer portfolio begins with initial underwriting and continues throughout a borrower's credit cycle. Statistical techniques in conjunction with experiential judgment are used in all aspects of portfolio management including underwriting, product pricing, risk appetite, setting credit limits, and establishing operating processes and metrics to quantify and balance risks and returns. Statistical models are built using detailed behavioral information from external sources such as credit bureaus and/or internal historical experience. These models are a component of our consumer credit risk management process and are used in part to help make both new and ongoing credit decisions, as well as portfolio management strategies, including authorizations and line management, collection practices and strategies, determination of the allowance for loan and lease losses, and allocated capital for credit risk.
Since January 2008, and through the first quarter of 2013, Bank of America and Countrywide have completed approximately 1.2 million loan modifications with customers. During the first quarter of 2013, we completed nearly 61,000 customer loan modifications with a total unpaid principal balance of approximately $13 billion, including approximately 13,900 permanent modifications under the government's Making Home Affordable Program. Of the loan modifications completed in the three months ended March 31, 2013, in terms of both the volume of modifications and the unpaid principal balance associated with the underlying loans, most were in the portfolio serviced for investors and were not on our balance sheet. The most common types of modifications include a combination of rate reduction and/or capitalization of past due amounts which represented 66 percent of the volume of modifications completed during the three months ended March 31, 2013, while principal reductions and forgiveness represented 16 percent, principal forbearance represented 10 percent and capitalization of past due amounts represented five percent. For modified loans on our balance sheet, these modification types are generally considered TDRs. For more information on TDRs and portfolio impacts, see Consumer Portfolio Credit Risk Management – Nonperforming Consumer Loans and Foreclosed Properties Activity on page 89 and Note 5 – Outstanding Loans and Leases to the Consolidated Financial Statements.
Consumer Credit Portfolio |
Improvement in the U.S. economy, labor markets and home prices during 2012 and into the first quarter of 2013 resulted in lower credit losses across all major consumer portfolios compared to the first quarter of 2012. Although home prices have shown steady improvement over the past year, it was not enough to offset the adverse impact in the home loans portfolio since 2006.
Improved credit quality across the consumer portfolio drove a $1.8 billion decrease in the consumer allowance for loan and lease losses to $19.3 billion at March 31, 2013 compared to December 31, 2012. For more information, see Allowance for Credit Losses on page 108.
In January 2013, we entered into the FNMA Settlement to resolve substantially all outstanding and potential repurchase and certain other claims relating to the origination, sale and delivery of residential mortgage loans originated and sold directly to FNMA from January 1, 2000 through December 31, 2008 by entities related to Countrywide and BANA. In connection with the FNMA Settlement, we repurchased certain loans from FNMA and, as of March 31, 2013, these loans had an unpaid principal balance of $6.2 billion and a carrying value of $5.3 billion of which $5.9 billion of unpaid principal balance and $4.9 billion of carrying value were classified as PCI loans. All of these loans are included in the Legacy Assets & Servicing portfolio in Table 26. For more information on PCI loans, see Consumer Portfolio Credit Risk Management – Purchased Credit-impaired Loan Portfolio on page 83 and Note 5 – Outstanding Loans and Leases to the Consolidated Financial Statements. For more information on the FNMA Settlement, see Note 8 – Representations and Warranties Obligations and Corporate Guarantees to the Consolidated Financial Statements.
For further information on our accounting policies regarding delinquencies, nonperforming status, charge-offs and TDRs for the consumer portfolio, see Note 1 – Summary of Significant Accounting Principles to the Consolidated Financial Statements of the Corporation's 2012 Annual Report on Form 10-K.
72
Table 23 presents our outstanding consumer loans and the PCI loan portfolio. In addition to being included in the "Outstandings" columns in Table 23, PCI loans are also shown separately, net of purchase accounting adjustments, in the "Purchased Credit-impaired Loan Portfolio" columns. For additional information, see Note 5 – Outstanding Loans and Leases to the Consolidated Financial Statements. The impact of the PCI loan portfolio on certain credit statistics is reported where appropriate. For more information, see Consumer Portfolio Credit Risk Management – Purchased Credit-impaired Loan Portfolio on page 83. In addition, given the continued run-off of our discontinued real estate portfolio, effective January 1, 2013, the pay option and subprime loans previously included in discontinued real estate loans are now included as part of our residential mortgage portfolio. The majority of these loans were considered credit-impaired and were written down to fair value upon acquisition. Prior periods were reclassified to conform to current period presentation. For more information on pay option and subprime loans, see Consumer Portfolio Credit Risk Management – Purchased Credit-impaired Residential Mortgage Loan Portfolio on page 85.
Table 23 | |||||||||||||||
Consumer Loans | |||||||||||||||
Outstandings |
Purchased Credit-impaired Loan Portfolio |
||||||||||||||
(Dollars in millions) |
March 31 2013 |
December 31 2012 |
March 31 2013 |
December 31 2012 |
|||||||||||
Residential mortgage (1)
|
$ |
256,924 |
$ |
253,073 |
$ |
22,004 |
$ |
17,571 |
|||||||
Home equity |
103,218 |
107,996 |
7,660 |
8,547 |
|||||||||||
U.S. credit card |
90,047 |
94,835 |
n/a |
n/a |
|||||||||||
Non-U.S. credit card |
10,620 |
11,697 |
n/a |
n/a |
|||||||||||
Direct/Indirect consumer (2)
|
81,518 |
83,205 |
n/a |
n/a |
|||||||||||
Other consumer (3)
|
1,696 |
1,628 |
n/a |
n/a |
|||||||||||
Consumer loans excluding loans accounted for under the fair value option |
544,023 |
552,434 |
29,664 |
26,118 |
|||||||||||
Loans accounted for under the fair value option (4)
|
1,041 |
1,005 |
n/a |
n/a |
|||||||||||
Total consumer loans |
$ |
545,064 |
$ |
553,439 |
$ |
29,664 |
$ |
26,118 |
|||||||
(1) |
Outstandings include pay option loans of $6.5 billion and $6.7 billion, subprime loans of $533 million and $509 million and non-U.S. residential mortgage loans of $86 million and $93 million at March 31, 2013 and December 31, 2012. We no longer originate pay option and subprime loans.
|
(2) |
Outstandings include dealer financial services loans of $36.1 billion and $35.9 billion, consumer lending loans of $4.1 billion and $4.7 billion, U.S. securities-based lending margin loans of $28.2 billion and $28.3 billion, student loans of $4.6 billion and $4.8 billion, non-U.S. consumer loans of $7.4 billion and $8.3 billion and other consumer loans of $1.1 billion and $1.2 billion at March 31, 2013 and December 31, 2012.
|
(3) |
Outstandings include consumer finance loans of $1.4 billion and other non-U.S. consumer loans of $5 million at both period ends, and consumer overdrafts of $115 million and $177 million at March 31, 2013 and December 31, 2012.
|
(4) |
Consumer loans accounted for under the fair value option were residential mortgage loans of $1.0 billion at both March 31, 2013 and December 31, 2012. See Consumer Portfolio Credit Risk Management – Consumer Loans Accounted for Under the Fair Value Option on page 88 and Note 17 – Fair Value Option to the Consolidated Financial Statements for additional information on the fair value option.
|
n/a = not applicable
73
Table 24 presents accruing consumer loans past due 90 days or more and consumer nonperforming loans. Nonperforming loans do not include past due consumer credit card loans, other unsecured loans and in general, consumer non-real estate-secured loans (excluding those loans discharged in Chapter 7 bankruptcy) as these loans are typically charged off no later than the end of the month in which the loan becomes 180 days past due. Real estate-secured past due consumer loans that are insured by the FHA or individually insured under long-term stand-by agreements with FNMA and FHLMC (collectively, the fully-insured loan portfolio) are reported as accruing as opposed to nonperforming since the principal repayment is insured. Fully-insured loans included in accruing past due 90 days or more are primarily from our repurchases of delinquent FHA loans pursuant to our servicing agreements with GNMA. Additionally, nonperforming loans and accruing balances past due 90 days or more do not include the PCI loan portfolio or loans accounted for under the fair value option even though the customer may be contractually past due. For additional information on FHA loans, see Off-Balance Sheet Arrangements and Contractual Obligations – Servicing Matters and Foreclosure Processes on page 52.
Table 24 | |||||||||||||||
Consumer Credit Quality | |||||||||||||||
Accruing Past Due 90 Days or More |
Nonperforming |
||||||||||||||
(Dollars in millions) |
March 31 2013 |
December 31 2012 |
March 31 2013 |
December 31 2012 |
|||||||||||
Residential mortgage (1)
|
$ |
21,617 |
$ |
22,157 |
$ |
15,002 |
$ |
15,056 |
|||||||
Home equity |
— |
— |
4,195 |
4,281 |
|||||||||||
U.S. credit card |
1,360 |
1,437 |
n/a |
n/a |
|||||||||||
Non-U.S. credit card |
181 |
212 |
n/a |
n/a |
|||||||||||
Direct/Indirect consumer |
494 |
545 |
84 |
92 |
|||||||||||
Other consumer |
1 |
2 |
1 |
2 |
|||||||||||
Total (2)
|
$ |
23,653 |
$ |
24,353 |
$ |
19,282 |
$ |
19,431 |
|||||||
Consumer loans as a percentage of outstanding consumer loans (2)
|
4.35 |
% |
4.41 |
% |
3.54 |
% |
3.52 |
% |
|||||||
Consumer loans as a percentage of outstanding loans, excluding PCI and fully-insured loan portfolios (2)
|
0.48 |
0.50 |
4.55 |
4.46 |
|||||||||||
(1) |
Balances accruing past due 90 days or more are fully-insured loans. These balances include $17.0 billion and $17.8 billion of loans on which interest has been curtailed by the FHA, and therefore are no longer accruing interest, although principal is still insured, and $4.6 billion and $4.4 billion of loans on which interest was still accruing at March 31, 2013 and December 31, 2012.
|
(2) |
Balances exclude consumer loans accounted for under the fair value option. At March 31, 2013 and December 31, 2012, $401 million and $391 million of loans accounted for under the fair value option were past due 90 days or more and not accruing interest.
|
n/a = not applicable
74
Table 25 presents net charge-offs and related ratios for consumer loans and leases.
Table 25 |
|||||||||||||
Consumer Net Charge-offs and Related Ratios |
|||||||||||||
Three Months Ended March 31 |
|||||||||||||
Net Charge-offs (1)
|
Net Charge-off Ratios (1, 2)
|
||||||||||||
(Dollars in millions) |
2013 |
2012 |
2013 |
2012 |
|||||||||
Residential mortgage |
$ |
383 |
$ |
914 |
0.60 |
% |
1.36 |
% |
|||||
Home equity |
684 |
957 |
2.62 |
3.13 |
|||||||||
U.S. credit card |
947 |
1,331 |
4.19 |
5.44 |
|||||||||
Non-U.S. credit card |
112 |
203 |
4.14 |
5.78 |
|||||||||
Direct/Indirect consumer |
124 |
226 |
0.61 |
1.03 |
|||||||||
Other consumer |
52 |
56 |
12.76 |
8.59 |
|||||||||
Total |
$ |
2,302 |
$ |
3,687 |
1.70 |
2.48 |
|||||||
(1) |
Net charge-offs exclude $745 million and $94 million of write-offs in the home equity and residential mortgage PCI loan portfolios for the three months ended March 31, 2013 compared to none for the same period in 2012. These write-offs decreased the PCI valuation allowance included as part of the allowance for loan and lease losses. For more information on PCI write-offs, see Consumer Portfolio Credit Risk Management – Purchased Credit-impaired Loan Portfolio on page 83.
|
(2) |
Net charge-off ratios are calculated as annualized net charge-offs divided by average outstanding loans excluding loans accounted for under the fair value option. |
Net charge-off ratios, excluding the PCI and fully-insured loan portfolios, were 1.06 percent and 2.33 percent for residential mortgage, 2.83 percent and 3.47 percent for home equity, and 2.17 percent and 3.14 percent for the total consumer portfolio for the three months ended March 31, 2013 and 2012. These are the only product classifications that include PCI and fully-insured loans for either period.
Net charge-offs exclude $745 million and $94 million of write-offs in the home equity and residential mortgage PCI loan portfolios for the three months ended March 31, 2013 compared to none for the same period in 2012. These write-offs decreased the PCI valuation allowance included as part of the allowance for loan and lease losses. Net charge-off ratios including the PCI write-offs for home equity and residential mortgage were 5.48 percent and 0.75 percent for the three months ended March 31, 2013. For more information on PCI write-offs, see Consumer Portfolio Credit Risk Management – Purchased Credit-impaired Loan Portfolio on page 83.
75
Table 26 presents outstandings, nonperforming balances, net charge-offs, allowance for loan and lease losses and provision for loan and lease losses for the Core portfolio and the Legacy Assets & Servicing portfolio within the home loans portfolio. For more information on Legacy Assets & Servicing, see CRES on page 30.
Table 26 | |||||||||||||||||||||||
Home Loans Portfolio | |||||||||||||||||||||||
Outstandings |
Nonperforming |
Net Charge-offs (1)
|
|||||||||||||||||||||
March 31 2013 |
December 31 2012 |
March 31 2013 |
December 31 2012 |
Three Months Ended March 31 |
|||||||||||||||||||
(Dollars in millions) |
2013 |
2012 |
|||||||||||||||||||||
Core portfolio |
|||||||||||||||||||||||
Residential mortgage |
$ |
170,433 |
$ |
170,116 |
$ |
3,407 |
$ |
3,190 |
$ |
101 |
$ |
143 |
|||||||||||
Home equity |
58,958 |
60,851 |
1,302 |
1,265 |
166 |
184 |
|||||||||||||||||
Total Core portfolio |
229,391 |
230,967 |
4,709 |
4,455 |
267 |
327 |
|||||||||||||||||
Legacy Assets & Servicing portfolio |
|||||||||||||||||||||||
Residential mortgage (2)
|
86,491 |
82,957 |
11,595 |
11,866 |
282 |
771 |
|||||||||||||||||
Home equity |
44,260 |
47,145 |
2,893 |
3,016 |
518 |
773 |
|||||||||||||||||
Total Legacy Assets & Servicing portfolio |
130,751 |
130,102 |
14,488 |
14,882 |
800 |
1,544 |
|||||||||||||||||
Home loans portfolio |
|||||||||||||||||||||||
Residential mortgage |
256,924 |
253,073 |
15,002 |
15,056 |
383 |
914 |
|||||||||||||||||
Home equity |
103,218 |
107,996 |
4,195 |
4,281 |
684 |
957 |
|||||||||||||||||
Total home loans portfolio |
$ |
360,142 |
$ |
361,069 |
$ |
19,197 |
$ |
19,337 |
$ |
1,067 |
$ |
1,871 |
|||||||||||
|
Allowance for loan
and lease losses
|
Provision for loan
and lease losses
|
||||||||||||||||||||||
March 31 2013 |
December 31 2012 |
Three Months Ended March 31 |
|||||||||||||||||||||
2013 |
2012 |
||||||||||||||||||||||
Core portfolio |
|||||||||||||||||||||||
Residential mortgage |
$ |
833 |
$ |
829 |
$ |
105 |
$ |
200 |
|||||||||||||||
Home equity |
1,227 |
1,286 |
107 |
105 |
|||||||||||||||||||
Total Core portfolio |
2,060 |
2,115 |
212 |
305 |
|||||||||||||||||||
Legacy Assets & Servicing portfolio |
|||||||||||||||||||||||
Residential mortgage |
5,898 |
6,259 |
34 |
1,023 |
|||||||||||||||||||
Home equity |
5,480 |
6,559 |
238 |
437 |
|||||||||||||||||||
Total Legacy Assets & Servicing portfolio |
11,378 |
12,818 |
272 |
1,460 |
|||||||||||||||||||
Home loans portfolio |
|||||||||||||||||||||||
Residential mortgage |
6,731 |
7,088 |
139 |
1,223 |
|||||||||||||||||||
Home equity |
6,707 |
7,845 |
345 |
542 |
|||||||||||||||||||
Total home loans portfolio |
$ |
13,438 |
$ |
14,933 |
$ |
484 |
$ |
1,765 |
|||||||||||||||
(1) |
Net charge-offs exclude $745 million and $94 million of write-offs in the home equity and residential mortgage PCI loan portfolios for the three months ended March 31, 2013 which are included in the Legacy Assets & Servicing portfolio. There were no write-offs for the three months ended March 31, 2012. Write-offs in the PCI loan portfolio decrease the PCI valuation allowance included as part of the allowance for loan and lease losses. For more information on PCI write-offs, see Consumer Portfolio Credit Risk Management – Purchased Credit-impaired Loan Portfolio on page 83.
|
(2) |
Balances exclude consumer loans accounted for under the fair value option of $1.0 billion at both March 31, 2013 and December 31, 2012. See Consumer Portfolio Credit Risk Management – Consumer Loans Accounted for Under the Fair Value Option on page 88 and Note 17 – Fair Value Option to the Consolidated Financial Statements for additional information on the fair value option.
|
We believe that the presentation of information adjusted to exclude the impact of the PCI loan portfolio, the fully-insured loan portfolio and loans accounted for under the fair value option is more representative of the ongoing operations and credit quality of the business. As a result, in the following discussions of the residential mortgage and home equity portfolios, we provide information that excludes the impact of the PCI loan portfolio, the fully-insured loan portfolio and loans accounted for under the fair value option in certain credit quality statistics. We separately disclose information on the PCI loan portfolio on page 83.
76
Residential Mortgage
The residential mortgage portfolio makes up the largest percentage of our consumer loan portfolio at 47 percent of consumer loans at March 31, 2013. Approximately 16 percent of the residential mortgage portfolio is in GWIM and represents residential mortgages that are originated for the home purchase and refinancing needs of our wealth management clients. The remaining portion of the portfolio is primarily in All Other and is comprised of originated loans, purchased loans used in our overall ALM activities, loans repurchased in connection with the FNMA Settlement, delinquent FHA loans repurchased pursuant to our servicing agreements with GNMA as well as loans repurchased related to our representations and warranties.
Outstanding balances in the residential mortgage portfolio, excluding $1.0 billion of loans accounted for under the fair value option, at March 31, 2013 increased $3.9 billion compared to December 31, 2012 as loans repurchased as part of the FNMA Settlement and new origination volume retained on our balance sheet were partially offset by paydowns, charge-offs and transfers to foreclosed properties.
At March 31, 2013 and December 31, 2012, the residential mortgage portfolio included $91.0 billion and $90.9 billion of outstanding fully-insured loans. On this portion of the residential mortgage portfolio, we are protected against principal loss as a result of either FHA insurance or long-term stand-by agreements with FNMA and FHLMC. At both March 31, 2013 and December 31, 2012, $66.6 billion had FHA insurance with the remainder protected by long-term stand-by agreements. All of these loans are individually insured and therefore the Corporation does not record a significant allowance for credit losses with respect to these loans.
At March 31, 2013 and December 31, 2012, $26.7 billion and $25.5 billion of the FHA-insured loan population were repurchases of delinquent FHA loans pursuant to our servicing agreements with GNMA.
In addition to the long-term stand-by agreements with FNMA and FHLMC, we have mitigated a portion of our credit risk on the residential mortgage portfolio through the use of synthetic securitization vehicles as described in Note 5 – Outstanding Loans and Leases to the Consolidated Financial Statements. At March 31, 2013 and December 31, 2012, the synthetic securitization vehicles referenced principal balances of $16.3 billion and $17.6 billion of residential mortgage loans and provided loss protection up to $449 million and $500 million. At March 31, 2013 and December 31, 2012, the Corporation had a receivable of $269 million and $305 million from these vehicles for reimbursement of losses. The Corporation records an allowance for credit losses on loans referenced by the synthetic securitization vehicles. The reported net charge-offs for the residential mortgage portfolio do not include the benefit of amounts reimbursable from these vehicles. Adjusting for the benefit of the credit protection from the synthetic securitizations, the residential mortgage net charge-off ratio, excluding the PCI and fully-insured loan portfolios, for the three months ended March 31, 2013 would have been reduced by four bps compared to seven bps for the same period in 2012.
The long-term stand-by agreements with FNMA and FHLMC and to a lesser extent the synthetic securitizations together reduce our regulatory risk-weighted assets due to the transfer of a portion of our credit risk to unaffiliated parties. At March 31, 2013 and December 31, 2012, these programs had the cumulative effect of reducing our risk-weighted assets by $7.3 billion and $7.2 billion, and increasing our Tier 1 capital ratio by seven bps and eight bps, and our Tier 1 common capital ratio by six bps and seven bps.
77
Table 27 presents certain residential mortgage key credit statistics on both a reported basis excluding loans accounted for under the fair value option, and excluding the PCI loan portfolio, fully-insured loan portfolio and loans accounted for under the fair value option. Additionally, in the table below (in the "Reported Basis" columns) accruing balances past due and nonperforming loans do not include the PCI loan portfolio even though the customer may be contractually past due. We believe the presentation of information adjusted to exclude these loan portfolios is more representative of the credit risk in the residential mortgage loan portfolio. As such, the following discussion presents the residential mortgage portfolio excluding the PCI loan portfolio, the fully-insured loan portfolio and loans accounted for under the fair value option. For more information on the PCI loan portfolio, see page 83.
Table 27 | |||||||||||||||
Residential Mortgage – Key Credit Statistics | |||||||||||||||
Reported Basis (1)
|
Excluding Purchased
Credit-impaired and Fully-insured Loans
|
||||||||||||||
(Dollars in millions) |
March 31 2013 |
December 31 2012 |
March 31 2013 |
December 31 2012 |
|||||||||||
Outstandings |
$ |
256,924 |
$ |
253,073 |
$ |
143,967 |
$ |
144,648 |
|||||||
Accruing past due 30 days or more |
27,584 |
28,816 |
2,851 |
3,118 |
|||||||||||
Accruing past due 90 days or more |
21,617 |
22,157 |
— |
— |
|||||||||||
Nonperforming loans |
15,002 |
15,056 |
15,002 |
15,056 |
|||||||||||
Percent of portfolio |
|||||||||||||||
Refreshed LTV greater than 90 but less than 100 |
17 |
% |
15 |
% |
9 |
% |
10 |
% |
|||||||
Refreshed LTV greater than 100 |
22 |
28 |
17 |
20 |
|||||||||||
Refreshed FICO below 620 |
24 |
23 |
14 |
14 |
|||||||||||
2006 and 2007 vintages (2)
|
25 |
25 |
33 |
34 |
|||||||||||
Three Months Ended March 31 |
|||||||||||||||
2013 |
2012 |
2013 |
2012 |
||||||||||||
Net charge-off ratio (3)
|
0.60 |
% |
1.36 |
% |
1.06 |
% |
2.33 |
% |
|||||||
(1) |
Outstandings, accruing past due, nonperforming loans and percentages of portfolio exclude loans accounted for under the fair value option. There were $1.0 billion of residential mortgage loans accounted for under the fair value option at both March 31, 2013 and December 31, 2012. See Consumer Portfolio Credit Risk Management – Consumer Loans Accounted for Under the Fair Value Option on page 88 and Note 17 – Fair Value Option to the Consolidated Financial Statements for additional information on the fair value option.
|
(2) |
These vintages of loans account for 59 percent and 61 percent of nonperforming residential mortgage loans at March 31, 2013 and December 31, 2012, and 65 percent and 73 percent of residential mortgage net charge-offs for the three months ended March 31, 2013 and 2012.
|
(3) |
Net charge-off ratios are calculated as annualized net charge-offs divided by average outstanding loans excluding loans accounted for under the fair value option. |
Nonperforming residential mortgage loans at March 31, 2013 decreased $54 million compared to December 31, 2012 as paydowns, returns to performing status and charge-offs outpaced new inflows. At March 31, 2013, borrowers were current on contractual payments with respect to $4.4 billion, or 29 percent of nonperforming residential mortgage loans, and $8.2 billion, or 54 percent of nonperforming residential mortgage loans were 180 days or more past due and had been written down to the estimated fair value of the collateral less costs to sell. Accruing loans past due 30 days or more at March 31, 2013 decreased $267 million compared to December 31, 2012.
Net charge-offs decreased $531 million to $383 million for the three months ended March 31, 2013, or 1.06 percent of total average residential mortgage loans, compared to $914 million, or 2.33 percent for the same period in 2012. The decrease in net charge-offs was primarily driven by favorable portfolio trends and decreased write-downs on loans greater than 180 days past due which were written down to the estimated fair value of the collateral less costs to sell, due in part to improvement in home prices and the U.S. economy. Net charge-off ratios were further impacted by lower loan balances primarily due to paydowns and charge-offs outpacing new originations.
Loans in the residential mortgage portfolio with certain characteristics have greater risk of loss than others. These characteristics include loans with a high refreshed loan-to-value (LTV), loans originated at the peak of home prices in 2006 and 2007, interest-only loans and loans to borrowers located in California and Florida where we have concentrations and where significant declines in home prices have been experienced. Although the disclosures in this section address each of these risk characteristics separately, there is significant overlap in loans with these characteristics, which contributed to a disproportionate share of the losses in the portfolio. The residential mortgage loans with all of these higher risk characteristics comprised four percent of the residential mortgage portfolio at both March 31, 2013 and December 31, 2012, and accounted for 18 percent of the residential mortgage net charge-offs during the three months ended March 31, 2013 compared to 22 percent for the same period in 2012.
78
Residential mortgage loans with a greater than 90 percent but less than 100 percent refreshed LTV represented nine percent and 10 percent of the residential mortgage portfolio at March 31, 2013 and December 31, 2012. Loans with a refreshed LTV greater than 100 percent represented 17 percent and 20 percent of the residential mortgage loan portfolio at March 31, 2013 and December 31, 2012. Of the loans with a refreshed LTV greater than 100 percent, 94 percent and 92 percent were performing at March 31, 2013 and December 31, 2012. Loans with a refreshed LTV greater than 100 percent reflect loans where the outstanding carrying value of the loan is greater than the most recent valuation of the property securing the loan. The majority of these loans have a refreshed LTV greater than 100 percent primarily due to home price deterioration since 2006. Loans to borrowers with refreshed FICO scores below 620 represented 14 percent of the residential mortgage portfolio at both March 31, 2013 and December 31, 2012.
Of the $144.0 billion and $144.6 billion in total residential mortgage loans outstanding at March 31, 2013 and December 31, 2012, as shown in Table 28, 41 percent and 40 percent were originated as interest-only loans. The outstanding balance of interest-only residential mortgage loans that have entered the amortization period was $15.5 billion, or 26 percent at March 31, 2013. Residential mortgage loans that have entered the amortization period generally have experienced a higher rate of early stage delinquencies and nonperforming status compared to the residential mortgage portfolio as a whole. As of March 31, 2013, $377 million, or two percent of outstanding interest-only residential mortgages that had entered the amortization period were accruing past due 30 days or more compared to $2.9 billion, or two percent of accruing past due 30 days or more for the entire residential mortgage portfolio. In addition, at March 31, 2013, $2.6 billion, or 17 percent of outstanding interest-only residential mortgages that had entered the amortization period were nonperforming compared to $15.0 billion, or 10 percent of nonperforming loans for the entire residential mortgage portfolio. Loans in our interest-only residential mortgage portfolio have an interest-only period of three to ten years and more than 85 percent of these loans will not be required to make a fully-amortizing payment until 2015 or later.
Table 28 presents outstandings, nonperforming loans and net charge-offs by certain state concentrations for the residential mortgage portfolio. The Los Angeles-Long Beach-Santa Ana Metropolitan Statistical Area (MSA) within California represented 12 percent of outstandings at both March 31, 2013 and December 31, 2012. Loans within this MSA comprised only six percent and eight percent of net charge-offs for the three months ended March 31, 2013 and 2012.
Table 28 | |||||||||||||||||||||||
Residential Mortgage State Concentrations | |||||||||||||||||||||||
Outstandings (1)
|
Nonperforming (1)
|
Net Charge-offs (2)
|
|||||||||||||||||||||
March 31 2013 |
December 31 2012 |
March 31 2013 |
December 31 2012 |
Three Months Ended March 31 |
|||||||||||||||||||
(Dollars in millions) |
2013 |
2012 |
|||||||||||||||||||||
California |
$ |
48,395 |
$ |
48,673 |
$ |
4,651 |
$ |
4,581 |
$ |
96 |
$ |
337 |
|||||||||||
New York (3)
|
11,528 |
11,291 |
1,000 |
972 |
15 |
20 |
|||||||||||||||||
Florida (3)
|
10,985 |
11,101 |
1,743 |
1,773 |
34 |
88 |
|||||||||||||||||
Texas |
6,867 |
6,933 |
487 |
499 |
9 |
19 |
|||||||||||||||||
Virginia |
5,006 |
5,097 |
426 |
410 |
9 |
16 |
|||||||||||||||||
Other U.S./Non-U.S. |
61,186 |
61,553 |
6,695 |
6,821 |
220 |
434 |
|||||||||||||||||
Residential mortgage loans (4)
|
$ |
143,967 |
$ |
144,648 |
$ |
15,002 |
$ |
15,056 |
$ |
383 |
$ |
914 |
|||||||||||
Fully-insured loan portfolio |
90,953 |
90,854 |
|||||||||||||||||||||
Purchased credit-impaired residential mortgage loan portfolio |
22,004 |
17,571 |
|||||||||||||||||||||
Total residential mortgage loan portfolio |
$ |
256,924 |
$ |
253,073 |
|||||||||||||||||||
(1) |
Outstandings and nonperforming amounts exclude loans accounted for under the fair value option. There were $1.0 billion of residential mortgage loans accounted for under the fair value option at both March 31, 2013 and December 31, 2012. See Consumer Portfolio Credit Risk Management – Consumer Loans Accounted for Under the Fair Value Option on page 88 and Note 17 – Fair Value Option to the Consolidated Financial Statements for additional information on the fair value option.
|
(2) |
Net charge-offs exclude $94 million of write-offs in the residential mortgage PCI loan portfolio for the three months ended March 31, 2013 compared to none for the same period in 2012. These write-offs decreased the PCI valuation allowance included as part of the allowance for loan and lease losses. For more information on PCI write-offs, see Consumer Portfolio Credit Risk Management – Purchased Credit-impaired Loan Portfolio on page 83.
|
(3) |
In these states, foreclosure requires a court order following a legal proceeding (judicial states). |
(4) |
Amount excludes the PCI residential mortgage and fully-insured loan portfolios. |
79
The Community Reinvestment Act (CRA) encourages banks to meet the credit needs of their communities for housing and other purposes, particularly in neighborhoods with low or moderate incomes. At March 31, 2013 and December 31, 2012, our CRA portfolio was $11.2 billion and $11.3 billion, or eight percent of the residential mortgage loan balances for both periods. The CRA portfolio included $2.4 billion and $2.5 billion of nonperforming loans at March 31, 2013 and December 31, 2012 representing 16 percent of total nonperforming residential mortgage loans for both periods. Net charge-offs related to the CRA portfolio were $91 million and $187 million for the three months ended March 31, 2013 and 2012, or 24 percent and 20 percent of total net charge-offs for the residential mortgage portfolio.
Home Equity
The home equity portfolio makes up 19 percent of the consumer portfolio and is comprised of HELOCs, home equity loans and reverse mortgages. At March 31, 2013, our HELOC portfolio had an outstanding balance of $87.6 billion, or 85 percent of the total home equity portfolio. HELOCs generally have an initial draw period of 10 years with approximately nine percent of the portfolio having a draw period of five years with a five-year renewal option. During the initial draw period, the borrowers are only required to pay the interest due on the loans on a monthly basis. After the initial draw period ends, the loans generally convert to 15-year amortizing loans.
At March 31, 2013, our home equity loan portfolio had an outstanding balance of $14.2 billion, or 14 percent of the total home equity portfolio. Home equity loans are almost all fixed-rate loans with amortizing payment terms of 10 to 30 years and 51 percent of these loans have 25- to 30-year terms.
At March 31, 2013, our reverse mortgage portfolio had an outstanding balance of $1.4 billion, or one percent of the total home equity portfolio. We no longer originate these products.
At March 31, 2013, approximately 86 percent of the home equity portfolio was included in CRES while the remainder of the portfolio was primarily in GWIM. Outstanding balances in the home equity portfolio at March 31, 2013 decreased $4.8 billion compared to December 31, 2012 primarily due to paydowns and charge-offs outpacing new originations and draws on existing lines. Of the total home equity portfolio at March 31, 2013 and December 31, 2012, $24.3 billion and $24.7 billion, or 23 percent for both periods, were in first-lien positions (25 percent excluding the PCI home equity portfolio at both March 31, 2013 and December 31, 2012). At March 31, 2013, outstanding balances in the home equity portfolio that were in a second-lien or more junior-lien position and where we also held the first-lien loan totaled $27.5 billion, or 29 percent of our total home equity portfolio excluding the PCI loan portfolio.
Unused HELOCs totaled $60.0 billion at March 31, 2013 compared to $60.9 billion at December 31, 2012. This decrease was primarily due to customers choosing to close accounts as well as line management initiatives on deteriorating accounts, which more than offset new production. The HELOC utilization rate was 59 percent at March 31, 2013 compared to 60 percent at December 31, 2012.
80
Table 29 presents certain home equity portfolio key credit statistics on both a reported basis as well as excluding the PCI loan portfolio. Additionally, in the table below (in the "Reported Basis" columns) accruing balances past due 30 days or more and nonperforming loans do not include the PCI loan portfolio even though the customer may be contractually past due. We believe the presentation of information adjusted to exclude the impact of the PCI loan portfolio is more representative of the credit risk in this portfolio.
Table 29 | |||||||||||||||
Home Equity – Key Credit Statistics | |||||||||||||||
Reported Basis |
Excluding Purchased Credit-impaired Loans |
||||||||||||||
(Dollars in millions) |
March 31 2013 |
December 31 2012 |
March 31 2013 |
December 31 2012 |
|||||||||||
Outstandings |
$ |
103,218 |
$ |
107,996 |
$ |
95,558 |
$ |
99,449 |
|||||||
Accruing past due 30 days or more (1)
|
983 |
1,098 |
983 |
1,098 |
|||||||||||
Nonperforming loans (1)
|
4,195 |
4,281 |
4,195 |
4,281 |
|||||||||||
Percent of portfolio |
|||||||||||||||
Refreshed combined LTV greater than 90 but less than 100 |
10 |
% |
10 |
% |
10 |
% |
10 |
% |
|||||||
Refreshed combined LTV greater than 100 |
30 |
31 |
27 |
29 |
|||||||||||
Refreshed FICO below 620 |
9 |
9 |
8 |
8 |
|||||||||||
2006 and 2007 vintages (2)
|
48 |
48 |
45 |
46 |
|||||||||||
Three Months Ended March 31 |
|||||||||||||||
2013 |
2012 |
2013 |
2012 |
||||||||||||
Net charge-off ratio (3)
|
2.62 |
% |
3.13 |
% |
2.83 |
% |
3.47 |
% |
|||||||
(1) |
Accruing past due 30 days or more includes $303 million and $321 million and nonperforming loans includes $791 million and $824 million of loans where we serviced the underlying first-lien at March 31, 2013 and December 31, 2012.
|
(2) |
These vintages of loans have higher refreshed combined LTV ratios and accounted for 51 percent of nonperforming home equity loans at both March 31, 2013 and December 31, 2012, and accounted for 60 percent and 65 percent of net charge-offs for the three months ended March 31, 2013 and 2012.
|
(3) |
Net charge-off ratios are calculated as annualized net charge-offs divided by average outstanding loans. |
The following discussion presents the home equity portfolio excluding the PCI loan portfolio.
Nonperforming outstanding balances in the home equity portfolio at March 31, 2013 decreased $86 million compared to December 31, 2012 due to charge-offs and returns to performing status outpacing new inflows.
At March 31, 2013, on $2.0 billion, or 48 percent of nonperforming home equity loans, the borrowers were current on contractual payments and $1.3 billion, or 30 percent of nonperforming home equity loans were 180 days or more past due and had been written down to the estimated fair value of the collateral less costs to sell. Outstanding balances accruing past due 30 days or more at March 31, 2013 decreased $115 million compared to December 31, 2012.
In some cases, the junior-lien home equity outstanding balance that we hold is performing, but the underlying first-lien is not. For outstanding balances in the home equity portfolio on which we service the first-lien loan, we are able to track whether the first-lien loan is in default. For loans where the first-lien is serviced by a third party, we utilize credit bureau data to estimate the delinquency status of the first-lien. Given that the credit bureau database we use does not include a property address for the mortgages, we are unable to identify with certainty whether a reported delinquent first-lien mortgage pertains to the same property for which we hold a junior-lien loan. At March 31, 2013, we estimate that $2.5 billion of current and $508 million of 30 to 89 days past due junior-lien loans were behind a delinquent first-lien loan. We service the first-lien loans on $858 million of these combined amounts, with the remaining $2.1 billion serviced by third parties. Of the $3.0 billion current to 89 days past due junior-lien loans, based on available credit bureau data and our own internal servicing data, we estimate that approximately $1.4 billion had first-lien loans that were 90 days or more past due.
Net charge-offs decreased $273 million to $684 million, or 2.83 percent of the total average home equity portfolio, for the three months ended March 31, 2013 compared to $957 million, or 3.47 percent for the same period in 2012 primarily driven by favorable portfolio trends due in part to improvement in home prices and the U.S. economy. Net charge-off ratios were further impacted by lower outstanding balances primarily as a result of paydowns and charge-offs outpacing new originations and draws on existing lines.
81
There are certain characteristics of the home equity portfolio that have contributed to higher losses including those loans with a high refreshed combined loan-to-value (CLTV), loans that were originated at the peak of home prices in 2006 and 2007, and loans in geographic areas that have experienced the most significant declines in home prices. Home price declines since 2006 coupled with the fact that most home equity outstandings are secured by second-lien positions have significantly reduced and, in some cases, eliminated all collateral value after consideration of the first-lien position. Although the disclosures in this section address each of these risk characteristics separately, there is significant overlap in outstanding balances with these characteristics, which has contributed to a disproportionate share of losses in the portfolio. Outstanding balances in the home equity portfolio with all of these higher risk characteristics comprised eight percent of the total home equity portfolio at both March 31, 2013 and December 31, 2012, and accounted for 19 percent and 26 percent of the home equity net charge-offs for the three months ended March 31, 2013 and 2012.
Outstanding balances in the home equity portfolio with greater than 90 percent but less than 100 percent refreshed CLTVs comprised 10 percent of the home equity portfolio at both March 31, 2013 and December 31, 2012. Outstanding balances with refreshed CLTVs greater than 100 percent comprised 27 percent and 29 percent of the home equity portfolio at March 31, 2013 and December 31, 2012. Outstanding balances in the home equity portfolio with a refreshed CLTV greater than 100 percent reflect loans where the carrying value and available line of credit of the combined loans are equal to or greater than the most recent valuation of the property securing the loan. Depending on the value of the property, there may be collateral in excess of the first-lien that is available to reduce the severity of loss on the second-lien. Home price deterioration since 2006 has contributed to an increase in CLTV ratios. Of those outstanding balances with a refreshed CLTV greater than 100 percent, 96 percent of the customers were current on their home equity loan and 92 percent of second-lien loans with a refreshed CLTV greater than 100 percent were current on both their second-lien and underlying first-lien loans at March 31, 2013. Outstanding balances in the home equity portfolio to borrowers with a refreshed FICO score below 620 represented eight percent of the home equity portfolio at both March 31, 2013 and December 31, 2012.
Of the $95.6 billion and $99.4 billion in total home equity portfolio outstandings at March 31, 2013 and December 31, 2012, 80 percent and 79 percent were interest-only loans, almost all of which were HELOCs. The outstanding balance of HELOCs that have entered the amortization period was $2.2 billion, or three percent of total HELOCs at March 31, 2013. The HELOCs that have entered the amortization period have experienced a higher percentage of early stage delinquencies and nonperforming status when compared to the HELOC portfolio as a whole. At March 31, 2013, $70 million, or three percent of outstanding HELOCs that had entered the amortization period were accruing past due 30 days or more compared to $879 million, or one percent of outstanding accruing past due 30 days or more for the entire HELOC portfolio. In addition, at March 31, 2013, $149 million, or seven percent of outstanding HELOCs that had entered the amortization period were nonperforming compared to $3.7 billion, or four percent of outstandings that were nonperforming for the entire HELOC portfolio. Loans in our HELOC portfolio generally have an initial draw period of 10 years and more than 85 percent of these loans will not be required to make a fully-amortizing payment until 2015 or later.
Although we do not actively track how many of our home equity customers pay only the minimum amount due on their home equity loans and lines, we can infer some of this information through a review of our HELOC portfolio that we service and that is still in its revolving period (i.e., customers may draw on and repay their line of credit, but are generally only required to pay interest on a monthly basis). During the three months ended March 31, 2013, approximately 62 percent of these customers did not pay any principal on their HELOCs.
82
Table 30 presents outstandings, nonperforming balances and net charge-offs by certain state concentrations for the home equity portfolio. In the New York area, the New York-Northern New Jersey-Long Island MSA made up 11 percent of the outstanding home equity portfolio at both March 31, 2013 and December 31, 2012. This MSA comprised nine percent and eight percent of net charge-offs for the three months ended March 31, 2013 and 2012. The Los Angeles-Long Beach-Santa Ana MSA within California made up 12 percent of the outstanding home equity portfolio at both March 31, 2013 and December 31, 2012. This MSA comprised 10 percent and 12 percent of net charge-offs for the three months ended March 31, 2013 and 2012.
For information on representations and warranties related to our home equity portfolio, see Off-Balance Sheet Arrangements and Contractual Obligations – Representations and Warranties on page 45 and Note 8 – Representations and Warranties Obligations and Corporate Guarantees to the Consolidated Financial Statements.
Table 30 | |||||||||||||||||||||||
Home Equity State Concentrations | |||||||||||||||||||||||
Outstandings |
Nonperforming |
Net Charge-offs (1)
|
|||||||||||||||||||||
March 31 2013 |
December 31 2012 |
March 31 2013 |
December 31 2012 |
Three Months Ended March 31 |
|||||||||||||||||||
(Dollars in millions) |
2013 |
2012 |
|||||||||||||||||||||
California |
$ |
27,566 |
$ |
28,728 |
$ |
1,100 |
$ |
1,127 |
$ |
193 |
$ |
316 |
|||||||||||
Florida (2)
|
11,523 |
11,898 |
682 |
706 |
122 |
164 |
|||||||||||||||||
New Jersey (2)
|
6,574 |
6,788 |
305 |
312 |
36 |
43 |
|||||||||||||||||
New York (2)
|
6,518 |
6,734 |
409 |
419 |
39 |
48 |
|||||||||||||||||
Massachusetts |
4,200 |
4,381 |
141 |
140 |
15 |
14 |
|||||||||||||||||
Other U.S./Non-U.S. |
39,177 |
40,920 |
1,558 |
1,577 |
279 |
372 |
|||||||||||||||||
Home equity loans (3)
|
$ |
95,558 |
$ |
99,449 |
$ |
4,195 |
$ |
4,281 |
$ |
684 |
$ |
957 |
|||||||||||
Purchased credit-impaired home equity portfolio |
7,660 |
8,547 |
|||||||||||||||||||||
Total home equity loan portfolio |
$ |
103,218 |
$ |
107,996 |
|||||||||||||||||||
(1) |
Net charge-offs exclude $745 million of write-offs in the home equity PCI loan portfolio for the three months ended March 31, 2013 compared to none for the same period in 2012. These write-offs decreased the PCI valuation allowance included as part of the allowance for loan and lease losses. For more information on PCI write-offs, see Consumer Portfolio Credit Risk Management – Purchased Credit-impaired Loan Portfolio on page 83.
|
(2) |
In these states, foreclosure requires a court order following a legal proceeding (judicial states). |
(3) |
Amount excludes the PCI home equity portfolio. |
Purchased Credit-impaired Loan Portfolio
Loans acquired with evidence of credit quality deterioration since origination and for which it is probable at purchase that we will be unable to collect all contractually required payments are accounted for under the accounting guidance for PCI loans, which addresses accounting for differences between contractual and expected cash flows to be collected from the purchaser's initial investment in loans if those differences are attributable, at least in part, to credit quality. Evidence of credit quality deterioration as of the acquisition date may include statistics such as past due status, refreshed FICO scores and refreshed LTVs. PCI loans are recorded at fair value upon acquisition and the applicable accounting guidance prohibits carrying over or recording a valuation allowance in the initial accounting.
PCI loans that have similar risk characteristics, primarily credit risk, collateral type and interest rate risk, are pooled and accounted for as a single asset with a single composite interest rate and an aggregate expectation of cash flows. Once a pool is assembled, it is considered as if it were one loan for purposes of applying the accounting guidance for PCI loans. An individual loan is removed from a PCI loan pool if it is sold, foreclosed, forgiven or the expectation of any future proceeds is remote. When a loan is removed from a PCI loan pool and the foreclosure or recovery value of the loan is less than the loan's carrying value, the difference is first applied against the PCI pool's nonaccretable difference. If the nonaccretable difference has been fully utilized, only then is the PCI pool's basis applicable to that loan written-off against its valuation reserve; however, the integrity of the pool is maintained and it continues to be accounted for as if it were one loan.
In January 2013, in connection with the FNMA Settlement, we repurchased certain residential mortgage loans that had previously been sold to FNMA, which we have valued at less than the purchase price. As of March 31, 2013, loans repurchased in connection with the FNMA Settlement that we classified as PCI had an unpaid principal balance of $5.9 billion and a carrying value of $4.9 billion, all of which were residential mortgage loans. For additional information, see Note 8 – Representations and Warranties Obligations and Corporate Guarantees to the Consolidated Financial Statements.
83
Table 31 presents the unpaid principal balance, carrying value, related valuation allowance and the net carrying value as a percentage of the unpaid principal balance for the PCI loan portfolio.
Table 31 | ||||||||||||||||||
Purchased Credit-impaired Loan Portfolio | ||||||||||||||||||
March 31, 2013 |
||||||||||||||||||
(Dollars in millions) |
Unpaid
Principal Balance
|
Carrying
Value
|
Related
Valuation Allowance
|
Carrying
Value Net of Valuation Allowance
|
Percent of Unpaid
Principal Balance
|
|||||||||||||
Residential mortgage |
$ |
23,194 |
$ |
22,004 |
$ |
2,804 |
$ |
19,200 |
82.78 |
% |
||||||||
Home equity |
7,456 |
7,660 |
1,686 |
5,974 |
80.12 |
|||||||||||||
Total purchased credit-impaired loan portfolio |
$ |
30,650 |
$ |
29,664 |
$ |
4,490 |
$ |
25,174 |
82.13 |
|||||||||
December 31, 2012 |
||||||||||||||||||
Residential mortgage |
$ |
18,179 |
$ |
17,571 |
$ |
3,108 |
$ |
14,463 |
79.56 |
% |
||||||||
Home equity |
8,324 |
8,547 |
2,428 |
6,119 |
73.51 |
|||||||||||||
Total purchased credit-impaired loan portfolio |
$ |
26,503 |
$ |
26,118 |
$ |
5,536 |
$ |
20,582 |
77.66 |
|||||||||
The total PCI unpaid principal balance increased $4.1 billion, or 16 percent, to $30.7 billion at March 31, 2013 compared to December 31, 2012 primarily due to the $5.9 billion of loans repurchased in connection with the FNMA Settlement. Excluding the $5.9 billion of loans repurchased, the total PCI unpaid principal balance decreased $1.7 billion primarily driven by liquidations, payoffs and paydowns.
Of the unpaid principal balance of $30.7 billion at March 31, 2013, $7.8 billion was 180 days or more past due, including $7.6 billion of first-lien and $205 million of home equity loans. Of the $22.9 billion that was less than 180 days past due, $19.5 billion, or 85 percent of the total unpaid principal balance, was current based on the contractual terms while $2.1 billion, or nine percent, was in early stage delinquency.
During the three months ended March 31, 2013, we recorded a provision benefit of $207 million for the PCI loan portfolio including a provision benefit of $191 million for residential mortgage and a benefit of $16 million for home equity. This compared to a total provision expense of $487 million for the three months ended March 31, 2012. The provision for credit losses for the three months ended March 31, 2013 was primarily driven by an improvement in our home price outlook.
The PCI valuation allowance declined $1.0 billion during the three months ended March 31, 2013 due to $745 million and $94 million of write-offs in the home equity and residential mortgage PCI loan portfolios, and a provision benefit of $207 million for the PCI loan portfolio. Subsequent to the substantial fulfillment of the principal reduction commitments associated with the National Mortgage Settlement, we reviewed certain PCI loans that were ineligible for the program but had similar characteristics as the eligible PCI loans. Based on this review, we updated our estimates as to the likelihood of any proceeds being received from the ineligible PCI loans and wrote off the loans where the expectation of future cash proceeds is now considered remote.
Additional information on the PCI residential mortgage and home equity portfolios is provided in the following sections.
84
Purchased Credit-impaired Residential Mortgage Loan Portfolio
The PCI residential mortgage loan portfolio comprised 74 percent of the total PCI loan portfolio at March 31, 2013. Those loans to borrowers with a refreshed FICO score below 620 represented 56 percent of the PCI residential mortgage loan portfolio at March 31, 2013. Loans with a refreshed LTV greater than 90 percent, after consideration of purchase accounting adjustments and the related valuation allowance, represented 46 percent of the PCI residential mortgage loan portfolio and 68 percent based on the unpaid principal balance at March 31, 2013. Table 32 presents outstandings net of purchase accounting adjustments and before the related valuation allowance, by certain state concentrations.
Table 32 | |||||||
Outstanding Purchased Credit-impaired Loan Portfolio – Residential Mortgage State Concentrations | |||||||
(Dollars in millions) |
March 31 2013 |
December 31 2012 |
|||||
California |
$ |
9,841 |
$ |
9,253 |
|||
Florida (1)
|
2,080 |
1,812 |
|||||
Virginia |
848 |
718 |
|||||
Maryland |
819 |
421 |
|||||
Texas |
503 |
204 |
|||||
Other U.S./Non-U.S. |
7,913 |
5,163 |
|||||
Total |
$ |
22,004 |
$ |
17,571 |
|||
(1) |
In this state, foreclosure requires a court order following a legal proceeding (judicial state). |
Pay option adjustable-rate mortgages (ARMs), which are included in the residential mortgage portfolio, have interest rates that adjust monthly and minimum required payments that adjust annually, subject to resetting if minimum payments are made and deferred interest limits are reached. Annual payment adjustments are subject to a 7.5 percent maximum change. To ensure that contractual loan payments are adequate to repay a loan, the fully-amortizing loan payment amount is re-established after the initial five- or 10-year period and again every five years thereafter. These payment adjustments are not subject to the 7.5 percent limit and may be substantial due to changes in interest rates and the addition of unpaid interest to the loan balance. Payment advantage ARMs have interest rates that are fixed for an initial period of five years. Payments are subject to reset if the minimum payments are made and deferred interest limits are reached. If interest deferrals cause a loan's principal balance to reach a certain level within the first 10 years of the life of the loan, the payment is reset to the interest-only payment; then at the 10-year point, the fully-amortizing payment is required.
The difference between the frequency of changes in a loan's interest rates and payments along with a limitation on changes in the minimum monthly payments of 7.5 percent per year can result in payments that are not sufficient to pay all of the monthly interest charges (i.e., negative amortization). Unpaid interest is added to the loan balance until the loan balance increases to a specified limit, which can be no more than 115 percent of the original loan amount, at which time a new monthly payment amount adequate to repay the loan over its remaining contractual life is established.
At March 31, 2013, the unpaid principal balance of pay option loans was $6.7 billion, with a carrying amount of $6.5 billion, including $5.9 billion of loans that were credit-impaired upon acquisition, and accordingly, the reserve is based on a life-of-loan loss estimate. The total unpaid principal balance of pay option loans with accumulated negative amortization was $4.2 billion including $260 million of negative amortization. For those borrowers who are making payments in accordance with their contractual terms, six percent and 10 percent at March 31, 2013 and December 31, 2012 elected to make only the minimum payment on pay option ARMs. We believe the majority of borrowers are now making scheduled payments primarily because the low rate environment has caused the fully indexed rates to be affordable to more borrowers. We continue to evaluate our exposure to payment resets on the acquired negative-amortizing loans including the PCI pay option loan portfolio and have taken into consideration in the evaluation several assumptions regarding this evaluation including prepayment and default rates. Of the loans in the pay option portfolio at March 31, 2013 that have not already experienced a payment reset, less than one percent are expected to reset before 2016, 17 percent are expected to reset in 2016 and seven percent are expected to reset thereafter. In addition, seven percent are expected to prepay and 68 percent are expected to default prior to being reset, most of which were severely delinquent as of March 31, 2013.
85
Purchased Credit-impaired Home Equity Loan Portfolio
The PCI home equity portfolio comprised 26 percent of the total PCI loan portfolio at March 31, 2013. Those loans with a refreshed FICO score below 620 represented 18 percent of the PCI home equity portfolio at March 31, 2013. Loans with a refreshed CLTV greater than 90 percent, after consideration of purchase accounting adjustments and the related valuation allowance, represented 74 percent of the PCI home equity portfolio and 75 percent based on the unpaid principal balance at March 31, 2013. Table 33 presents outstandings net of purchase accounting adjustments and before the related valuation allowance, by certain state concentrations.
Table 33 | |||||||
Outstanding Purchased Credit-impaired Loan Portfolio – Home Equity State Concentrations | |||||||
(Dollars in millions) |
March 31 2013 |
December 31 2012 |
|||||
California |
$ |
2,299 |
$ |
2,614 |
|||
Florida (1)
|
413 |
509 |
|||||
Virginia |
356 |
380 |
|||||
Arizona |
252 |
294 |
|||||
Colorado |
244 |
260 |
|||||
Other U.S./Non-U.S. |
4,096 |
4,490 |
|||||
Total |
$ |
7,660 |
$ |
8,547 |
|||
(1) |
In this state, foreclosure requires a court order following a legal proceeding (judicial state). |
U.S. Credit Card
The U.S. credit card portfolio is managed in CBB. Outstandings in the U.S. credit card portfolio at March 31, 2013 decreased $4.8 billion compared to December 31, 2012 due to a seasonal decline in retail transaction volume. For the three months ended March 31, 2013, net charge-offs decreased $384 million to $947 million compared to the same period in 2012 due to improvements in delinquencies and bankruptcies as a result of an improved economic environment, account management on higher risk accounts and the impact of higher credit quality originations. U.S. credit card loans 30 days or more past due and still accruing interest at March 31, 2013 decreased $238 million while loans 90 days or more past due and still accruing interest declined $77 million compared to December 31, 2012 as a result of the factors mentioned above that contributed to lower net charge-offs. Table 34 presents certain key credit statistics for the consumer U.S. credit card portfolio.
Table 34 | |||||||
U.S. Credit Card – Key Credit Statistics | |||||||
(Dollars in millions) |
March 31 2013 |
December 31 2012 |
|||||
Outstandings |
$ |
90,047 |
$ |
94,835 |
|||
Accruing past due 30 days or more |
2,510 |
2,748 |
|||||
Accruing past due 90 days or more |
1,360 |
1,437 |
|||||
Three Months Ended March 31 |
|||||||
2013 |
2012 |
||||||
Net charge-offs |
$ |
947 |
$ |
1,331 |
|||
Net charge-off ratios (1)
|
4.19 |
% |
5.44 |
% |
|||
(1) |
Net charge-off ratios are calculated as annualized net charge-offs divided by average outstanding loans. |
Unused lines of credit for U.S. credit card totaled $330.4 billion at March 31, 2013 compared to $335.5 billion at December 31, 2012. The $5.1 billion decrease was driven by closure of inactive accounts and account management initiatives on higher risk accounts.
86
Table 35 presents certain state concentrations for the U.S. credit card portfolio.
Table 35 | |||||||||||||||||||||||
U.S. Credit Card State Concentrations | |||||||||||||||||||||||
Outstandings |
Accruing Past Due
90 Days or More
|
Net Charge-offs |
|||||||||||||||||||||
March 31 2013 |
December 31 2012 |
March 31 2013 |
December 31 2012 |
Three Months Ended March 31 |
|||||||||||||||||||
(Dollars in millions) |
2013 |
2012 |
|||||||||||||||||||||
California |
$ |
13,446 |
$ |
14,101 |
$ |
217 |
$ |
235 |
$ |
162 |
$ |
243 |
|||||||||||
Florida |
7,137 |
7,469 |
136 |
149 |
103 |
151 |
|||||||||||||||||
Texas |
6,181 |
6,448 |
86 |
92 |
61 |
82 |
|||||||||||||||||
New York |
5,448 |
5,746 |
95 |
91 |
60 |
77 |
|||||||||||||||||
New Jersey |
3,743 |
3,959 |
68 |
60 |
39 |
53 |
|||||||||||||||||
Other U.S. |
54,092 |
57,112 |
758 |
810 |
522 |
725 |
|||||||||||||||||
Total U.S. credit card portfolio |
$ |
90,047 |
$ |
94,835 |
$ |
1,360 |
$ |
1,437 |
$ |
947 |
$ |
1,331 |
|||||||||||
Non-U.S. Credit Card
Outstandings in the non-U.S. credit card portfolio, which are recorded in All Other, at March 31, 2013 decreased $1.1 billion compared to December 31, 2012 due to a weakening of the British Pound against the U.S. Dollar and a seasonal decline in retail transaction volume. For the three months ended March 31, 2013, net charge-offs decreased $91 million to $112 million compared to the same period in 2012 due primarily to improvement in delinquencies as a result of higher credit quality originations and portfolio sales.
Unused lines of credit for non-U.S. credit card at March 31, 2013 decreased $2.6 billion to $29.6 billion compared to December 31, 2012 driven by a weakening of the British Pound against the U.S. Dollar.
Table 36 presents certain key credit statistics for the non-U.S. credit card portfolio.
Table 36 | |||||||
Non-U.S. Credit Card – Key Credit Statistics | |||||||
(Dollars in millions) |
March 31 2013 |
December 31 2012 |
|||||
Outstandings |
$ |
10,620 |
$ |
11,697 |
|||
Accruing past due 30 days or more |
337 |
403 |
|||||
Accruing past due 90 days or more |
181 |
212 |
|||||
Three Months Ended March 31 |
|||||||
2013 |
2012 |
||||||
Net charge-offs |
$ |
112 |
$ |
203 |
|||
Net charge-off ratios (1)
|
4.14 |
% |
5.78 |
% |
|||
(1) |
Net charge-off ratios are calculated as annualized net charge-offs divided by average outstanding loans and leases. |
87
Direct/Indirect Consumer
At March 31, 2013, approximately 44 percent of the direct/indirect portfolio was included in Global Banking (dealer financial services - automotive, marine, aircraft and recreational vehicle loans), 40 percent was included in GWIM (principally securities-based lending margin loans and unsecured personal loans), five percent was included in CBB (consumer personal loans) and the remainder was in All Other (the GWIM International Wealth Management (IWM) businesses based outside of the U.S. and student loans).
Outstanding loans and leases at March 31, 2013 decreased $1.7 billion compared to December 31, 2012 due to a loan sale within securities-based lending (in connection with the Corporation's agreement to sell the IWM businesses) and lower outstandings in the unsecured consumer lending portfolio. For the three months ended March 31, 2013, net charge-offs decreased $102 million to $124 million, or 0.61 percent of total average direct/indirect loans compared to 1.03 percent for the same period in 2012. This decrease was primarily driven by improvements in delinquencies and bankruptcies in the unsecured consumer lending portfolio as a result of an improved economic environment as well as reduced outstandings.
For the three months ended March 31, 2013, net charge-offs in the unsecured consumer lending portfolio decreased $87 million to $70 million, or 6.43 percent of total average unsecured consumer lending loans compared to 8.31 percent for the same period in 2012. Direct/indirect loans that were past due 30 days or more and still accruing interest declined $194 million to $1.2 billion at March 31, 2013 compared to December 31, 2012 due to improvements in the unsecured consumer lending, dealer financial services and student lending portfolios.
Table 37 presents certain state concentrations for the direct/indirect consumer loan portfolio.
Table 37 | |||||||||||||||||||||||
Direct/Indirect State Concentrations | |||||||||||||||||||||||
Outstandings |
Accruing Past Due
90 Days or More
|
Net Charge-offs |
|||||||||||||||||||||
March 31 2013 |
December 31 2012 |
March 31 2013 |
December 31 2012 |
Three Months Ended March 31 |
|||||||||||||||||||
(Dollars in millions) |
2013 |
2012 |
|||||||||||||||||||||
California |
$ |
10,403 |
$ |
10,793 |
$ |
45 |
$ |
53 |
$ |
14 |
$ |
31 |
|||||||||||
Florida |
7,504 |
7,363 |
30 |
37 |
13 |
25 |
|||||||||||||||||
Texas |
7,295 |
7,239 |
37 |
41 |
12 |
18 |
|||||||||||||||||
New York |
4,687 |
4,794 |
24 |
28 |
7 |
12 |
|||||||||||||||||
Georgia |
2,458 |
2,491 |
28 |
31 |
5 |
9 |
|||||||||||||||||
Other U.S./Non-U.S. |
49,171 |
50,525 |
330 |
355 |
73 |
131 |
|||||||||||||||||
Total direct/indirect loan portfolio |
$ |
81,518 |
$ |
83,205 |
$ |
494 |
$ |
545 |
$ |
124 |
$ |
226 |
|||||||||||
Other Consumer
At March 31, 2013, approximately 80 percent of the $1.7 billion other consumer portfolio was associated with certain consumer finance businesses that we previously exited and non-U.S. consumer loan portfolios that are included in All Other. The remainder is primarily deposit overdrafts included in CBB.
Consumer Loans Accounted for Under the Fair Value Option
Outstanding consumer loans accounted for under the fair value option were comprised entirely of residential mortgage loans in consolidated variable interest entities of $1.0 billion at March 31, 2013. During the three months ended March 31, 2013, we recorded net gains of $36 million resulting from changes in the fair value of the loan portfolio. These were offset by net losses recorded on the related long-term debt.
88
Nonperforming Consumer Loans and Foreclosed Properties Activity
Table 38 presents nonperforming consumer loans and foreclosed properties activity for the three months ended March 31, 2013 and 2012. Nonperforming LHFS are excluded from nonperforming loans as they are recorded at either fair value or the lower of cost or fair value. Nonperforming loans do not include past due consumer credit card loans, other unsecured loans and in general, consumer non-real estate-secured loans (excluding those loans discharged in Chapter 7 bankruptcy), as these loans are typically charged off no later than the end of the month in which the loan becomes 180 days past due. The charge-offs on these loans have no impact on nonperforming activity and accordingly are excluded from Table 38. The fully-insured loan portfolio is not reported as nonperforming as principal repayment is insured. Additionally, nonperforming loans do not include the PCI loan portfolio or loans accounted for under the fair value option. For further information on nonperforming loans, see Note 1 – Summary of Significant Accounting Principles to the Consolidated Financial Statements of the Corporation's 2012 Annual Report on Form 10-K. During the three months ended March 31, 2013, nonperforming loans decreased $149 million to $19.3 billion as outflows outpaced new inflows which continued to improve due to favorable delinquency trends.
The outstanding balance of a real estate-secured loan that is in excess of the estimated property value less costs to sell, is charged off no later than the end of the month in which the loan becomes 180 days past due unless repayment of the loan is fully insured. At March 31, 2013, $10.1 billion, or 51 percent of nonperforming consumer real estate loans and foreclosed properties had been written down to their estimated property value less costs to sell, including $9.4 billion of nonperforming loans 180 days or more past due and $620 million of foreclosed properties. In addition, at March 31, 2013, $6.4 billion of nonperforming loans, or 33 percent of nonperforming consumer loans were modified and are now current after successful trial periods, or are current loans classified as nonperforming loans due to regulatory guidance issued in 2012. For additional information on regulatory guidance issued in 2012, see Consumer Portfolio Credit Risk Management on page 80 of the MD&A of the Corporation's 2012 Annual Report on Form 10-K.
Foreclosed properties decreased $30 million during the three months ended March 31, 2013 as liquidations outpaced additions. PCI loans are excluded from nonperforming loans as these loans were written down to fair value at the acquisition date; however, once the underlying real estate is acquired by the Corporation upon foreclosure of the delinquent PCI loan, it is included in foreclosed properties. PCI related foreclosed properties increased $47 million during the three months ended March 31, 2013. Not included in foreclosed properties at March 31, 2013 was $2.3 billion of real estate that was acquired upon foreclosure of delinquent FHA-insured loans. We hold this real estate on our balance sheet until we convey these properties to the FHA. We exclude these amounts from our nonperforming loans and foreclosed properties activity as we will be reimbursed once the property is conveyed to the FHA for principal and, up to certain limits, costs incurred during the foreclosure process and interest incurred during the holding period. For additional information on the review of our foreclosure processes, see Off-Balance Sheet Arrangements and Contractual Obligations – Servicing Matters and Foreclosure Processes on page 52.
Restructured Loans
Nonperforming loans also include certain loans that have been modified in TDRs where economic concessions have been granted to borrowers experiencing financial difficulties. These concessions typically result from the Corporation's loss mitigation activities and could include reductions in the interest rate, payment extensions, forgiveness of principal, forbearance or other actions. Certain TDRs are classified as nonperforming at the time of restructuring and may only be returned to performing status after considering the borrower's sustained repayment performance for a reasonable period, generally six months. Nonperforming TDRs, excluding those modified loans in the PCI loan portfolio, are included in Table 38.
89
Table 38 | |||||||
Nonperforming Consumer Loans and Foreclosed Properties Activity (1)
| |||||||
Three Months Ended March 31 |
|||||||
(Dollars in millions) |
2013 |
2012 |
|||||
Nonperforming loans, January 1 |
$ |
19,431 |
$ |
18,768 |
|||
Additions to nonperforming loans: |
|||||||
New nonperforming loans |
2,661 |
3,308 |
|||||
Implementation of regulatory interagency guidance (2)
|
n/a |
1,853 |
|||||
Reductions to nonperforming loans: |
|||||||
Paydowns and payoffs |
(680 |
) |
(1,153 |
) |
|||
Returns to performing status (3)
|
(943 |
) |
(913 |
) |
|||
Charge-offs |
(1,072 |
) |
(1,737 |
) |
|||
Transfers to foreclosed properties (4)
|
(115 |
) |
(402 |
) |
|||
Total net additions (reductions) to nonperforming loans |
(149 |
) |
956 |
||||
Total nonperforming loans, March 31 (5)
|
19,282 |
19,724 |
|||||
Foreclosed properties, January 1 (6)
|
650 |
1,991 |
|||||
Additions to foreclosed properties: |
|||||||
New foreclosed properties (4)
|
208 |
547 |
|||||
Reductions to foreclosed properties: |
|||||||
Sales |
(218 |
) |
(649 |
) |
|||
Write-downs |
(20 |
) |
(84 |
) |
|||
Total net reductions to foreclosed properties |
(30 |
) |
(186 |
) |
|||
Total foreclosed properties, March 31 |
620 |
1,805 |
|||||
Nonperforming consumer loans and foreclosed properties, March 31 |
$ |
19,902 |
$ |
21,529 |
|||
Nonperforming consumer loans as a percentage of outstanding consumer loans (7)
|
3.54 |
% |
3.36 |
% |
|||
Nonperforming consumer loans and foreclosed properties as a percentage of outstanding consumer loans and foreclosed properties (7)
|
3.65 |
3.65 |
|||||
(1) |
Balances do not include nonperforming LHFS of $672 million and $645 million and nonaccruing TDRs removed from the PCI loan portfolio prior to January 1, 2010 of $512 million and $459 million at March 31, 2013 and 2012 as well as loans accruing past due 90 days or more as presented in Table 24 and Note 5 – Outstanding Loans and Leases to the Consolidated Financial Statements.
|
(2) |
As a result of regulatory interagency guidance issued during 2012, we reclassified $1.9 billion of performing home equity loans (of which $1.6 billion were current) to nonperforming. For additional information on regulatory interagency guidance, see Consumer Portfolio Credit Risk Management on page 80 of the MD&A of the Corporation's 2012 Annual Report on Form 10-K.
|
(3) |
Consumer loans may be returned to performing status when all principal and interest is current and full repayment of the remaining contractual principal and interest is expected, or when the loan otherwise becomes well-secured and is in the process of collection. |
(4) |
New foreclosed properties represents transfers of nonperforming loans to foreclosed properties net of charge-offs taken during the first 90 days after transfer of a loan to foreclosed properties. New foreclosed properties also includes properties obtained upon foreclosure of delinquent PCI loans, properties repurchased due to representations and warranties exposure and properties acquired with newly consolidated subsidiaries. |
(5) |
At March 31, 2013, 49 percent of nonperforming loans were 180 days or more past due and were written down through charge-offs to 62 percent of their unpaid principal balance.
|
(6) |
Foreclosed property balances do not include loans that are insured by the FHA and have entered foreclosure of $2.3 billion and $1.1 billion at March 31, 2013 and 2012.
|
(7) |
Outstanding consumer loans exclude loans accounted for under the fair value option. |
n/a = not applicable
Our policy is to record any losses in the value of foreclosed properties as a reduction in the allowance for loan and lease losses during the first 90 days after transfer of a loan to foreclosed properties. Thereafter, further losses in value are recorded in noninterest expense. New foreclosed properties included in Table 38 are net of $41 million and $141 million of charge-offs for the three months ended March 31, 2013 and 2012, recorded during the first 90 days after transfer.
90
In accordance with regulatory guidance, we classify consumer real estate loans that have been discharged in Chapter 7 bankruptcy and not reaffirmed by the borrower as TDRs, irrespective of payment history or delinquency status, even if the repayment terms for the loan have not been otherwise modified. We continue to have a lien on the underlying collateral. At March 31, 2013, $4.1 billion of loans discharged in Chapter 7 bankruptcy with no change in repayment terms at the time of discharge were included in TDRs, of which $2.0 billion were classified as nonperforming and $2.1 billion were loans fully-insured by the FHA. Of the $4.1 billion of TDRs, approximately six percent, 38 percent and 56 percent were discharged in Chapter 7 bankruptcy during the three months ended March 31, 2013, for the year ended December 31, 2012 and in years prior to 2012, respectively. In addition, at March 31, 2013, of the $2.0 billion of nonperforming loans discharged in Chapter 7 bankruptcy, $961 million were current on their contractual payments while $917 million were 90 days or more past due. Of the contractually current nonperforming loans, more than 70 percent were discharged in Chapter 7 bankruptcy more than 12 months ago, and nearly 45 percent were discharged 24 months or more ago. As subsequent cash payments are received, the interest component of the payments is generally recorded as interest income on a cash basis and the principal component is recorded as a reduction in the carrying value of the loan. For more information on the impacts to consumer home loans TDRs, see Note 5 – Outstanding Loans and Leases to the Consolidated Financial Statements.
In accordance with bank regulatory interagency guidance, we classify junior-lien home equity loans as nonperforming when the first-lien loan becomes 90 days past due even if the junior-lien loan is performing. At March 31, 2012 and December 31, 2012, $1.4 billion and $1.5 billion of such loans were included in nonperforming loans.
Table 39 presents TDRs for the home loans portfolio. Performing TDR balances are excluded from nonperforming loans in Table 38.
Table 39 | |||||||||||||||||||||||
Home Loans Troubled Debt Restructurings | |||||||||||||||||||||||
March 31, 2013 |
December 31, 2012 |
||||||||||||||||||||||
(Dollars in millions) |
Total |
Nonperforming |
Performing |
Total |
Nonperforming |
Performing |
|||||||||||||||||
Residential mortgage (1, 2)
|
$ |
31,462 |
$ |
9,595 |
$ |
21,867 |
$ |
28,125 |
$ |
9,040 |
$ |
19,085 |
|||||||||||
Home equity (3)
|
2,119 |
1,259 |
860 |
2,125 |
1,242 |
883 |
|||||||||||||||||
Total home loans troubled debt restructurings |
$ |
33,581 |
$ |
10,854 |
$ |
22,727 |
$ |
30,250 |
$ |
10,282 |
$ |
19,968 |
|||||||||||
(1) |
Residential mortgage TDRs deemed collateral dependent totaled $9.7 billion and $9.4 billion, and included $6.9 billion and $6.4 billion of loans classified as nonperforming and $2.8 billion and $3.0 billion of loans classified as performing at March 31, 2013 and December 31, 2012.
|
(2) |
Residential mortgage performing TDRs included $14.6 billion and $11.9 billion of loans that were fully-insured at March 31, 2013 and December 31, 2012.
|
(3) |
Home equity TDRs deemed collateral dependent totaled $1.4 billion and included $1.0 billion of loans classified as nonperforming at both period ends, and $330 million and $348 million of loans classified as performing at March 31, 2013 and December 31, 2012.
|
We work with customers that are experiencing financial difficulty by modifying credit card and other consumer loans, while complying with Federal Financial Institutions Examination Council guidelines. Credit card and other consumer loan modifications generally involve a reduction in the consumer's interest rate on the account and placing the customer on a fixed payment plan not exceeding 60 months, all of which are considered TDRs (the renegotiated TDR portfolio). In addition, non-U.S. credit card modifications may involve reducing the interest rate on the account without placing the customer on a fixed payment plan, and are also considered TDRs (also a part of the renegotiated TDR portfolio). We make modifications primarily through internal renegotiation programs utilizing direct customer contact, but may also utilize external renegotiation programs. The renegotiated TDR portfolio is generally excluded from Table 38 as substantially all of the loans remain on accrual status until either charged off or paid in full. At March 31, 2013 and December 31, 2012, our renegotiated TDR portfolio was $3.3 billion and $3.9 billion, of which $2.6 billion and $3.1 billion were current or less than 30 days past due under the modified terms. The decline in the renegotiated TDR portfolio was primarily driven by paydowns and charge-offs as well as lower program enrollments. For more information on the renegotiated TDR portfolio, see Note 5 – Outstanding Loans and Leases to the Consolidated Financial Statements.
91
Commercial Portfolio Credit Risk Management |
Commercial credit risk is evaluated and managed with the goal that concentrations of credit exposure do not result in undesirable levels of risk. We review, measure and manage concentrations of credit exposure by industry, product, geography, customer relationship and loan size. We also review, measure and manage commercial real estate loans by geographic location and property type. In addition, within our international portfolio, we evaluate exposures by region and by country. Tables 44, 49, 56 and 57 summarize our concentrations. We also utilize syndications of exposure to third parties, loan sales, hedging and other risk mitigation techniques to manage the size and risk profile of the commercial credit portfolio.
For information on our accounting policies regarding delinquencies, nonperforming status and net charge-offs for the commercial portfolio, see Note 1 – Summary of Significant Accounting Principles to the Consolidated Financial Statements of the Corporation's 2012 Annual Report on Form 10-K.
Commercial Credit Portfolio |
Table 40 presents our commercial loans and leases, and related credit quality information at March 31, 2013 and December 31, 2012.
Table 40 | |||||||||||||||||||||||
Commercial Loans and Leases | |||||||||||||||||||||||
Outstandings |
Nonperforming |
Accruing Past Due 90 Days or More |
|||||||||||||||||||||
(Dollars in millions) |
March 31 2013 |
December 31 2012 |
March 31 2013 |
December 31 2012 |
March 31 2013 |
December 31 2012 |
|||||||||||||||||
U.S. commercial |
$ |
201,360 |
$ |
197,126 |
$ |
1,354 |
$ |
1,484 |
$ |
23 |
$ |
65 |
|||||||||||
Commercial real estate (1)
|
39,060 |
38,637 |
1,139 |
1,513 |
11 |
29 |
|||||||||||||||||
Commercial lease financing |
23,467 |
23,843 |
19 |
44 |
10 |
15 |
|||||||||||||||||
Non-U.S. commercial |
82,460 |
74,184 |
112 |
68 |
— |
— |
|||||||||||||||||
346,347 |
333,790 |
2,624 |
3,109 |
44 |
109 |
||||||||||||||||||
U.S. small business commercial (2)
|
12,402 |
12,593 |
110 |
115 |
116 |
120 |
|||||||||||||||||
Commercial loans excluding loans accounted for under the fair value option |
358,749 |
346,383 |
2,734 |
3,224 |
160 |
229 |
|||||||||||||||||
Loans accounted for under the fair value option (3)
|
7,779 |
7,997 |
11 |
11 |
— |
— |
|||||||||||||||||
Total commercial loans and leases |
$ |
366,528 |
$ |
354,380 |
$ |
2,745 |
$ |
3,235 |
$ |
160 |
$ |
229 |
|||||||||||
(1) |
Includes U.S. commercial real estate loans of $37.6 billion and $37.2 billion and non-U.S. commercial real estate loans of $1.4 billion and $1.5 billion at March 31, 2013 and December 31, 2012.
|
(2) |
Includes card-related products. |
(3) |
Commercial loans accounted for under the fair value option include U.S. commercial loans of $2.1 billion and $2.3 billion at March 31, 2013 and December 31, 2012, and non-U.S. commercial loans of $5.7 billion at both periods. See Note 17 – Fair Value Option to the Consolidated Financial Statements for additional information on the fair value option.
|
Outstanding commercial loans and leases increased $12.1 billion during the three months ended March 31, 2013 primarily in the non-U.S. commercial and U.S. commercial product types. During the three months ended March 31, 2013, credit quality in the commercial loan portfolio continued to show improvement. Reservable criticized balances and nonperforming loans, leases and foreclosed property balances declined during the three months ended March 31, 2013, with the declines primarily in the commercial real estate portfolio. Commercial real estate continued to show improvement in both the residential and non-residential portfolios. Most other credit indicators across the remaining commercial portfolios also improved. The allowance for loan and lease losses was relatively unchanged compared to December 31, 2012 as continued improvement in credit quality was offset by loan growth across the core commercial portfolio (total commercial products excluding U.S. small business). For more information, see Allowance for Credit Losses on page 108.
Nonperforming commercial loans and leases as a percentage of outstanding commercial loans and leases improved during the three months ended March 31, 2013 to 0.75 percent from 0.91 percent (0.76 percent and 0.93 percent excluding loans accounted for under the fair value option) at December 31, 2012. Accruing commercial loans and leases past due 90 days or more as a percentage of outstanding commercial loans and leases was 0.04 percent and 0.06 percent at March 31, 2013 and December 31, 2012.
92
Table 41 presents net charge-offs and related ratios for our commercial loans and leases for the three months ended March 31, 2013 and 2012. Improving portfolio trends drove lower charge-offs across the portfolio.
Table 41 |
|||||||||||||
Commercial Net Charge-offs and Related Ratios |
|||||||||||||
Three Months Ended March 31 |
|||||||||||||
Net Charge-offs |
Net Charge-off Ratios (1)
|
||||||||||||
(Dollars in millions) |
2013 |
2012 |
2013 |
2012 |
|||||||||
U.S. commercial |
$ |
45 |
$ |
66 |
0.09 |
% |
0.15 |
% |
|||||
Commercial real estate |
93 |
132 |
0.96 |
1.36 |
|||||||||
Commercial lease financing |
(10 |
) |
(9 |
) |
(0.18 |
) |
(0.16 |
) |
|||||
Non-U.S. commercial |
(15 |
) |
(5 |
) |
(0.08 |
) |
(0.04 |
) |
|||||
113 |
184 |
0.14 |
0.25 |
||||||||||
U.S. small business commercial |
102 |
185 |
3.33 |
5.63 |
|||||||||
Total commercial |
$ |
215 |
$ |
369 |
0.25 |
0.48 |
|||||||
(1) |
Net charge-off ratios are calculated as annualized net charge-offs divided by average outstanding loans and leases excluding loans accounted for under the fair value option. |
Table 42 presents commercial credit exposure by type for utilized, unfunded and total binding committed credit exposure. Commercial utilized credit exposure includes standby letters of credit (SBLCs) and financial guarantees, bankers' acceptances and commercial letters of credit for which we are legally bound to advance funds under prescribed conditions, during a specified period. Although funds have not yet been advanced, these exposure types are considered utilized for credit risk management purposes. Total commercial committed credit exposure increased $5.0 billion during the three months ended March 31, 2013 primarily driven by increases in loans, partially offset by decreases in LHFS, SBLCs and financial guarantees, and derivative assets.
Total commercial utilized credit exposure increased $8.6 billion during the three months ended March 31, 2013 primarily driven by increases in loans partially offset by small decreases in nearly all other categories. The utilization rate for loans and leases, SBLCs and financial guarantees, commercial letters of credit and bankers' acceptances was 59 percent and 58 percent at March 31, 2013 and December 31, 2012.
Table 42 | |||||||||||||||||||||||
Commercial Credit Exposure by Type | |||||||||||||||||||||||
Commercial Utilized (1)
|
Commercial Unfunded (2, 3)
|
Total Commercial Committed |
|||||||||||||||||||||
(Dollars in millions) |
March 31 2013 |
December 31 2012 |
March 31 2013 |
December 31 2012 |
March 31 2013 |
December 31 2012 |
|||||||||||||||||
Loans and leases |
$ |
366,528 |
$ |
354,380 |
$ |
281,857 |
$ |
281,915 |
$ |
648,385 |
$ |
636,295 |
|||||||||||
Derivative assets (4)
|
52,247 |
53,497 |
— |
— |
52,247 |
53,497 |
|||||||||||||||||
Standby letters of credit and financial guarantees |
39,839 |
41,036 |
1,539 |
2,119 |
41,378 |
43,155 |
|||||||||||||||||
Debt securities and other investments |
9,720 |
10,937 |
7,456 |
6,914 |
17,176 |
17,851 |
|||||||||||||||||
Loans held-for-sale |
8,389 |
7,928 |
209 |
3,763 |
8,598 |
11,691 |
|||||||||||||||||
Commercial letters of credit |
2,097 |
2,065 |
611 |
564 |
2,708 |
2,629 |
|||||||||||||||||
Bankers' acceptances |
315 |
185 |
2 |
3 |
317 |
188 |
|||||||||||||||||
Foreclosed properties and other (5)
|
1,146 |
1,699 |
— |
— |
1,146 |
1,699 |
|||||||||||||||||
Total |
$ |
480,281 |
$ |
471,727 |
$ |
291,674 |
$ |
295,278 |
$ |
771,955 |
$ |
767,005 |
|||||||||||
(1) |
Total commercial utilized exposure at March 31, 2013 and December 31, 2012 includes loans outstanding of $7.8 billion and $8.0 billion and commercial letters of credit with a notional value of $567 million and $672 million accounted for under the fair value option.
|
(2) |
Total commercial unfunded exposure at March 31, 2013 and December 31, 2012 includes loan commitments with a notional value of $15.1 billion and $17.6 billion accounted for under the fair value option.
|
(3) |
Excludes unused business card lines which are not legally binding. |
(4) |
Derivative assets are carried at fair value, reflect the effects of legally enforceable master netting agreements and have been reduced by cash collateral of $57.7 billion and $58.1 billion at March 31, 2013 and December 31, 2012. Not reflected in utilized and committed exposure is additional derivative collateral held of $18.0 billion and $18.7 billion which consists primarily of other marketable securities.
|
(5) |
Includes $813 million and $1.3 billion of monoline exposure at March 31, 2013 and December 31, 2012, as discussed in Commercial Portfolio Credit Risk Management – Monoline Exposure on page 100.
|
93
Table 43 presents commercial utilized reservable criticized exposure by product type. Criticized exposure corresponds to the Special Mention, Substandard and Doubtful asset categories as defined by regulatory authorities. Total commercial utilized reservable criticized exposure decreased $930 million, or six percent, during the three months ended March 31, 2013 primarily in commercial real estate and non-U.S. commercial product types driven largely by continued paydowns, upgrades, charge-offs and sales outpacing downgrades. At March 31, 2013, approximately 84 percent of commercial utilized reservable criticized exposure was secured compared to 82 percent at December 31, 2012.
Table 43 | |||||||||||||
Commercial Utilized Reservable Criticized Exposure | |||||||||||||
March 31, 2013 |
December 31, 2012 |
||||||||||||
(Dollars in millions) |
Amount (1)
|
Percent (2)
|
Amount (1)
|
Percent (2)
|
|||||||||
U.S. commercial |
$ |
8,680 |
3.70 |
% |
$ |
8,631 |
3.72 |
% |
|||||
Commercial real estate |
3,048 |
7.37 |
3,782 |
9.24 |
|||||||||
Commercial lease financing |
957 |
4.08 |
969 |
4.06 |
|||||||||
Non-U.S. commercial |
1,417 |
1.60 |
1,614 |
2.02 |
|||||||||
14,102 |
3.63 |
14,996 |
3.98 |
||||||||||
U.S. small business commercial |
904 |
7.28 |
940 |
7.45 |
|||||||||
Total commercial utilized reservable criticized exposure |
$ |
15,006 |
3.75 |
$ |
15,936 |
4.10 |
|||||||
(1) |
Total commercial utilized reservable criticized exposure at March 31, 2013 and December 31, 2012 includes loans and leases of $13.8 billion and $14.6 billion and commercial letters of credit of $1.2 billion and $1.3 billion.
|
(2) |
Percentages are calculated as commercial utilized reservable criticized exposure divided by total commercial utilized reservable exposure for each exposure category. |
U.S. Commercial
At March 31, 2013, 62 percent of the U.S. commercial loan portfolio, excluding small business, was managed in Global Banking, 16 percent in Global Markets, nine percent in CBB and the remainder primarily in GWIM (business-purpose loans for wealthy clients). U.S. commercial loans, excluding loans accounted for under the fair value option, increased $4.2 billion, or two percent, during the three months ended March 31, 2013 primarily due to increased client financing activity and growth in our large corporate portfolio. Nonperforming loans and leases decreased $130 million during the three months ended March 31, 2013. The declines were broad-based with respect to clients and industries, driven by improved client credit profiles and liquidity. Net charge-offs decreased $21 million for the three months ended March 31, 2013 compared to the same period in 2012 primarily due to lower gross charge-offs.
Commercial Real Estate
The commercial real estate portfolio is predominantly managed in Global Banking and consists of loans made primarily to public and private developers, and commercial real estate firms. Outstanding loans increased $423 million, or one percent, during the three months ended March 31, 2013 due to new originations and renewals.
The portfolio remains diversified across property types and geographic regions. California represented the largest state concentration at 23 percent of commercial real estate loans and leases at both March 31, 2013 and December 31, 2012.
Nonperforming commercial real estate loans and foreclosed properties decreased $418 million, or 24 percent, during the three months ended March 31, 2013 primarily in the non-residential portfolio. Reservable criticized balances decreased $734 million, or 19 percent, primarily due to declines in the non-residential portfolio. Net charge-offs decreased $39 million for the three months ended March 31, 2013 compared to the same period in 2012 due to improvement in the non-residential portfolio.
94
Table 44 presents outstanding commercial real estate loans by geographic region, based on the geographic location of the collateral, and by property type. Commercial real estate primarily includes commercial loans and leases secured by non-owner-occupied real estate and is dependent on the sale or lease of the real estate as the primary source of repayment.
Table 44 | |||||||
Outstanding Commercial Real Estate Loans | |||||||
(Dollars in millions) |
March 31 2013 |
December 31 2012 |
|||||
By Geographic Region |
|||||||
California |
$ |
9,111 |
$ |
8,792 |
|||
Northeast |
7,255 |
7,315 |
|||||
Southwest |
4,933 |
4,612 |
|||||
Southeast |
4,506 |
4,440 |
|||||
Midwest |
3,132 |
3,421 |
|||||
Florida |
2,163 |
2,148 |
|||||
Midsouth |
2,028 |
1,980 |
|||||
Northwest |
1,714 |
1,553 |
|||||
Illinois |
1,612 |
1,700 |
|||||
Non-U.S. |
1,415 |
1,483 |
|||||
Other (1)
|
1,191 |
1,193 |
|||||
Total outstanding commercial real estate loans |
$ |
39,060 |
$ |
38,637 |
|||
By Property Type |
|||||||
Non-residential |
|||||||
Office |
$ |
9,642 |
$ |
9,324 |
|||
Multi-family rental |
6,431 |
5,893 |
|||||
Shopping centers/retail |
6,088 |
5,780 |
|||||
Industrial/warehouse |
3,592 |
3,839 |
|||||
Hotels/motels |
3,151 |
3,095 |
|||||
Multi-use |
1,959 |
2,186 |
|||||
Land and land development |
1,017 |
1,157 |
|||||
Other |
5,592 |
5,722 |
|||||
Total non-residential |
37,472 |
36,996 |
|||||
Residential |
1,588 |
1,641 |
|||||
Total outstanding commercial real estate loans |
$ |
39,060 |
$ |
38,637 |
|||
(1) |
Includes unsecured loans to real estate investment trusts and national home builders whose portfolios of properties span multiple geographic regions and properties in the states of Colorado, Utah, Hawaii, Wyoming and Montana. |
For the three months ended March 31, 2013, we continued to see improvements in the credit quality in both the residential and non-residential portfolios. We use a number of proactive risk mitigation initiatives to reduce utilized and potential exposure in the commercial real estate portfolios including ongoing refinement of our credit standards, additional transfers of deteriorating exposures to management by independent special asset officers and the pursuit of loan restructurings or asset sales to achieve the best results for our customers and the Corporation.
95
Tables 45 and 46 present commercial real estate credit quality data by non-residential and residential property types. The residential portfolio presented in Tables 44, 45 and 46 includes condominiums and other residential real estate. Other property types in Tables 44, 45 and 46 primarily include special purpose, nursing/retirement homes, medical facilities and restaurants, as well as unsecured loans to borrowers whose primary business is commercial real estate.
Table 45 | |||||||||||||||
Commercial Real Estate Credit Quality Data | |||||||||||||||
|
Nonperforming Loans and
Foreclosed Properties (1)
|
Utilized Reservable
Criticized Exposure (2)
|
||||||||||||||
(Dollars in millions) |
March 31 2013 |
December 31 2012 |
March 31 2013 |
December 31 2012 |
|||||||||||
Non-residential |
|||||||||||||||
Office |
$ |
278 |
$ |
295 |
$ |
718 |
$ |
914 |
|||||||
Multi-family rental |
51 |
109 |
349 |
375 |
|||||||||||
Shopping centers/retail |
148 |
230 |
350 |
464 |
|||||||||||
Industrial/warehouse |
103 |
160 |
226 |
324 |
|||||||||||
Hotels/motels |
26 |
45 |
163 |
202 |
|||||||||||
Multi-use |
95 |
123 |
267 |
309 |
|||||||||||
Land and land development |
271 |
321 |
298 |
359 |
|||||||||||
Other |
65 |
87 |
233 |
301 |
|||||||||||
Total non-residential |
1,037 |
1,370 |
2,604 |
3,248 |
|||||||||||
Residential |
308 |
393 |
444 |
534 |
|||||||||||
Total commercial real estate |
$ |
1,345 |
$ |
1,763 |
$ |
3,048 |
$ |
3,782 |
|||||||
(1) |
Includes commercial foreclosed properties of $206 million and $250 million at March 31, 2013 and December 31, 2012.
|
(2) |
Includes loans, SBLCs and bankers' acceptances and excludes loans accounted for under the fair value option. |
Table 46 | |||||||||||||
Commercial Real Estate Net Charge-offs and Related Ratios | |||||||||||||
Three Months Ended March 31 |
|||||||||||||
Net Charge-offs |
Net Charge-off Ratios (1)
|
||||||||||||
(Dollars in millions) |
2013 |
2012 |
2013 |
2012 |
|||||||||
Non-residential |
|||||||||||||
Office |
$ |
28 |
$ |
60 |
1.18 |
% |
3.23 |
% |
|||||
Multi-family rental |
1 |
4 |
0.09 |
0.28 |
|||||||||
Shopping centers/retail |
10 |
8 |
0.69 |
0.56 |
|||||||||
Industrial/warehouse |
10 |
15 |
1.09 |
1.56 |
|||||||||
Hotels/motels |
5 |
1 |
0.69 |
0.15 |
|||||||||
Multi-use |
3 |
10 |
0.64 |
1.37 |
|||||||||
Land and land development |
12 |
6 |
4.48 |
1.47 |
|||||||||
Other |
2 |
8 |
0.02 |
0.48 |
|||||||||
Total non-residential |
71 |
112 |
0.76 |
1.22 |
|||||||||
Residential |
22 |
20 |
5.69 |
3.52 |
|||||||||
Total commercial real estate |
$ |
93 |
$ |
132 |
0.96 |
1.36 |
|||||||
(1) |
Net charge-off ratios are calculated as annualized net charge-offs divided by average outstanding loans excluding loans accounted for under the fair value option. |
At March 31, 2013, total committed non-residential exposure was $57.6 billion compared to $54.5 billion at December 31, 2012, of which $37.5 billion and $37.0 billion were funded secured loans. Non-residential nonperforming loans and foreclosed properties were $1.0 billion and $1.4 billion at March 31, 2013 and December 31, 2012, which represented 2.75 percent and 3.68 percent of total non-residential loans and foreclosed properties. The decline in nonperforming loans and foreclosed properties in the non-residential portfolio was driven by decreases in the shopping centers/retail, multi-family rental, industrial/warehouse, and land and land development property types. Non-residential utilized reservable criticized exposure decreased to $2.6 billion, or 6.56 percent of non-residential utilized reservable exposure, at March 31, 2013 compared to $3.2 billion, or 8.27 percent, at December 31, 2012 primarily driven by repayments and continued improvement in credit quality. The decrease in reservable criticized exposure was primarily in office, shopping centers/retail and industrial/
96
warehouse property types in the non-residential portfolio. For the non-residential portfolio, net charge-offs decreased $41 million for the three months ended March 31, 2013 compared to the same period in 2012 primarily due to improving appraisal values and overall improved borrower credit profiles.
Total committed residential exposure of $3.2 billion was unchanged compared to December 31, 2012 with $1.6 billion of funded secured loans at both period ends. Residential nonperforming loans and foreclosed properties decreased $85 million during three months ended March 31, 2013 due to repayments, sales and a decline in the volume of loans being downgraded to nonaccrual status, and net charge-offs. Residential utilized reservable criticized exposure decreased $90 million during the three months ended March 31, 2013 due to repayments and net charge-offs. The nonperforming loans, leases and foreclosed properties and the utilized reservable criticized ratios for the residential portfolio were 18.99 percent and 26.89 percent at March 31, 2013 compared to 23.33 percent and 31.56 percent at December 31, 2012. Net charge-offs for the residential portfolio remained relatively unchanged for the three months ended March 31, 2013 compared to the same period in 2012.
At both March 31, 2013 and December 31, 2012, the commercial real estate loan portfolio included $6.7 billion of funded construction and land development loans that were originated to fund the construction and/or rehabilitation of commercial properties. Reservable criticized construction and land development loans totaled $1.2 billion and $1.5 billion, and nonperforming construction and land development loans and foreclosed properties totaled $480 million and $730 million at March 31, 2013 and December 31, 2012. During a property's construction phase, interest income is typically paid from interest reserves that are established at the inception of the loan. As construction is completed and the property is put into service, these interest reserves are depleted and interest payments from operating cash flows begin. Loans generally continue to be classified as construction loans until operating cash flows reach appropriate levels or the loans are refinanced. We do not recognize interest income on nonperforming loans regardless of the existence of an interest reserve.
Non-U.S. Commercial
At March 31, 2013, 73 percent of the non-U.S. commercial loan portfolio was managed in Global Banking and 27 percent in Global Markets. Outstanding loans, excluding loans accounted for under the fair value option, increased $8.3 billion during the three months ended March 31, 2013 primarily due to increased corporate client demand and higher trade finance exposures. Net recoveries were $15 million for the three months ended March 31, 2013 compared to $5 million for the same period in 2012. For additional information on the non-U.S. commercial portfolio, see Non-U.S. Portfolio on page 104.
U.S. Small Business Commercial
The U.S. small business commercial loan portfolio is comprised of small business cards and small business loans managed in CBB. Card-related products were 46 percent and 45 percent of the U.S. small business commercial portfolio at March 31, 2013 and December 31, 2012. U.S. small business commercial net charge-offs decreased $83 million for the three months ended March 31, 2013 compared to the same period in 2012 driven by improvements in delinquencies and bankruptcies resulting from an improved economic environment as well as the reduction of higher risk vintages and the impact of higher credit quality originations. Of the U.S. small business commercial net charge-offs, 75 percent were credit card-related products for the three months ended March 31, 2013 compared to 66 percent for the same period in 2012.
Commercial Loans Accounted for Under the Fair Value Option
The portfolio of commercial loans accounted for under the fair value option is managed primarily in Global Banking. Outstanding commercial loans accounted for under the fair value option decreased $218 million to an aggregate fair value of $7.8 billion at March 31, 2013 compared to December 31, 2012 primarily due to decreased corporate borrowings under bank credit facilities. We recorded net gains of $46 million during the three months ended March 31, 2013 compared to $128 million for the same period in 2012 resulting from changes in the fair value of the loan portfolio. These amounts were primarily attributable to changes in instrument-specific credit risk, were recorded in other loss and do not reflect the results of hedging activities.
In addition, unfunded lending commitments and letters of credit accounted for under the fair value option had an aggregate fair value of $468 million and $528 million at March 31, 2013 and December 31, 2012 which was recorded in accrued expenses and other liabilities. The associated aggregate notional amount of unfunded lending commitments and letters of credit accounted for under the fair value option was $15.7 billion and $18.3 billion at March 31, 2013 and December 31, 2012. We recorded net gains of $65 million from changes in the fair value of commitments and letters of credit during the three months ended March 31, 2013 compared to $404 million for the same period in 2012 resulting from maturities and terminations at par value and changes in the fair value of the loan portfolio. These amounts were primarily attributable to changes in instrument-specific credit risk, were recorded in other loss and do not reflect the results of hedging activities.
97
Nonperforming Commercial Loans, Leases and Foreclosed Properties Activity
Table 47 presents the nonperforming commercial loans, leases and foreclosed properties activity during the three months ended March 31, 2013 and 2012. Nonperforming loans do not include loans accounted for under the fair value option. During the three months ended March 31, 2013, nonperforming commercial loans and leases decreased $490 million to $2.7 billion driven by paydowns, charge-offs, returns to performing status and sales outpacing new nonperforming loans. Approximately 93 percent of commercial nonperforming loans, leases and foreclosed properties are secured and approximately 45 percent are contractually current. Commercial nonperforming loans are carried at approximately 77 percent of their unpaid principal balance before consideration of the allowance for loan and lease losses as the carrying value of these loans has been reduced to the estimated property value less costs to sell.
Table 47 | |||||||
Nonperforming Commercial Loans, Leases and Foreclosed Properties Activity (1, 2)
| |||||||
Three Months Ended March 31 |
|||||||
(Dollars in millions) |
2013 |
2012 |
|||||
Nonperforming loans and leases, January 1 |
$ |
3,224 |
$ |
6,337 |
|||
Additions to nonperforming loans and leases: |
|||||||
New nonperforming loans and leases |
350 |
599 |
|||||
Advances |
6 |
24 |
|||||
Reductions to nonperforming loans and leases: |
|||||||
Paydowns |
(328 |
) |
(573 |
) |
|||
Sales |
(147 |
) |
(137 |
) |
|||
Returns to performing status (3)
|
(167 |
) |
(145 |
) |
|||
Charge-offs |
(177 |
) |
(291 |
) |
|||
Transfers to foreclosed properties (4)
|
(21 |
) |
(63 |
) |
|||
Transfers to loans held-for-sale |
(6 |
) |
— |
||||
Total net reductions to nonperforming loans and leases |
(490 |
) |
(586 |
) |
|||
Total nonperforming loans and leases, March 31 |
2,734 |
5,751 |
|||||
Foreclosed properties, January 1 |
250 |
612 |
|||||
Additions to foreclosed properties: |
|||||||
New foreclosed properties (4)
|
12 |
44 |
|||||
Reductions in foreclosed properties: |
|||||||
Sales |
(44 |
) |
(123 |
) |
|||
Write-downs |
(12 |
) |
(23 |
) |
|||
Total net reductions to foreclosed properties |
(44 |
) |
(102 |
) |
|||
Total foreclosed properties, March 31 |
206 |
510 |
|||||
Nonperforming commercial loans, leases and foreclosed properties, March 31 |
$ |
2,940 |
$ |
6,261 |
|||
Nonperforming commercial loans and leases as a percentage of outstanding commercial loans and leases (5)
|
0.76 |
% |
1.88 |
% |
|||
Nonperforming commercial loans, leases and foreclosed properties as a percentage of outstanding commercial loans, leases and foreclosed properties (5)
|
0.82 |
2.04 |
|||||
(1) |
Balances do not include nonperforming LHFS of $379 million and $847 million at March 31, 2013 and 2012.
|
(2) |
Includes U.S. small business commercial activity. Small business card loans are excluded as they are not classified as nonperforming. |
(3) |
Commercial loans and leases may be returned to performing status when all principal and interest is current and full repayment of the remaining contractual principal and interest is expected or when the loan otherwise becomes well-secured and is in the process of collection. TDRs are generally classified as performing after a sustained period of demonstrated payment performance. |
(4) |
New foreclosed properties represents transfers of nonperforming loans to foreclosed properties net of charge-offs recorded during the first 90 days after transfer of a loan to foreclosed properties. |
(5) |
Outstanding commercial loans exclude loans accounted for under the fair value option. |
98
Table 48 presents our commercial TDRs by product type and performing status. U.S. small business commercial TDRs are comprised of renegotiated small business card loans and are not classified as nonperforming as they are charged off no later than the end of the month in which the loan becomes 180 days past due. For additional information on TDRs, see Note 5 – Outstanding Loans and Leases to the Consolidated Financial Statements.
Table 48 | |||||||||||||||||||||||
Commercial Troubled Debt Restructurings | |||||||||||||||||||||||
March 31, 2013 |
December 31, 2012 |
||||||||||||||||||||||
(Dollars in millions) |
Total |
Non-performing |
Performing |
Total |
Non-performing |
Performing |
|||||||||||||||||
U.S. commercial |
$ |
1,319 |
$ |
562 |
$ |
757 |
$ |
1,328 |
$ |
565 |
$ |
763 |
|||||||||||
Commercial real estate |
1,294 |
656 |
638 |
1,391 |
740 |
651 |
|||||||||||||||||
Non-U.S. commercial |
97 |
15 |
82 |
100 |
15 |
85 |
|||||||||||||||||
U.S. small business commercial |
167 |
— |
167 |
202 |
— |
202 |
|||||||||||||||||
Total commercial troubled debt restructurings |
$ |
2,877 |
$ |
1,233 |
$ |
1,644 |
$ |
3,021 |
$ |
1,320 |
$ |
1,701 |
|||||||||||
Industry Concentrations |
Table 49 presents commercial committed and utilized credit exposure by industry and the total net credit default protection purchased to cover the funded and unfunded portions of certain credit exposures. Our commercial credit exposure is diversified across a broad range of industries. Total committed commercial credit exposure increased $5.0 billion, or one percent, during the three months ended March 31, 2013 to $772.0 billion. The increase in commercial committed exposure was concentrated in diversified financials, energy and retailing partially offset by lower exposure in food, beverage and tobacco, and government and public education.
Industry limits are used internally to manage industry concentrations and are based on committed exposures and capital usage that are allocated on an industry-by-industry basis. A risk management framework is in place to set and approve industry limits as well as to provide ongoing monitoring. Management's Credit Risk Committee (CRC) oversees industry limit governance.
Diversified financials, our largest industry concentration, experienced an increase in committed exposure of $5.9 billion, or six percent, during the three months ended March 31, 2013. The increase was primarily driven by higher funded loans and derivative exposure.
Real estate, our second largest industry concentration, with committed exposure of $65.9 billion, increased modestly by $216 million during the three months ended March 31, 2013. Real estate construction and land development exposure represented 15 percent of the total real estate industry committed exposure at March 31, 2013, up from 14 percent at December 31, 2012. For more information on commercial real estate and related portfolios, see Commercial Portfolio Credit Risk Management – Commercial Real Estate on page 94.
Committed exposure to the food, beverage and tobacco industry decreased $4.4 billion, or 12 percent, during the three months ended March 31, 2013. The decrease was primarily related to commitment reductions and paydowns. Government and public education committed exposure decreased $2.3 billion, or five percent, during the three months ended March 31, 2013 primarily driven by decreases in SBLCs and derivatives. Energy committed exposure increased $2.4 billion, or six percent, during the three months ended March 31, 2013 driven by higher non-U.S. integrated oil and gas, and exploration and production. Retailing committed exposure increased $2.0 billion, or four percent, during the three months ended March 31, 2013 primarily driven by loans to auto dealers and apparel retailers.
Our committed state and municipal exposure of $36.8 billion at March 31, 2013 consisted of $29.8 billion of commercial utilized exposure (including $17.7 billion of funded loans, $8.0 billion of SBLCs and $3.2 billion of derivative assets) and unfunded commercial exposure of $7.1 billion (primarily unfunded loan commitments and letters of credit) and is reported in the government and public education industry in Table 49. While the slow economic recovery continues to pressure budgets, most state and local governments have implemented offsetting fiscal adjustments and continue to honor debt obligations as agreed. While historical default rates have been low, as part of our overall and ongoing risk management processes, we continually monitor these exposures through a rigorous review process. Additionally, internal communications are regularly circulated such that exposure levels are maintained in compliance with established concentration guidelines.
99
Table 49 | |||||||||||||||
Commercial Credit Exposure by Industry (1)
| |||||||||||||||
|
Commercial
Utilized
|
Total Commercial
Committed
|
||||||||||||||
(Dollars in millions) |
March 31 2013 |
December 31 2012 |
March 31 2013 |
December 31 2012 |
|||||||||||
Diversified financials |
$ |
70,405 |
$ |
66,201 |
$ |
105,591 |
$ |
99,673 |
|||||||
Real estate (2)
|
47,513 |
47,479 |
65,855 |
65,639 |
|||||||||||
Retailing |
29,337 |
28,065 |
49,757 |
47,719 |
|||||||||||
Capital goods |
24,995 |
25,071 |
48,444 |
49,196 |
|||||||||||
Government and public education |
39,671 |
41,449 |
48,022 |
50,285 |
|||||||||||
Healthcare equipment and services |
29,107 |
29,396 |
45,556 |
45,488 |
|||||||||||
Banking |
37,895 |
40,245 |
43,383 |
45,238 |
|||||||||||
Materials |
22,243 |
21,809 |
42,264 |
40,493 |
|||||||||||
Energy |
21,167 |
17,684 |
40,853 |
38,464 |
|||||||||||
Consumer services |
22,193 |
23,093 |
35,195 |
36,367 |
|||||||||||
Food, beverage and tobacco |
14,909 |
14,738 |
32,936 |
37,344 |
|||||||||||
Commercial services and supplies |
18,345 |
19,020 |
29,861 |
30,257 |
|||||||||||
Utilities |
8,900 |
8,410 |
23,104 |
23,432 |
|||||||||||
Transportation |
15,606 |
13,791 |
21,968 |
20,255 |
|||||||||||
Media |
12,907 |
13,091 |
21,835 |
21,705 |
|||||||||||
Individuals and trusts |
14,107 |
13,916 |
18,166 |
17,801 |
|||||||||||
Insurance, including monolines |
6,800 |
8,519 |
12,503 |
14,145 |
|||||||||||
Software and services |
5,571 |
5,549 |
11,740 |
12,125 |
|||||||||||
Pharmaceuticals and biotechnology |
4,439 |
3,854 |
11,191 |
11,409 |
|||||||||||
Technology hardware and equipment |
4,735 |
5,118 |
10,761 |
11,108 |
|||||||||||
Telecommunication services |
3,689 |
4,029 |
10,191 |
10,297 |
|||||||||||
Consumer durables and apparel |
5,198 |
4,246 |
9,362 |
8,438 |
|||||||||||
Religious and social organizations |
6,235 |
6,850 |
8,435 |
9,107 |
|||||||||||
Automobiles and components |
3,349 |
3,312 |
7,702 |
7,675 |
|||||||||||
Food and staples retailing |
4,004 |
3,528 |
7,334 |
6,838 |
|||||||||||
Other |
6,961 |
3,264 |
9,946 |
6,507 |
|||||||||||
Total commercial credit exposure by industry |
$ |
480,281 |
$ |
471,727 |
$ |
771,955 |
$ |
767,005 |
|||||||
Net credit default protection purchased on total commitments (3)
|
$ |
(12,444 |
) |
$ |
(14,657 |
) |
|||||||||
(1) |
Includes U.S. small business commercial exposure. |
(2) |
Industries are viewed from a variety of perspectives to best isolate the perceived risks. For purposes of this table, the real estate industry is defined based on the borrowers' or counterparties' primary business activity using operating cash flows and primary source of repayment as key factors. |
(3) |
Represents net notional credit protection purchased. See Commercial Portfolio Credit Risk Management – Risk Mitigation on page 101 for additional information.
|
Monoline Exposure
Monoline exposure is reported in the insurance industry and managed under insurance portfolio industry limits. We have indirect exposure to monolines primarily in the form of guarantees supporting our loans, investment portfolios, securitizations and credit-enhanced securities as part of our public finance business and other selected products. Such indirect exposure exists when we purchase credit protection from monolines to hedge all or a portion of the credit risk on certain credit exposures including loans and CDOs. We underwrite our public finance exposure by evaluating the underlying securities.
We also have indirect exposure to monolines in the form of guarantees supporting our mortgage and other loan sales. Indirect exposure may exist when credit protection was purchased from monolines to hedge all or a portion of the credit risk on certain mortgage and other loan exposures. A loss may occur when we are required to repurchase a loan and the market value of the loan has declined, or we are required to indemnify or provide recourse for a guarantor's loss. For additional information regarding our exposure to representations and warranties, see Note 8 – Representations and Warranties Obligations and Corporate Guarantees to the Consolidated Financial Statements.
100
Table 50 presents the notional amount of our monoline derivative credit exposure, mark-to-market adjustment and the counterparty credit valuation adjustment. The notional amount of monoline exposure decreased $624 million during the three months ended March 31, 2013 due to terminations, paydowns and maturities of monoline contracts. Table 50 excludes $813 million and $1.3 billion of monoline exposure with MBIA ($4.8 billion and $4.9 billion gross receivable less impairment) that was included in other assets at March 31, 2013 and December 31, 2012. The receivable was effectively fully reserved at March 31, 2013 in connection with the MBIA Settlement. Of this $450 million decrease in the MBIA receivable, $300 million of the aforementioned fair value decrease was attributable to increased risk of MBIA going into rehabilitation or liquidation proceedings in the near term. These contracts are not considered to be derivative trading instruments because of the inherent default risk and they do not provide a hedge benefit. For additional information, see Recent Events – MBIA Settlement on page 6 and Global Markets – Sales and Trading Revenue on page 40.
Table 50 |
|||||||
Derivative Credit Exposures |
|||||||
(Dollars in millions) |
March 31 2013 |
December 31 2012 |
|||||
Notional amount of monoline exposure |
$ |
12,923 |
$ |
13,547 |
|||
Mark-to-market |
$ |
536 |
$ |
898 |
|||
Counterparty credit valuation adjustment |
(64 |
) |
(118 |
) |
|||
Net mark-to-market |
$ |
472 |
$ |
780 |
|||
Three Months Ended March 31 |
|||||||
2013 |
2012 |
||||||
Gains from credit valuation changes |
$ |
26 |
$ |
104 |
|||
Risk Mitigation |
We purchase credit protection to cover the funded portion as well as the unfunded portion of certain credit exposures. To lower the cost of obtaining our desired credit protection levels, credit exposure may be added within an industry, borrower or counterparty group by selling protection.
At March 31, 2013 and December 31, 2012, net notional credit default protection purchased in our credit derivatives portfolio to hedge our funded and unfunded exposures for which we elected the fair value option, as well as certain other credit exposures, was $12.4 billion and $14.7 billion. The mark-to-market effects resulted in net losses of $66 million for the three months ended March 31, 2013 compared to $493 million for the same period in 2012. The gains and losses related to these instruments were offset by gains and losses on the exposures. Table 51 presents the average VaR for these derivatives. See Trading Risk Management on page 113 for a description of our VaR calculation for the market-based trading portfolio.
Table 51 | |||||||
Credit Derivative Value-at-Risk | |||||||
Three Months Ended March 31 |
|||||||
(Dollars in millions) |
2013 |
2012 |
|||||
Average |
$ |
25 |
$ |
67 |
|||
Credit exposure average |
51 |
92 |
|||||
Combined average (1)
|
31 |
26 |
|||||
(1) |
Reflects the diversification effect between net credit default protection hedging our credit exposure and the related credit exposure. |
101
Tables 52 and 53 present the maturity profiles and the credit exposure debt ratings of the net credit default protection portfolio at March 31, 2013 and December 31, 2012.
Table 52 | |||||
Net Credit Default Protection by Maturity | |||||
March 31 2013 |
December 31 2012 |
||||
Less than or equal to one year |
26 |
% |
21 |
% |
|
Greater than one year and less than or equal to five years |
71 |
75 |
|||
Greater than five years |
3 |
4 |
|||
Total net credit default protection |
100 |
% |
100 |
% |
|
Table 53 | |||||||||||||
Net Credit Default Protection by Credit Exposure Debt Rating | |||||||||||||
(Dollars in millions) |
March 31, 2013 |
December 31, 2012 |
|||||||||||
Ratings (1, 2)
|
Net
Notional (3)
|
Percent of
Total
|
Net
Notional (3)
|
Percent of
Total
|
|||||||||
AAA |
$ |
(120 |
) |
1.0 |
% |
$ |
(120 |
) |
0.8 |
% |
|||
AA |
(412 |
) |
3.3 |
(474 |
) |
3.2 |
|||||||
A |
(4,951 |
) |
39.8 |
(5,861 |
) |
40.0 |
|||||||
BBB |
(5,133 |
) |
41.2 |
(6,067 |
) |
41.4 |
|||||||
BB |
(1,075 |
) |
8.6 |
(1,101 |
) |
7.5 |
|||||||
B |
(699 |
) |
5.6 |
(937 |
) |
6.4 |
|||||||
CCC and below |
(216 |
) |
1.7 |
(247 |
) |
1.7 |
|||||||
NR (4)
|
162 |
(1.2 |
) |
150 |
(1.0 |
) |
|||||||
Total net credit default protection |
$ |
(12,444 |
) |
100.0 |
% |
$ |
(14,657 |
) |
100.0 |
% |
|||
(1) |
Ratings are refreshed on a quarterly basis. |
(2) |
Ratings of BBB- or higher are considered to meet the definition of investment grade. |
(3) |
Represents net credit default protection (purchased) sold. |
(4) |
"NR" is comprised of names that have not been rated. |
In addition to our net notional credit default protection purchased to cover the funded and unfunded portion of certain credit exposures, credit derivatives are used for market-making activities for clients and establishing positions intended to profit from directional or relative value changes. We execute the majority of our credit derivative trades in the OTC market with large, multinational financial institutions, including broker/dealers and, to a lesser degree, with a variety of other investors. Because these transactions are executed in the OTC market, we are subject to settlement risk. We are also subject to credit risk in the event that these counterparties fail to perform under the terms of these contracts. In most cases, credit derivative transactions are executed on a daily margin basis. Therefore, events such as a credit downgrade, depending on the ultimate rating level, or a breach of credit covenants would typically require an increase in the amount of collateral required of the counterparty, where applicable, and/or allow us to take additional protective measures such as early termination of all trades.
102
Table 54 presents the total contract/notional amount of credit derivatives outstanding and includes both purchased and written credit derivatives. The credit risk amounts are measured as net asset exposure by counterparty, taking into consideration all contracts and collateral with that counterparty. The contract/notional amounts of both purchased and written credit derivatives increased as a result of increased client activity outpacing maturities. For information on our written credit derivatives, see Note 3 – Derivatives to the Consolidated Financial Statements.
The credit risk amounts discussed above and presented in Table 54 take into consideration the effects of legally enforceable master netting agreements while amounts disclosed in Note 3 – Derivatives to the Consolidated Financial Statements are shown on a gross basis. Credit risk reflects the potential benefit from offsetting exposure to non-credit derivative products with the same counterparties that may be netted upon the occurrence of certain events, thereby reducing our overall exposure.
Table 54 | |||||||||||||||
Credit Derivatives | |||||||||||||||
March 31, 2013 |
December 31, 2012 |
||||||||||||||
(Dollars in millions) |
Contract/
Notional
|
Credit Risk |
Contract/
Notional
|
Credit Risk |
|||||||||||
Purchased credit derivatives: |
|||||||||||||||
Credit default swaps |
$ |
1,610,724 |
$ |
8,204 |
$ |
1,559,472 |
$ |
8,987 |
|||||||
Total return swaps/other |
44,441 |
466 |
43,489 |
402 |
|||||||||||
Total purchased credit derivatives |
$ |
1,655,165 |
$ |
8,670 |
$ |
1,602,961 |
$ |
9,389 |
|||||||
Written credit derivatives: |
|||||||||||||||
Credit default swaps |
$ |
1,581,333 |
n/a |
$ |
1,531,504 |
n/a |
|||||||||
Total return swaps/other |
73,902 |
n/a |
68,811 |
n/a |
|||||||||||
Total written credit derivatives |
$ |
1,655,235 |
n/a |
$ |
1,600,315 |
n/a |
|||||||||
n/a = not applicable
Counterparty Credit Risk Valuation Adjustments |
We record counterparty credit risk valuation adjustments on certain derivative assets, including our credit default protection purchased, in order to properly reflect the credit risk of the counterparty. We calculate credit valuation adjustments (CVA) based on a modeled expected exposure that incorporates current market risk factors including changes in market spreads and non-credit related market factors that affect the value of a derivative. The exposure also takes into consideration credit mitigants such as legally enforceable master netting agreements and collateral. During the three months ended March 31, 2013, we refined our methodology for calculating CVA and DVA, on a prospective basis, to adjust the way we value mutual termination clauses in derivative contracts and to more fully incorporate the potential for the counterparties to default prior to a change in their credit ratings. This change in estimates increased CVA by $361 million and increased DVA by $433 million resulting in a net positive earnings impact of $72 million for the three months ended March 31, 2013. The net CVA and DVA excluding the impact of these refinements was a gain of $66 million and a loss of $54 million. The effect of this change in estimates is reflected in Table 55. For more information, see Note 3 – Derivatives to the Consolidated Financial Statements.
Table 55 | |||||||||||||||||||||||
Credit Valuation Gains and Losses | |||||||||||||||||||||||
Three Months Ended March 31 |
|||||||||||||||||||||||
2013 |
2012 |
||||||||||||||||||||||
(Dollars in millions) |
Gross |
Hedge |
Net |
Gross |
Hedge |
Net |
|||||||||||||||||
Credit valuation gains (losses) |
$ |
(131 |
) |
$ |
(164 |
) |
$ |
(295 |
) |
$ |
512 |
$ |
(362 |
) |
$ |
150 |
|||||||
103
Non-U.S. Portfolio |
Our non-U.S. credit and trading portfolios are subject to country risk. We define country risk as the risk of loss from unfavorable economic and political conditions, currency fluctuations, social instability and changes in government policies. A risk management framework is in place to measure, monitor and manage non-U.S. risk and exposures. Management oversight of country risk, including cross-border risk, is provided by the Country Credit Risk Committee, a subcommittee of the CRC. In addition to the direct risk of doing business in a country, we also are exposed to indirect country risks (for example, related to the collateral received on secured financing transactions or related to client clearing activities). These indirect exposures are managed in the normal course of business through credit, market and operational risk governance, rather than through country risk governance.
Non-U.S. exposure is presented on an internal risk management basis and includes sovereign and non-sovereign credit exposure, securities and other investments issued by or domiciled in countries other than the U.S. Risk assignments by country can be adjusted for external guarantees and certain collateral types. Exposures that are subject to external guarantees are reported under the country of the guarantor. Exposures with tangible collateral are reflected in the country where the collateral is held. For securities received, other than cross-border resale agreements, outstandings are assigned to the domicile of the issuer of the securities.
Funded loans and loan equivalents include loans, leases, and other extensions of credit and funds, including letters of credit and due from placements, which have not been reduced by collateral, hedges or credit default protection. Funded loans and loan equivalents are reported net of charge-offs but prior to any allowance for loan and lease losses. Unfunded commitments are the undrawn portion of legally binding commitments related to loans and loan equivalents.
Net counterparty exposure includes the fair value of derivatives, including the counterparty risk associated with CDS, and secured financing transactions. Derivative exposures are presented net of collateral, which is predominantly cash, pledged under legally enforceable netting agreements. Secured financing transaction exposures are presented net of eligible cash or securities pledged as collateral.
Securities and other investments are carried at fair value and long securities exposures are netted against short exposures with the same underlying issuer to, but not below, zero (i.e., negative issuer exposures are reported as zero). Other investments include our GPI portfolio and strategic investments.
Net country exposure represents country exposure less hedges and credit default protection purchased, net of credit default protection sold. We hedge certain of our country exposures with credit default protection primarily in the form of single-name, as well as indexed and tranched CDS. The exposures associated with these hedges represent the amount that would be realized upon the isolated default of an individual issuer in the relevant country assuming a zero recovery rate for that individual issuer, and are calculated based on the CDS notional amount less any fair value receivable or payable. Changes in the assumption of an isolated default can produce different results in a particular tranche.
104
Table 56 presents our 20 largest, non-U.S. country exposures. These exposures accounted for 88 percent of our total non-U.S. exposure at March 31, 2013 compared to 89 percent at December 31, 2012.
Table 56 | |||||||||||||||||||||||||||||||
Top 20 Non-U.S. Countries Exposure | |||||||||||||||||||||||||||||||
(Dollars in millions) |
Funded Loans and Loan Equivalents |
Unfunded Loan Commitments |
Net Counterparty Exposure |
Securities/
Other Investments
|
Country Exposure at March 31 2013 |
Hedges and Credit Default Protection |
Net Country Exposure at March 31 2013 |
Increase (Decrease) from December 31 2012 |
|||||||||||||||||||||||
United Kingdom |
$ |
26,266 |
$ |
10,666 |
$ |
5,173 |
$ |
7,539 |
$ |
49,644 |
$ |
(3,129 |
) |
$ |
46,515 |
$ |
(677 |
) |
|||||||||||||
Canada |
6,132 |
6,538 |
2,652 |
5,340 |
20,662 |
(1,411 |
) |
19,251 |
275 |
||||||||||||||||||||||
France |
3,233 |
6,101 |
1,358 |
5,898 |
16,590 |
(2,650 |
) |
13,940 |
(2,351 |
) |
|||||||||||||||||||||
Brazil |
8,739 |
460 |
248 |
4,135 |
13,582 |
(187 |
) |
13,395 |
892 |
||||||||||||||||||||||
India |
8,235 |
636 |
267 |
3,685 |
12,823 |
(223 |
) |
12,600 |
(1,118 |
) |
|||||||||||||||||||||
Germany |
6,919 |
5,377 |
2,860 |
1,750 |
16,906 |
(5,220 |
) |
11,686 |
666 |
||||||||||||||||||||||
China |
8,069 |
282 |
662 |
2,529 |
11,542 |
(1,003 |
) |
10,539 |
1,352 |
||||||||||||||||||||||
Australia |
4,781 |
3,310 |
665 |
2,172 |
10,928 |
(839 |
) |
10,089 |
360 |
||||||||||||||||||||||
Netherlands |
4,067 |
2,277 |
572 |
2,330 |
9,246 |
(1,173 |
) |
8,073 |
(2,609 |
) |
|||||||||||||||||||||
South Korea |
4,983 |
577 |
486 |
2,503 |
8,549 |
(1,090 |
) |
7,459 |
310 |
||||||||||||||||||||||
Japan |
4,396 |
466 |
820 |
2,944 |
8,626 |
(1,818 |
) |
6,808 |
(17,031 |
) |
|||||||||||||||||||||
Russian Federation |
5,861 |
288 |
58 |
771 |
6,978 |
(614 |
) |
6,364 |
1,452 |
||||||||||||||||||||||
Hong Kong |
4,636 |
612 |
150 |
1,026 |
6,424 |
(112 |
) |
6,312 |
869 |
||||||||||||||||||||||
Switzerland |
2,330 |
3,336 |
352 |
638 |
6,656 |
(747 |
) |
5,909 |
89 |
||||||||||||||||||||||
Singapore |
2,823 |
253 |
280 |
2,435 |
5,791 |
(154 |
) |
5,637 |
(4,537 |
) |
|||||||||||||||||||||
Italy |
3,386 |
2,640 |
1,944 |
321 |
8,291 |
(4,332 |
) |
3,959 |
(879 |
) |
|||||||||||||||||||||
Mexico |
2,392 |
711 |
208 |
930 |
4,241 |
(418 |
) |
3,823 |
164 |
||||||||||||||||||||||
Taiwan |
2,128 |
43 |
146 |
1,355 |
3,672 |
(15 |
) |
3,657 |
435 |
||||||||||||||||||||||
Turkey |
1,900 |
107 |
149 |
531 |
2,687 |
(16 |
) |
2,671 |
531 |
||||||||||||||||||||||
Spain |
2,534 |
956 |
177 |
299 |
3,966 |
(1,311 |
) |
2,655 |
1 |
||||||||||||||||||||||
Total top 20 non-U.S. countries exposure |
$ |
113,810 |
$ |
45,636 |
$ |
19,227 |
$ |
49,131 |
$ |
227,804 |
$ |
(26,462 |
) |
$ |
201,342 |
$ |
(21,806 |
) |
|||||||||||||
Certain European countries, including Greece, Ireland, Italy, Portugal and Spain, have experienced varying degrees of financial stress in recent years. Risks from the ongoing debt crisis in these countries could continue to disrupt the financial markets which could have a detrimental impact on global economic conditions and sovereign and non-sovereign debt in these countries. Market volatility is expected to continue as policymakers continue to try to address the fundamental challenges of competitiveness, growth and fiscal solvency. We expect to continue to support client activities in the region and our exposures may vary over time as we monitor the situation and manage our risk profile.
105
Table 57 presents our direct sovereign and non-sovereign exposures in these countries at March 31, 2013. Our total sovereign and non-sovereign exposure to these countries was $14.5 billion at both March 31, 2013 and December 31, 2012. The total exposure to these countries, net of all hedges, was $8.6 billion at March 31, 2013 compared to $9.5 billion at December 31, 2012. At March 31, 2013 and December 31, 2012, hedges and credit default protection purchased, net of credit default protection sold, was $5.9 billion and $5.1 billion.
Table 57 | |||||||||||||||||||||||||||||||
Select European Countries | |||||||||||||||||||||||||||||||
(Dollars in millions) |
Funded Loans and Loan Equivalents |
Unfunded Loan Commitments |
Net Counterparty Exposure (1)
|
Securities/ Other Investments (2)
|
Country Exposure at March 31 2013 |
Hedges and Credit Default Protection (3)
|
Net Country Exposure at March 31 2013 |
Increase (Decrease) from
December 31, 2012
|
|||||||||||||||||||||||
Greece |
|||||||||||||||||||||||||||||||
Sovereign |
$ |
— |
$ |
— |
$ |
— |
$ |
7 |
$ |
7 |
$ |
— |
$ |
7 |
$ |
5 |
|||||||||||||||
Financial institutions |
— |
— |
— |
7 |
7 |
(9 |
) |
(2 |
) |
3 |
|||||||||||||||||||||
Corporates |
64 |
117 |
13 |
6 |
200 |
(5 |
) |
195 |
(114 |
) |
|||||||||||||||||||||
Total Greece |
$ |
64 |
$ |
117 |
$ |
13 |
$ |
20 |
$ |
214 |
$ |
(14 |
) |
$ |
200 |
$ |
(106 |
) |
|||||||||||||
Ireland |
|||||||||||||||||||||||||||||||
Sovereign |
$ |
17 |
$ |
— |
$ |
26 |
$ |
62 |
$ |
105 |
$ |
(10 |
) |
$ |
95 |
$ |
37 |
||||||||||||||
Financial institutions |
357 |
30 |
255 |
38 |
680 |
(34 |
) |
646 |
54 |
||||||||||||||||||||||
Corporates |
597 |
257 |
28 |
50 |
932 |
(2 |
) |
930 |
1 |
||||||||||||||||||||||
Total Ireland |
$ |
971 |
$ |
287 |
$ |
309 |
$ |
150 |
$ |
1,717 |
$ |
(46 |
) |
$ |
1,671 |
$ |
92 |
||||||||||||||
Italy |
|||||||||||||||||||||||||||||||
Sovereign |
$ |
21 |
$ |
— |
$ |
1,638 |
$ |
10 |
$ |
1,669 |
$ |
(2,265 |
) |
$ |
(596 |
) |
$ |
(626 |
) |
||||||||||||
Financial institutions |
1,861 |
89 |
198 |
28 |
2,176 |
(778 |
) |
1,398 |
321 |
||||||||||||||||||||||
Corporates |
1,504 |
2,551 |
108 |
283 |
4,446 |
(1,289 |
) |
3,157 |
(574 |
) |
|||||||||||||||||||||
Total Italy |
$ |
3,386 |
$ |
2,640 |
$ |
1,944 |
$ |
321 |
$ |
8,291 |
$ |
(4,332 |
) |
$ |
3,959 |
$ |
(879 |
) |
|||||||||||||
Portugal |
|||||||||||||||||||||||||||||||
Sovereign |
$ |
— |
$ |
— |
$ |
26 |
$ |
35 |
$ |
61 |
$ |
(44 |
) |
$ |
17 |
$ |
54 |
||||||||||||||
Financial institutions |
6 |
— |
5 |
32 |
43 |
(18 |
) |
25 |
(13 |
) |
|||||||||||||||||||||
Corporates |
142 |
89 |
6 |
13 |
250 |
(149 |
) |
101 |
16 |
||||||||||||||||||||||
Total Portugal |
$ |
148 |
$ |
89 |
$ |
37 |
$ |
80 |
$ |
354 |
$ |
(211 |
) |
$ |
143 |
$ |
57 |
||||||||||||||
Spain |
|||||||||||||||||||||||||||||||
Sovereign |
$ |
34 |
$ |
— |
$ |
54 |
$ |
1 |
$ |
89 |
$ |
(277 |
) |
$ |
(188 |
) |
$ |
(415 |
) |
||||||||||||
Financial institutions |
808 |
6 |
68 |
110 |
992 |
(148 |
) |
844 |
686 |
||||||||||||||||||||||
Corporates |
1,692 |
950 |
55 |
188 |
2,885 |
(886 |
) |
1,999 |
(270 |
) |
|||||||||||||||||||||
Total Spain |
$ |
2,534 |
$ |
956 |
$ |
177 |
$ |
299 |
$ |
3,966 |
$ |
(1,311 |
) |
$ |
2,655 |
$ |
1 |
||||||||||||||
Total |
|||||||||||||||||||||||||||||||
Sovereign |
$ |
72 |
$ |
— |
$ |
1,744 |
$ |
115 |
$ |
1,931 |
$ |
(2,596 |
) |
$ |
(665 |
) |
$ |
(945 |
) |
||||||||||||
Financial institutions |
3,032 |
125 |
526 |
215 |
3,898 |
(987 |
) |
2,911 |
1,051 |
||||||||||||||||||||||
Corporates |
3,999 |
3,964 |
210 |
540 |
8,713 |
(2,331 |
) |
6,382 |
(941 |
) |
|||||||||||||||||||||
Total select European exposure |
$ |
7,103 |
$ |
4,089 |
$ |
2,480 |
$ |
870 |
$ |
14,542 |
$ |
(5,914 |
) |
$ |
8,628 |
$ |
(835 |
) |
|||||||||||||
(1) |
Net counterparty exposure includes the fair value of derivatives, including the counterparty risk associated with CDS, and secured financing transactions. Derivative exposures are presented net of $2.9 billion in collateral, predominantly in cash, pledged under legally enforceable netting agreements. Secured financing transaction exposures are presented net of eligible cash or securities pledged as collateral. The notional amount of reverse repurchase transactions was $3.1 billion.
|
(2) |
Long securities exposures are netted on a single-name basis to, but not below, zero by short exposures of $7.7 billion and net CDS purchased of $1.5 billion, consisting of $1.5 billion of net single-name CDS purchased and $13 million of net indexed and tranched CDS sold.
|
(3) |
Represents credit default protection purchased, net of credit default protection sold, which is used to mitigate the Corporation's risk to country exposures as listed, including $3.6 billion, consisting of $3.2 billion in net single-name CDS purchased and $397 million in net indexed and tranched CDS purchased, to hedge loans and securities, $2.2 billion in additional credit default protection purchased to hedge derivative assets and $148 million in other short exposures.
|
106
The majority of our CDS contracts on reference assets in Greece, Ireland, Italy, Portugal and Spain are with highly-rated financial institutions primarily outside of the Eurozone and we work to limit or eliminate correlated CDS. Due to our engagement in market-making activities, our CDS portfolio contains contracts with various maturities to a diverse set of counterparties. We work to limit mismatches in maturities between our exposures and the CDS we use to hedge them. However, there may be instances where the protection purchased has a different maturity than the exposure for which the protection was purchased, in which case, those exposures and hedges are subject to more active monitoring and management.
Table 58 presents the notional amount and fair value of single-name CDS purchased and sold on reference assets in Greece, Ireland, Italy, Portugal and Spain. Table 58 includes only single-name CDS netted at the counterparty level, whereas, Table 57 includes single-name, indexed and tranched CDS exposures netted by the reference asset that they are intended to hedge; therefore, CDS purchased and sold information is not comparable between tables.
Table 58 | |||||||||||||||
Single-Name CDS with Reference Assets in Greece, Ireland, Italy, Portugal and Spain (1)
| |||||||||||||||
March 31, 2013 |
|||||||||||||||
Notional |
Fair Value |
||||||||||||||
(Dollars in billions) |
Purchased |
Sold |
Purchased |
Sold |
|||||||||||
Greece |
|||||||||||||||
Aggregate |
$ |
1.7 |
$ |
1.7 |
$ |
0.1 |
$ |
0.1 |
|||||||
After netting (2)
|
0.4 |
0.4 |
0.1 |
0.1 |
|||||||||||
Ireland |
|||||||||||||||
Aggregate |
2.9 |
2.7 |
0.1 |
0.1 |
|||||||||||
After netting (2)
|
1.4 |
1.1 |
0.1 |
0.1 |
|||||||||||
Italy |
|||||||||||||||
Aggregate |
49.8 |
44.5 |
3.9 |
3.1 |
|||||||||||
After netting (2)
|
11.2 |
5.9 |
1.4 |
0.6 |
|||||||||||
Portugal |
|||||||||||||||
Aggregate |
8.0 |
8.1 |
0.3 |
0.3 |
|||||||||||
After netting (2)
|
1.2 |
1.3 |
0.1 |
0.1 |
|||||||||||
Spain |
|||||||||||||||
Aggregate |
22.5 |
22.2 |
0.9 |
0.9 |
|||||||||||
After netting (2)
|
3.7 |
3.4 |
0.2 |
0.2 |
|||||||||||
(1) |
The majority of our CDS contracts on reference assets in Greece, Ireland, Italy, Portugal and Spain are primarily with non-Eurozone counterparties. |
(2) |
Amounts listed are after consideration of legally enforceable counterparty master netting agreements. |
Losses could result even if there is credit default protection purchased because the purchased credit protection contracts may only pay out under certain scenarios and thus not all losses may be covered by the credit protection contracts. The effectiveness of our CDS protection as a hedge of these risks is influenced by a number of factors, including the contractual terms of the CDS. Generally, only the occurrence of a credit event as defined by the CDS terms (which may include, among other events, the failure to pay by, or restructuring of, the reference entity) results in a payment under the purchased credit protection contracts. The determination as to whether a credit event has occurred is made by the relevant International Swaps and Derivatives Association, Inc. (ISDA) Determination Committee (comprised of various ISDA member firms) based on the terms of the CDS and facts and circumstances for the event. Accordingly, uncertainties exist as to whether any particular strategy or policy action for addressing the European debt crisis would constitute a credit event under the CDS. A voluntary restructuring may not trigger a credit event under CDS terms and consequently may not trigger a payment under the CDS contract.
In addition to our direct sovereign and non-sovereign exposures, a significant deterioration of the European debt crisis could result in material reductions in the value of sovereign debt and other asset classes, disruptions in capital markets, widening of credit spreads of U.S. and non-U.S. financial institutions, loss of investor confidence in the financial services industry, a slowdown in global economic activity and other adverse developments. For additional information on the debt crisis in Europe, see Item 1A. Risk Factors of the Corporation's 2012 Annual Report on Form 10-K.
107
Provision for Credit Losses |
The provision for credit losses decreased $705 million to $1.7 billion for the three months ended March 31, 2013 compared to the same period in 2012. The provision for credit losses was $804 million lower than net charge-offs for the three months ended March 31, 2013, resulting in reductions in the allowance for credit losses due to continued improvement in the home loans portfolio as well as improvement in the credit card portfolio. This compared to a $1.6 billion reduction in the allowance for credit losses for the three months ended March 31, 2012. Absent unexpected deterioration in the economy, we expect reductions in the allowance for credit losses to continue in the near term, though at a slower pace than in 2012.
The provision for credit losses for the consumer portfolio decreased $1.2 billion to $1.5 billion for the three months ended March 31, 2013 compared to the same period in 2012. The improvement was primarily in the home loans portfolio due to an improved home price outlook in the PCI loan portfolios, and increased home prices and improved portfolio trends in the non-PCI loan portfolio. The provision for credit losses related to the PCI loan portfolios was a benefit of $207 million for the three months ended March 31, 2013 primarily due to improvement in our home price outlook compared to provision expense of $487 million for the same period in 2012.
The provision for credit losses for the commercial portfolio, including unfunded lending commitments, increased $448 million to $222 million for the three months ended March 31, 2013 compared to the same period in 2012 due to stabilization of credit quality, loan growth and a higher volume of loan resolutions in the prior year, all within the core commercial portfolio.
Allowance for Credit Losses |
Allowance for Loan and Lease Losses |
The allowance for loan and lease losses is comprised of two components. The first component covers nonperforming commercial loans and TDRs. The second component covers loans and leases on which there are incurred losses that are not yet individually identifiable, as well as incurred losses that may not be represented in the loss forecast models. We evaluate the adequacy of the allowance for loan and lease losses based on the total of these two components, each of which is described in more detail below. The allowance for loan and lease losses excludes LHFS and loans accounted for under the fair value option as the fair value reflects a credit risk component.
The first component of the allowance for loan and lease losses covers both the nonperforming commercial loans and all TDRs within the consumer and commercial portfolios. These loans are subject to impairment measurement based on the present value of projected future cash flows discounted at the loan's original effective interest rate, or in certain circumstances, impairment may also be based upon the collateral value or the loan's observable market price if available. Impairment measurement for the renegotiated credit card, unsecured consumer and small business TDR portfolios is based on the present value of projected cash flows discounted using the average portfolio contractual interest rate, excluding promotionally priced loans, in effect prior to restructuring. For purposes of computing this specific loss component of the allowance, larger impaired loans are evaluated individually and smaller impaired loans are evaluated as a pool using historical loss experience for the respective product types and risk ratings of the loans.
The second component of the allowance for loan and lease losses covers the remaining consumer and commercial loans and leases that have incurred losses which are not yet individually identifiable. The allowance for consumer and certain homogeneous commercial loan and lease products is based on aggregated portfolio evaluations, generally by product type. Loss forecast models are utilized that consider a variety of factors including, but not limited to, historical loss experience, estimated defaults or foreclosures based on portfolio trends, delinquencies, economic trends and credit scores. Our consumer real estate loss forecast model estimates the portion of loans that will default based on individual loan attributes, the most significant of which are refreshed LTV or CLTV, and borrower credit score as well as vintage and geography, all of which are further broken down into current delinquency status. Additionally, we incorporate the delinquency status of underlying first-lien loans on our junior-lien home equity portfolio in our allowance process. Incorporating refreshed LTV and CLTV into our probability of default allows us to factor the impact of changes in home prices into our allowance for loan and lease losses. These loss forecast models are updated on a quarterly basis to incorporate information reflecting the current economic environment. As of March 31, 2013, the loss forecast process resulted in reductions in the allowance for most major consumer portfolios.
The allowance for commercial loan and lease losses is established by product type after analyzing historical loss experience, internal risk rating, current economic conditions, industry performance trends, geographic and obligor concentrations within each portfolio and any other pertinent information. The statistical models for commercial loans are generally updated annually and utilize our historical database of actual defaults and other data. The loan risk ratings and composition of the commercial portfolios used to calculate the allowance are updated at least quarterly to incorporate the most recent data reflecting the current economic environment. For risk-rated commercial loans, we estimate the probability of default and the loss given default (LGD) based on our historical experience of defaults and credit losses. Factors considered when assessing the internal risk rating include the value of the underlying collateral, if applicable, the industry in which the obligor operates, the obligor's liquidity and other financial indicators, and other quantitative and qualitative
108
factors relevant to the obligor's credit risk. As of March 31, 2013, changes in portfolio size and composition resulted in a net increase in the commercial allowance, including increases in the allowance for the non-U.S. commercial portfolios and commercial lease financing, and reductions in the allowance for the commercial real estate and U.S. commercial portfolios.
Also included within the second component of the allowance for loan and lease losses are reserves to cover losses that are incurred but, in our assessment, may not be adequately represented in the historical loss data used in the loss forecast models. For example, factors that we consider include, among others, changes in lending policies and procedures, changes in economic and business conditions, changes in the nature and size of the portfolio, changes in the volume and severity of past due loans and nonaccrual loans and the effect of external factors such as competition, and legal and regulatory requirements. We also consider factors that are applicable to unique portfolio segments. For example, we consider the risk of uncertainty in our loss forecasting models related to junior-lien home equity loans that are current, but have first-lien loans that we do not service that are 30 days or more past due. In addition, we consider the inherent uncertainty in mathematical models that are built upon historical data.
During the three months ended March 31, 2013, the factors that impacted the allowance for loan and lease losses included significant overall improvements in the credit quality of the portfolios driven by improvements in the U.S. economy and housing and labor markets, continuing proactive credit risk management initiatives and the impact of recent higher credit quality originations. Additionally, the resolution of uncertainties through current recognition of net charge-offs has impacted the amount of reserve needed in certain portfolios. Evidencing the improvements in the U.S. economy and housing and labor markets are modest growth in consumer spending, improvements in unemployment levels, a decrease in the absolute level and our share of national consumer bankruptcy filings, and a rise in both residential building activity and overall home prices. In addition to these improvements, paydowns, charge-offs and returns to performing status and upgrades out of criticized continued to outpace new nonaccrual consumer loans and reservable criticized commercial loans, but such loans remained elevated relative to levels experienced prior to the financial crisis.
We monitor differences between estimated and actual incurred loan and lease losses. This monitoring process includes periodic assessments by senior management of loan and lease portfolios and the models used to estimate incurred losses in those portfolios.
Additions to, or reductions of, the allowance for loan and lease losses generally are recorded through charges or credits to the provision for credit losses. Credit exposures deemed to be uncollectible are charged against the allowance for loan and lease losses. Recoveries of previously charged off amounts are credited to the allowance for loan and lease losses.
The allowance for loan and lease losses for the consumer portfolio, as presented in Table 60, was $19.3 billion at March 31, 2013, a decrease of $1.8 billion from December 31, 2012. The decrease in the home equity and residential mortgage allowance was primarily driven by improved delinquencies and home prices as evidenced by improving LTV statistics as presented in Tables 27 and 29. In addition, the home equity and residential mortgage allowance declined due to write-offs in our PCI loan portfolio. These write-offs decreased the PCI valuation allowance included as part of the allowance for loan and lease losses.
The decrease in the allowance related to the credit card and unsecured consumer lending portfolios in CBB was primarily due to improvement in delinquencies and bankruptcies. For example, in the U.S. credit card portfolio, accruing loans 30 days or more past due decreased to $2.5 billion at March 31, 2013 from $2.7 billion (to 2.79 percent from 2.90 percent of outstanding U.S. credit card loans) at December 31, 2012, and accruing loans 90 days or more past due declined $77 million to $1.4 billion at March 31, 2013 (to 1.51 percent from 1.52 percent of outstanding U.S. credit card loans) compared to December 31, 2012. See Tables 24, 25, 27, 29, 34 and 36 for additional details on key consumer credit statistics.
The allowance for loan and lease losses for the commercial portfolio, as presented in Table 60, was $3.1 billion at both March 31, 2013 and December 31, 2012, as continued improvement in credit quality was offset by loan growth across the core commercial portfolio. The commercial utilized reservable criticized exposure decreased to $15.0 billion at March 31, 2013 from $15.9 billion (to 3.75 percent from 4.10 percent of total commercial utilized reservable exposure) at December 31, 2012. Similarly, nonperforming commercial loans declined to $2.7 billion at March 31, 2013 from $3.2 billion (to 0.76 percent from 0.93 percent of outstanding commercial loans) at December 31, 2012. See Tables 40, 41 and 43 for additional details on key commercial credit statistics.
The allowance for loan and lease losses as a percentage of total loans and leases outstanding was 2.49 percent at March 31, 2013 compared to 2.69 percent at December 31, 2012. The decrease in the ratio was primarily due to improved credit quality driven by improved economic conditions and write-offs in the home equity and residential mortgage PCI loan portfolios which led to the reduction in the allowance for credit losses discussed above. The March 31, 2013 and December 31, 2012 ratios above include the PCI loan portfolio. Excluding the PCI loan portfolio, the allowance for loan and lease losses as a percentage of total loans and leases outstanding was 2.06 percent at March 31, 2013 compared to 2.14 percent at December 31, 2012.
109
Table 59 presents a rollforward of the allowance for credit losses, which includes the allowance for loan and lease losses and the reserve for unfunded lending commitments, for the three months ended March 31, 2013 and 2012.
Table 59 |
|||||||
Allowance for Credit Losses |
|||||||
Three Months Ended March 31 |
|||||||
(Dollars in millions) |
2013 |
2012 |
|||||
Allowance for loan and lease losses, January 1 |
$ |
24,179 |
$ |
33,783 |
|||
Loans and leases charged off |
|||||||
Residential mortgage |
(425 |
) |
(976 |
) |
|||
Home equity |
(768 |
) |
(1,031 |
) |
|||
U.S. credit card |
(1,120 |
) |
(1,535 |
) |
|||
Non-U.S. credit card |
(145 |
) |
(261 |
) |
|||
Direct/Indirect consumer |
(225 |
) |
(378 |
) |
|||
Other consumer |
(63 |
) |
(68 |
) |
|||
Total consumer charge-offs |
(2,746 |
) |
(4,249 |
) |
|||
U.S. commercial (1)
|
(207 |
) |
(325 |
) |
|||
Commercial real estate |
(106 |
) |
(204 |
) |
|||
Commercial lease financing |
(1 |
) |
(1 |
) |
|||
Non-U.S. commercial |
(2 |
) |
(1 |
) |
|||
Total commercial charge-offs |
(316 |
) |
(531 |
) |
|||
Total loans and leases charged off |
(3,062 |
) |
(4,780 |
) |
|||
Recoveries of loans and leases previously charged off |
|||||||
Residential mortgage |
42 |
62 |
|||||
Home equity |
84 |
74 |
|||||
U.S. credit card |
173 |
204 |
|||||
Non-U.S. credit card |
33 |
58 |
|||||
Direct/Indirect consumer |
101 |
152 |
|||||
Other consumer |
11 |
12 |
|||||
Total consumer recoveries |
444 |
562 |
|||||
U.S. commercial (2)
|
60 |
74 |
|||||
Commercial real estate |
13 |
72 |
|||||
Commercial lease financing |
11 |
10 |
|||||
Non-U.S. commercial |
17 |
6 |
|||||
Total commercial recoveries |
101 |
162 |
|||||
Total recoveries of loans and leases previously charged off |
545 |
724 |
|||||
Net charge-offs |
(2,517 |
) |
(4,056 |
) |
|||
Provision for loan and lease losses |
1,731 |
2,457 |
|||||
Write-offs of PCI loans |
(839 |
) |
— |
||||
Other (3)
|
(113 |
) |
27 |
||||
Allowance for loan and lease losses, March 31 |
22,441 |
32,211 |
|||||
Reserve for unfunded lending commitments, January 1 |
513 |
714 |
|||||
Provision for unfunded lending commitments |
(18 |
) |
(39 |
) |
|||
Other (4)
|
(9 |
) |
(24 |
) |
|||
Reserve for unfunded lending commitments, March 31 |
486 |
651 |
|||||
Allowance for credit losses, March 31 |
$ |
22,927 |
$ |
32,862 |
|||
(1) |
Includes U.S. small business commercial charge-offs of $128 million and $208 million for the three months ended March 31, 2013 and 2012.
|
(2) |
Includes U.S. small business commercial recoveries of $26 million and $23 million for the three months ended March 31, 2013 and 2012.
|
(3) |
Primarily represents the net impact of portfolio sales, consolidations and deconsolidations, and foreign currency translation adjustments. |
(4) |
Primarily represents accretion of the Merrill Lynch purchase accounting adjustment. |
110
Table 59 |
|||||||
Allowance for Credit Losses (continued) |
|||||||
Three Months Ended March 31 |
|||||||
(Dollars in millions) |
2013 |
2012 |
|||||
Loan and allowance ratios: |
|||||||
Loans and leases outstanding at March 31 (5)
|
$ |
902,772 |
$ |
893,102 |
|||
Allowance for loan and lease losses as a percentage of total loans and leases outstanding at March 31 (5)
|
2.49 |
% |
3.61 |
% |
|||
|
Consumer allowance for loan and lease losses as a percentage of total consumer loans outstanding
at March 31 (6)
|
3.55 |
4.88 |
|||||
Commercial allowance for loan and lease losses as a percentage of total commercial loans and leases outstanding at March 31 (7)
|
0.87 |
1.17 |
|||||
Average loans and leases outstanding (5)
|
$ |
897,116 |
$ |
904,613 |
|||
Annualized net charge-offs as a percentage of average loans and leases outstanding (5, 8)
|
1.14 |
% |
1.80 |
% |
|||
Annualized net charge-offs and PCI write-offs as a percentage of average loans and leases outstanding (5, 9)
|
1.52 |
1.80 |
|||||
Allowance for loan and lease losses as a percentage of total nonperforming loans and leases at March 31 (5, 10)
|
102 |
126 |
|||||
Ratio of the allowance for loan and lease losses at March 31 to annualized net charge-offs (8)
|
2.20 |
1.97 |
|||||
Ratio of the allowance for loan and lease losses at March 31 to annualized net charge-offs and PCI write-offs (9)
|
1.65 |
1.97 |
|||||
Amounts included in allowance for loan and lease losses that are excluded from nonperforming loans and leases at March 31 (11)
|
$ |
10,690 |
$ |
17,006 |
|||
Allowance for loan and lease losses as a percentage of total nonperforming loans and leases, excluding amounts included in the allowance for loan and lease losses that are excluded from nonperforming loans and leases at March 31 (11)
|
53 |
% |
60 |
% |
|||
Loan and allowance ratios excluding PCI loans and the related valuation allowance: (12)
|
|||||||
Allowance for loan and lease losses as a percentage of total loans and leases outstanding at March 31 (5)
|
2.06 |
% |
2.70 |
% |
|||
|
Consumer allowance for loan and lease losses as a percentage of total consumer loans outstanding
at March 31 (6)
|
2.88 |
3.54 |
|||||
Annualized net charge-offs as a percentage of average loans and leases outstanding (5)
|
1.18 |
1.87 |
|||||
Allowance for loan and lease losses as a percentage of total nonperforming loans and leases at March 31 (5, 10)
|
82 |
91 |
|||||
Ratio of the allowance for loan and lease losses at March 31 to annualized net charge-offs |
1.76 |
1.43 |
|||||
(5) |
Outstanding loan and lease balances and ratios do not include loans accounted for under the fair value option. Loans accounted for under the fair value option were $8.8 billion and $9.2 billion at March 31, 2013 and 2012. Average loans accounted for under the fair value option were $9.1 billion for both the three months ended March 31, 2013 and 2012.
|
(6) |
Excludes consumer loans accounted for under the fair value option of $1.0 billion and $2.2 billion at March 31, 2013 and 2012.
|
(7) |
Excludes commercial loans accounted for under the fair value option of $7.8 billion and $7.0 billion at March 31, 2013 and 2012.
|
(8) |
Net charge-offs exclude $839 million of write-offs in the PCI loan portfolio for the three months ended March 31, 2013. These write-offs decreased the PCI valuation allowance included as part of the allowance for loan and lease losses. For information on PCI write-offs, see Consumer Portfolio Credit Risk Management – Purchased Credit-impaired Loan Portfolio on page 83.
|
(9) |
There were no write-offs of PCI loans in the three months ended March 31, 2012.
|
(10) |
For more information on our definition of nonperforming loans, see pages 89 and 98.
|
(11) |
Primarily includes amounts allocated to U.S. credit card and unsecured consumer lending portfolios in CBB, PCI loans and the non-U.S. credit card portfolio in All Other.
|
(12) |
For more information on the PCI loan portfolio and the valuation allowance for PCI loans, see Note 5 – Outstanding Loans and Leases and Note 6 – Allowance for Credit Losses to the Consolidated Financial Statements.
|
111
For reporting purposes, we allocate the allowance for credit losses across products. However, the allowance is available to absorb any credit losses without restriction. Table 60 presents our allocation by product type.
Table 60 | |||||||||||||||||||
Allocation of the Allowance for Credit Losses by Product Type | |||||||||||||||||||
March 31, 2013 |
December 31, 2012 |
||||||||||||||||||
(Dollars in millions) |
Amount |
Percent of Total |
Percent of Loans and Leases Outstanding (1) |
Amount |
Percent of Total |
Percent of Loans and Leases Outstanding (1) |
|||||||||||||
Allowance for loan and lease losses |
|||||||||||||||||||
Residential mortgage |
$ |
6,731 |
29.99 |
% |
2.62 |
% |
$ |
7,088 |
29.31 |
% |
2.80 |
% |
|||||||
Home equity |
6,707 |
29.89 |
6.50 |
7,845 |
32.45 |
7.26 |
|||||||||||||
U.S. credit card |
4,506 |
20.08 |
5.00 |
4,718 |
19.51 |
4.97 |
|||||||||||||
Non-U.S. credit card |
572 |
2.55 |
5.38 |
600 |
2.48 |
5.13 |
|||||||||||||
Direct/Indirect consumer |
690 |
3.08 |
0.85 |
718 |
2.97 |
0.86 |
|||||||||||||
Other consumer |
106 |
0.47 |
6.24 |
104 |
0.43 |
6.40 |
|||||||||||||
Total consumer |
19,312 |
86.06 |
3.55 |
21,073 |
87.15 |
3.81 |
|||||||||||||
U.S. commercial (2)
|
1,866 |
8.31 |
0.87 |
1,885 |
7.80 |
0.90 |
|||||||||||||
Commercial real estate |
815 |
3.63 |
2.09 |
846 |
3.50 |
2.19 |
|||||||||||||
Commercial lease financing |
85 |
0.38 |
0.36 |
78 |
0.32 |
0.33 |
|||||||||||||
Non-U.S. commercial |
363 |
1.62 |
0.44 |
297 |
1.23 |
0.40 |
|||||||||||||
Total commercial (3)
|
3,129 |
13.94 |
0.87 |
3,106 |
12.85 |
0.90 |
|||||||||||||
Allowance for loan and lease losses |
22,441 |
100.00 |
% |
2.49 |
24,179 |
100.00 |
% |
2.69 |
|||||||||||
Reserve for unfunded lending commitments |
486 |
513 |
|||||||||||||||||
Allowance for credit losses (4)
|
$ |
22,927 |
$ |
24,692 |
|||||||||||||||
(1) |
Ratios are calculated as allowance for loan and lease losses as a percentage of loans and leases outstanding excluding loans accounted for under the fair value option. Consumer loans accounted for under the fair value option included residential mortgage loans of $1.0 billion at both March 31, 2013 and December 31, 2012. Commercial loans accounted for under the fair value option included U.S. commercial loans of $2.1 billion and $2.3 billion and non-U.S. commercial loans of $5.7 billion and $5.7 billion at March 31, 2013 and December 31, 2012.
|
(2) Includes allowance for loan and lease losses for U.S. small business commercial loans of $611 million and $642 million at March 31, 2013 and December 31, 2012.
(3) Includes allowance for loan and lease losses for impaired commercial loans of $408 million and $475 million at March 31, 2013 and December 31, 2012.
(4) Includes $4.5 billion and $5.5 billion of valuation allowance presented with the allowance for credit losses related to PCI loans at March 31, 2013 and December 31, 2012.
Reserve for Unfunded Lending Commitments |
In addition to the allowance for loan and lease losses, we also estimate probable losses related to unfunded lending commitments such as letters of credit, financial guarantees, unfunded bankers' acceptances and binding loan commitments, excluding commitments accounted for under the fair value option. Unfunded lending commitments are subject to the same assessment as funded loans, including estimates of probability of default and LGD. Due to the nature of unfunded commitments, the estimate of probable losses must also consider utilization. To estimate the portion of these undrawn commitments that is likely to be drawn by a borrower at the time of estimated default, analyses of the Corporation's historical experience are applied to the unfunded commitments to estimate the funded exposure at default (EAD). The expected loss for unfunded lending commitments is the product of the probability of default, the LGD and the EAD, adjusted for any qualitative factors including economic uncertainty and inherent imprecision in models.
The reserve for unfunded lending commitments at March 31, 2013 was $486 million, $27 million lower than December 31, 2012 driven by improved credit quality in the unfunded portfolio and accretion of purchase accounting adjustments on acquired Merrill Lynch unfunded positions.
112
Market Risk Management |
Market risk is the risk that values of assets and liabilities or revenues will be adversely affected by changes in market conditions. This risk is inherent in the financial instruments associated with our operations, primarily within our Global Markets segment. We are also exposed to these risks in other areas of the Corporation to a lesser extent. In the event of market stress, these risks can have a material impact on the results of the Corporation.
Our traditional banking loan and deposit products are nontrading positions and are generally reported at amortized cost for assets or the amount owed for liabilities (historical cost). However, these positions are still subject to changes in economic value based on varying market conditions, primarily changes in the levels of interest rates. The risk of adverse changes in the economic value of our nontrading positions is managed through our ALM activities. We have elected to account for certain assets and liabilities under the fair value option. For further information on the fair value of certain financial assets and liabilities, see Note 16 – Fair Value Measurements to the Consolidated Financial Statements.
Our trading positions are reported at fair value with changes reflected in income. Trading positions are subject to various changes in market-based risk factors. The majority of this risk is generated by our activities in the interest rate, foreign exchange, credit, mortgage, equity and commodities markets. In addition, the values of assets and liabilities could change due to market liquidity, correlations across markets and expectations of market volatility. We seek to manage these risk exposures by using a variety of techniques that encompass a broad range of financial instruments. The key risk management techniques are discussed in more detail in the Trading Risk Management section.
Global Markets Risk Management is an independent function within the Corporation that supports the Global Banking and Markets Risk Executive. The Global Markets Risk Committee (GMRC), chaired by the Global Banking and Markets Risk Executive, has been designated by ALMRC as the primary risk governance authority for Global Markets. The GMRC's focus is to take a forward-looking view of the primary credit, market and operational risks impacting Global Markets and prioritize those that need a proactive risk mitigation strategy.
Global Markets Risk Management is responsible for providing senior management with a clear and comprehensive understanding of the trading risks to which the Corporation is exposed. These responsibilities include the ownership of market risk policy, development of quantitative risk models, calculations of aggregated risk measures, establishing and monitoring position limits consistent with risk appetite, conducting daily reviews and analysis of trading inventory, approving material risk exposures and fulfilling regulatory requirements.
Market risks that impact businesses outside of Global Markets are monitored and governed by their respective governance authorities.
For additional information on our market risk management process, see pages 113 through 120 of the MD&A of the Corporation's 2012 Annual Report on Form 10-K.
Trading Risk Management |
To evaluate risk in our trading activities, we focus on the actual and potential volatility of revenues generated by individual positions as well as portfolios of positions. Various techniques and procedures are utilized to enable the most complete understanding of these risks. Quantitative measures of market risk are evaluated on a daily basis from a single position to the portfolio of the Corporation. These measures include sensitivities of positions to various market risk factors, such as the potential revenue from a one basis point change in interest rates, and statistical measures utilizing both actual and hypothetical market moves, such as VaR and stress testing. Periods of extreme market stress influence the reliability of these techniques to varying degrees. Qualitative evaluations of market risk utilize the suite of quantitative risk measures while understanding each of their respective limitations. Additionally, risk managers independently evaluate the risk of the portfolios under the current market environment and potential future environments.
VaR is a common statistic used to measure market risk as it allows the aggregation of market risk factors, including the effects of portfolio diversification. A VaR model simulates the value of a portfolio under a range of scenarios in order to generate a distribution of potential gains and losses. VaR represents the loss a portfolio is not expected to exceed more than a certain number of days per year, based on a specified holding period, confidence interval and window of historical data. We use one VaR model consistently across the Corporation that uses a historical simulation approach based on a three-year window of historical data. For daily risk management, we use one-day changes in market risk factors and for the VaR used for the regulatory capital calculation, we use 10-day changes in market risk factors. Additionally, our primary VaR statistic is equivalent to a 99 percent confidence level. This means that losses should not exceed VaR, on average, 99 out of 100 trading days. In other words, the portfolio is expected to experience losses greater than VaR two to three times per year.
113
Within any VaR model, there are significant and numerous assumptions that will differ from company to company. The accuracy of a VaR model depends on the availability and quality of historical data for each of the risk factors in the portfolio. A VaR model may require additional modeling assumptions for new products that do not have the necessary historical market data or for illiquid positions for which accurate daily prices are not consistently available. For positions with insufficient historical data for the VaR calculation, the process for establishing an appropriate proxy is based on fundamental and statistical analysis of the new product or illiquid position. This analysis identifies reasonable alternatives that replicate both the expected volatility and correlation to other market risk factors that the missing data would be expected to experience.
VaR may not be indicative of realized revenue volatility as changes in market conditions or in the composition of the portfolio can have a material impact on the results. In particular, the historical data used for the VaR calculation might indicate higher or lower levels of portfolio diversification than will be experienced. In order for the VaR model to reflect current market conditions, we update the historical data underlying our VaR model on a bi-weekly basis and regularly review the assumptions underlying the model. A relatively minor portion of risks related to our positions are not included in VaR. These risks are regularly reviewed and if deemed material, the VaR results are supplemented. Counterparty credit valuation adjustments are adjustments to the mark-to-market value of our derivative exposures to reflect the impact of the credit quality of counterparties on our derivative assets. Since counterparty credit valuation adjustments are not included in the VaR component of the regulatory capital calculation, we do not include them or their corresponding hedges in the VaR results presented below.
Global Markets Risk Management continually reviews, evaluates and enhances our VaR model so that it reflects the material risks in our trading portfolio. Changes to the VaR model are reviewed and approved prior to implementation and any material changes are reported to management through the appropriate governance committees.
Market risk VaR for trading activities as disclosed below differs from the regulatory capital calculations as defined by regulatory standards (regulatory VaR). Although both VaR measures utilize the same process and methodology, the regulatory standards require that regulatory VaR exclude counterparty credit valuation adjustments but include the corresponding hedges, whereas the VaR statistics shown below exclude both. Also, the holding period for regulatory VaR is 10 days while for these VaR statistics it is one day. For additional information on certain components in regulatory VaR, see Capital Management – Regulatory Capital Changes on page 60.
Table 61 presents period-end, average, high and low daily trading VaR for the three months ended March 31, 2013, December 31, 2012 and March 31, 2012.
Table 61 | ||||||||||||||||||||||||||||||||||||||
Market Risk VaR for Trading Activities | ||||||||||||||||||||||||||||||||||||||
Three Months Ended |
Three Months Ended |
Three Months Ended |
||||||||||||||||||||||||||||||||||||
March 31, 2013 |
December 31, 2012 |
March 31, 2012 |
||||||||||||||||||||||||||||||||||||
(Dollars in millions) |
Period End |
Average |
High (1)
|
Low (1)
|
Period End |
Average |
High (1)
|
Low (1)
|
Period End |
Average |
High (1)
|
Low (1)
|
||||||||||||||||||||||||||
Foreign exchange |
$ |
22 |
$ |
24 |
$ |
38 |
$ |
15 |
$ |
26 |
$ |
22 |
$ |
29 |
$ |
17 |
$ |
20 |
$ |
19 |
$ |
24 |
$ |
12 |
||||||||||||||
Interest rate |
44 |
45 |
66 |
32 |
49 |
50 |
66 |
38 |
42 |
50 |
75 |
33 |
||||||||||||||||||||||||||
Credit |
61 |
59 |
72 |
48 |
73 |
68 |
81 |
54 |
40 |
50 |
67 |
36 |
||||||||||||||||||||||||||
Real estate/mortgage |
32 |
36 |
43 |
31 |
37 |
35 |
39 |
30 |
33 |
37 |
45 |
31 |
||||||||||||||||||||||||||
Equities |
36 |
33 |
49 |
20 |
27 |
24 |
36 |
17 |
37 |
41 |
55 |
29 |
||||||||||||||||||||||||||
Commodities |
15 |
13 |
15 |
11 |
13 |
15 |
18 |
12 |
10 |
13 |
17 |
8 |
||||||||||||||||||||||||||
Portfolio diversification |
(125 |
) |
(130 |
) |
— |
— |
(103 |
) |
(114 |
) |
— |
— |
(118 |
) |
(126 |
) |
— |
— |
||||||||||||||||||||
Total market-based trading portfolio |
$ |
85 |
$ |
80 |
$ |
103 |
$ |
59 |
$ |
122 |
$ |
100 |
$ |
128 |
$ |
76 |
$ |
64 |
$ |
84 |
$ |
115 |
$ |
50 |
||||||||||||||
(1) |
The high and low for the total portfolio may have occurred on different trading days than the high and low for the individual components. Therefore the amount of portfolio diversification, which is the difference between the total portfolio and the sum of the individual components, is not relevant. |
The decrease in average and period-end VaR for the three months ended March 31, 2013 compared to the three months ended December 31, 2012 was primarily driven by reduced credit risk combined with increased diversification benefit across the portfolio.
114
The graph below presents the daily total market-based trading portfolio VaR for the previous five quarters, and corresponds to the data presented in Table 61.
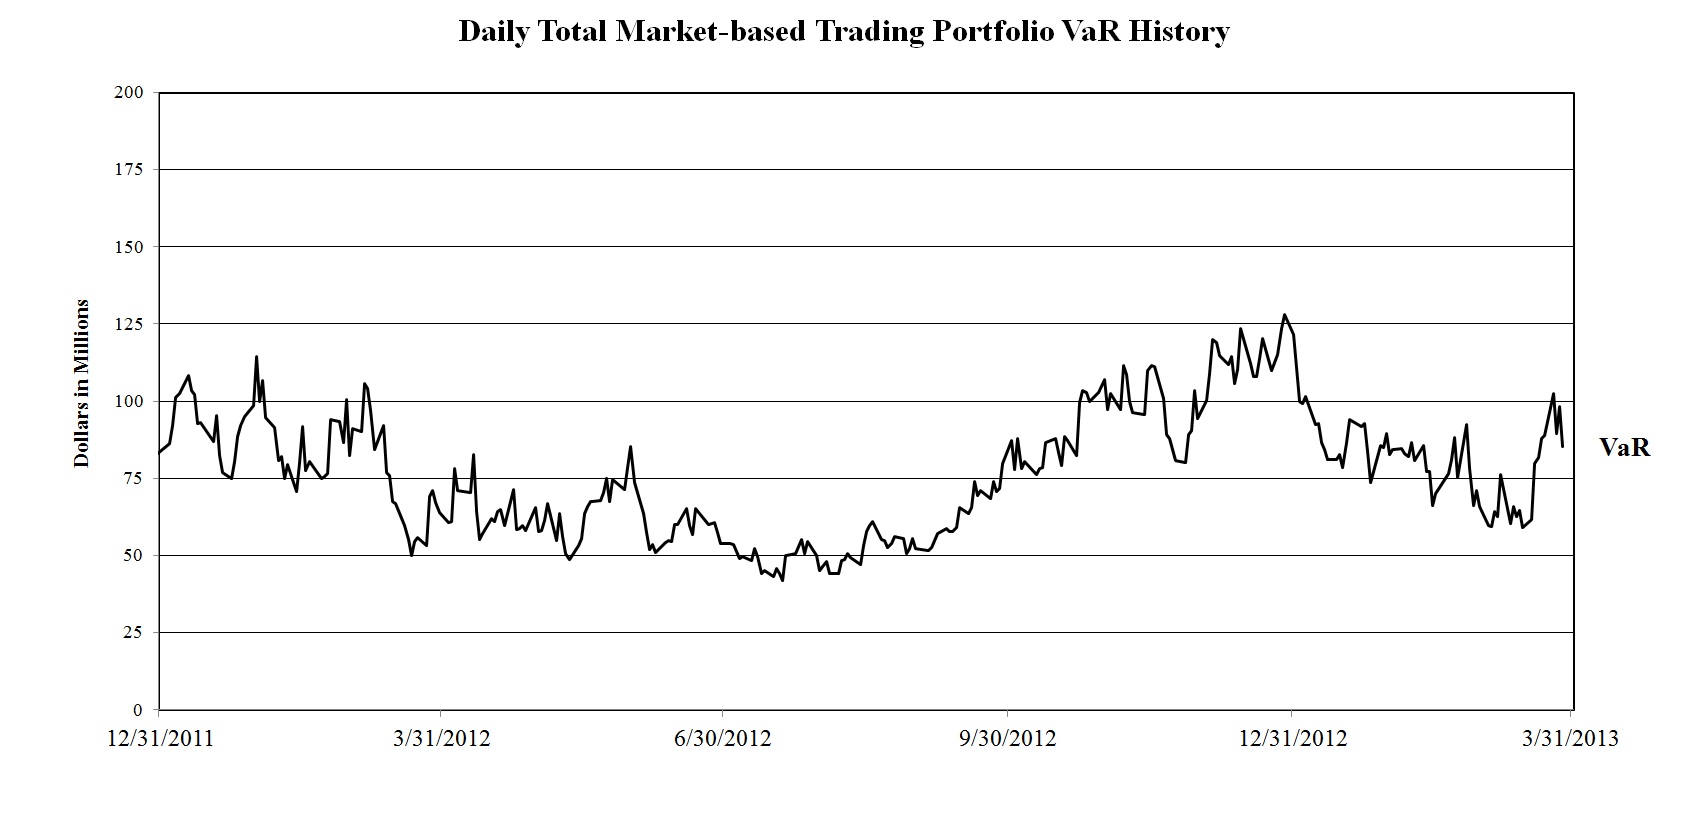
To enhance the visibility of the market risks to which we are exposed, additional VaR statistics produced within the Corporation's single VaR model are provided in Table 62. Evaluating VaR with additional statistics allows for an increased understanding of the risks in the portfolio as the historical market data used in the VaR calculation does not necessarily follow a predefined statistical distribution. Table 62 presents average trading VaR statistics for 99 percent and 95 percent confidence intervals for the three months ended March 31, 2013 and December 31, 2012.
Table 62 | ||||||||||||||
Average Market Risk VaR for Trading Activities – Additional VaR Statistics | ||||||||||||||
Three Months Ended |
Three Months Ended |
|||||||||||||
March 31, 2013 |
December 31, 2012 |
|||||||||||||
(Dollars in millions) |
99 percent |
95 percent |
99 percent |
95 percent |
||||||||||
Foreign exchange |
$ |
24 |
$ |
15 |
$ |
22 |
$ |
11 |
||||||
Interest rate |
45 |
28 |
50 |
27 |
||||||||||
Credit |
59 |
28 |
68 |
31 |
||||||||||
Real estate/mortgage |
36 |
21 |
35 |
19 |
||||||||||
Equities |
33 |
19 |
24 |
16 |
||||||||||
Commodities |
13 |
7 |
15 |
8 |
||||||||||
Portfolio diversification |
(130 |
) |
(80 |
) |
(114 |
) |
(64 |
) |
||||||
Total market-based trading portfolio |
$ |
80 |
$ |
38 |
$ |
100 |
$ |
48 |
||||||
Limits on quantitative risk measures, including VaR, are monitored on a daily basis. The limits are independently set by market risk management and reviewed on a regular basis to ensure they remain relevant and within our overall risk appetite for market risks. Limits are reviewed in the context of market liquidity, volatility and strategic business priorities. The limits are set at both a granular level to ensure extensive coverage of risks as well as at aggregated portfolios to account for correlations among risk factors. Trading limits are approved at least annually. The ALMRC has given authority to the GMRC to approve changes to trading limits throughout the year. Approved trading limits are stored and tracked in a centralized limits management system. Trading limit excesses are communicated to management for review.
In periods of market stress, the GMRC members communicate daily to discuss losses, key risk positions and any limit excesses. As a result of this process, the businesses may selectively reduce risk. Where economically feasible, positions are sold or macroeconomic hedges are executed to reduce the exposures.
115
Backtesting |
The accuracy of the VaR methodology is evaluated by backtesting, which compares the daily VaR results against the realized daily profit and loss. Backtesting excesses occur when a trading loss exceeds the VaR for the corresponding day. These excesses are evaluated to understand the positions and market moves that produced the trading loss and to ensure that the VaR methodology accurately represents those losses. As our primary VaR statistic used for backtesting is based on a 99 percent confidence interval, we expect one trading loss in excess of VaR every 100 days, or between two to three trading losses in excess of VaR over the course of a year. The number of backtesting excesses observed can differ from the statistically expected number of excesses if the current level of market volatility is materially different than the level of market volatility during the three years of historical data used in the VaR calculation.
We conduct daily backtests on our portfolios and report the results to senior market risk management. Senior management, including the GMRC, regularly reviews and evaluates the results of these tests. The government agencies that regulate our operations also regularly review these results.
Backtesting revenues are defined by regulatory agencies in order to most closely align with the VaR component of the regulatory capital calculation. This revenue differs from total trading-related revenue in that it excludes revenues from trading activities that either do not generate market risk or the market risk cannot be included in VaR. Some examples of the types of revenue excluded for backtesting are fees, commissions, reserves, net interest income and intraday trading revenues. In addition, counterparty credit valuation adjustments are not included in the VaR component of the regulatory capital calculation and are therefore not included in the revenue used for backtesting.
There were no days during the three months ended March 31, 2013 in which the backtesting revenue was a loss in excess of our total market-based trading portfolio VaR.
Total Trading Revenue |
Total trading-related revenue represents the total amount earned from trading positions, including market-based net interest income, which are taken in a diverse range of financial instruments and markets. Trading account assets and liabilities are reported at fair value. For more information on fair value, see Note 16 – Fair Value Measurements to the Consolidated Financial Statements. Trading-related revenues can be volatile and are largely driven by general market conditions and customer demand. Also, trading-related revenues are dependent on the volume and type of transactions, the level of risk assumed, and the volatility of price and rate movements at any given time within the ever-changing market environment. Significant daily revenues by business are monitored and the primary drivers of these are reviewed. When it is deemed material, an explanation of these revenues is provided to the GMRC.
116
The histogram below is a graphic depiction of trading volatility and illustrates the daily level of trading-related revenue for the three months ended March 31, 2013 compared to the three months ended December 31, 2012. During the three months ended March 31, 2013, positive trading-related revenue was recorded for 100 percent, or 60 trading days, of which 97 percent (58 days) were daily trading gains of over $25 million. These results can be compared to the three months ended December 31, 2012, where positive trading-related revenue was recorded for 97 percent, or 59 of the 61 trading days, of which 69 percent (42 days) were daily trading gains of over $25 million and the largest loss was $50 million.
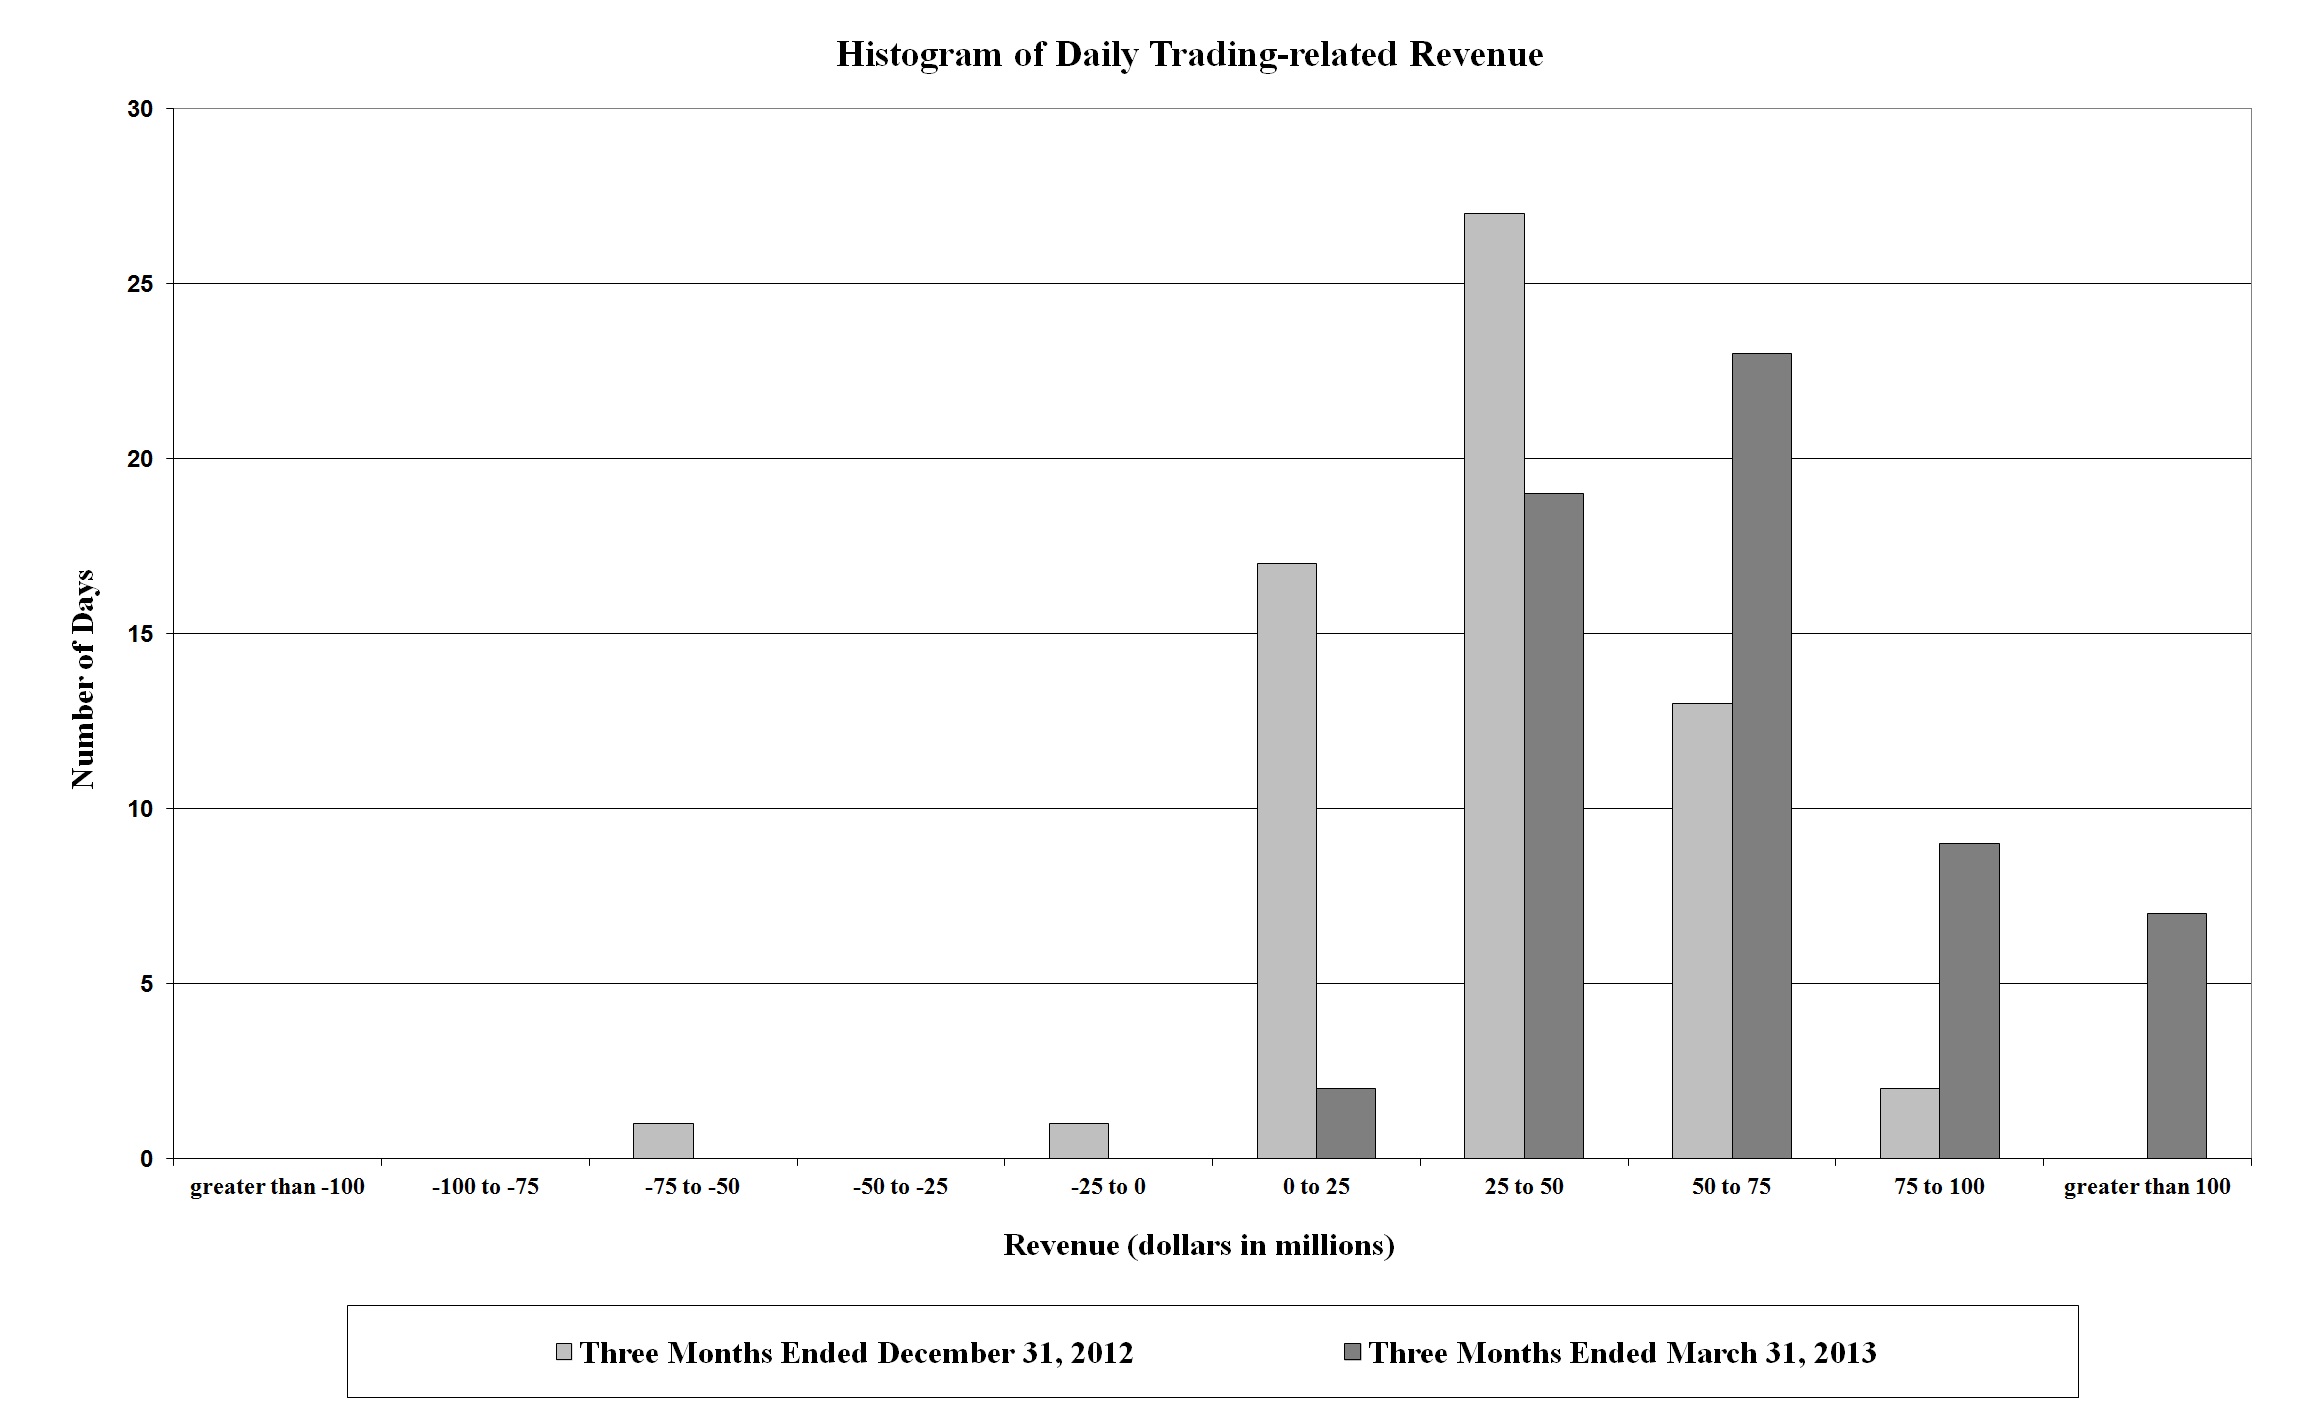
Trading Portfolio Stress Testing |
Because the very nature of a VaR model suggests results can exceed our estimates and are dependent on a limited historical window, we also stress test our portfolio using scenario analysis. This analysis estimates the change in value of our trading portfolio that may result from abnormal market movements.
A set of scenarios, categorized as either historical or hypothetical, are computed daily for the overall trading portfolio and individual businesses. These scenarios include shocks to underlying market risk factors that may be well beyond the shocks found in the historical data used to calculate VaR. Historical scenarios simulate the impact of the market moves that occurred during a period of extended historical market stress. Generally, a 10-business day window or longer representing the most severe point during a crisis is selected for each historical scenario. Hypothetical scenarios provide simulations of the estimated portfolio impact from potential future market stress events. Scenarios are reviewed and updated in response to changing positions and new economic or political information. In addition, new or adhoc scenarios are developed to address specific potential market events. For example, a stress test was conducted to estimate the impact of a full or partial break-up of the Eurozone. The stress tests are reviewed on a regular basis and the results are presented to senior management.
Stress testing for the trading portfolio is integrated with enterprise-wide stress testing and incorporated into the limits framework. A process is in place to promote consistency between the scenarios used for the trading portfolio and those used for enterprise-wide stress testing. The scenarios used for enterprise-wide stress testing purposes differ from the typical trading portfolio scenarios in that they have a longer time horizon and the results are forecasted over multiple periods for use in consolidated capital and liquidity planning. For additional information on enterprise-wide stress testing, see Managing Risk – Enterprise-wide Stress Testing on page 56.
117
Interest Rate Risk Management for Nontrading Activities |
The following discussion presents net interest income excluding the impact of trading-related activities.
Interest rate risk represents the most significant market risk exposure to our nontrading balance sheet. Interest rate risk is measured as the potential volatility in net interest income caused by changes in market interest rates. Client-facing activities, primarily lending and deposit-taking, create interest rate sensitive positions on our balance sheet.
We prepare forward-looking forecasts of net interest income. The baseline forecast takes into consideration expected future business growth, ALM positioning and the direction of interest rate movements as implied by the market-based forward curve. We then measure and evaluate the impact that alternative interest rate scenarios have on the baseline forecast in order to assess interest rate sensitivity under varied conditions. The net interest income forecast is frequently updated for changing assumptions and differing outlooks based on economic trends, market conditions and business strategies. Thus, we continually monitor our balance sheet position in an effort to maintain an acceptable level of exposure to interest rate changes.
The interest rate scenarios that we analyze incorporate balance sheet assumptions such as loan and deposit growth and pricing, changes in funding mix, product repricing and maturity characteristics, but do not include the impact of hedge ineffectiveness. Our overall goal is to manage interest rate risk so that movements in interest rates do not significantly adversely affect nontrading net interest income and capital.
Table 63 presents the spot and 12-month forward rates used in our baseline forecasts at March 31, 2013 and December 31, 2012.
Table 63 | |||||||||||||||||
Forward Rates | |||||||||||||||||
March 31, 2013 |
December 31, 2012 |
||||||||||||||||
Federal Funds |
Three-month LIBOR |
10-Year Swap |
Federal Funds |
Three-month LIBOR |
10-Year Swap |
||||||||||||
Spot rates |
0.25 |
% |
0.28 |
% |
2.01 |
% |
0.25 |
% |
0.31 |
% |
1.84 |
% |
|||||
12-month forward rates |
0.25 |
0.42 |
2.35 |
0.25 |
0.37 |
2.10 |
|||||||||||
Table 64 shows the pre-tax dollar impact to forecasted net interest income over the next 12 months from March 31, 2013 and December 31, 2012, resulting from instantaneous parallel and non-parallel shocks to the market-based forward curve. Periodically we evaluate the scenarios presented to ensure that they are meaningful in the context of the current rate environment. For further discussion of net interest income excluding the impact of trading-related activities, see page 20.
Table 64 |
|||||||||||||
Estimated Net Interest Income Excluding Trading-related Net Interest Income | |||||||||||||
|
(Dollars in millions)
Curve Change
|
Short Rate (bps) |
Long Rate (bps) |
March 31 2013 |
December 31 2012 |
|||||||||
Parallel shifts |
|||||||||||||
+100 bps instantaneous shift |
+100 |
+100 |
$ |
3,722 |
$ |
4,232 |
|||||||
-50 bps instantaneous shift |
-50 |
-50 |
(2,076 |
) |
(2,250 |
) |
|||||||
Flatteners |
|||||||||||||
Short end instantaneous change |
+100 |
— |
2,120 |
2,159 |
|||||||||
Long end instantaneous change |
— |
-50 |
(1,330 |
) |
(1,597 |
) |
|||||||
Steepeners |
|||||||||||||
Short end instantaneous change |
-50 |
— |
(750 |
) |
(655 |
) |
|||||||
Long end instantaneous change |
— |
+100 |
1,630 |
2,091 |
|||||||||
The sensitivity analysis in Table 64 assumes that we take no action in response to these rate shocks. Our net interest income was asset sensitive to a parallel move in interest rates at both March 31, 2013 and December 31, 2012. As part of our ALM activities, we use securities, residential mortgages, and interest rate and foreign exchange derivatives in managing interest rate sensitivity.
118
Securities |
The securities portfolio is an integral part of our interest rate risk management, which includes our ALM positioning, and is primarily comprised of debt securities including MBS and to a lesser extent U.S. Treasury, corporate, municipal and other debt securities. As part of the ALM positioning, we will use derivatives to hedge certain debt securities to mitigate the interest rate and duration risk. As net interest income forecasts change, we continually monitor and update our ALM positions. At March 31, 2013 and December 31, 2012, our debt securities portfolio used for ALM positioning, excluding positions used to meet certain international regulatory liquidity requirements, had a fair value of $345.7 billion and $351.7 billion. During the three months ended March 31, 2013 and 2012, we purchased debt securities of $33.6 billion and $66.9 billion, sold $15.3 billion and $25.8 billion, and had maturities and received paydowns of $21.5 billion and $15.8 billion, respectively. We realized $68 million and $752 million in net gains on sales of debt securities during the three months ended March 31, 2013 and 2012, respectively.
Accumulated OCI included after-tax net unrealized gains of $3.5 billion and $2.2 billion on AFS debt securities and $502 million and $17 million on AFS marketable equity securities at March 31, 2013 and 2012. For additional information on accumulated OCI, see Note 13 – Accumulated Other Comprehensive Income (Loss) to the Consolidated Financial Statements. The amount of pre-tax net unrealized gains on AFS debt securities decreased $1.5 billion during the three months ended March 31, 2013 to $5.5 billion primarily due to the impact of higher rates. For additional information on our securities portfolio, see Note 4 – Securities to the Consolidated Financial Statements.
We recognized $9 million of other-than-temporary impairment (OTTI) losses in earnings on AFS debt securities in the three months ended March 31, 2013 compared to $40 million for the same period in 2012. The recognition of OTTI losses is based on a variety of factors, including the length of time and extent to which the market value has been less than amortized cost, the financial condition of the issuer of the security including credit ratings and any specific events affecting the operations of the issuer, underlying assets that collateralize the debt security, other industry and macroeconomic conditions, and our intent and ability to hold the security to recovery.
Residential Mortgage Portfolio |
At March 31, 2013 and December 31, 2012, our residential mortgage portfolio was $256.9 billion and $253.1 billion excluding $1.0 billion of consumer residential mortgage loans accounted for under the fair value option at both period ends. For more information on consumer fair value option loans, see Consumer Portfolio Credit Risk Management – Consumer Loans Accounted for Under the Fair Value Option on page 88. The $3.9 billion increase in the three months ended March 31, 2013 was primarily due to the repurchase of certain loans in connection with the FNMA Settlement. As of March 31, 2013, these loans had a carrying value of $5.3 billion. For more information on the FNMA Settlement, see Note 8 – Representations and Warranties Obligations and Corporate Guarantees to the Consolidated Financial Statements.
During the three months ended March 31, 2013, CRES and GWIM originated $10.8 billion in first-lien mortgages that we retained compared to $8.3 billion in the prior-year period. Additionally, during the three months ended March 31, 2013 in connection with the FNMA Settlement, we repurchased certain residential mortgage loans as mention above. We also repurchased $3.1 billion of delinquent FHA loans pursuant to our servicing agreements with GNMA and received paydowns of $13.9 billion compared to no repurchases and paydowns of $12.9 billion in the prior-year period. There were no purchases of residential mortgages related to ALM activities during either period. We sold $15 million of residential mortgages compared to $19 million in the prior-year period, all of which were originated residential mortgages. Gains recognized on the sales of residential mortgages in both periods were not material.
Interest Rate and Foreign Exchange Derivative Contracts |
Interest rate and foreign exchange derivative contracts are utilized in our ALM activities and serve as an efficient tool to manage our interest rate and foreign exchange risk. We use derivatives to hedge the variability in cash flows or changes in fair value on our balance sheet due to interest rate and foreign exchange components. For additional information on our hedging activities, see Note 3 – Derivatives to the Consolidated Financial Statements.
Our interest rate contracts are generally non-leveraged generic interest rate and foreign exchange basis swaps, options, futures and forwards. In addition, we use foreign exchange contracts, including cross-currency interest rate swaps, foreign currency forward contracts and options to mitigate the foreign exchange risk associated with foreign currency-denominated assets and liabilities.
Changes to the composition of our derivatives portfolio during the three months ended March 31, 2013 reflect actions taken for interest rate and foreign exchange rate risk management. The decisions to reposition our derivatives portfolio are based on the current
119
assessment of economic and financial conditions including the interest rate and foreign currency environments, balance sheet composition and trends, and the relative mix of our cash and derivative positions.
Table 65 presents derivatives utilized in our ALM activities including those designated as accounting and economic hedging instruments and shows the notional amount, fair value, weighted-average receive-fixed and pay-fixed rates, expected maturity and average estimated durations of our open ALM derivatives at March 31, 2013 and December 31, 2012. These amounts do not include derivative hedges on our MSRs.
Table 65 | ||||||||||||||||||||||||||||||||||
Asset and Liability Management Interest Rate and Foreign Exchange Contracts | ||||||||||||||||||||||||||||||||||
March 31, 2013 |
||||||||||||||||||||||||||||||||||
Expected Maturity |
||||||||||||||||||||||||||||||||||
(Dollars in millions, average estimated duration in years) |
Fair
Value
|
Total |
2013 |
2014 |
2015 |
2016 |
2017 |
Thereafter |
Average
Estimated
Duration
|
|||||||||||||||||||||||||
Receive-fixed interest rate swaps (1, 2)
|
$ |
9,809 |
5.53 |
|||||||||||||||||||||||||||||||
Notional amount |
$ |
100,784 |
$ |
4,081 |
$ |
7,604 |
$ |
11,785 |
$ |
12,342 |
$ |
19,693 |
$ |
45,279 |
||||||||||||||||||||
Weighted-average fixed-rate |
3.69 |
% |
3.83 |
% |
3.79 |
% |
3.56 |
% |
3.70 |
% |
3.89 |
% |
3.61 |
% |
||||||||||||||||||||
Pay-fixed interest rate swaps (1, 2)
|
(2,827 |
) |
11.98 |
|||||||||||||||||||||||||||||||
Notional amount |
$ |
30,970 |
$ |
18 |
$ |
3,604 |
$ |
520 |
$ |
1,025 |
$ |
1,527 |
$ |
24,276 |
||||||||||||||||||||
Weighted-average fixed-rate |
2.60 |
% |
6.91 |
% |
0.60 |
% |
2.30 |
% |
1.65 |
% |
1.84 |
% |
2.99 |
% |
||||||||||||||||||||
Same-currency basis swaps (3)
|
30 |
|||||||||||||||||||||||||||||||||
Notional amount |
$ |
216,436 |
$ |
71,260 |
$ |
54,068 |
$ |
25,708 |
$ |
21,846 |
$ |
14,107 |
$ |
29,447 |
||||||||||||||||||||
Foreign exchange basis swaps (2, 4, 5)
|
(1,531 |
) |
||||||||||||||||||||||||||||||||
Notional amount |
189,877 |
23,184 |
39,151 |
30,291 |
19,836 |
22,194 |
55,221 |
|||||||||||||||||||||||||||
Option products (6)
|
22 |
|||||||||||||||||||||||||||||||||
Notional amount (7)
|
5,646 |
5,639 |
— |
— |
— |
— |
7 |
|||||||||||||||||||||||||||
Foreign exchange contracts (2, 5, 8)
|
4,874 |
|||||||||||||||||||||||||||||||||
Notional amount (7)
|
2,072 |
(20,328 |
) |
8,016 |
1,267 |
580 |
6,930 |
5,607 |
||||||||||||||||||||||||||
Futures and forward rate contracts |
(64 |
) |
||||||||||||||||||||||||||||||||
Notional amount (7)
|
(29,170 |
) |
(25,991 |
) |
— |
— |
— |
— |
(3,179 |
) |
||||||||||||||||||||||||
Net ALM contracts |
$ |
10,313 |
||||||||||||||||||||||||||||||||
December 31, 2012 |
||||||||||||||||||||||||||||||||||
Expected Maturity |
||||||||||||||||||||||||||||||||||
(Dollars in millions, average estimated duration in years) |
Fair
Value
|
Total |
2013 |
2014 |
2015 |
2016 |
2017 |
Thereafter |
Average
Estimated
Duration
|
|||||||||||||||||||||||||
Receive-fixed interest rate swaps (1, 2)
|
$ |
10,491 |
5.30 |
|||||||||||||||||||||||||||||||
Notional amount |
$ |
85,899 |
$ |
7,175 |
$ |
7,604 |
$ |
11,785 |
$ |
11,362 |
$ |
19,693 |
$ |
28,280 |
||||||||||||||||||||
Weighted-average fixed-rate |
4.12 |
% |
4.06 |
% |
3.79 |
% |
3.56 |
% |
3.98 |
% |
3.89 |
% |
4.67 |
% |
||||||||||||||||||||
Pay-fixed interest rate swaps (1, 2)
|
(4,903 |
) |
15.47 |
|||||||||||||||||||||||||||||||
Notional amount |
$ |
26,548 |
$ |
27 |
$ |
3,989 |
$ |
520 |
$ |
1,025 |
$ |
1,527 |
$ |
19,460 |
||||||||||||||||||||
Weighted-average fixed-rate |
3.09 |
% |
6.91 |
% |
0.79 |
% |
2.30 |
% |
1.65 |
% |
1.84 |
% |
3.75 |
% |
||||||||||||||||||||
Same-currency basis swaps (3)
|
45 |
|||||||||||||||||||||||||||||||||
Notional amount |
$ |
213,458 |
$ |
82,716 |
$ |
54,534 |
$ |
19,995 |
$ |
20,361 |
$ |
13,542 |
$ |
22,310 |
||||||||||||||||||||
Foreign exchange basis swaps (2, 4, 5)
|
431 |
|||||||||||||||||||||||||||||||||
Notional amount |
191,925 |
32,590 |
44,732 |
27,569 |
15,965 |
20,134 |
50,935 |
|||||||||||||||||||||||||||
Option products (6)
|
(147 |
) |
||||||||||||||||||||||||||||||||
Notional amount (7)
|
4,218 |
4,000 |
— |
— |
— |
— |
218 |
|||||||||||||||||||||||||||
Foreign exchange contracts (2, 5, 8)
|
5,636 |
|||||||||||||||||||||||||||||||||
Notional amount (7)
|
(1,200 |
) |
(23,438 |
) |
8,615 |
1,303 |
582 |
6,183 |
5,555 |
|||||||||||||||||||||||||
Futures and forward rate contracts |
24 |
|||||||||||||||||||||||||||||||||
Notional amount (7)
|
(11,595 |
) |
(11,595 |
) |
— |
— |
— |
— |
— |
|||||||||||||||||||||||||
Net ALM contracts |
$ |
11,577 |
||||||||||||||||||||||||||||||||
(1) |
At March 31, 2013, the receive-fixed interest rate swap notional amounts that represent forward starting swaps and which will not be effective until their respective contractual start dates totaled $4.5 billion compared to none at December 31, 2012. The forward starting pay-fixed swap positions at March 31, 2013 and December 31, 2012 were $3.5 billion and $520 million.
|
(2) |
Does not include basis adjustments on either fixed-rate debt issued by the Corporation or AFS debt securities, which are hedged using derivatives designated as fair value hedging instruments, that substantially offset the fair values of these derivatives. |
(3) |
At March 31, 2013 and December 31, 2012, the notional amount of same-currency basis swaps was comprised of $216.4 billion and $213.5 billion in both foreign currency and U.S. dollar-denominated basis swaps in which both sides of the swap are in the same currency.
|
(4) |
Foreign exchange basis swaps consisted of cross-currency variable interest rate swaps used separately or in conjunction with receive-fixed interest rate swaps. |
(5) |
Does not include foreign currency translation adjustments on certain non-U.S. debt issued by the Corporation that substantially offset the fair values of these derivatives. |
(6) |
The notional amount of option products of $5.6 billion at March 31, 2013 was comprised of $4.0 billion in MBS options, $1.1 billion in foreign exchange options, $500 million in swaptions and $17 million in purchased caps/floors. Option products of $4.2 billion at December 31, 2012 were comprised of $4.2 billion in swaptions and $18 million in purchased caps/floors.
|
(7) |
Reflects the net of long and short positions. |
(8) |
The notional amount of foreign exchange contracts of $2.1 billion at March 31, 2013 was comprised of $39.1 billion in foreign currency-denominated and cross-currency receive-fixed swaps, $(7.1) billion in foreign currency-denominated pay-fixed swaps and $(29.9) billion in net foreign currency forward rate contracts. Foreign exchange contracts of $(1.2) billion at December 31, 2012 were comprised of $41.9 billion in foreign currency-denominated and cross-currency receive-fixed swaps, $(10.5) billion in foreign currency-denominated pay-fixed swaps and $(32.6) billion in net foreign currency forward rate contracts.
|
120
We use interest rate derivative instruments to hedge the variability in the cash flows of our assets and liabilities and other forecasted transactions (collectively referred to as cash flow hedges). The net losses on both open and terminated cash flow hedge derivative instruments recorded in accumulated OCI, net-of-tax, were $2.7 billion and $2.9 billion at March 31, 2013 and December 31, 2012. These net losses are expected to be reclassified into earnings in the same period as the hedged cash flows affect earnings and will decrease income or increase expense on the respective hedged cash flows. Assuming no change in open cash flow derivative hedge positions and no changes in prices or interest rates beyond what is implied in forward yield curves at March 31, 2013, the pre-tax net losses are expected to be reclassified into earnings as follows: $946 million, or 22 percent, within the next year, 57 percent in years two through five, and 14 percent in years six through ten, with the remaining seven percent thereafter. For more information on derivatives designated as cash flow hedges, see Note 3 – Derivatives to the Consolidated Financial Statements.
We hedge our net investment in non-U.S. operations determined to have functional currencies other than the U.S. dollar using forward foreign exchange contracts that typically settle in less than 180 days, cross-currency basis swaps, foreign exchange options and foreign currency-denominated debt. We recorded net after-tax gains on derivatives and foreign currency-denominated debt in accumulated OCI associated with net investment hedges which were offset by losses on our net investments in consolidated non-U.S. entities at March 31, 2013.
Mortgage Banking Risk Management |
We originate, fund and service mortgage loans, which subject us to credit, liquidity and interest rate risks, among others. We determine whether loans will be HFI or held-for-sale at the time of commitment and manage credit and liquidity risks by selling or securitizing a portion of the loans we originate.
Interest rate risk and market risk can be substantial in the mortgage business. Fluctuations in interest rates drive consumer demand for new mortgages and the level of refinancing activity, which in turn, affects total origination and servicing income. Typically, a decline in mortgage interest rates will lead to an increase in mortgage originations and related fees and a decrease in the value of the MSRs driven by higher prepayment expectations. Hedging the various sources of interest rate risk in mortgage banking is a complex process that requires complex modeling and ongoing monitoring. IRLCs and the related residential first mortgage LHFS are subject to interest rate risk between the date of the IRLC and the date the loans are sold to the secondary market. To hedge interest rate risk, we utilize forward loan sale commitments and other derivative instruments including purchased options. These instruments are used to hedge certain market risks of IRLCs and residential first mortgage LHFS. At March 31, 2013 and December 31, 2012, the notional amounts of derivatives economically hedging the IRLCs and residential first mortgage LHFS were $26.2 billion and $31.1 billion.
MSRs are nonfinancial assets created when the underlying mortgage loan is sold to investors and we retain the right to service the loan. We use certain derivatives such as interest rate options, interest rate swaps, forward settlement contracts and Eurodollar futures, as well as principal-only and interest-only MBS and U.S. Treasuries to hedges certain market risks of MSRs. The notional amounts of the derivative contracts and principal underlying the other securities hedging the MSRs were $1.9 trillion and $29.4 billion at March 31, 2013 and $2.5 trillion and $31.3 billion at December 31, 2012. For the three months ended March 31, 2013, we recorded losses in mortgage banking income of $119 million related to the change in fair value of the derivative contracts and other securities used to hedge the market risks of the MSRs compared to losses of $458 million for the same period in 2012. For additional information on MSRs, see Note 19 – Mortgage Servicing Rights to the Consolidated Financial Statements and for more information on mortgage banking income, see CRES on page 30.
121
Compliance Risk Management |
The Global Compliance organization is responsible for overseeing compliance risk, which is the risk of legal or regulatory sanctions, material financial loss or damage to the reputation of the Corporation in the event of the failure of the Corporation to comply with requirements of applicable banking and financial services laws, rules and regulations, related self-regulatory organization standards, and codes of conduct. Compliance is at the core of the Corporation's culture and is a key component of risk management discipline.
The Global Compliance Framework details the high-level requirements of the global compliance program in one comprehensive document. The Global Compliance Framework also clearly defines roles and responsibilities and is supported by policies that articulate detailed requirements for implementation and execution of the global compliance program. As such, the Global Compliance Framework supports responsible, well-informed compliance risk management that incorporates an ongoing, disciplined approach to proactive planning, oversight, escalation and decision making across the Corporation.
The Global Compliance Framework also provides an outline for senior management and the Board, and/or appropriate Board level committee, such as the Audit Committee, to continue to leverage in conducting objective oversight of the Corporation's compliance risk management. The Board provides oversight of compliance risks through its Audit Committee.
Operational Risk Management |
The Corporation defines operational risk as the risk of loss resulting from inadequate or failed internal processes, people and systems or from external events. Operational risk may occur anywhere in the Corporation, including outsourced business processes, and is not limited to operations functions. Its effects may extend beyond financial losses. Operational risk includes legal risk. Successful operational risk management is particularly important to diversified financial services companies because of the nature, volume and complexity of the financial services business. Global banking guidelines and country-specific requirements for managing operational risk were established in Basel 2 which require that the Corporation has internal operational risk management processes to assess and measure operational risk exposure and to set aside appropriate capital to address those exposures.
For more information on our operational risk management activities, see page 120 of the MD&A of the Corporation's 2012 Annual Report on Form 10-K.
Complex Accounting Estimates |
Our significant accounting principles, as described in Note 1 – Summary of Significant Accounting Principles to the Consolidated Financial Statements of the Corporation's 2012 Annual Report on Form 10-K, are essential in understanding the MD&A. Many of our significant accounting principles require complex judgments to estimate the values of assets and liabilities. We have procedures and processes in place to facilitate making these judgments.
The more judgmental estimates impacting results for the three months ended March 31, 2013 are summarized in the following discussion. We have identified and described the development of the variables most important in the estimation processes that involve mathematical models to derive the estimates. In many cases, there are numerous alternative judgments that could be used in the process of determining the inputs to the models. Where alternatives exist, we have used the factors that we believe represent the most reasonable value in developing the inputs. Actual performance that differs from our estimates of the key variables could impact our results of operations. Separate from the possible future impact to our results of operations from input and model variables, the value of our lending portfolio and market-sensitive assets and liabilities may change subsequent to the balance sheet date, often significantly, due to the nature and magnitude of future credit and market conditions. Such credit and market conditions may change quickly and in unforeseen ways and the resulting volatility could have a significant, negative effect on future operating results. These fluctuations would not be indicative of deficiencies in our models or inputs.
For additional information, see Complex Accounting Estimates on page 121 of the MD&A of the Corporation's 2012 Annual Report on Form 10-K.
122
Level 3 Assets and Liabilities |
Financial assets and liabilities whose values are based on valuation techniques that require inputs that are both unobservable and are significant to the overall fair value measurement are classified as Level 3 under the fair value hierarchy established in applicable accounting guidance. The Level 3 financial assets and liabilities include certain loans, MBS, ABS, CDOs and structured liabilities, as well as highly structured, complex or long-dated derivative contracts, private equity investments and consumer MSRs. The fair value of these Level 3 financial assets and liabilities is determined using pricing models, discounted cash flow methodologies or similar techniques for which the determination of fair value requires significant management judgment or estimation.
Table 66 | |||||||||||||||||||
Level 3 Asset and Liability Summary | |||||||||||||||||||
March 31, 2013 |
December 31, 2012 |
||||||||||||||||||
(Dollars in millions) |
Level 3
Fair Value
|
As a %
of Total Level 3 Assets
|
As a %
of Total Assets
|
Level 3
Fair Value
|
As a %
of Total Level 3 Assets
|
As a %
of Total Assets
|
|||||||||||||
Trading account assets |
$ |
9,001 |
25.44 |
% |
0.41 |
% |
$ |
9,559 |
26.13 |
% |
0.43 |
% |
|||||||
Derivative assets |
8,011 |
22.64 |
0.37 |
8,073 |
22.06 |
0.37 |
|||||||||||||
AFS debt securities |
5,193 |
14.68 |
0.24 |
5,091 |
13.91 |
0.23 |
|||||||||||||
All other Level 3 assets at fair value |
13,173 |
37.24 |
0.61 |
13,865 |
37.90 |
0.63 |
|||||||||||||
Total Level 3 assets at fair value (1)
|
$ |
35,378 |
100.00 |
% |
1.63 |
% |
$ |
36,588 |
100.00 |
% |
1.66 |
% |
|||||||
|
Level 3
Fair Value
|
As a %
of Total Level 3 Liabilities
|
As a %
of Total Liabilities
|
Level 3
Fair Value
|
As a %
of Total Level 3 Liabilities
|
As a %
of Total Liabilities
|
||||||||||||||
Derivative liabilities |
$ |
6,948 |
70.78 |
% |
0.36 |
% |
$ |
6,605 |
73.51 |
% |
0.33 |
% |
|||||||
Long-term debt |
2,355 |
23.99 |
0.12 |
2,301 |
25.61 |
0.12 |
|||||||||||||
All other Level 3 liabilities at fair value |
513 |
5.23 |
0.03 |
79 |
0.88 |
0.01 |
|||||||||||||
Total Level 3 liabilities at fair value (1)
|
$ |
9,816 |
100.00 |
% |
0.51 |
% |
$ |
8,985 |
100.00 |
% |
0.46 |
% |
|||||||
(1) |
Level 3 total assets and liabilities are shown before the impact of counterparty netting related to our derivative positions. |
During the three months ended March 31, 2013, we recognized net gains of $675 million on Level 3 assets and liabilities. The net gains were primarily gains on trading account assets, net derivative assets and MSRs, offset by losses on other assets. Unrealized gains on trading account assets were primarily due to mark-to-market gains on collateralized loan obligation positions due to strong market conditions, as well as mark-to-market gains on secondary loan positions held in inventory. Unrealized gains on net derivative assets were primarily on IRLCs as higher rates resulted in lower valuations and production. Gains on MSRs were primarily due to the impact of the increase in interest rates on forecasted prepayments. Unrealized losses on other assets were primarily due to a write-down on a receivable. There were net unrealized gains of $9 million in accumulated OCI on Level 3 assets and liabilities at March 31, 2013. For additional information on the components of net realized and unrealized gains and losses during three months ended March 31, 2013, see Note 16 – Fair Value Measurements to the Consolidated Financial Statements.
Level 3 financial instruments, such as our consumer MSRs, may be hedged with derivatives classified as Level 1 or 2; therefore, gains or losses associated with Level 3 financial instruments may be offset by gains or losses associated with financial instruments classified in other levels of the fair value hierarchy. The Level 3 gains and losses recorded in earnings did not have a significant impact on our liquidity or capital resources.
We conduct a review of our fair value hierarchy classifications on a quarterly basis. Transfers into or out of Level 3 are made if the significant inputs used in the financial models measuring the fair values of the assets and liabilities became unobservable or observable, respectively, in the current marketplace. These transfers are considered to be effective as of the beginning of the quarter in which they occur. For additional information on the significant transfers into and out of Level 3 during the three months ended March 31, 2013, see Note 16 – Fair Value Measurements to the Consolidated Financial Statements.
123
Representations and Warranties |
The methodology used to estimate the liability for obligations under representations and warranties related to transfers of residential mortgage loans is a function of the representations and warranties given and considers a variety of factors. Depending upon the counterparty, these factors include actual defaults, estimated future defaults, historical loss experience, estimated home prices, other economic conditions, estimated probability that we will receive a repurchase request, including consideration of whether presentation thresholds will be met, number of payments made by the borrower prior to default and estimated probability that we will be required to repurchase a loan. It also considers other relevant facts and circumstances, such as bulk settlements and identity of the counterparty or type of counterparty, as appropriate. The estimate of the liability for obligations under representations and warranties is based upon currently available information, significant judgment, and a number of factors, including those set forth above, that are subject to change. Changes to any one of these factors could significantly impact the estimate of our liability.
The representations and warranties provision may vary significantly each period as the methodology used to estimate the expense continues to be refined based on the level and type of repurchase requests presented, defects identified, the latest experience gained on repurchase requests and other relevant facts and circumstances. The estimate of the liability for representations and warranties is sensitive to future defaults, loss severity and the net repurchase rate. An assumed simultaneous increase or decrease of 10 percent in estimated future defaults, loss severity and the net repurchase rate would result in an increase of approximately $700 million or decrease of approximately $600 million in the representations and warranties liability as of March 31, 2013. These sensitivities are hypothetical and are intended to provide an indication of the impact of a significant change in these key assumptions on the representations and warranties liability. In reality, changes in one assumption may result in changes in other assumptions, which may or may not counteract the sensitivity.
For additional information on representations and warranties exposure and the corresponding estimated range of possible loss, see Off-Balance Sheet Arrangements and Contractual Obligations – Representations and Warranties on page 45, as well as Note 8 – Representations and Warranties Obligations and Corporate Guarantees to the Consolidated Financial Statements herein and Note 13 – Commitments and Contingencies to the Consolidated Financial Statements of the Corporation's 2012 Annual Report on Form 10-K.
124
Glossary |
Alt-A Mortgage – A type of U.S. mortgage that, for various reasons, is considered riskier than A-paper, or "prime," and less risky than "subprime," the riskiest category. Alt-A interest rates, which are determined by credit risk, therefore tend to be between those of prime and subprime home loans. Typically, Alt-A mortgages are characterized by borrowers with less than full documentation, lower credit scores and higher LTVs.
Assets in Custody – Consist largely of custodial and non-discretionary trust assets excluding brokerage assets administered for clients. Trust assets encompass a broad range of asset types including real estate, private company ownership interest, personal property and investments.
Assets Under Management (AUM) – The total market value of assets under the investment advisory and discretion of GWIM which generate asset management fees based on a percentage of the assets' market values. AUM reflects assets that are generally managed for institutional, high net-worth and retail clients, and are distributed through various investment products including mutual funds, other commingled vehicles and separate accounts.
Carrying Value (with respect to loans) – The amount at which a loan is recorded on the balance sheet. For loans recorded at amortized cost, carrying value is the unpaid principal balance net of unamortized deferred loan origination fees and costs, and unamortized purchase premium or discount. For loans that are or have been on nonaccrual status, the carrying value is also reduced by any net charge-offs that have been recorded and the amount of interest payments applied as a reduction of principal under the cost recovery method. For PCI loans, the carrying value equals fair value upon acquisition adjusted for subsequent cash collections and yield accreted to date. For credit card loans, the carrying value also includes interest that has been billed to the customer. For loans classified as held-for-sale, carrying value is the lower of carrying value as described in the sentences above, or fair value. For loans for which we have elected the fair value option, the carrying value is fair value.
Client Brokerage Assets – Include client assets which are held in brokerage accounts. This includes non-discretionary brokerage and fee-based assets which generate brokerage income and asset management fee revenue.
Committed Credit Exposure – Includes any funded portion of a facility plus the unfunded portion of a facility on which the lender is legally bound to advance funds during a specified period under prescribed conditions.
Credit Derivatives – Contractual agreements that provide protection against a credit event on one or more referenced obligations. The nature of a credit event is established by the protection purchaser and protection seller at the inception of the transaction, and such events generally include bankruptcy or insolvency of the referenced credit entity, failure to meet payment obligations when due, as well as acceleration of indebtedness and payment repudiation or moratorium. The purchaser of the credit derivative pays a periodic fee in return for a payment by the protection seller upon the occurrence, if any, of such a credit event. A credit default swap is a type of a credit derivative.
Credit Valuation Adjustment (CVA) – A portfolio adjustment required to properly reflect the counterparty credit risk exposure as part of the fair value of derivative instruments.
Debit Valuation Adjustment (DVA) – A portfolio adjustment required to properly reflect the Corporation's own credit risk exposure as part of the fair value of derivative instruments.
Interest Rate Lock Commitment (IRLC) – Commitment with a loan applicant in which the loan terms, including interest rate and price, are guaranteed for a designated period of time subject to credit approval.
Letter of Credit – A document issued on behalf of a customer to a third party promising to pay the third party upon presentation of specified documents. A letter of credit effectively substitutes the issuer's credit for that of the customer.
Loan-to-value (LTV) – A commonly used credit quality metric that is reported in terms of ending and average LTV. Ending LTV is calculated as the outstanding carrying value of the loan at the end of the period divided by the estimated value of the property securing the loan. Estimated property values are primarily determined by utilizing the Case-Schiller Home Index, a widely used index based on data from repeat sales of single family homes. Case-Schiller indices are updated quarterly and are reported on a three-month or one-quarter lag. An additional metric related to LTV is combined loan-to-value (CLTV) which is similar to the LTV metric, yet combines the outstanding balance on the residential mortgage loan and the outstanding carrying value on the home equity loan or available line of credit, both of which are secured by the same property, divided by the estimated value of the property. A LTV of 100 percent reflects a loan that is currently secured by a property valued at an amount exactly equal to the carrying value or available line of the loan. Under certain circumstances, estimated values can also be determined by utilizing an automated valuation method (AVM) or Mortgage Risk
125
Assessment Corporation (MRAC) index. An AVM is a tool that estimates the value of a property by reference to large volumes of market data including sales of comparable properties and price trends specific to the MSA in which the property being valued is located. The MRAC index is similar to the Case-Schiller Home Index in that it is an index that is based on data from repeat sales of single family homes and is reported on a lag.
Margin Receivable – An extension of credit secured by eligible securities in certain brokerage accounts.
Matched Book – Repurchase and resale agreements and securities borrowed and loaned transactions entered into to accommodate customers and earn interest rate spreads.
Mortgage Servicing Right (MSR) – The right to service a mortgage loan when the underlying loan is sold or securitized. Servicing includes collections for principal, interest and escrow payments from borrowers and accounting for and remitting principal and interest payments to investors.
Net Interest Yield – Net interest income divided by average total interest-earning assets.
Nonperforming Loans and Leases – Includes loans and leases that have been placed on nonaccrual status, including nonaccruing loans whose contractual terms have been restructured in a manner that grants a concession to a borrower experiencing financial difficulties (TDRs). Loans accounted for under the fair value option, PCI loans and LHFS are not reported as nonperforming loans and leases. Consumer credit card loans, business card loans, consumer loans secured by personal property (except for certain secured consumer loans, including those that have been modified in a TDR), and consumer loans secured by real estate that are insured by the FHA or through long-term credit protection agreements with FNMA and FHLMC (fully-insured loan portfolio), are not placed on nonaccrual status and are, therefore, not reported as nonperforming loans and leases.
Purchased Credit-impaired (PCI) Loan – A loan purchased as an individual loan, in a portfolio of loans or in a business combination with evidence of deterioration in credit quality since origination for which it is probable, upon acquisition, that the investor will be unable to collect all contractually required payments. These loans are recorded at fair value upon acquisition.
Subprime Loans – Although a standard industry definition for subprime loans (including subprime mortgage loans) does not exist, the Corporation defines subprime loans as specific product offerings for higher risk borrowers, including individuals with one or a combination of high credit risk factors, such as low FICO scores, high debt to income ratios and inferior payment history.
Tier 1 Common Capital – Tier 1 capital less preferred stock, qualifying trust preferred securities, hybrid securities and qualifying noncontrolling interest in subsidiaries.
Troubled Debt Restructurings (TDRs) – Loans whose contractual terms have been restructured in a manner that grants a concession to a borrower experiencing financial difficulties. Certain consumer loans for which a binding offer to restructure has been extended are also classified as TDRs. Concessions could include a reduction in the interest rate to a rate that is below market on the loan, payment extensions, forgiveness of principal, forbearance, loans discharged in bankruptcy or other actions intended to maximize collection. Secured consumer loans that have been discharged in Chapter 7 bankruptcy and have not been reaffirmed by the borrower are classified as TDRs at the time of discharge from bankruptcy. TDRs are generally reported as nonperforming loans and leases while on nonaccrual status. Nonperforming TDRs may be returned to accrual status when, among other criteria, payment in full of all amounts due under the restructured terms is expected and the borrower has demonstrated a sustained period of repayment performance, typically six months. TDRs that are on accrual status are reported as performing TDRs through the end of the calendar year in which the restructuring occurred or the year in which they are returned to accrual status. In addition, if accruing TDRs bear less than a market rate of interest at the time of modification, they are reported as performing TDRs throughout their remaining lives unless and until they cease to perform in accordance with their modified contractual terms, at which time they would be placed on nonaccrual status and reported as nonperforming TDRs.
Value-at-Risk (VaR) – VaR is a model that simulates the value of a portfolio under a range of hypothetical scenarios in order to generate a distribution of potential gains and losses. VaR represents the loss the portfolio is expected to experience with a given confidence level based on historical data. A VaR model is an effective tool in estimating ranges of potential gains and losses on our trading portfolios.
126
Acronyms | ||
ABS |
Asset-backed securities |
|
AFS |
Available-for-sale |
|
ALM |
Asset and liability management |
|
ALMRC |
Asset Liability and Market Risk Committee |
|
ARM |
Adjustable-rate mortgage |
|
BHC |
Bank holding company |
|
CCAR |
Comprehensive Capital Analysis and Review |
|
CDO |
Collateralized debt obligation |
|
CLO |
Collateralized loan obligation |
|
CMBS |
Commercial mortgage-backed securities |
|
CRA |
Community Reinvestment Act |
|
CRC |
Credit Risk Committee |
|
EAD |
Exposure at default |
|
EU |
European Union |
|
FDIC |
Federal Deposit Insurance Corporation |
|
FHA |
Federal Housing Administration |
|
FHLMC |
Freddie Mac |
|
FICC |
Fixed income, currencies and commodities |
|
FICO |
Fair Isaac Corporation (credit score) |
|
FNMA |
Fannie Mae |
|
FTE |
Fully taxable-equivalent |
|
GAAP |
Accounting principles generally accepted in the United States of America |
|
GNMA |
Government National Mortgage Association |
|
GMRC |
Global Markets Risk Committee |
|
GSE |
Government-sponsored enterprise |
|
HELOC |
Home equity lines of credit |
|
HFI |
Held-for-investment |
|
HUD |
U.S. Department of Housing and Urban Development |
|
LCR |
Liquidity coverage ratio |
|
LGD |
Loss given default |
|
LHFS |
Loans held-for-sale |
|
LIBOR |
London InterBank Offered Rate |
|
MBS |
Mortgage-backed securities |
|
MD&A |
Management's Discussion and Analysis of Financial Condition and Results of Operations |
|
MI |
Mortgage insurance |
|
MSA |
Metropolitan statistical area |
|
NSFR |
Net stable funding ratio |
|
OCC |
Office of the Comptroller of the Currency |
|
OCI |
Other comprehensive income |
|
OTC |
Over-the-counter |
|
OTTI |
Other-than-temporary impairment |
|
PPI |
Payment protection insurance |
|
RMBS |
Residential mortgage-backed securities |
|
SBLCs |
Standby letters of credit |
|
SEC |
Securities and Exchange Commission |
|
VA |
U.S. Department of Veterans Affairs |
|
VIE |
Variable interest entity |
|
127
Item 3. QUANTITATIVE AND QUALITATIVE DISCLOSURES ABOUT MARKET RISK |
See Market Risk Management on page 113 in the MD&A and the sections referenced therein for Quantitative and Qualitative Disclosures about Market Risk.
Item 4. CONTROLS AND PROCEDURES |
Evaluation of Disclosure Controls and Procedures |
As of the end of the period covered by this report and pursuant to Rule 13a-15(b) of the Securities Exchange Act of 1934 (Exchange Act), the Corporation's management, including the Chief Executive Officer and Chief Financial Officer, conducted an evaluation of the effectiveness and design of the Corporation's disclosure controls and procedures (as that term is defined in Rule 13a-15(e) of the Exchange Act). Based upon that evaluation, the Corporation's Chief Executive Officer and Chief Financial Officer concluded that the Corporation's disclosure controls and procedures were effective, as of the end of the period covered by this report, in recording, processing, summarizing and reporting information required to be disclosed by the Corporation in reports that it files or submits under the Exchange Act, within the time periods specified in the Securities and Exchange Commission's rules and forms.
Changes in Internal Controls |
There have been no changes in the Corporation's internal control over financial reporting (as defined in Rule 13a-15(f) of the Exchange Act) during the three months ended March 31, 2013 that have materially affected or are reasonably likely to materially affect the Corporation's internal control over financial reporting.
128
Part I. FINANCIAL INFORMATION |
|||||||
Item 1. FINANCIAL STATEMENTS |
|||||||
Bank of America Corporation and Subsidiaries |
|||||||
Consolidated Statement of Income |
|||||||
Three Months Ended March 31 |
|||||||
(Dollars in millions, except per share information) |
2013 |
2012 |
|||||
Interest income |
|||||||
Loans and leases |
$ |
9,178 |
$ |
10,173 |
|||
Debt securities |
2,549 |
2,746 |
|||||
Federal funds sold and securities borrowed or purchased under agreements to resell |
315 |
460 |
|||||
Trading account assets |
1,337 |
1,352 |
|||||
Other interest income |
722 |
730 |
|||||
Total interest income |
14,101 |
15,461 |
|||||
Interest expense |
|||||||
Deposits |
382 |
549 |
|||||
Short-term borrowings |
749 |
881 |
|||||
Trading account liabilities |
472 |
477 |
|||||
Long-term debt |
1,834 |
2,708 |
|||||
Total interest expense |
3,437 |
4,615 |
|||||
Net interest income |
10,664 |
10,846 |
|||||
Noninterest income |
|||||||
Card income |
1,410 |
1,457 |
|||||
Service charges |
1,799 |
1,912 |
|||||
Investment and brokerage services |
3,027 |
2,876 |
|||||
Investment banking income |
1,535 |
1,217 |
|||||
Equity investment income |
563 |
765 |
|||||
Trading account profits |
2,989 |
2,075 |
|||||
Mortgage banking income |
1,263 |
1,612 |
|||||
Gains on sales of debt securities |
68 |
752 |
|||||
Other loss |
(112 |
) |
(1,194 |
) |
|||
Other-than-temporary impairment losses on available-for-sale debt securities: |
|||||||
Total other-than-temporary impairment losses |
(14 |
) |
(51 |
) |
|||
Less: Portion of other-than-temporary impairment losses recognized in other comprehensive income |
5 |
11 |
|||||
Net impairment losses recognized in earnings on available-for-sale debt securities |
(9 |
) |
(40 |
) |
|||
Total noninterest income |
12,533 |
11,432 |
|||||
Total revenue, net of interest expense |
23,197 |
22,278 |
|||||
Provision for credit losses |
1,713 |
2,418 |
|||||
Noninterest expense |
|||||||
Personnel |
9,891 |
10,188 |
|||||
Occupancy |
1,154 |
1,142 |
|||||
Equipment |
550 |
611 |
|||||
Marketing |
429 |
465 |
|||||
Professional fees |
649 |
783 |
|||||
Amortization of intangibles |
276 |
319 |
|||||
Data processing |
812 |
856 |
|||||
Telecommunications |
409 |
400 |
|||||
Other general operating |
5,330 |
4,377 |
|||||
Total noninterest expense |
19,500 |
19,141 |
|||||
Income before income taxes |
1,984 |
719 |
|||||
Income tax expense |
501 |
66 |
|||||
Net income |
$ |
1,483 |
$ |
653 |
|||
Preferred stock dividends |
373 |
325 |
|||||
Net income applicable to common shareholders |
$ |
1,110 |
$ |
328 |
|||
Per common share information |
|||||||
Earnings |
$ |
0.10 |
$ |
0.03 |
|||
Diluted earnings |
0.10 |
0.03 |
|||||
Dividends paid |
0.01 |
0.01 |
|||||
Average common shares issued and outstanding (in thousands) |
10,798,975 |
10,651,367 |
|||||
Average diluted common shares issued and outstanding (in thousands) |
11,154,778 |
10,761,917 |
|||||
See accompanying Notes to Consolidated Financial Statements.
129
|
Bank of America Corporation and Subsidiaries
Consolidated Statement of Comprehensive Income
| |||||||
Three Months Ended March 31 |
|||||||
(Dollars in millions) |
2013 |
2012 |
|||||
Net income |
$ |
1,483 |
$ |
653 |
|||
Other comprehensive income, net-of-tax: |
|||||||
Net change in available-for-sale debt and marketable equity securities |
(906 |
) |
(924 |
) |
|||
Net change in derivatives |
172 |
382 |
|||||
Employee benefit plan adjustments |
85 |
952 |
|||||
Net change in foreign currency translation adjustments |
(42 |
) |
31 |
||||
Other comprehensive income (loss) |
(691 |
) |
441 |
||||
Comprehensive income |
$ |
792 |
$ |
1,094 |
|||
See accompanying Notes to Consolidated Financial Statements.
130
|
Bank of America Corporation and Subsidiaries
Consolidated Balance Sheet
| |||||||
(Dollars in millions) |
March 31 2013 |
December 31 2012 |
|||||
Assets |
|||||||
Cash and cash equivalents |
$ |
100,980 |
$ |
110,752 |
|||
Time deposits placed and other short-term investments |
12,740 |
18,694 |
|||||
Federal funds sold and securities borrowed or purchased under agreements to resell (includes $94,673 and $98,670 measured at fair value)
|
220,623 |
219,924 |
|||||
Trading account assets (includes $107,363 and $115,821 pledged as collateral)
|
223,028 |
227,775 |
|||||
Derivative assets |
52,247 |
53,497 |
|||||
Debt securities: |
|||||||
Carried at fair value (includes $54,457 and $63,349 pledged as collateral)
|
305,132 |
310,850 |
|||||
Held-to-maturity, at cost (fair value – $49,774 and $50,270; $21,491 and $22,461 pledged as collateral)
|
49,577 |
49,481 |
|||||
Total debt securities |
354,709 |
360,331 |
|||||
Loans and leases (includes $8,820 and $9,002 measured at fair value and $70,982 and $50,289 pledged as collateral)
|
911,592 |
907,819 |
|||||
Allowance for loan and lease losses |
(22,441 |
) |
(24,179 |
) |
|||
Loans and leases, net of allowance |
889,151 |
883,640 |
|||||
Premises and equipment, net |
11,085 |
11,858 |
|||||
Mortgage servicing rights (includes $5,776 and $5,716 measured at fair value)
|
5,896 |
5,851 |
|||||
Goodwill |
69,930 |
69,976 |
|||||
Intangible assets |
6,379 |
6,684 |
|||||
Loans held-for-sale (includes $13,887 and $11,659 measured at fair value)
|
19,278 |
19,413 |
|||||
Customer and other receivables |
70,981 |
71,467 |
|||||
Other assets (includes $23,243 and $26,490 measured at fair value)
|
137,792 |
150,112 |
|||||
Total assets |
$ |
2,174,819 |
$ |
2,209,974 |
|||
Assets of consolidated variable interest entities included in total assets above (isolated to settle the liabilities of the variable interest entities) | |||||||
Trading account assets |
$ |
9,113 |
$ |
7,906 |
|||
Derivative assets |
187 |
333 |
|||||
Loans and leases |
116,236 |
123,227 |
|||||
Allowance for loan and lease losses |
(3,310 |
) |
(3,658 |
) |
|||
Loans and leases, net of allowance |
112,926 |
119,569 |
|||||
Loans held-for-sale |
3,229 |
1,969 |
|||||
All other assets |
4,728 |
4,654 |
|||||
Total assets of consolidated variable interest entities |
$ |
130,183 |
$ |
134,431 |
|||
See accompanying Notes to Consolidated Financial Statements.
131
|
Bank of America Corporation and Subsidiaries
Consolidated Balance Sheet (continued)
| |||||||
(Dollars in millions) |
March 31 2013 |
December 31 2012 |
|||||
Liabilities |
|||||||
Deposits in U.S. offices: |
|||||||
Noninterest-bearing |
$ |
357,623 |
$ |
372,546 |
|||
Interest-bearing (includes $2,130 and $2,262 measured at fair value)
|
661,930 |
654,332 |
|||||
Deposits in non-U.S. offices: |
|||||||
Noninterest-bearing |
7,177 |
7,573 |
|||||
Interest-bearing |
68,453 |
70,810 |
|||||
Total deposits |
1,095,183 |
1,105,261 |
|||||
Federal funds purchased and securities loaned or sold under agreements to repurchase (includes $47,842 and $42,639 measured at fair value)
|
248,149 |
293,259 |
|||||
Trading account liabilities |
90,547 |
73,587 |
|||||
Derivative liabilities |
47,825 |
46,016 |
|||||
Short-term borrowings (includes $3,168 and $4,074 measured at fair value)
|
42,148 |
30,731 |
|||||
Accrued expenses and other liabilities (includes $14,285 and $16,594 measured at fair value and $486 and $513 of reserve for unfunded lending commitments)
|
134,033 |
148,579 |
|||||
Long-term debt (includes $52,361 and $49,161 measured at fair value)
|
279,641 |
275,585 |
|||||
Total liabilities |
1,937,526 |
1,973,018 |
|||||
Commitments and contingencies (Note 7 – Securitizations and Other Variable Interest Entities, Note 8 – Representations and Warranties Obligations and Corporate Guarantees and Note 11 – Commitments and Contingencies)
|
|||||||
Shareholders' equity |
|||||||
Preferred stock, $0.01 par value; authorized – 100,000,000 shares; issued and outstanding – 3,685,410 shares
|
18,780 |
18,768 |
|||||
Common stock and additional paid-in capital, $0.01 par value; authorized – 12,800,000,000 shares; issued and outstanding – 10,822,379,936 and 10,778,263,628 shares
|
158,157 |
158,142 |
|||||
Retained earnings |
63,844 |
62,843 |
|||||
Accumulated other comprehensive income (loss) |
(3,488 |
) |
(2,797 |
) |
|||
Total shareholders' equity |
237,293 |
236,956 |
|||||
Total liabilities and shareholders' equity |
$ |
2,174,819 |
$ |
2,209,974 |
|||
Liabilities of consolidated variable interest entities included in total liabilities above |
|||||||
Short-term borrowings (includes $784 and $872 of non-recourse liabilities)
|
$ |
2,539 |
$ |
3,731 |
|||
Long-term debt (includes $26,647 and $29,476 of non-recourse debt)
|
31,461 |
34,256 |
|||||
All other liabilities (includes $140 and $149 of non-recourse liabilities)
|
345 |
360 |
|||||
Total liabilities of consolidated variable interest entities |
$ |
34,345 |
$ |
38,347 |
|||
See accompanying Notes to Consolidated Financial Statements.
132
|
Bank of America Corporation and Subsidiaries
Consolidated Statement of Changes in Shareholders' Equity
|
|||||||||||||||||
Preferred Stock |
Common Stock and Additional Paid-in Capital |
Retained Earnings |
Accumulated Other Comprehensive Income (Loss) |
Total Shareholders' Equity |
|||||||||||||
(Dollars in millions, shares in thousands) |
Shares |
Amount |
|||||||||||||||
Balance, December 31, 2011 |
$ |
18,397 |
10,535,938 |
$ |
156,621 |
$ |
60,520 |
$ |
(5,437 |
) |
$ |
230,101 |
|||||
Net income |
653 |
653 |
|||||||||||||||
Net change in available-for-sale debt and marketable equity securities |
(924 |
) |
(924 |
) |
|||||||||||||
Net change in derivatives |
382 |
382 |
|||||||||||||||
Employee benefit plan adjustments |
952 |
952 |
|||||||||||||||
Net change in foreign currency translation adjustments |
31 |
31 |
|||||||||||||||
Dividends paid: |
|||||||||||||||||
Common |
(114 |
) |
(114 |
) |
|||||||||||||
Preferred |
(369 |
) |
(369 |
) |
|||||||||||||
Issuance of preferred stock |
687 |
687 |
|||||||||||||||
Common stock issued in connection with exchanges of preferred stock and trust preferred securities |
(296 |
) |
49,867 |
412 |
44 |
160 |
|||||||||||
Common stock issued under employee plans and related tax effects |
189,799 |
940 |
940 |
||||||||||||||
Balance, March 31, 2012 |
$ |
18,788 |
10,775,604 |
$ |
157,973 |
$ |
60,734 |
$ |
(4,996 |
) |
$ |
232,499 |
|||||
Balance, December 31, 2012 |
$ |
18,768 |
10,778,264 |
$ |
158,142 |
$ |
62,843 |
$ |
(2,797 |
) |
$ |
236,956 |
|||||
Net income |
1,483 |
1,483 |
|||||||||||||||
Net change in available-for-sale debt and marketable equity securities |
(906 |
) |
(906 |
) |
|||||||||||||
Net change in derivatives |
172 |
172 |
|||||||||||||||
Employee benefit plan adjustments |
85 |
85 |
|||||||||||||||
Net change in foreign currency translation adjustments |
(42 |
) |
(42 |
) |
|||||||||||||
Dividends paid: |
|||||||||||||||||
Common |
(109 |
) |
(109 |
) |
|||||||||||||
Preferred |
(373 |
) |
(373 |
) |
|||||||||||||
Net issuance of preferred stock |
12 |
12 |
|||||||||||||||
Common stock issued under employee plans and related tax effects |
44,116 |
15 |
15 |
||||||||||||||
Balance, March 31, 2013 |
$ |
18,780 |
10,822,380 |
$ |
158,157 |
$ |
63,844 |
$ |
(3,488 |
) |
$ |
237,293 |
|||||
See accompanying Notes to Consolidated Financial Statements.
133
|
Bank of America Corporation and Subsidiaries
Consolidated Statement of Cash Flows
| |||||||
Three Months Ended March 31 |
|||||||
(Dollars in millions) |
2013 |
2012 |
|||||
Operating activities |
|||||||
Net income |
$ |
1,483 |
$ |
653 |
|||
Reconciliation of net income to net cash provided by (used in) operating activities: |
|||||||
Provision for credit losses |
1,713 |
2,418 |
|||||
Gains on sales of debt securities |
(68 |
) |
(752 |
) |
|||
Fair value adjustments on structured liabilities |
90 |
3,314 |
|||||
Depreciation and premises improvements amortization |
411 |
468 |
|||||
Amortization of intangibles |
276 |
319 |
|||||
Net amortization of premium/discount on debt securities |
340 |
161 |
|||||
Deferred income taxes |
(146 |
) |
(195 |
) |
|||
Originations and purchases of loans held-for-sale |
(20,060 |
) |
(10,516 |
) |
|||
Proceeds from sales, securitizations and paydowns of loans held-for-sale |
21,266 |
10,044 |
|||||
Net (increase) decrease in trading and derivative instruments |
22,642 |
(27,168 |
) |
||||
Net (increase) decrease in other assets |
11,028 |
(10,709 |
) |
||||
Net increase (decrease) in accrued expenses and other liabilities |
(14,528 |
) |
12,150 |
||||
Other operating activities, net |
2,021 |
4,210 |
|||||
Net cash provided by (used in) operating activities |
26,468 |
(15,603 |
) |
||||
Investing activities |
|||||||
Net decrease in time deposits placed and other short-term investments |
5,954 |
5,525 |
|||||
Net increase in federal funds sold and securities borrowed or purchased under agreements to resell |
(699 |
) |
(14,601 |
) |
|||
Proceeds from sales of debt securities carried at fair value |
15,375 |
26,594 |
|||||
Proceeds from paydowns and maturities of debt securities carried at fair value |
21,455 |
15,804 |
|||||
Purchases of debt securities carried at fair value |
(33,577 |
) |
(66,902 |
) |
|||
Proceeds from paydowns and maturities of held-to-maturity debt securities |
2,567 |
972 |
|||||
Purchases of held-to-maturity debt securities |
(2,713 |
) |
— |
||||
Proceeds from sales of loans and leases |
751 |
487 |
|||||
Purchases of loans and leases |
(9,089 |
) |
(499 |
) |
|||
Other changes in loans and leases, net |
719 |
20,537 |
|||||
Net sales of premises and equipment |
55 |
65 |
|||||
Proceeds from sales of foreclosed properties |
262 |
772 |
|||||
Proceeds from sales of investments |
674 |
— |
|||||
Other investing activities, net |
(64 |
) |
(160 |
) |
|||
Net cash provided by (used in) investing activities |
1,670 |
(11,406 |
) |
||||
Financing activities |
|||||||
Net increase (decrease) in deposits |
(10,078 |
) |
8,270 |
||||
Net increase (decrease) in federal funds purchased and securities loaned or sold under agreements to repurchase |
(45,110 |
) |
43,627 |
||||
Net increase in short-term borrowings |
11,467 |
3,506 |
|||||
Proceeds from issuance of long-term debt |
20,194 |
10,275 |
|||||
Retirement of long-term debt |
(12,556 |
) |
(30,770 |
) |
|||
Proceeds from issuance of preferred stock |
12 |
687 |
|||||
Cash dividends paid |
(482 |
) |
(483 |
) |
|||
Excess tax benefits on share-based payments |
12 |
10 |
|||||
Other financing activities, net |
(11 |
) |
17 |
||||
Net cash provided by (used in) financing activities |
(36,552 |
) |
35,139 |
||||
Effect of exchange rate changes on cash and cash equivalents |
(1,358 |
) |
560 |
||||
Net increase (decrease) in cash and cash equivalents |
(9,772 |
) |
8,690 |
||||
Cash and cash equivalents at January 1 |
110,752 |
120,102 |
|||||
Cash and cash equivalents at March 31 |
$ |
100,980 |
$ |
128,792 |
|||
See accompanying Notes to Consolidated Financial Statements.
134
|
Bank of America Corporation and Subsidiaries
Notes to Consolidated Financial Statements
|
NOTE 1 – Summary of Significant Accounting Principles |
Bank of America Corporation (together with its consolidated subsidiaries, the Corporation), a bank holding company and a financial holding company, provides a diverse range of financial services and products throughout the U.S. and in certain international markets. The term "the Corporation" as used herein may refer to Bank of America Corporation individually, Bank of America Corporation and its subsidiaries, or certain of Bank of America Corporation's subsidiaries or affiliates.
The Corporation conducts its activities through banking and nonbanking subsidiaries. The Corporation operates its banking activities primarily under two charters: Bank of America, National Association (Bank of America, N.A. or BANA) and FIA Card Services, National Association (FIA Card Services, N.A. or FIA).
Principles of Consolidation and Basis of Presentation |
The Consolidated Financial Statements include the accounts of the Corporation and its majority-owned subsidiaries, and those variable interest entities (VIEs) where the Corporation is the primary beneficiary. Intercompany accounts and transactions have been eliminated. Results of operations of acquired companies are included from the dates of acquisition and for VIEs, from the dates that the Corporation became the primary beneficiary. Assets held in an agency or fiduciary capacity are not included in the Consolidated Financial Statements. The Corporation accounts for investments in companies for which it owns a voting interest and for which it has the ability to exercise significant influence over operating and financing decisions using the equity method of accounting or at fair value under the fair value option. These investments are included in other assets. Equity method investments are subject to impairment testing and the Corporation's proportionate share of income or loss is included in equity investment income.
The preparation of the Consolidated Financial Statements in conformity with accounting principles generally accepted in the United States of America requires management to make estimates and assumptions that affect reported amounts and disclosures. Realized results could differ from those estimates and assumptions.
These unaudited Consolidated Financial Statements should be read in conjunction with the audited Consolidated Financial Statements of the Corporation's 2012 Annual Report on Form 10-K. The nature of the Corporation's business is such that the results of any interim period are not necessarily indicative of results for a full year. In the opinion of management, all adjustments, which consist of normal recurring adjustments necessary for a fair statement of the interim period results have been made. The Corporation evaluates subsequent events through the date of filing with the Securities and Exchange Commission (SEC). Certain prior period amounts have been reclassified to conform to current period presentation.
New Accounting Pronouncements |
Effective January 1, 2013, the Corporation retrospectively adopted new accounting guidance from the Financial Accounting Standards Board (FASB) requiring additional disclosures on the effect of netting arrangements on an entity's financial position. The disclosures relate to derivatives and securities financing agreements that are either offset on the balance sheet under existing accounting guidance or are subject to a legally enforceable master netting or similar agreement. This new guidance addresses only disclosures, and accordingly, did not have any impact on the Corporation's consolidated financial position or results of operations. For the related disclosures, see Note 3 – Derivatives and Note 10 – Federal Funds Sold, Securities Financing Agreements and Short-term Borrowings.
Effective January 1, 2013, the Corporation adopted new accounting guidance on the presentation of comprehensive income by reporting the amounts reclassified out of each component of accumulated other comprehensive income (OCI) based on its source and the income statement line items affected by the reclassifications. For the table and related information, see Note 13 – Accumulated Other Comprehensive Income (Loss).
In December 2012, the FASB issued a proposed standard on accounting for expected credit losses. It would replace multiple existing impairment models, including an "incurred loss" model for loans, with an "expected credit loss" model. The FASB announced it would establish the effective date when it issues the final standard. The Corporation cannot predict at this time whether or when a final standard will be issued, when it will be effective or what its final provisions will be. It is possible that the final standard could have a material adverse impact on the Corporation's results of operations once it is issued and becomes effective.
135
Accounting Policies |
All significant accounting policies are discussed either in this Note, in Note 1 – Summary of Significant Accounting Principles to the Consolidated Financial Statements of the Corporation's 2012 Annual Report on Form 10-K or are included in the Notes herein listed below.
INDEX |
Page |
Note 3 – Derivatives |
|
Note 4 – Securities |
|
Note 5 – Outstanding Loans and Leases |
|
Note 7 – Securitizations and Other Variable Interest Entities |
|
Note 8 – Representations and Warranties Obligations and Corporate Guarantees |
|
Note 11 – Commitments and Contingencies |
|
Note 15 – Pension, Postretirement and Certain Compensation Plans |
|
Note 16 – Fair Value Measurements |
|
Note 19 – Mortgage Servicing Rights |
|
NOTE 2 – Trading Account Assets and Liabilities |
The table below presents the components of trading account assets and liabilities at March 31, 2013 and December 31, 2012.
(Dollars in millions) |
March 31 2013 |
December 31 2012 |
|||||
Trading account assets |
|||||||
U.S. government and agency securities (1)
|
$ |
72,878 |
$ |
86,974 |
|||
Corporate securities, trading loans and other |
39,183 |
37,900 |
|||||
Equity securities |
45,863 |
43,315 |
|||||
Non-U.S. sovereign debt |
48,634 |
42,746 |
|||||
Mortgage trading loans and asset-backed securities |
16,470 |
16,840 |
|||||
Total trading account assets |
$ |
223,028 |
$ |
227,775 |
|||
Trading account liabilities |
|||||||
U.S. government and agency securities |
$ |
25,764 |
$ |
23,430 |
|||
Equity securities |
24,749 |
22,492 |
|||||
Non-U.S. sovereign debt |
29,377 |
20,244 |
|||||
Corporate securities and other |
10,657 |
7,421 |
|||||
Total trading account liabilities |
$ |
90,547 |
$ |
73,587 |
|||
(1) |
Includes $25.5 billion and $30.6 billion of government-sponsored enterprise obligations at March 31, 2013 and December 31, 2012.
|
136
NOTE 3 – Derivatives |
Derivative Balances |
Derivatives are entered into on behalf of customers, for trading, or to support risk management activities. Derivatives used in risk management activities include derivatives that may or may not be designated in qualifying hedge accounting relationships. Derivatives that are not designated in qualifying hedge accounting relationships are referred to as other risk management derivatives. For additional information on the Corporation's derivatives and hedging activities, see Note 1 – Summary of Significant Accounting Principles to the Consolidated Financial Statements of the Corporation's 2012 Annual Report on Form 10-K. The following tables present derivative instruments included on the Consolidated Balance Sheet in derivative assets and liabilities at March 31, 2013 and December 31, 2012. Balances are presented on a gross basis, prior to the application of counterparty and cash collateral netting. Total derivative assets and liabilities are adjusted on an aggregate basis to take into consideration the effects of legally enforceable master netting agreements and have been reduced by the cash collateral received or paid.
March 31, 2013 |
|||||||||||||||||||||||||||
Gross Derivative Assets |
Gross Derivative Liabilities |
||||||||||||||||||||||||||
(Dollars in billions) |
Contract/
Notional (1)
|
Trading Derivatives and Other Risk Management Derivatives |
Qualifying
Accounting Hedges
|
Total |
Trading Derivatives and Other Risk Management Derivatives |
Qualifying
Accounting Hedges
|
Total |
||||||||||||||||||||
Interest rate contracts |
|||||||||||||||||||||||||||
Swaps |
$ |
33,883.6 |
$ |
920.0 |
$ |
12.6 |
$ |
932.6 |
$ |
910.1 |
$ |
2.8 |
$ |
912.9 |
|||||||||||||
Futures and forwards |
12,220.8 |
2.1 |
— |
2.1 |
2.1 |
— |
2.1 |
||||||||||||||||||||
Written options |
2,224.1 |
— |
— |
— |
93.8 |
— |
93.8 |
||||||||||||||||||||
Purchased options |
2,147.3 |
94.7 |
— |
94.7 |
— |
— |
— |
||||||||||||||||||||
Foreign exchange contracts |
|||||||||||||||||||||||||||
Swaps |
2,349.4 |
42.2 |
1.2 |
43.4 |
46.6 |
2.3 |
48.9 |
||||||||||||||||||||
Spot, futures and forwards |
2,747.7 |
29.3 |
0.9 |
30.2 |
29.6 |
0.5 |
30.1 |
||||||||||||||||||||
Written options |
526.3 |
— |
— |
— |
9.6 |
— |
9.6 |
||||||||||||||||||||
Purchased options |
476.0 |
8.8 |
— |
8.8 |
— |
— |
— |
||||||||||||||||||||
Equity contracts |
|||||||||||||||||||||||||||
Swaps |
137.0 |
2.3 |
— |
2.3 |
2.3 |
— |
2.3 |
||||||||||||||||||||
Futures and forwards |
68.6 |
1.2 |
— |
1.2 |
1.2 |
— |
1.2 |
||||||||||||||||||||
Written options |
335.2 |
— |
— |
— |
23.7 |
— |
23.7 |
||||||||||||||||||||
Purchased options |
314.0 |
22.9 |
— |
22.9 |
— |
— |
— |
||||||||||||||||||||
Commodity contracts |
|||||||||||||||||||||||||||
Swaps |
73.6 |
3.0 |
— |
3.0 |
4.2 |
— |
4.2 |
||||||||||||||||||||
Futures and forwards |
555.8 |
5.5 |
— |
5.5 |
3.5 |
— |
3.5 |
||||||||||||||||||||
Written options |
206.1 |
— |
— |
— |
7.3 |
— |
7.3 |
||||||||||||||||||||
Purchased options |
213.8 |
7.2 |
— |
7.2 |
— |
— |
— |
||||||||||||||||||||
Credit derivatives |
|||||||||||||||||||||||||||
Purchased credit derivatives: |
|||||||||||||||||||||||||||
Credit default swaps |
1,610.7 |
32.7 |
— |
32.7 |
22.8 |
— |
22.8 |
||||||||||||||||||||
Total return swaps/other |
44.4 |
2.2 |
— |
2.2 |
2.9 |
— |
2.9 |
||||||||||||||||||||
Written credit derivatives: |
|||||||||||||||||||||||||||
Credit default swaps |
1,581.3 |
23.7 |
— |
23.7 |
29.7 |
— |
29.7 |
||||||||||||||||||||
Total return swaps/other |
73.9 |
2.2 |
— |
2.2 |
0.4 |
— |
0.4 |
||||||||||||||||||||
Gross derivative assets/liabilities |
$ |
1,200.0 |
$ |
14.7 |
$ |
1,214.7 |
$ |
1,189.8 |
$ |
5.6 |
$ |
1,195.4 |
|||||||||||||||
Less: Legally enforceable master netting agreements |
(1,104.8 |
) |
(1,104.8 |
) |
|||||||||||||||||||||||
Less: Cash collateral received/paid |
(57.7 |
) |
(42.8 |
) |
|||||||||||||||||||||||
Total derivative assets/liabilities |
$ |
52.2 |
$ |
47.8 |
|||||||||||||||||||||||
(1) |
Represents the total contract/notional amount of derivative assets and liabilities outstanding. |
137
December 31, 2012 |
|||||||||||||||||||||||||||
Gross Derivative Assets |
Gross Derivative Liabilities |
||||||||||||||||||||||||||
(Dollars in billions) |
Contract/
Notional (1)
|
Trading Derivatives and Other Risk Management Derivatives |
Qualifying
Accounting Hedges
|
Total |
Trading Derivatives and Other Risk Management Derivatives |
Qualifying
Accounting Hedges
|
Total |
||||||||||||||||||||
Interest rate contracts |
|||||||||||||||||||||||||||
Swaps |
$ |
34,667.4 |
$ |
1,075.4 |
$ |
13.8 |
$ |
1,089.2 |
$ |
1,062.6 |
$ |
4.7 |
$ |
1,067.3 |
|||||||||||||
Futures and forwards |
11,950.5 |
2.8 |
— |
2.8 |
2.7 |
— |
2.7 |
||||||||||||||||||||
Written options |
2,343.5 |
— |
— |
— |
106.0 |
— |
106.0 |
||||||||||||||||||||
Purchased options |
2,162.6 |
105.5 |
— |
105.5 |
— |
— |
— |
||||||||||||||||||||
Foreign exchange contracts |
|||||||||||||||||||||||||||
Swaps |
2,489.0 |
47.4 |
1.4 |
48.8 |
53.2 |
1.8 |
55.0 |
||||||||||||||||||||
Spot, futures and forwards |
3,023.0 |
31.5 |
0.4 |
31.9 |
30.5 |
0.8 |
31.3 |
||||||||||||||||||||
Written options |
363.3 |
— |
— |
— |
7.3 |
— |
7.3 |
||||||||||||||||||||
Purchased options |
321.8 |
6.5 |
— |
6.5 |
— |
— |
— |
||||||||||||||||||||
Equity contracts |
|||||||||||||||||||||||||||
Swaps |
127.1 |
1.6 |
— |
1.6 |
2.0 |
— |
2.0 |
||||||||||||||||||||
Futures and forwards |
58.4 |
1.0 |
— |
1.0 |
1.0 |
— |
1.0 |
||||||||||||||||||||
Written options |
295.3 |
— |
— |
— |
20.2 |
— |
20.2 |
||||||||||||||||||||
Purchased options |
271.0 |
20.4 |
— |
20.4 |
— |
— |
— |
||||||||||||||||||||
Commodity contracts |
|||||||||||||||||||||||||||
Swaps |
60.5 |
2.5 |
0.1 |
2.6 |
4.0 |
— |
4.0 |
||||||||||||||||||||
Futures and forwards |
498.9 |
4.8 |
— |
4.8 |
2.7 |
— |
2.7 |
||||||||||||||||||||
Written options |
166.4 |
— |
— |
— |
7.4 |
— |
7.4 |
||||||||||||||||||||
Purchased options |
168.2 |
7.1 |
— |
7.1 |
— |
— |
— |
||||||||||||||||||||
Credit derivatives |
|||||||||||||||||||||||||||
Purchased credit derivatives: |
|||||||||||||||||||||||||||
Credit default swaps |
1,559.5 |
35.6 |
— |
35.6 |
22.1 |
— |
22.1 |
||||||||||||||||||||
Total return swaps/other |
43.5 |
2.5 |
— |
2.5 |
2.9 |
— |
2.9 |
||||||||||||||||||||
Written credit derivatives: |
|||||||||||||||||||||||||||
Credit default swaps |
1,531.5 |
23.0 |
— |
23.0 |
32.6 |
— |
32.6 |
||||||||||||||||||||
Total return swaps/other |
68.8 |
0.2 |
— |
0.2 |
0.3 |
— |
0.3 |
||||||||||||||||||||
Gross derivative assets/liabilities |
$ |
1,367.8 |
$ |
15.7 |
$ |
1,383.5 |
$ |
1,357.5 |
$ |
7.3 |
$ |
1,364.8 |
|||||||||||||||
Less: Legally enforceable master netting agreements |
(1,271.9 |
) |
(1,271.9 |
) |
|||||||||||||||||||||||
Less: Cash collateral received/paid |
(58.1 |
) |
(46.9 |
) |
|||||||||||||||||||||||
Total derivative assets/liabilities |
$ |
53.5 |
$ |
46.0 |
|||||||||||||||||||||||
(1) |
Represents the total contract/notional amount of derivative assets and liabilities outstanding. |
Offsetting of Derivatives |
The Corporation enters into International Swaps and Derivatives Association, Inc. (ISDA) master netting agreements or similar agreements with substantially all of the Corporation's derivative counterparties. These legally enforceable master netting agreements give the Corporation, in the event of default by the counterparty, the right to liquidate securities held as collateral and to offset receivables and payables with the same counterparty. For purposes of the Consolidated Balance Sheet, the Corporation offsets derivative assets and liabilities and cash collateral held with the same counterparty where it has such a legally enforceable master netting agreement.
138
The following table presents derivative instruments included in derivative assets and liabilities on the Consolidated Balance Sheet at March 31, 2013 and December 31, 2012 by primary risk (e.g., interest rate risk) and the platform, where applicable, on which these derivatives are transacted. Exchange-traded derivatives include listed options transacted on an exchange. Over-the-counter (OTC) derivatives include bilateral transactions between the Corporation and a particular counterparty. OTC cleared derivatives include bilateral transactions between the Corporation and a counterparty where the transaction is cleared through a clearinghouse. Balances are presented on a gross basis, prior to the application of counterparty and cash collateral netting. Total gross derivative assets and liabilities are adjusted on an aggregate basis to take into consideration the effects of legally enforceable master netting agreements and have been reduced by the cash collateral received or paid.
Other gross derivative assets and liabilities in the table represent derivatives entered into under master netting agreements where the enforceability of these agreements under bankruptcy laws in some countries or industries is not certain, and accordingly, receivables and payables with counterparties in these countries or industries are reported on a gross basis.
Also included in the table is financial instrument collateral related to legally enforceable master netting agreements that represents securities collateral received or pledged and customer cash collateral held at third-party custodians. These amounts are not offset on the Consolidated Balance Sheet but are shown as a reduction to total derivative assets and liabilities in the table to derive net derivative assets and liabilities.
For information on the offsetting of securities financing agreements, see Note 10 – Federal Funds Sold, Securities Financing Agreements and Short-term Borrowings.
Offsetting of Derivatives |
|||||||||||||||
March 31, 2013 |
December 31, 2012 |
||||||||||||||
(Dollars in billions) |
Derivative
Assets
|
Derivative
Liabilities
|
Derivative
Assets
|
Derivative
Liabilities
|
|||||||||||
Interest rate contracts |
|||||||||||||||
Over-the-counter |
$ |
584.8 |
$ |
556.4 |
$ |
646.7 |
$ |
623.4 |
|||||||
Over-the-counter cleared |
442.9 |
449.5 |
539.5 |
545.1 |
|||||||||||
Foreign exchange contracts |
|||||||||||||||
Over-the-counter |
79.5 |
83.7 |
84.1 |
88.7 |
|||||||||||
Equity contracts |
|||||||||||||||
Over-the-counter |
16.9 |
14.6 |
15.2 |
13.3 |
|||||||||||
Exchange-traded |
5.5 |
6.2 |
4.8 |
4.7 |
|||||||||||
Commodity contracts |
|||||||||||||||
Over-the-counter |
8.2 |
8.7 |
6.9 |
7.9 |
|||||||||||
Exchange-traded |
3.3 |
3.2 |
3.4 |
3.2 |
|||||||||||
Credit derivatives |
|||||||||||||||
Over-the-counter |
54.8 |
50.6 |
56.0 |
53.9 |
|||||||||||
Over-the-counter cleared |
4.4 |
4.4 |
3.8 |
3.4 |
|||||||||||
Total gross derivative assets/liabilities, before netting |
$ |
1,200.3 |
$ |
1,177.3 |
$ |
1,360.4 |
$ |
1,343.6 |
|||||||
Less: Legally enforceable master netting |
(1,104.8 |
) |
(1,104.8 |
) |
(1,271.9 |
) |
(1,271.9 |
) |
|||||||
Less: Cash collateral received/paid |
(57.7 |
) |
(42.8 |
) |
(58.1 |
) |
(46.9 |
) |
|||||||
Derivative assets/liabilities, after netting |
37.8 |
29.7 |
30.4 |
24.8 |
|||||||||||
Other gross derivative assets/liabilities |
14.4 |
18.1 |
23.1 |
21.2 |
|||||||||||
Total derivative assets/liabilities |
52.2 |
47.8 |
53.5 |
46.0 |
|||||||||||
Less: Financial instruments collateral (1)
|
(11.4 |
) |
(12.8 |
) |
(11.5 |
) |
(14.6 |
) |
|||||||
Total net derivative assets/liabilities |
$ |
40.8 |
$ |
35.0 |
$ |
42.0 |
$ |
31.4 |
|||||||
(1)
|
These amounts are limited to the derivative asset/liability balance, and accordingly, do not include excess collateral received/pledged. |
139
ALM and Risk Management Derivatives |
The Corporation's asset and liability management (ALM) and risk management activities include the use of derivatives to mitigate risk to the Corporation including derivatives designated in qualifying hedge accounting relationships and derivatives used in other risk management activities. Interest rate, foreign exchange, equity, commodity and credit contracts are utilized in the Corporation's ALM and risk management activities.
The Corporation maintains an overall interest rate risk management strategy that incorporates the use of interest rate contracts, which are generally non-leveraged generic interest rate and basis swaps, options, futures and forwards, to minimize significant fluctuations in earnings that are caused by interest rate volatility. The Corporation's goal is to manage interest rate sensitivity and volatility so that movements in interest rates do not significantly adversely affect earnings or capital. As a result of interest rate fluctuations, hedged fixed-rate assets and liabilities appreciate or depreciate in fair value. Gains or losses on the derivative instruments that are linked to the hedged fixed-rate assets and liabilities are expected to substantially offset this unrealized appreciation or depreciation.
Market risk, including interest rate risk, can be substantial in the mortgage business. Market risk is the risk that values of mortgage assets or revenues will be adversely affected by changes in market conditions such as interest rate movements. To mitigate the interest rate risk in mortgage banking production income, the Corporation utilizes forward loan sale commitments and other derivative instruments including purchased options and certain debt securities. The Corporation also utilizes derivatives such as interest rate options, interest rate swaps, forward settlement contracts and Eurodollar futures to hedge certain market risks of mortgage servicing rights (MSRs). For additional information on MSRs, see Note 19 – Mortgage Servicing Rights.
The Corporation uses foreign exchange contracts to manage the foreign exchange risk associated with certain foreign currency-denominated assets and liabilities, as well as the Corporation's investments in non-U.S. subsidiaries. Foreign exchange contracts, which include spot and forward contracts, represent agreements to exchange the currency of one country for the currency of another country at an agreed-upon price on an agreed-upon settlement date. Exposure to loss on these contracts will increase or decrease over their respective lives as currency exchange and interest rates fluctuate.
The Corporation enters into derivative commodity contracts such as futures, swaps, options and forwards as well as non-derivative commodity contracts to provide price risk management services to customers or to manage price risk associated with its physical and financial commodity positions. The non-derivative commodity contracts and physical inventories of commodities expose the Corporation to earnings volatility. Cash flow and fair value accounting hedges provide a method to mitigate a portion of this earnings volatility.
The Corporation purchases credit derivatives to manage credit risk related to certain funded and unfunded credit exposures. Credit derivatives include credit default swaps (CDS), total return swaps and swaptions. These derivatives are recorded on the Consolidated Balance Sheet at fair value with changes in fair value recorded in other loss.
140
Derivatives Designated as Accounting Hedges |
The Corporation uses various types of interest rate, commodity and foreign exchange derivative contracts to protect against changes in the fair value of its assets and liabilities due to fluctuations in interest rates, commodity prices and exchange rates (fair value hedges). The Corporation also uses these types of contracts and equity derivatives to protect against changes in the cash flows of its assets and liabilities, and other forecasted transactions (cash flow hedges). The Corporation hedges its net investment in consolidated non-U.S. operations determined to have functional currencies other than the U.S. dollar using forward exchange contracts and cross-currency basis swaps, and by issuing foreign currency-denominated debt (net investment hedges).
Fair Value Hedges
The table below summarizes certain information related to fair value hedges for the three months ended March 31, 2013 and 2012, including hedges of interest rate risk on long-term debt that were acquired as part of a business combination and redesignated. At redesignation, the fair value of the derivatives was positive. As the derivatives mature, the fair value will approach zero. As a result, ineffectiveness may occur and the fair value changes in the derivatives and the long-term debt being hedged may be directionally the same in certain scenarios. Based on a regression analysis, the derivatives continue to be highly effective at offsetting changes in the fair value of the long-term debt attributable to interest rate risk.
Derivatives Designated as Fair Value Hedges | |||||||||||
Gains (Losses) |
Three Months Ended March 31, 2013 |
||||||||||
(Dollars in millions) |
Derivative |
Hedged
Item
|
Hedge
Ineffectiveness
|
||||||||
Interest rate risk on long-term debt (1)
|
$ |
(953 |
) |
$ |
771 |
$ |
(182 |
) |
|||
Interest rate and foreign currency risk on long-term debt (1)
|
(1,538 |
) |
1,456 |
(82 |
) |
||||||
Interest rate risk on available-for-sale securities (2)
|
850 |
(846 |
) |
4 |
|||||||
Price risk on commodity inventory (3)
|
(3 |
) |
3 |
— |
|||||||
Total |
$ |
(1,644 |
) |
$ |
1,384 |
$ |
(260 |
) |
|||
Three Months Ended March 31, 2012 |
|||||||||||
Interest rate risk on long-term debt (1)
|
$ |
(1,001 |
) |
$ |
764 |
$ |
(237 |
) |
|||
Interest rate and foreign currency risk on long-term debt (1)
|
155 |
(173 |
) |
(18 |
) |
||||||
Interest rate risk on available-for-sale securities (2)
|
2,948 |
(2,801 |
) |
147 |
|||||||
Price risk on commodity inventory (3)
|
23 |
(23 |
) |
— |
|||||||
Total |
$ |
2,125 |
$ |
(2,233 |
) |
$ |
(108 |
) |
|||
(1) |
Amounts are recorded in interest expense on long-term debt and in other loss. |
(2) |
Amounts are recorded in interest income on debt securities. |
(3) |
Amounts relating to commodity inventory are recorded in trading account profits. |
141
Cash Flow and Net Investment Hedges
The table below summarizes certain information related to cash flow hedges and net investment hedges for the three months ended March 31, 2013 and 2012. During the next 12 months, net losses in accumulated OCI of $946 million ($596 million after-tax) on derivative instruments that qualify as cash flow hedges are expected to be reclassified into earnings. These net losses reclassified into earnings are expected to primarily reduce net interest income related to the respective hedged items. Amounts related to commodity price risk reclassified from accumulated OCI are recorded in trading account profits with the underlying hedged item. Amounts related to price risk on restricted stock awards reclassified from accumulated OCI are recorded in personnel expense.
Amounts related to foreign exchange risk recognized in accumulated OCI on derivatives exclude pre-tax losses of $7 million related to long-term debt designated as a net investment hedge for the three months ended March 31, 2012. There were no such hedges for the three months ended March 31, 2013.
Derivatives Designated as Cash Flow and Net Investment Hedges | |||||||||||
Three Months Ended March 31, 2013 |
|||||||||||
(Dollars in millions, amounts pre-tax) |
Gains (Losses) Recognized in Accumulated OCI on Derivatives |
Gains (Losses) in Income Reclassified from Accumulated OCI |
Hedge Ineffectiveness and Amounts Excluded from Effectiveness Testing (1)
|
||||||||
Cash flow hedges |
|||||||||||
Interest rate risk on variable-rate portfolios |
$ |
(14 |
) |
$ |
(275 |
) |
$ |
(1 |
) |
||
Price risk on restricted stock awards |
55 |
40 |
— |
||||||||
Total |
$ |
41 |
$ |
(235 |
) |
$ |
(1 |
) |
|||
Net investment hedges |
|||||||||||
Foreign exchange risk |
$ |
1,676 |
$ |
(94 |
) |
$ |
(35 |
) |
|||
Three Months Ended March 31, 2012 |
|||||||||||
Cash flow hedges |
|||||||||||
Interest rate risk on variable-rate portfolios |
$ |
108 |
$ |
(152 |
) |
$ |
— |
||||
Commodity price risk on forecasted purchases and sales |
— |
(5 |
) |
— |
|||||||
Price risk on restricted stock awards |
305 |
(37 |
) |
— |
|||||||
Total |
$ |
413 |
$ |
(194 |
) |
$ |
— |
||||
Net investment hedges |
|||||||||||
Foreign exchange risk |
$ |
(1,029 |
) |
$ |
(41 |
) |
$ |
(7 |
) |
||
(1) |
Amounts related to derivatives designated as cash flow hedges represent hedge ineffectiveness and amounts related to net investment hedges represent amounts excluded from effectiveness testing. |
142
Other Risk Management Derivatives |
Other risk management derivatives are used by the Corporation to reduce certain risk exposures. These derivatives are not qualifying accounting hedges because either they did not qualify for or were not designated as accounting hedges. The table below presents gains (losses) on these derivatives for the three months ended March 31, 2013 and 2012. These gains (losses) are largely offset by the income or expense that is recorded on the hedged item.
Other Risk Management Derivatives | |||||||
Gains (Losses) |
Three Months Ended March 31 |
||||||
(Dollars in millions) |
2013 |
2012 |
|||||
Price risk on mortgage banking production income (1, 2)
|
$ |
422 |
$ |
589 |
|||
Market-related risk on mortgage banking servicing income (1)
|
(136 |
) |
(203 |
) |
|||
Credit risk on loans (3)
|
3 |
(57 |
) |
||||
Interest rate and foreign currency risk on ALM activities (4)
|
(605 |
) |
464 |
||||
Price risk on restricted stock awards (5)
|
116 |
473 |
|||||
Other |
(4 |
) |
6 |
||||
Total |
$ |
(204 |
) |
$ |
1,272 |
||
(1) |
Net gains on these derivatives are recorded in mortgage banking income. |
(2) |
Includes net gains on interest rate lock commitments related to the origination of mortgage loans that are held-for-sale, which are considered derivative instruments, of $407 million and $547 million for the three months ended March 31, 2013 and 2012.
|
(3) |
Net gains (losses) on these derivatives are recorded in other loss. |
(4) |
The majority of the balance is related to the revaluation of derivatives used to mitigate risk related to foreign currency-denominated debt which is recorded in other loss. The offsetting revaluation of the foreign currency-denominated debt, while not included in the table above, is also recorded in other loss. |
(5) |
Gains (losses) on these derivatives are recorded in personnel expense. |
Sales and Trading Revenue |
The Corporation enters into trading derivatives to facilitate client transactions and to manage risk exposures arising from trading account assets and liabilities. It is the Corporation's policy to include these derivative instruments in its trading activities which include derivatives and non-derivative cash instruments. The resulting risk from these derivatives is managed on a portfolio basis as part of the Corporation's Global Markets business segment. The related sales and trading revenue generated within Global Markets is recorded in various income statement line items including trading account profits and net interest income as well as other revenue categories. However, the majority of income related to derivative instruments is recorded in trading account profits.
Sales and trading revenue includes changes in the fair value and realized gains and losses on the sales of trading and other assets, net interest income, and fees primarily from commissions on equity securities. Revenue is generated by the difference in the client price for an instrument and the price at which the trading desk can execute the trade in the dealer market. For equity securities, commissions related to purchases and sales are recorded in other loss. Changes in the fair value of these securities are included in trading account profits. For debt securities, revenue, with the exception of interest associated with the debt securities, is typically included in trading account profits. Unlike commissions for equity securities, the initial revenue related to broker/dealer services for debt securities is typically included in the pricing of the instrument rather than being charged through separate fee arrangements. Therefore, this revenue is recorded in trading account profits as part of the initial mark to fair value. For derivatives, all revenue is included in trading account profits. In transactions where the Corporation acts as agent, which include exchange-traded futures and options, fees are recorded in other loss.
Gains (losses) on certain instruments, primarily loans, that the Global Markets business segment shares with Global Banking are not considered trading instruments and are excluded from sales and trading revenue in their entirety.
143
The table below, which includes both derivatives and non-derivative cash instruments, identifies the amounts in the respective income statement line items attributable to the Corporation's sales and trading revenue in Global Markets, categorized by primary risk, for the three months ended March 31, 2013 and 2012. The difference between total trading account profits in the table below and in the Consolidated Statement of Income represents trading activities in business segments other than Global Markets. This table includes debit valuation adjustment gains (losses), net of hedges. Global Markets results in Note 20 – Business Segment Information are presented on a fully taxable-equivalent (FTE) basis. The table below is not presented on a FTE basis.
Sales and Trading Revenue |
|||||||||||||||
Three Months Ended March 31, 2013 |
|||||||||||||||
(Dollars in millions) |
Trading
Account
Profits
|
Net Interest Income |
Other (1)
|
Total |
|||||||||||
Interest rate risk |
$ |
677 |
$ |
292 |
$ |
13 |
$ |
982 |
|||||||
Foreign exchange risk |
370 |
— |
(8 |
) |
362 |
||||||||||
Equity risk |
608 |
15 |
536 |
1,159 |
|||||||||||
Credit risk |
1,038 |
717 |
(369 |
) |
1,386 |
||||||||||
Other risk |
196 |
(48 |
) |
12 |
160 |
||||||||||
Total sales and trading revenue |
$ |
2,889 |
$ |
976 |
$ |
184 |
$ |
4,049 |
|||||||
Three Months Ended March 31, 2012 |
|||||||||||||||
Interest rate risk |
$ |
59 |
$ |
271 |
$ |
(10 |
) |
$ |
320 |
||||||
Foreign exchange risk |
232 |
2 |
2 |
236 |
|||||||||||
Equity risk |
375 |
7 |
529 |
911 |
|||||||||||
Credit risk |
1,142 |
543 |
371 |
2,056 |
|||||||||||
Other risk |
229 |
(74 |
) |
27 |
182 |
||||||||||
Total sales and trading revenue |
$ |
2,037 |
$ |
749 |
$ |
919 |
$ |
3,705 |
|||||||
(1) |
Represents amounts in investment and brokerage services and other loss that are recorded in Global Markets and included in the definition of sales and trading revenue. Includes investment and brokerage services revenue of $528 million and $514 million for the three months ended March 31, 2013 and 2012, primarily included in equity risk.
|
Credit Derivatives |
The Corporation enters into credit derivatives primarily to facilitate client transactions and to manage credit risk exposures. Credit derivatives derive value based on an underlying third-party referenced obligation or a portfolio of referenced obligations and generally require the Corporation, as the seller of credit protection, to make payments to a buyer upon the occurrence of a pre-defined credit event. Such credit events generally include bankruptcy of the referenced credit entity and failure to pay under the obligation, as well as acceleration of indebtedness and payment repudiation or moratorium. For credit derivatives based on a portfolio of referenced credits or credit indices, the Corporation may not be required to make payment until a specified amount of loss has occurred and/or may only be required to make payment up to a specified amount.
144
Credit derivative instruments where the Corporation is the seller of credit protection and their expiration are summarized at March 31, 2013 and December 31, 2012 in the table below. These instruments are classified as investment and non-investment grade based on the credit quality of the underlying referenced obligation. The Corporation considers ratings of BBB- or higher as investment grade. Non-investment grade includes non-rated credit derivative instruments.
Credit Derivative Instruments |
|||||||||||||||||||
March 31, 2013 |
|||||||||||||||||||
Carrying Value |
|||||||||||||||||||
(Dollars in millions) |
Less than
One Year
|
One to
Three Years
|
Three to
Five Years
|
Over Five
Years
|
Total |
||||||||||||||
Credit default swaps: |
|||||||||||||||||||
Investment grade |
$ |
62 |
$ |
873 |
$ |
5,504 |
$ |
3,140 |
$ |
9,579 |
|||||||||
Non-investment grade |
856 |
3,652 |
5,493 |
10,110 |
20,111 |
||||||||||||||
Total |
918 |
4,525 |
10,997 |
13,250 |
29,690 |
||||||||||||||
Total return swaps/other: |
|||||||||||||||||||
Investment grade |
38 |
— |
— |
— |
38 |
||||||||||||||
Non-investment grade |
192 |
77 |
63 |
14 |
346 |
||||||||||||||
Total |
230 |
77 |
63 |
14 |
384 |
||||||||||||||
Total credit derivatives |
$ |
1,148 |
$ |
4,602 |
$ |
11,060 |
$ |
13,264 |
$ |
30,074 |
|||||||||
Credit-related notes: (1)
|
|||||||||||||||||||
Investment grade |
$ |
4 |
$ |
21 |
$ |
275 |
$ |
4,309 |
$ |
4,609 |
|||||||||
Non-investment grade |
108 |
172 |
647 |
1,371 |
2,298 |
||||||||||||||
Total credit-related notes |
$ |
112 |
$ |
193 |
$ |
922 |
$ |
5,680 |
$ |
6,907 |
|||||||||
Maximum Payout/Notional |
|||||||||||||||||||
Credit default swaps: |
|||||||||||||||||||
Investment grade |
$ |
264,038 |
$ |
336,442 |
$ |
537,624 |
$ |
111,327 |
$ |
1,249,431 |
|||||||||
Non-investment grade |
76,785 |
97,597 |
111,607 |
45,913 |
331,902 |
||||||||||||||
Total |
340,823 |
434,039 |
649,231 |
157,240 |
1,581,333 |
||||||||||||||
Total return swaps/other: |
|||||||||||||||||||
Investment grade |
24,359 |
— |
— |
— |
24,359 |
||||||||||||||
Non-investment grade |
34,503 |
8,137 |
5,406 |
1,497 |
49,543 |
||||||||||||||
Total |
58,862 |
8,137 |
5,406 |
1,497 |
73,902 |
||||||||||||||
Total credit derivatives |
$ |
399,685 |
$ |
442,176 |
$ |
654,637 |
$ |
158,737 |
$ |
1,655,235 |
|||||||||
December 31, 2012 |
|||||||||||||||||||
Carrying Value |
|||||||||||||||||||
Credit default swaps: |
|||||||||||||||||||
Investment grade |
$ |
52 |
$ |
757 |
$ |
5,595 |
$ |
2,903 |
$ |
9,307 |
|||||||||
Non-investment grade |
923 |
4,403 |
7,030 |
10,959 |
23,315 |
||||||||||||||
Total |
975 |
5,160 |
12,625 |
13,862 |
32,622 |
||||||||||||||
Total return swaps/other: |
|||||||||||||||||||
Investment grade |
39 |
— |
— |
— |
39 |
||||||||||||||
Non-investment grade |
57 |
104 |
39 |
37 |
237 |
||||||||||||||
Total |
96 |
104 |
39 |
37 |
276 |
||||||||||||||
Total credit derivatives |
$ |
1,071 |
$ |
5,264 |
$ |
12,664 |
$ |
13,899 |
$ |
32,898 |
|||||||||
Credit-related notes: (1)
|
|||||||||||||||||||
Investment grade |
$ |
4 |
$ |
12 |
$ |
441 |
$ |
3,849 |
$ |
4,306 |
|||||||||
Non-investment grade |
116 |
161 |
314 |
1,425 |
2,016 |
||||||||||||||
Total credit-related notes |
$ |
120 |
$ |
173 |
$ |
755 |
$ |
5,274 |
$ |
6,322 |
|||||||||
Maximum Payout/Notional |
|||||||||||||||||||
Credit default swaps: |
|||||||||||||||||||
Investment grade |
$ |
260,177 |
$ |
349,125 |
$ |
500,038 |
$ |
90,453 |
$ |
1,199,793 |
|||||||||
Non-investment grade |
79,861 |
99,043 |
110,248 |
42,559 |
331,711 |
||||||||||||||
Total |
340,038 |
448,168 |
610,286 |
133,012 |
1,531,504 |
||||||||||||||
Total return swaps/other: |
|||||||||||||||||||
Investment grade |
43,536 |
15 |
— |
— |
43,551 |
||||||||||||||
Non-investment grade |
5,566 |
11,028 |
7,631 |
1,035 |
25,260 |
||||||||||||||
Total |
49,102 |
11,043 |
7,631 |
1,035 |
68,811 |
||||||||||||||
Total credit derivatives |
$ |
389,140 |
$ |
459,211 |
$ |
617,917 |
$ |
134,047 |
$ |
1,600,315 |
|||||||||
(1) |
For credit-related notes, maximum payout/notional is the same as carrying value. |
145
The notional amount represents the maximum amount payable by the Corporation for most credit derivatives. However, the Corporation does not monitor its exposure to credit derivatives based solely on the notional amount because this measure does not take into consideration the probability of occurrence. As such, the notional amount is not a reliable indicator of the Corporation's exposure to these contracts. Instead, a risk framework is used to define risk tolerances and establish limits to help ensure that certain credit risk-related losses occur within acceptable, predefined limits.
The Corporation manages its market risk exposure to credit derivatives by entering into a variety of offsetting derivative contracts and security positions. For example, in certain instances, the Corporation may purchase credit protection with identical underlying referenced names to offset its exposure. The carrying value and notional amount of written credit derivatives for which the Corporation held purchased credit derivatives with identical underlying referenced names and terms was $19.4 billion and $1.2 trillion at March 31, 2013 and $20.7 billion and $1.1 trillion at December 31, 2012.
Credit-related notes in the table on page 145 include investments in securities issued by collateralized debt obligation (CDO), collateralized loan obligation (CLO) and credit-linked note vehicles. These instruments are primarily classified as trading securities. The carrying value of these instruments equals the Corporation's maximum exposure to loss. The Corporation is not obligated to make any payments to the entities under the terms of the securities owned. The Corporation discloses internal categorizations of investment grade and non-investment grade consistent with how risk is managed for these instruments.
Credit-related Contingent Features and Collateral |
The Corporation executes the majority of its derivative contracts in the OTC market with large, international financial institutions, including broker/dealers and, to a lesser degree, with a variety of non-financial companies. Substantially all of the derivative transactions are executed on a daily margin basis. Therefore, events such as a credit rating downgrade (depending on the ultimate rating level) or a breach of credit covenants would typically require an increase in the amount of collateral required of the counterparty, where applicable, and/or allow the Corporation to take additional protective measures such as early termination of all trades. Further, as previously discussed on page 137, the Corporation enters into legally enforceable master netting agreements which reduce risk by permitting the closeout and netting of transactions with the same counterparty upon the occurrence of certain events.
A majority of the Corporation's derivative contracts contain credit risk-related contingent features, primarily in the form of ISDA master netting agreements and credit support documentation that enhance the creditworthiness of these instruments compared to other obligations of the respective counterparty with whom the Corporation has transacted. These contingent features may be for the benefit of the Corporation as well as its counterparties with respect to changes in the Corporation's creditworthiness and the mark-to-market exposure under the derivative transactions. At March 31, 2013 and December 31, 2012, the Corporation held cash and securities collateral of $85.9 billion and $85.6 billion, and posted cash and securities collateral of $68.7 billion and $74.1 billion in the normal course of business under derivative agreements.
In connection with certain OTC derivative contracts and other trading agreements, the Corporation can be required to provide additional collateral or to terminate transactions with certain counterparties in the event of a downgrade of the senior debt ratings of the Corporation or certain subsidiaries. The amount of additional collateral required depends on the contract and is usually a fixed incremental amount and/or the market value of the exposure.
At March 31, 2013, the amount of collateral, calculated based on the terms of the contracts, that the Corporation and certain subsidiaries could be required to post to counterparties but had not yet posted to counterparties was approximately $2.0 billion, comprised of $681 million for BANA and $1.3 billion for Merrill Lynch & Co., Inc. (Merrill Lynch) and certain of its subsidiaries.
Some counterparties are currently able to unilaterally terminate certain contracts, or the Corporation or certain subsidiaries may be required to take other action such as find a suitable replacement or obtain a guarantee. At March 31, 2013, the current liability recorded for these derivative contracts was $1.3 billion, against which the Corporation and certain subsidiaries had posted approximately $1.2 billion of collateral.
At March 31, 2013, if the rating agencies had downgraded their long-term senior debt ratings for the Corporation or certain subsidiaries by one incremental notch, the amount of additional collateral contractually required by derivative contracts and other trading agreements would have been approximately $2.7 billion, comprised of $2.3 billion for BANA and $407 million for Merrill Lynch and certain of its subsidiaries. If the rating agencies had downgraded their long-term senior debt ratings for these entities by a second incremental notch, approximately $5.4 billion in additional incremental collateral, comprised of $1.4 billion for BANA and $4.0 billion for Merrill Lynch and certain of its subsidiaries, would have been required.
146
Also, if the rating agencies had downgraded their long-term senior debt ratings for the Corporation or certain subsidiaries by one incremental notch, the derivative liability that would be subject to unilateral termination by counterparties as of March 31, 2013 was $3.9 billion, against which $3.1 billion of collateral has been posted. If the rating agencies had downgraded their long-term senior debt ratings for the Corporation and certain subsidiaries by a second incremental notch, the derivative liability that would be subject to unilateral termination by counterparties as of March 31, 2013 was an incremental $1.5 billion, against which $972 million of collateral has been posted.
Valuation Adjustments on Derivatives |
The Corporation records credit risk valuation adjustments on derivatives in order to properly reflect the credit quality of the counterparties and its own credit quality. The Corporation calculates valuation adjustments on derivatives based on a modeled expected exposure that incorporates current market risk factors. The exposure also takes into consideration credit mitigants such as enforceable master netting agreements and collateral. CDS spread data is used to estimate the default probabilities and severities that are applied to the exposures. Where no observable credit default data is available for counterparties, the Corporation uses proxies and other market data to estimate default probabilities and severity.
Valuation adjustments on derivatives are affected by changes in market spreads, non-credit related market factors such as interest rate and currency changes that affect the expected exposure, and other factors like changes in collateral arrangements and partial payments. Credit spreads and non-credit factors can move independently. For example, for an interest rate swap, changes in interest rates may increase the expected exposure which would increase the counterparty credit valuation adjustment (CVA). Independently, counterparty credit spreads may tighten, which would result in an offsetting decrease to CVA.
The Corporation may enter into risk management activities to offset market driven exposures. The Corporation often hedges the counterparty spread risk in CVA with CDS and often hedges the other market risks in both CVA and debit valuation adjustments (DVA) primarily with currency and interest rate swaps. Since the components of the valuation adjustments on derivatives move independently and the Corporation may not hedge all of the market driven exposures, the effect of a hedge may increase the gross valuation adjustments on derivatives or may result in a gross positive valuation adjustment on derivatives becoming a negative adjustment (or the reverse).
During the three months ended March 31, 2013, the Corporation refined its methodology for calculating CVA and DVA, on a prospective basis, to adjust the way it values mutual termination clauses in derivatives contracts and to more fully incorporate the potential for the counterparties to default prior to a change in their credit ratings. This change in estimates increased CVA by $361 million and DVA by $433 million resulting in a net positive earnings impact of $72 million for the three months ended March 31, 2013. The net CVA and DVA excluding the impact of these refinements was a gain of $66 million and a loss of $54 million. The effect of this change in estimates is reflected in the table below.
The table below presents CVA and DVA gains (losses) for the Corporation on a gross and net of hedge basis, which are recorded in trading account profits.
Valuation Adjustments on Derivatives | |||||||||||||
Three Months Ended March 31 |
|||||||||||||
2013 |
2012 |
||||||||||||
(Dollars in millions) |
Gross |
Net |
Gross |
Net |
|||||||||
Derivative assets (CVA) (1)
|
$ |
(131 |
) |
$ |
(295 |
) |
$ |
512 |
$ |
150 |
|||
Derivative liabilities (DVA) (2)
|
375 |
379 |
(1,360 |
) |
(1,459 |
) |
|||||||
(1) |
At March 31, 2013 and December 31, 2012, the cumulative CVA reduced the derivative assets balance by $2.5 billion and $2.4 billion.
|
(2) |
At March 31, 2013 and December 31, 2012, the cumulative DVA reduced the derivative liabilities balance by $1.2 billion and $807 million.
|
147
NOTE 4 – Securities |
The Corporation's debt securities carried at fair value include debt securities purchased for longer term investment purposes and are used as part of ALM and other strategic activities. Generally, debt securities carried at fair value are accounted for as available-for-sale (AFS) debt securities with unrealized gains and losses reported in accumulated OCI. For certain other debt securities purchased for ALM and other strategic purposes, the Corporation has elected to report those securities at fair value with unrealized gains and losses reported in other loss.
As a result of growth in the portfolio of debt securities carried at fair value with unrealized gains and losses recorded in other loss and to better reflect how such portfolio is managed as part of the ALM activities, the Corporation changed the presentation of such securities in the first quarter of 2013 to combine into one line item on the Consolidated Balance Sheet, debt securities carried at fair value. Previously the portfolio of debt securities carried at fair value with unrealized gains and losses recorded in other loss was classified in other assets. For these debt securities, the Corporation may hedge them with risk management derivatives with the unrealized gains and losses also reported in other loss. Reporting certain debt securities at fair value with unrealized gains and losses reported in other loss has been made to mitigate accounting asymmetry with the risk management derivatives and to achieve operational simplifications. Debt securities purchased for trading purposes are reported in Note 2 – Trading Account Assets and Liabilities. Prior period amounts have been reclassified to conform to the current period presentation.
The following tables present the amortized cost, gross unrealized gains and losses, and fair value of AFS debt securities, other debt securities carried at fair value, held-to-maturity (HTM) debt securities and marketable equity securities at March 31, 2013 and December 31, 2012.
Debt Securities and Available-for-Sale Marketable Equity Securities | |||||||||||||||
March 31, 2013 |
|||||||||||||||
(Dollars in millions) |
Amortized
Cost
|
Gross
Unrealized
Gains
|
Gross
Unrealized
Losses
|
Fair
Value
|
|||||||||||
Available-for-sale debt securities |
|||||||||||||||
U.S. Treasury and agency securities |
$ |
17,186 |
$ |
315 |
$ |
(62 |
) |
$ |
17,439 |
||||||
Mortgage-backed securities: |
|||||||||||||||
Agency |
170,842 |
4,050 |
(624 |
) |
174,268 |
||||||||||
Agency-collateralized mortgage obligations |
33,573 |
1,405 |
(217 |
) |
34,761 |
||||||||||
Non-agency residential (1)
|
8,591 |
402 |
(116 |
) |
8,877 |
||||||||||
Non-agency commercial |
3,539 |
295 |
— |
3,834 |
|||||||||||
Non-U.S. securities |
5,606 |
52 |
(8 |
) |
5,650 |
||||||||||
Corporate/Agency bonds |
1,349 |
47 |
(11 |
) |
1,385 |
||||||||||
Other taxable securities, substantially all asset-backed securities |
11,014 |
52 |
(12 |
) |
11,054 |
||||||||||
Total taxable securities |
251,700 |
6,618 |
(1,050 |
) |
257,268 |
||||||||||
Tax-exempt securities |
4,607 |
17 |
(42 |
) |
4,582 |
||||||||||
Total available-for-sale debt securities |
256,307 |
6,635 |
(1,092 |
) |
261,850 |
||||||||||
Other debt securities carried at fair value |
43,442 |
129 |
(289 |
) |
43,282 |
||||||||||
Total debt securities carried at fair value |
299,749 |
6,764 |
(1,381 |
) |
305,132 |
||||||||||
Held-to-maturity debt securities, substantially all U.S. agency mortgage-backed securities |
49,577 |
446 |
(249 |
) |
49,774 |
||||||||||
Total debt securities |
$ |
349,326 |
$ |
7,210 |
$ |
(1,630 |
) |
$ |
354,906 |
||||||
Available-for-sale marketable equity securities (2)
|
$ |
769 |
$ |
795 |
$ |
— |
$ |
1,564 |
|||||||
(1) |
At March 31, 2013, the underlying collateral type includes approximately 91 percent prime, six percent Alt-A and three percent subprime.
|
(2) |
Classified in other assets on the Consolidated Balance Sheet. |
148
Debt Securities and Available-for-Sale Marketable Equity Securities | |||||||||||||||
December 31, 2012 |
|||||||||||||||
(Dollars in millions) |
Amortized
Cost
|
Gross
Unrealized
Gains
|
Gross
Unrealized
Losses
|
Fair
Value
|
|||||||||||
Available-for-sale debt securities |
|||||||||||||||
U.S. Treasury and agency securities |
$ |
24,232 |
$ |
324 |
$ |
(84 |
) |
$ |
24,472 |
||||||
Mortgage-backed securities: |
|||||||||||||||
Agency |
183,247 |
5,048 |
(146 |
) |
188,149 |
||||||||||
Agency-collateralized mortgage obligations |
36,329 |
1,427 |
(218 |
) |
37,538 |
||||||||||
Non-agency residential (1)
|
9,231 |
391 |
(128 |
) |
9,494 |
||||||||||
Non-agency commercial |
3,576 |
348 |
— |
3,924 |
|||||||||||
Non-U.S. securities |
5,574 |
50 |
(6 |
) |
5,618 |
||||||||||
Corporate/Agency bonds |
1,415 |
51 |
(16 |
) |
1,450 |
||||||||||
Other taxable securities, substantially all asset-backed securities |
12,089 |
54 |
(15 |
) |
12,128 |
||||||||||
Total taxable securities |
275,693 |
7,693 |
(613 |
) |
282,773 |
||||||||||
Tax-exempt securities |
4,167 |
13 |
(47 |
) |
4,133 |
||||||||||
Total available-for-sale debt securities |
279,860 |
7,706 |
(660 |
) |
286,906 |
||||||||||
Other debt securities carried at fair value |
23,927 |
120 |
(103 |
) |
23,944 |
||||||||||
Total debt securities carried at fair value |
303,787 |
7,826 |
(763 |
) |
310,850 |
||||||||||
Held-to-maturity debt securities, substantially all U.S. agency mortgage-backed securities |
49,481 |
815 |
(26 |
) |
50,270 |
||||||||||
Total debt securities |
$ |
353,268 |
$ |
8,641 |
$ |
(789 |
) |
$ |
361,120 |
||||||
Available-for-sale marketable equity securities (2)
|
$ |
780 |
$ |
732 |
$ |
— |
$ |
1,512 |
|||||||
(1) |
At December 31, 2012, the underlying collateral type includes approximately 91 percent prime, six percent Alt-A and three percent subprime.
|
(2) |
Classified in other assets on the Consolidated Balance Sheet. |
At March 31, 2013, the accumulated net unrealized gains on AFS debt securities included in accumulated OCI were $3.5 billion, net of the related income tax expense of $2.0 billion. At March 31, 2013 and December 31, 2012, the Corporation had nonperforming AFS debt securities of $90 million and $91 million.
The table below presents the components of other debt securities carried at fair value where the changes in fair value are reported in other loss at March 31, 2013 and December 31, 2012.
Other Debt Securities Carried at Fair Value |
|||||||
(Dollars in millions) |
March 31 2013 |
December 31 2012 |
|||||
U.S. Treasury and agency securities |
$ |
3,861 |
$ |
491 |
|||
Mortgage-backed securities: |
|||||||
Agency |
29,178 |
13,073 |
|||||
Agency-collateralized mortgage obligations |
958 |
929 |
|||||
Non-agency commercial |
103 |
— |
|||||
Non-U.S. securities (1)
|
9,182 |
9,451 |
|||||
Total |
$ |
43,282 |
$ |
23,944 |
|||
(1) |
These securities are used to satisfy certain international regulatory liquidity requirements. |
149
The Corporation recorded other-than-temporary impairment (OTTI) losses on AFS debt securities for the three months ended March 31, 2013 and 2012 as presented in the table below. A debt security is impaired when its fair value is less than its amortized cost. If the Corporation intends or will more-likely-than-not be required to sell the debt securities prior to recovery, the entire impairment loss is recorded in the Consolidated Statement of Income. For AFS debt securities the Corporation does not intend or will not more-likely-than-not be required to sell, an analysis is performed to determine if any of the impairment is due to credit or whether it is due to other factors (e.g., interest rate). Credit losses are considered unrecoverable and are recorded in the Consolidated Statement of Income with the remaining unrealized losses recorded in accumulated OCI. In certain instances, the credit loss on a debt security may exceed the total impairment, in which case, the portion of the credit loss that exceeds the total impairment is recorded as an unrealized gain in accumulated OCI.
Net Impairment Losses Recognized in Earnings | |||||||||||
Three Months Ended March 31, 2013 |
|||||||||||
(Dollars in millions) |
Non-agency Residential MBS |
Non-agency Commercial MBS |
Total |
||||||||
Total OTTI losses (unrealized and realized) |
$ |
(14 |
) |
$ |
— |
$ |
(14 |
) |
|||
Unrealized OTTI losses recognized in accumulated OCI |
5 |
— |
5 |
||||||||
Net impairment losses recognized in earnings |
$ |
(9 |
) |
$ |
— |
$ |
(9 |
) |
|||
Three Months Ended March 31, 2012 |
|||||||||||
Total OTTI losses (unrealized and realized) |
$ |
(49 |
) |
$ |
(2 |
) |
$ |
(51 |
) |
||
Unrealized OTTI losses recognized in accumulated OCI |
11 |
— |
11 |
||||||||
Net impairment losses recognized in earnings |
$ |
(38 |
) |
$ |
(2 |
) |
$ |
(40 |
) |
||
The Corporation's net impairment losses recognized in earnings consist of write-downs to fair value on AFS debt securities the Corporation has the intent to sell or will more-likely-than-not be required to sell and all credit losses. The table below presents a rollforward of the credit losses recognized in earnings for the three months ended March 31, 2013 and 2012 on AFS debt securities that the Corporation does not have the intent to sell or will not more-likely-than-not be required to sell.
Rollforward of Credit Losses Recognized | |||||||
Three Months Ended March 31 |
|||||||
(Dollars in millions) |
2013 |
2012 |
|||||
Balance, beginning of period |
$ |
243 |
$ |
310 |
|||
Additions for credit losses recognized on AFS debt securities that had no previous impairment losses |
4 |
2 |
|||||
Additions for credit losses recognized on AFS debt securities that had previously incurred impairment losses |
5 |
38 |
|||||
Reductions for AFS debt securities sold or intended to be sold |
(8 |
) |
(84 |
) |
|||
Balance, March 31 |
$ |
244 |
$ |
266 |
|||
The Corporation estimates the portion of a loss on a security that is attributable to credit using a discounted cash flow model and estimates the expected cash flows of the underlying collateral using internal credit, interest rate and prepayment risk models that incorporate management's best estimate of current key assumptions such as default rates, loss severity and prepayment rates. Assumptions used for the underlying loans that support the mortgage-backed securities (MBS) can vary widely from loan to loan and are influenced by such factors as loan interest rate, geographic location of the borrower, borrower characteristics and collateral type. Based on these assumptions, the Corporation then determines how the underlying collateral cash flows will be distributed to each MBS issued from the applicable special purpose entity. Expected principal and interest cash flows on an impaired AFS debt security are discounted using the effective yield of each individual impaired AFS debt security.
150
Significant assumptions used in estimating the expected cash flows for measuring credit losses on non-agency residential mortgage-backed securities (RMBS) were as follows at March 31, 2013.
Significant Assumptions | |||||
Range (1)
|
|||||
Weighted-average |
10th Percentile (2)
|
90th Percentile (2)
|
|||
Annual prepayment speed |
11.0% |
1.0% |
25.7% |
||
Loss severity |
50.5 |
24.5 |
65.3 |
||
Life default rate |
55.2 |
2.6 |
99.9 |
||
(1) |
Represents the range of inputs/assumptions based upon the underlying collateral. |
(2) |
The value of a variable below which the indicated percentile of observations will fall. |
Annual constant prepayment speed and loss severity rates are projected considering collateral characteristics such as loan-to-value (LTV), creditworthiness of borrowers as measured using FICO scores and geographic concentrations. The weighted-average severity by collateral type was 44.8 percent for prime, 49.6 percent for Alt-A and 62.1 percent for subprime at March 31, 2013. Additionally, default rates are projected by considering collateral characteristics including, but not limited to, LTV, FICO and geographic concentration. Weighted-average life default rates by collateral type were 39.0 percent for prime, 64.4 percent for Alt-A and 59.7 percent for subprime at March 31, 2013.
The following tables present the fair value and the associated gross unrealized losses on AFS debt securities with gross unrealized losses at March 31, 2013 and December 31, 2012, and whether these securities have had gross unrealized losses for less than 12 months or for 12 months or longer.
Temporarily Impaired and Other-than-temporarily Impaired AFS Debt Securities |
|||||||||||||||||||||||
March 31, 2013 |
|||||||||||||||||||||||
Less than 12 Months |
12 Months or Longer |
Total |
|||||||||||||||||||||
(Dollars in millions) |
Fair
Value
|
Gross
Unrealized
Losses
|
Fair
Value
|
Gross
Unrealized
Losses
|
Fair
Value
|
Gross
Unrealized
Losses
|
|||||||||||||||||
Temporarily impaired AFS debt securities |
|||||||||||||||||||||||
U.S. Treasury and agency securities |
$ |
459 |
$ |
(2 |
) |
$ |
3,719 |
$ |
(60 |
) |
$ |
4,178 |
$ |
(62 |
) |
||||||||
Mortgage-backed securities: |
|||||||||||||||||||||||
Agency |
33,667 |
(278 |
) |
984 |
(346 |
) |
34,651 |
(624 |
) |
||||||||||||||
Agency-collateralized mortgage obligations |
5,987 |
(140 |
) |
4,132 |
(77 |
) |
10,119 |
(217 |
) |
||||||||||||||
Non-agency residential |
562 |
(11 |
) |
1,569 |
(100 |
) |
2,131 |
(111 |
) |
||||||||||||||
Non-U.S. securities |
1,864 |
(1 |
) |
156 |
(7 |
) |
2,020 |
(8 |
) |
||||||||||||||
Corporate/Agency bonds |
— |
— |
278 |
(11 |
) |
278 |
(11 |
) |
|||||||||||||||
Other taxable securities |
836 |
(1 |
) |
1,365 |
(11 |
) |
2,201 |
(12 |
) |
||||||||||||||
Total taxable securities |
43,375 |
(433 |
) |
12,203 |
(612 |
) |
55,578 |
(1,045 |
) |
||||||||||||||
Tax-exempt securities |
1,901 |
(3 |
) |
1,052 |
(39 |
) |
2,953 |
(42 |
) |
||||||||||||||
Total temporarily impaired AFS securities |
45,276 |
(436 |
) |
13,255 |
(651 |
) |
58,531 |
(1,087 |
) |
||||||||||||||
Other-than-temporarily impaired AFS debt securities (1)
|
|||||||||||||||||||||||
Non-agency residential mortgage-backed securities |
— |
— |
56 |
(5 |
) |
56 |
(5 |
) |
|||||||||||||||
Total temporarily impaired and other-than-temporarily impaired AFS debt securities (2)
|
$ |
45,276 |
$ |
(436 |
) |
$ |
13,311 |
$ |
(656 |
) |
$ |
58,587 |
$ |
(1,092 |
) |
||||||||
(1) |
Includes other-than-temporarily impaired AFS debt securities on which an OTTI loss remains in accumulated OCI. |
(2) |
At March 31, 2013, the amortized cost of approximately 2,600 AFS debt securities exceeded their fair value by $1.1 billion.
|
151
Temporarily Impaired and Other-than-temporarily Impaired AFS Debt Securities | |||||||||||||||||||||||
December 31, 2012 |
|||||||||||||||||||||||
Less than 12 Months |
12 Months or Longer |
Total |
|||||||||||||||||||||
(Dollars in millions) |
Fair
Value
|
Gross
Unrealized
Losses
|
Fair
Value
|
Gross
Unrealized
Losses
|
Fair
Value
|
Gross
Unrealized
Losses
|
|||||||||||||||||
Temporarily impaired AFS debt securities |
|||||||||||||||||||||||
U.S. Treasury and agency securities |
$ |
— |
$ |
— |
$ |
5,608 |
$ |
(84 |
) |
$ |
5,608 |
$ |
(84 |
) |
|||||||||
Mortgage-backed securities: |
|||||||||||||||||||||||
Agency |
15,593 |
(133 |
) |
735 |
(13 |
) |
16,328 |
(146 |
) |
||||||||||||||
Agency-collateralized mortgage obligations |
5,135 |
(121 |
) |
4,994 |
(97 |
) |
10,129 |
(218 |
) |
||||||||||||||
Non-agency residential |
592 |
(13 |
) |
1,555 |
(110 |
) |
2,147 |
(123 |
) |
||||||||||||||
Non-U.S. securities |
1,715 |
(1 |
) |
563 |
(5 |
) |
2,278 |
(6 |
) |
||||||||||||||
Corporate/Agency bonds |
— |
— |
277 |
(16 |
) |
277 |
(16 |
) |
|||||||||||||||
Other taxable securities |
1,678 |
(1 |
) |
1,436 |
(14 |
) |
3,114 |
(15 |
) |
||||||||||||||
Total taxable securities |
24,713 |
(269 |
) |
15,168 |
(339 |
) |
39,881 |
(608 |
) |
||||||||||||||
Tax-exempt securities |
1,609 |
(9 |
) |
1,072 |
(38 |
) |
2,681 |
(47 |
) |
||||||||||||||
Total temporarily impaired AFS debt securities |
26,322 |
(278 |
) |
16,240 |
(377 |
) |
42,562 |
(655 |
) |
||||||||||||||
Other-than-temporarily impaired AFS debt securities (1)
|
|||||||||||||||||||||||
Non-agency residential mortgage-backed securities |
14 |
(1 |
) |
74 |
(4 |
) |
88 |
(5 |
) |
||||||||||||||
Total temporarily impaired and other-than-temporarily impaired AFS debt securities (2)
|
$ |
26,336 |
$ |
(279 |
) |
$ |
16,314 |
$ |
(381 |
) |
$ |
42,650 |
$ |
(660 |
) |
||||||||
(1) |
Includes other-than-temporarily impaired AFS debt securities on which an OTTI loss remains in accumulated OCI. |
(2) |
At December 31, 2012, the amortized cost of approximately 2,600 AFS debt securities exceeded their fair value by $660 million.
|
The amortized cost and fair value of the Corporation's debt securities carried at fair value and HTM debt securities from Fannie Mae (FNMA), the Government National Mortgage Association (GNMA) and Freddie Mac (FHLMC), where the investment exceeded 10 percent of consolidated shareholders' equity at March 31, 2013 and December 31, 2012, are presented in the table below.
Selected Securities Exceeding 10 Percent of Shareholders' Equity | |||||||||||||||
March 31, 2013 |
December 31, 2012 |
||||||||||||||
(Dollars in millions) |
Amortized
Cost
|
Fair
Value
|
Amortized
Cost
|
Fair
Value
|
|||||||||||
Fannie Mae |
$ |
135,056 |
$ |
136,203 |
$ |
121,522 |
$ |
123,933 |
|||||||
Government National Mortgage Association |
120,574 |
123,601 |
124,348 |
127,541 |
|||||||||||
Freddie Mac |
28,423 |
28,738 |
22,995 |
23,502 |
|||||||||||
152
The expected maturity distribution of the Corporation's MBS, the contractual maturity distribution of the Corporation's debt securities carried at fair value and HTM debt securities, and the yields on the Corporation's debt securities carried at fair value and HTM debt securities at March 31, 2013 are summarized in the table below. Actual maturities may differ from the contractual or expected maturities since borrowers may have the right to prepay obligations with or without prepayment penalties.
Maturities of Debt Securities Carried at Fair Value and Held-to-maturity Debt Securities | |||||||||||||||||||||||||||||
March 31, 2013 |
|||||||||||||||||||||||||||||
|
Due in One
Year or Less
|
Due after One Year
through Five Years
|
Due after Five
Years through Ten Years
|
Due after
Ten Years
|
Total |
|||||||||||||||||||||||||
(Dollars in millions) |
Amount |
Yield (1)
|
Amount |
Yield (1)
|
Amount |
Yield (1)
|
Amount |
Yield (1)
|
Amount |
Yield (1)
|
|||||||||||||||||||
Amortized cost of debt securities carried at fair value |
|||||||||||||||||||||||||||||
U.S. Treasury and agency securities |
$ |
568 |
0.73 |
% |
$ |
777 |
2.14 |
% |
$ |
5,123 |
2.78 |
% |
$ |
14,554 |
3.01 |
% |
$ |
21,022 |
2.86 |
% |
|||||||||
Mortgage-backed securities: |
|||||||||||||||||||||||||||||
Agency |
4 |
5.00 |
31,415 |
3.10 |
140,985 |
2.95 |
27,859 |
2.47 |
200,263 |
2.91 |
|||||||||||||||||||
Agency-collateralized mortgage obligations |
10 |
6.99 |
11,120 |
1.30 |
23,328 |
3.44 |
15 |
1.63 |
34,473 |
2.71 |
|||||||||||||||||||
Non-agency residential |
620 |
4.50 |
4,740 |
4.26 |
2,670 |
4.10 |
561 |
4.88 |
8,591 |
4.28 |
|||||||||||||||||||
Non-agency commercial |
1,032 |
5.26 |
2,463 |
6.10 |
130 |
2.95 |
17 |
4.46 |
3,642 |
5.72 |
|||||||||||||||||||
Non-U.S. securities |
13,300 |
0.56 |
1,331 |
5.90 |
157 |
2.42 |
— |
— |
14,788 |
1.07 |
|||||||||||||||||||
Corporate/Agency bonds |
282 |
3.00 |
778 |
2.64 |
186 |
4.31 |
103 |
1.10 |
1,349 |
2.81 |
|||||||||||||||||||
Other taxable securities |
1,606 |
1.49 |
6,051 |
1.33 |
2,493 |
2.09 |
864 |
1.09 |
11,014 |
1.50 |
|||||||||||||||||||
Total taxable securities |
17,422 |
1.13 |
58,675 |
2.84 |
175,072 |
3.01 |
43,973 |
2.65 |
295,142 |
2.82 |
|||||||||||||||||||
Tax-exempt securities |
41 |
2.69 |
2,179 |
1.23 |
993 |
2.09 |
1,394 |
1.09 |
4,607 |
1.51 |
|||||||||||||||||||
Total amortized cost of debt securities carried at fair value |
$ |
17,463 |
1.13 |
$ |
60,854 |
2.79 |
$ |
176,065 |
3.01 |
$ |
45,367 |
2.60 |
$ |
299,749 |
2.80 |
||||||||||||||
Amortized cost of HTM debt securities (2)
|
$ |
6 |
5.00 |
$ |
345 |
2.40 |
$ |
49,121 |
2.50 |
$ |
105 |
1.44 |
$ |
49,577 |
2.50 |
||||||||||||||
Debt securities carried at fair value |
|||||||||||||||||||||||||||||
U.S. Treasury and agency securities |
$ |
571 |
$ |
804 |
$ |
5,323 |
$ |
14,602 |
$ |
21,300 |
|||||||||||||||||||
Mortgage-backed securities: |
|||||||||||||||||||||||||||||
Agency |
4 |
31,863 |
143,922 |
27,657 |
203,446 |
||||||||||||||||||||||||
Agency-collateralized mortgage obligations |
10 |
11,076 |
24,618 |
15 |
35,719 |
||||||||||||||||||||||||
Non-agency residential |
618 |
4,865 |
2,746 |
648 |
8,877 |
||||||||||||||||||||||||
Non-agency commercial |
1,076 |
2,712 |
131 |
18 |
3,937 |
||||||||||||||||||||||||
Non-U.S. securities |
13,285 |
1,384 |
163 |
— |
14,832 |
||||||||||||||||||||||||
Corporate/Agency bonds |
287 |
793 |
208 |
97 |
1,385 |
||||||||||||||||||||||||
Other taxable securities |
1,605 |
6,068 |
2,524 |
857 |
11,054 |
||||||||||||||||||||||||
Total taxable securities |
17,456 |
59,565 |
179,635 |
43,894 |
300,550 |
||||||||||||||||||||||||
Tax-exempt securities |
44 |
2,181 |
994 |
1,363 |
4,582 |
||||||||||||||||||||||||
Total debt securities carried at fair value |
$ |
17,500 |
$ |
61,746 |
$ |
180,629 |
$ |
45,257 |
$ |
305,132 |
|||||||||||||||||||
Fair value of HTM debt securities (2)
|
$ |
6 |
$ |
344 |
$ |
49,318 |
$ |
106 |
$ |
49,774 |
|||||||||||||||||||
(1) |
Average yield is computed using the effective yield of each security at the end of the period, weighted based on the amortized cost of each security. The effective yield considers the contractual coupon, amortization of premiums and accretion of discounts, and excludes the effect of related hedging derivatives. |
(2) |
Substantially all U.S. agency MBS. |
153
The gross realized gains and losses on sales of AFS debt securities for the three months ended March 31, 2013 and 2012 are presented in the table below.
Gains and Losses on Sales of AFS Debt Securities | |||||||
Three Months Ended March 31 |
|||||||
(Dollars in millions) |
2013 |
2012 |
|||||
Gross gains |
$ |
69 |
$ |
1,173 |
|||
Gross losses |
(1 |
) |
(421 |
) |
|||
Net gains on sales of AFS debt securities |
$ |
68 |
$ |
752 |
|||
Income tax expense attributable to realized net gains on sales of AFS debt securities |
$ |
25 |
$ |
278 |
|||
Certain Corporate and Strategic Investments |
At March 31, 2013 and December 31, 2012, the Corporation owned 2.0 billion shares representing approximately one percent of China Construction Bank Corporation (CCB). Sales restrictions on these shares continue until August 2013. Because the sales restrictions on these shares will expire within one year, these securities are classified as AFS marketable equity securities and carried at fair value with the after-tax unrealized gain included in accumulated OCI. The fair value of the investment at March 31, 2013 and December 31, 2012 was $1.5 billion and $1.4 billion, and the cost basis was $716 million. There is a strategic assistance agreement between the Corporation and CCB, which includes cooperation in specific business areas.
The Corporation's 49 percent investment in a merchant services joint venture had a carrying value of $3.3 billion at both March 31, 2013 and December 31, 2012. For additional information, see Note 11 – Commitments and Contingencies.
154
NOTE 5 – Outstanding Loans and Leases |
The following tables present total outstanding loans and leases and an aging analysis for the Corporation's Home Loans, Credit Card and Other Consumer, and Commercial portfolio segments, by class of financing receivables, at March 31, 2013 and December 31, 2012.
March 31, 2013 |
||||||||||||||||||||||||
(Dollars in millions) |
30-59 Days Past Due (1) |
60-89 Days Past Due (1) |
90 Days or More Past Due (2) |
Total
Past Due
30 Days
or More |
Total Current or Less Than 30 Days Past Due (3) |
Purchased Credit - impaired (4) |
Loans Accounted for Under the Fair Value Option |
Total Outstandings |
||||||||||||||||
Home loans |
||||||||||||||||||||||||
Core portfolio |
||||||||||||||||||||||||
Residential mortgage (5)
|
$ |
2,160 |
$ |
666 |
$ |
6,611 |
$ |
9,437 |
$ |
160,996 |
$ |
170,433 |
||||||||||||
Home equity |
256 |
137 |
606 |
999 |
57,959 |
58,958 |
||||||||||||||||||
Legacy Assets & Servicing portfolio |
||||||||||||||||||||||||
Residential mortgage (6)
|
2,827 |
1,410 |
24,912 |
29,149 |
35,338 |
$ |
22,004 |
86,491 |
||||||||||||||||
Home equity |
538 |
295 |
1,351 |
2,184 |
34,416 |
7,660 |
44,260 |
|||||||||||||||||
Credit card and other consumer |
||||||||||||||||||||||||
U.S. credit card |
663 |
487 |
1,360 |
2,510 |
87,537 |
90,047 |
||||||||||||||||||
Non-U.S. credit card |
89 |
67 |
181 |
337 |
10,283 |
10,620 |
||||||||||||||||||
Direct/Indirect consumer (7)
|
473 |
198 |
520 |
1,191 |
80,327 |
81,518 |
||||||||||||||||||
Other consumer (8)
|
42 |
16 |
2 |
60 |
1,636 |
1,696 |
||||||||||||||||||
Total consumer loans |
7,048 |
3,276 |
35,543 |
45,867 |
468,492 |
29,664 |
544,023 |
|||||||||||||||||
Consumer loans accounted for under the fair value option (9)
|
$ |
1,041 |
1,041 |
|||||||||||||||||||||
Total consumer |
7,048 |
3,276 |
35,543 |
45,867 |
468,492 |
29,664 |
1,041 |
545,064 |
||||||||||||||||
Commercial |
||||||||||||||||||||||||
U.S. commercial |
406 |
101 |
522 |
1,029 |
200,331 |
201,360 |
||||||||||||||||||
Commercial real estate (10)
|
154 |
74 |
768 |
996 |
38,064 |
39,060 |
||||||||||||||||||
Commercial lease financing |
182 |
9 |
16 |
207 |
23,260 |
23,467 |
||||||||||||||||||
Non-U.S. commercial |
14 |
1 |
— |
15 |
82,445 |
82,460 |
||||||||||||||||||
U.S. small business commercial |
94 |
69 |
166 |
329 |
12,073 |
12,402 |
||||||||||||||||||
Total commercial loans |
850 |
254 |
1,472 |
2,576 |
356,173 |
358,749 |
||||||||||||||||||
Commercial loans accounted for under the fair value option (9)
|
7,779 |
7,779 |
||||||||||||||||||||||
Total commercial |
850 |
254 |
1,472 |
2,576 |
356,173 |
7,779 |
366,528 |
|||||||||||||||||
Total loans and leases |
$ |
7,898 |
$ |
3,530 |
$ |
37,015 |
$ |
48,443 |
$ |
824,665 |
$ |
29,664 |
$ |
8,820 |
$ |
911,592 |
||||||||
Percentage of outstandings |
0.87 |
% |
0.39 |
% |
4.06 |
% |
5.32 |
% |
90.46 |
% |
3.25 |
% |
0.97 |
% |
||||||||||
(1) |
Home loans 30-59 days past due includes fully-insured loans of $2.2 billion and nonperforming loans of $735 million. Home loans 60-89 days past due includes fully-insured loans of $961 million and nonperforming loans of $503 million.
|
(2) |
Home loans includes fully-insured loans of $21.6 billion.
|
(3) |
Home loans includes $6.4 billion and direct/indirect consumer includes $52 million of nonperforming loans.
|
(4) |
PCI loan amounts are shown gross of the valuation allowance. |
(5) |
Total outstandings includes non-U.S. residential mortgage loans of $86 million.
|
(6) |
Total outstandings includes pay option loans of $6.5 billion and subprime loans of $533 million. The Corporation no longer originates these products.
|
(7) |
Total outstandings includes dealer financial services loans of $36.1 billion, consumer lending loans of $4.1 billion, U.S. securities-based lending margin loans of $28.2 billion, student loans of $4.6 billion, non-U.S. consumer loans of $7.4 billion and other consumer loans of $1.1 billion.
|
(8) |
Total outstandings includes consumer finance loans of $1.4 billion, other non-U.S. consumer loans of $5 million and consumer overdrafts of $115 million.
|
(9) |
Consumer loans accounted for under the fair value option were residential mortgage loans of $1.0 billion. Commercial loans accounted for under the fair value option were U.S. commercial loans of $2.1 billion and non-U.S. commercial loans of $5.7 billion. For addition information, see Note 16 – Fair Value Measurements and Note 17 – Fair Value Option.
|
(10) |
Total outstandings includes U.S. commercial real estate loans of $37.6 billion and non-U.S. commercial real estate loans of $1.4 billion.
|
155
December 31, 2012 |
||||||||||||||||||||||||
(Dollars in millions) |
30-59 Days Past Due (1) |
60-89 Days Past Due (1) |
90 Days or More Past Due (2) |
Total
Past Due
30 Days
or More |
Total Current or Less Than 30 Days Past Due (3) |
Purchased Credit - impaired (4) |
Loans Accounted for Under the Fair Value Option |
Total Outstandings |
||||||||||||||||
Home loans |
||||||||||||||||||||||||
Core portfolio |
||||||||||||||||||||||||
Residential mortgage (5)
|
$ |
2,274 |
$ |
806 |
$ |
6,227 |
$ |
9,307 |
$ |
160,809 |
$ |
170,116 |
||||||||||||
Home equity |
273 |
146 |
591 |
1,010 |
59,841 |
60,851 |
||||||||||||||||||
Legacy Assets & Servicing portfolio |
||||||||||||||||||||||||
Residential mortgage (6)
|
2,939 |
1,715 |
26,728 |
31,382 |
34,004 |
$ |
17,571 |
82,957 |
||||||||||||||||
Home equity |
607 |
356 |
1,444 |
2,407 |
36,191 |
8,547 |
47,145 |
|||||||||||||||||
Credit card and other consumer |
||||||||||||||||||||||||
U.S. credit card |
729 |
582 |
1,437 |
2,748 |
92,087 |
94,835 |
||||||||||||||||||
Non-U.S. credit card |
106 |
85 |
212 |
403 |
11,294 |
11,697 |
||||||||||||||||||
Direct/Indirect consumer (7)
|
569 |
239 |
573 |
1,381 |
81,824 |
83,205 |
||||||||||||||||||
Other consumer (8)
|
48 |
19 |
4 |
71 |
1,557 |
1,628 |
||||||||||||||||||
Total consumer loans |
7,545 |
3,948 |
37,216 |
48,709 |
477,607 |
26,118 |
552,434 |
|||||||||||||||||
Consumer loans accounted for under the fair value option (9)
|
$ |
1,005 |
1,005 |
|||||||||||||||||||||
Total consumer |
7,545 |
3,948 |
37,216 |
48,709 |
477,607 |
26,118 |
1,005 |
553,439 |
||||||||||||||||
Commercial |
||||||||||||||||||||||||
U.S. commercial |
323 |
133 |
639 |
1,095 |
196,031 |
197,126 |
||||||||||||||||||
Commercial real estate (10)
|
79 |
144 |
983 |
1,206 |
37,431 |
38,637 |
||||||||||||||||||
Commercial lease financing |
84 |
79 |
30 |
193 |
23,650 |
23,843 |
||||||||||||||||||
Non-U.S. commercial |
2 |
— |
— |
2 |
74,182 |
74,184 |
||||||||||||||||||
U.S. small business commercial |
101 |
75 |
168 |
344 |
12,249 |
12,593 |
||||||||||||||||||
Total commercial loans |
589 |
431 |
1,820 |
2,840 |
343,543 |
346,383 |
||||||||||||||||||
Commercial loans accounted for under the fair value option (9)
|
7,997 |
7,997 |
||||||||||||||||||||||
Total commercial |
589 |
431 |
1,820 |
2,840 |
343,543 |
7,997 |
354,380 |
|||||||||||||||||
Total loans and leases |
$ |
8,134 |
$ |
4,379 |
$ |
39,036 |
$ |
51,549 |
$ |
821,150 |
$ |
26,118 |
$ |
9,002 |
$ |
907,819 |
||||||||
Percentage of outstandings |
0.90 |
% |
0.48 |
% |
4.30 |
% |
5.68 |
% |
90.45 |
% |
2.88 |
% |
0.99 |
% |
||||||||||
(1) |
Home loans 30-59 days past due includes fully-insured loans of $2.3 billion and nonperforming loans of $702 million. Home loans 60-89 days past due includes fully-insured loans of $1.3 billion and nonperforming loans of $558 million.
|
(2) |
Home loans includes fully-insured loans of $22.2 billion.
|
(3) |
Home loans includes $5.5 billion and direct/indirect consumer includes $63 million of nonperforming loans.
|
(4) |
PCI loan amounts are shown gross of the valuation allowance. |
(5) |
Total outstandings includes non-U.S. residential mortgage loans of $93 million.
|
(6) |
Total outstandings includes pay option loans of $6.7 billion and subprime loans of $509 million. The Corporation no longer originates these products.
|
(7) |
Total outstandings includes dealer financial services loans of $35.9 billion, consumer lending loans of $4.7 billion, U.S. securities-based lending margin loans of $28.3 billion, student loans of $4.8 billion, non-U.S. consumer loans of $8.3 billion and other consumer loans of $1.2 billion.
|
(8) |
Total outstandings includes consumer finance loans of $1.4 billion, other non-U.S. consumer loans of $5 million and consumer overdrafts of $177 million.
|
(9) |
Consumer loans accounted for under the fair value option were residential mortgage loans of $1.0 billion. Commercial loans accounted for under the fair value option were U.S. commercial loans of $2.3 billion and non-U.S. commercial loans of $5.7 billion. For additional information, see Note 16 – Fair Value Measurements and Note 17 – Fair Value Option.
|
(10) |
Total outstandings includes U.S. commercial real estate loans of $37.2 billion and non-U.S. commercial real estate loans of $1.5 billion.
|
156
The Corporation mitigates a portion of its credit risk on the residential mortgage portfolio through the use of synthetic securitization vehicles. These vehicles issue long-term notes to investors, the proceeds of which are held as cash collateral. The Corporation pays a premium to the vehicles to purchase mezzanine loss protection on a portfolio of residential mortgage loans owned by the Corporation. Cash held in the vehicles is used to reimburse the Corporation in the event that losses on the mortgage portfolio exceed 10 basis points (bps) of the original pool balance, up to the remaining amount of purchased loss protection of $449 million and $500 million at March 31, 2013 and December 31, 2012. The vehicles from which the Corporation purchases credit protection are VIEs. The Corporation does not have a variable interest in these vehicles, and accordingly, these vehicles are not consolidated by the Corporation. Amounts due from the vehicles are recorded in other loss in the Consolidated Statement of Income when the Corporation recognizes a reimbursable loss, as described above. Amounts are collected when reimbursable losses are realized through the sale of the underlying collateral. At March 31, 2013 and December 31, 2012, the Corporation had a receivable of $269 million and $305 million from these vehicles for reimbursement of losses, and principal of $16.3 billion and $17.6 billion of residential mortgage loans was referenced under these agreements. The Corporation records an allowance for credit losses on these loans without regard to the existence of the purchased loss protection as the protection does not represent a guarantee of individual loans.
In addition, the Corporation has entered into long-term credit protection agreements with FNMA and FHLMC on loans totaling $24.4 billion and $24.3 billion at March 31, 2013 and December 31, 2012, providing full protection on residential mortgage loans that become severely delinquent. All of these loans are individually insured and therefore the Corporation does not record an allowance for credit losses related to these loans. For additional information, see Note 8 – Representations and Warranties Obligations and Corporate Guarantees.
Nonperforming Loans and Leases |
In accordance with bank regulatory interagency guidance, the Corporation classifies junior-lien home equity loans as nonperforming when the first-lien loan becomes 90 days past due even if the junior-lien loan is performing. At March 31, 2013 and December 31, 2012, $1.4 billion and $1.5 billion of such loans were included in nonperforming loans.
In accordance with regulatory guidance, the Corporation classifies consumer real estate loans that have been discharged in Chapter 7 bankruptcy and not reaffirmed by the borrower as troubled debt restructurings (TDRs), irrespective of payment history or delinquency status, even if the repayment terms for the loan have not been otherwise modified. The Corporation continues to have a lien on the underlying collateral. At March 31, 2013, nonperforming loans discharged in Chapter 7 bankruptcy with no change in repayment terms at the time of discharge were $2.0 billion of which $961 million were current on their contractual payments while $917 million were 90 days or more past due. Of the contractually current nonperforming loans, more than 70 percent were discharged in Chapter 7 bankruptcy more than 12 months ago, and nearly 45 percent were discharged 24 months or more ago. As subsequent cash payments are received, the interest component of the payments is generally recorded as interest income on a cash basis and the principal component is recorded as a reduction in the carrying value of the loan.
157
The table below presents the Corporation's nonperforming loans and leases including nonperforming TDRs, and loans accruing past due 90 days or more at March 31, 2013 and December 31, 2012. Nonperforming loans held-for-sale (LHFS) are excluded from nonperforming loans and leases as they are recorded at either fair value or the lower of cost or fair value. See Note 1 – Summary of Significant Accounting Principles to the Consolidated Financial Statements of the Corporation's 2012 Annual Report on Form 10-K for further information on the criteria for classification as nonperforming.
Credit Quality |
|||||||||||||||
Nonperforming Loans and Leases (1)
|
Accruing Past Due 90 Days or More |
||||||||||||||
(Dollars in millions) |
March 31 2013 |
December 31 2012 |
March 31 2013 |
December 31 2012 |
|||||||||||
Home loans |
|||||||||||||||
Core portfolio |
|||||||||||||||
Residential mortgage (2)
|
$ |
3,407 |
$ |
3,190 |
$ |
4,391 |
$ |
3,984 |
|||||||
Home equity |
1,302 |
1,265 |
— |
— |
|||||||||||
Legacy Assets & Servicing portfolio |
|||||||||||||||
Residential mortgage (2)
|
11,595 |
11,866 |
17,226 |
18,173 |
|||||||||||
Home equity |
2,893 |
3,016 |
— |
— |
|||||||||||
Credit card and other consumer |
|||||||||||||||
U.S. credit card |
n/a |
n/a |
1,360 |
1,437 |
|||||||||||
Non-U.S. credit card |
n/a |
n/a |
181 |
212 |
|||||||||||
Direct/Indirect consumer |
84 |
92 |
494 |
545 |
|||||||||||
Other consumer |
1 |
2 |
1 |
2 |
|||||||||||
Total consumer |
19,282 |
19,431 |
23,653 |
24,353 |
|||||||||||
Commercial |
|||||||||||||||
U.S. commercial |
1,354 |
1,484 |
23 |
65 |
|||||||||||
Commercial real estate |
1,139 |
1,513 |
11 |
29 |
|||||||||||
Commercial lease financing |
19 |
44 |
10 |
15 |
|||||||||||
Non-U.S. commercial |
112 |
68 |
— |
— |
|||||||||||
U.S. small business commercial |
110 |
115 |
116 |
120 |
|||||||||||
Total commercial |
2,734 |
3,224 |
160 |
229 |
|||||||||||
Total loans and leases |
$ |
22,016 |
$ |
22,655 |
$ |
23,813 |
$ |
24,582 |
|||||||
(1) |
Nonperforming loan balances do not include nonaccruing TDRs removed from the PCI loan portfolio prior to January 1, 2010 of $512 million and $521 million at March 31, 2013 and December 31, 2012.
|
(2) |
Residential mortgage loans accruing past due 90 days or more are fully-insured loans. At March 31, 2013 and December 31, 2012, residential mortgage includes $17.0 billion and $17.8 billion of loans on which interest has been curtailed by the FHA, and therefore are no longer accruing interest, although principal is still insured, and $4.6 billion and $4.4 billion of loans on which interest is still accruing.
|
n/a = not applicable
158
Credit Quality Indicators |
The Corporation monitors credit quality within its Home Loans, Credit Card and Other Consumer, and Commercial portfolio segments based on primary credit quality indicators. For more information on the portfolio segments, see Note 1 – Summary of Significant Accounting Principles to the Consolidated Financial Statements of the Corporation's 2012 Annual Report on Form 10-K. Within the Home Loans portfolio segment, the primary credit quality indicators are refreshed LTV and refreshed FICO score. Refreshed LTV measures the carrying value of the loan as a percentage of the value of property securing the loan, refreshed quarterly. Home equity loans are evaluated using combined loan-to-value (CLTV) which measures the carrying value of the combined loans that have liens against the property and the available line of credit as a percentage of the appraised value of the property securing the loan, refreshed quarterly. FICO score measures the creditworthiness of the borrower based on the financial obligations of the borrower and the borrower's credit history. At a minimum, FICO scores are refreshed quarterly, and in many cases, more frequently. FICO scores are also a primary credit quality indicator for the Credit Card and Other Consumer portfolio segment and the business card portfolio within U.S. small business commercial. Within the Commercial portfolio segment, loans are evaluated using the internal classifications of pass rated or reservable criticized as the primary credit quality indicators. The term reservable criticized refers to those commercial loans that are internally classified or listed by the Corporation as Special Mention, Substandard or Doubtful, which are asset categories defined by regulatory authorities. These assets have an elevated level of risk and may have a high probability of default or total loss. Pass rated refers to all loans not considered reservable criticized. In addition to these primary credit quality indicators, the Corporation uses other credit quality indicators for certain types of loans.
159
The following tables present certain credit quality indicators for the Corporation's Home Loans, Credit Card and Other Consumer, and Commercial portfolio segments, by class of financing receivables, at March 31, 2013 and December 31, 2012.
Home Loans – Credit Quality Indicators (1)
|
||||||||||||||||||
March 31, 2013 |
||||||||||||||||||
(Dollars in millions) |
Core Portfolio Residential Mortgage (2)
|
Legacy Assets & Servicing Residential Mortgage (2)
|
Residential Mortgage PCI (3) |
Core Portfolio Home Equity (2)
|
Legacy Assets & Servicing Home Equity (2)
|
Home
Equity PCI
|
||||||||||||
Refreshed LTV (4)
|
||||||||||||||||||
Less than 90 percent |
$ |
84,300 |
$ |
22,125 |
$ |
11,877 |
$ |
44,202 |
$ |
15,541 |
$ |
1,980 |
||||||
Greater than 90 percent but less than 100 percent |
8,368 |
5,013 |
3,142 |
5,606 |
4,357 |
736 |
||||||||||||
Greater than 100 percent |
10,182 |
13,979 |
6,985 |
9,150 |
16,702 |
4,944 |
||||||||||||
Fully-insured loans (5)
|
67,583 |
23,370 |
— |
— |
— |
— |
||||||||||||
Total home loans |
$ |
170,433 |
$ |
64,487 |
$ |
22,004 |
$ |
58,958 |
$ |
36,600 |
$ |
7,660 |
||||||
Refreshed FICO score |
||||||||||||||||||
Less than 620 |
$ |
6,350 |
$ |
13,567 |
$ |
12,421 |
$ |
2,555 |
$ |
5,035 |
$ |
1,388 |
||||||
Greater than or equal to 620 and less than 680 |
8,620 |
6,526 |
3,490 |
4,416 |
5,600 |
1,342 |
||||||||||||
Greater than or equal to 680 and less than 740 |
24,639 |
8,587 |
3,192 |
12,360 |
9,978 |
2,181 |
||||||||||||
Greater than or equal to 740 |
63,241 |
12,437 |
2,901 |
39,627 |
15,987 |
2,749 |
||||||||||||
Fully-insured loans (5)
|
67,583 |
23,370 |
— |
— |
— |
— |
||||||||||||
Total home loans |
$ |
170,433 |
$ |
64,487 |
$ |
22,004 |
$ |
58,958 |
$ |
36,600 |
$ |
7,660 |
||||||
(1) |
Excludes loans accounted for under the fair value option of $1.0 billion.
|
(2) |
Excludes PCI loans. |
(3) |
Includes $5.9 billion of pay option loans and $340 million of subprime loans. The Corporation no longer originates these products.
|
(4) |
Refreshed LTV percentages for PCI loans are calculated using the carrying value net of the related valuation allowance. |
(5) |
Credit quality indicators are not reported for fully-insured loans as principal repayment is insured. |
Credit Card and Other Consumer – Credit Quality Indicators | |||||||||||||||
March 31, 2013 |
|||||||||||||||
(Dollars in millions) |
U.S. Credit Card |
Non-U.S. Credit Card |
Direct/Indirect Consumer |
Other Consumer (1) |
|||||||||||
Refreshed FICO score |
|||||||||||||||
Less than 620 |
$ |
5,788 |
$ |
— |
$ |
1,680 |
$ |
636 |
|||||||
Greater than or equal to 620 and less than 680 |
13,467 |
— |
3,272 |
292 |
|||||||||||
Greater than or equal to 680 and less than 740 |
35,881 |
— |
9,555 |
222 |
|||||||||||
Greater than or equal to 740 |
34,911 |
— |
25,073 |
206 |
|||||||||||
Other internal credit metrics (2, 3, 4)
|
— |
10,620 |
41,938 |
340 |
|||||||||||
Total credit card and other consumer |
$ |
90,047 |
$ |
10,620 |
$ |
81,518 |
$ |
1,696 |
|||||||
(1) |
80 percent of the other consumer portfolio is associated with portfolios from certain consumer finance businesses that the Corporation previously exited.
|
(2) |
Other internal credit metrics may include delinquency status, geography or other factors. |
(3) |
Direct/indirect consumer includes $35.6 billion of securities-based lending which is overcollateralized and therefore has minimal credit risk and $4.6 billion of loans the Corporation no longer originates.
|
(4) |
Non-U.S. credit card represents the U.K. credit card portfolio which is evaluated using internal credit metrics, including delinquency status. At March 31, 2013, 97 percent of this portfolio was current or less than 30 days past due, one percent was 30-89 days past due and two percent was 90 days or more past due.
|
Commercial – Credit Quality Indicators (1)
| |||||||||||||||||||
March 31, 2013 |
|||||||||||||||||||
(Dollars in millions) |
U.S. Commercial |
Commercial
Real Estate
|
Commercial Lease Financing |
Non-U.S. Commercial |
U.S. Small Business Commercial (2) |
||||||||||||||
Risk ratings |
|||||||||||||||||||
Pass rated |
$ |
193,755 |
$ |
36,116 |
$ |
22,510 |
$ |
81,089 |
$ |
1,516 |
|||||||||
Reservable criticized |
7,605 |
2,944 |
957 |
1,371 |
542 |
||||||||||||||
Refreshed FICO score (3)
|
|||||||||||||||||||
Less than 620 |
375 |
||||||||||||||||||
Greater than or equal to 620 and less than 680 |
569 |
||||||||||||||||||
Greater than or equal to 680 and less than 740 |
1,553 |
||||||||||||||||||
Greater than or equal to 740 |
2,504 |
||||||||||||||||||
Other internal credit metrics (3, 4)
|
5,343 |
||||||||||||||||||
Total commercial |
$ |
201,360 |
$ |
39,060 |
$ |
23,467 |
$ |
82,460 |
$ |
12,402 |
|||||||||
(1) |
Excludes loans accounted for under the fair value option of $7.8 billion.
|
(2) |
U.S. small business commercial includes $361 million of criticized business card and small business loans which are evaluated using refreshed FICO scores or internal credit metrics, including delinquency status, rather than risk ratings. At March 31, 2013, 99 percent of the balances where internal credit metrics are used were current or less than 30 days past due.
|
(3) |
Refreshed FICO score and other internal credit metrics are applicable only to the U.S. small business commercial portfolio. |
(4) |
Other internal credit metrics may include delinquency status, application scores, geography or other factors. |
160
Home Loans – Credit Quality Indicators (1)
|
||||||||||||||||||
December 31, 2012 |
||||||||||||||||||
(Dollars in millions) |
Core Portfolio Residential Mortgage (2) |
Legacy Assets & Servicing Residential Mortgage (2) |
Residential Mortgage PCI (3) |
Core Portfolio Home Equity (2)
|
Legacy Assets & Servicing Home Equity (2) |
Home
Equity PCI
|
||||||||||||
Refreshed LTV (4)
|
||||||||||||||||||
Less than 90 percent |
$ |
80,585 |
$ |
20,622 |
$ |
8,604 |
$ |
44,971 |
$ |
15,907 |
$ |
2,050 |
||||||
Greater than 90 percent but less than 100 percent |
8,891 |
5,103 |
2,384 |
5,825 |
4,507 |
788 |
||||||||||||
Greater than 100 percent |
12,984 |
16,463 |
6,583 |
10,055 |
18,184 |
5,709 |
||||||||||||
Fully-insured loans (5)
|
67,656 |
23,198 |
— |
— |
— |
— |
||||||||||||
Total home loans |
$ |
170,116 |
$ |
65,386 |
$ |
17,571 |
$ |
60,851 |
$ |
38,598 |
$ |
8,547 |
||||||
Refreshed FICO score |
||||||||||||||||||
Less than 620 |
$ |
6,366 |
$ |
14,325 |
$ |
8,711 |
$ |
2,586 |
$ |
5,408 |
$ |
1,930 |
||||||
Greater than or equal to 620 and less than 680 |
8,561 |
6,165 |
2,740 |
4,500 |
5,885 |
1,500 |
||||||||||||
Greater than or equal to 680 and less than 740 |
25,141 |
8,618 |
2,995 |
12,625 |
10,387 |
2,278 |
||||||||||||
Greater than or equal to 740 |
62,392 |
13,080 |
3,125 |
41,140 |
16,918 |
2,839 |
||||||||||||
Fully-insured loans (5)
|
67,656 |
23,198 |
— |
— |
— |
— |
||||||||||||
Total home loans |
$ |
170,116 |
$ |
65,386 |
$ |
17,571 |
$ |
60,851 |
$ |
38,598 |
$ |
8,547 |
||||||
(1) |
Excludes loans accounted for under the fair value option of $1.0 billion.
|
(2) |
Excludes PCI loans. |
(3) |
Includes $6.1 billion of pay option loans and $348 million of subprime loans. The Corporation no longer originates these products.
|
(4) |
Refreshed LTV percentages for PCI loans are calculated using the carrying value net of the related valuation allowance. |
(5) |
Credit quality indicators are not reported for fully-insured loans as principal repayment is insured. |
Credit Card and Other Consumer – Credit Quality Indicators | |||||||||||||||
December 31, 2012 |
|||||||||||||||
(Dollars in millions) |
U.S. Credit Card |
Non-U.S. Credit Card |
Direct/Indirect Consumer |
Other Consumer (1) |
|||||||||||
Refreshed FICO score |
|||||||||||||||
Less than 620 |
$ |
6,188 |
$ |
— |
$ |
1,896 |
$ |
668 |
|||||||
Greater than or equal to 620 and less than 680 |
13,947 |
— |
3,367 |
301 |
|||||||||||
Greater than or equal to 680 and less than 740 |
37,167 |
— |
9,592 |
232 |
|||||||||||
Greater than or equal to 740 |
37,533 |
— |
25,164 |
212 |
|||||||||||
Other internal credit metrics (2, 3, 4)
|
— |
11,697 |
43,186 |
215 |
|||||||||||
Total credit card and other consumer |
$ |
94,835 |
$ |
11,697 |
$ |
83,205 |
$ |
1,628 |
|||||||
(1) |
87 percent of the other consumer portfolio is associated with portfolios from certain consumer finance businesses that the Corporation previously exited.
|
(2) |
Other internal credit metrics may include delinquency status, geography or other factors. |
(3) |
Direct/indirect consumer includes $36.5 billion of securities-based lending which is overcollateralized and therefore has minimal credit risk and $4.8 billion of loans the Corporation no longer originates.
|
(4) |
Non-U.S. credit card represents the U.K. credit card portfolio which is evaluated using internal credit metrics, including delinquency status. At December 31, 2012, 97 percent of this portfolio was current or less than 30 days past due, one percent was 30-89 days past due and two percent was 90 days or more past due.
|
Commercial – Credit Quality Indicators (1)
| |||||||||||||||||||
December 31, 2012 |
|||||||||||||||||||
(Dollars in millions) |
U.S. Commercial |
Commercial Real Estate |
Commercial Lease Financing |
Non-U.S. Commercial |
U.S. Small Business Commercial (2) |
||||||||||||||
Risk ratings |
|||||||||||||||||||
Pass rated |
$ |
189,602 |
$ |
34,968 |
$ |
22,874 |
$ |
72,688 |
$ |
1,690 |
|||||||||
Reservable criticized |
7,524 |
3,669 |
969 |
1,496 |
573 |
||||||||||||||
Refreshed FICO score (3)
|
|||||||||||||||||||
Less than 620 |
400 |
||||||||||||||||||
Greater than or equal to 620 and less than 680 |
580 |
||||||||||||||||||
Greater than or equal to 680 and less than 740 |
1,553 |
||||||||||||||||||
Greater than or equal to 740 |
2,496 |
||||||||||||||||||
Other internal credit metrics (3, 4)
|
5,301 |
||||||||||||||||||
Total commercial |
$ |
197,126 |
$ |
38,637 |
$ |
23,843 |
$ |
74,184 |
$ |
12,593 |
|||||||||
(1) |
Excludes loans accounted for under the fair value option of $8.0 billion.
|
(2) |
U.S. small business commercial includes $366 million of criticized business card and small business loans which are evaluated using refreshed FICO scores or internal credit metrics, including delinquency status, rather than risk ratings. At December 31, 2012, 98 percent of the balances where internal credit metrics are used were current or less than 30 days past due.
|
(3) |
Refreshed FICO score and other internal credit metrics are applicable only to the U.S. small business commercial portfolio. |
(4) |
Other internal credit metrics may include delinquency status, application scores, geography or other factors. |
161
Impaired Loans and Troubled Debt Restructurings |
A loan is considered impaired when, based on current information, it is probable that the Corporation will be unable to collect all amounts due from the borrower in accordance with the contractual terms of the loan. Impaired loans include nonperforming commercial loans and all consumer and commercial TDRs. For more information, see Note 1 – Summary of Significant Accounting Principles to the Consolidated Financial Statements of the Corporation's 2012 Annual Report on Form 10-K. Impaired loans exclude nonperforming consumer loans and nonperforming commercial leases unless they are classified as TDRs. Loans accounted for under the fair value option are also excluded. Purchased credit-impaired (PCI) loans are excluded and reported separately on page 171.
Home Loans
Impaired home loans within the Home Loans portfolio segment consist entirely of TDRs. Excluding PCI loans, most modifications of home loans meet the definition of TDRs when a binding offer is extended to a borrower. Modifications of home loans are done in accordance with the government's Making Home Affordable Program (modifications under government programs) or the Corporation's proprietary programs (modifications under proprietary programs). These modifications are considered to be TDRs if concessions have been granted to borrowers experiencing financial difficulties. Concessions may include reductions in interest rates, capitalization of past due amounts, principal and/or interest forbearance, payment extensions, principal and/or interest forgiveness, or combinations thereof. During 2012, the Corporation implemented a borrower assistance program that provides forgiveness of principal balances in connection with the settlement agreement among the Corporation and certain of its affiliates and subsidiaries, together with the U.S. Department of Justice, the U.S. Department of Housing and Urban Development (HUD) and other federal agencies, and 49 state Attorneys General concerning the terms of a global settlement resolving investigations into certain origination, servicing and foreclosure practices (National Mortgage Settlement). In addition, the Corporation also provides interest rate modifications to qualified borrowers pursuant to the National Mortgage Settlement and these interest rate modifications are not considered to be TDRs.
Prior to permanently modifying a loan, the Corporation may enter into trial modifications with certain borrowers under both government and proprietary programs, including the borrower assistance program pursuant to the National Mortgage Settlement. Trial modifications generally represent a three- to four-month period during which the borrower makes monthly payments under the anticipated modified payment terms. Upon successful completion of the trial period, the Corporation and the borrower enter into a permanent modification. Binding trial modifications are classified as TDRs when the trial offer is made and continue to be classified as TDRs regardless of whether the borrower enters into a permanent modification.
In accordance with regulatory guidance addressing certain home loans that have been discharged in Chapter 7 bankruptcy, $4.1 billion of home loans that have been discharged in Chapter 7 bankruptcy with no change in repayment terms at the time of discharge were included in TDRs at March 31, 2013, of which $2.0 billion were classified as nonperforming and $2.1 billion were loans fully-insured by the Federal Housing Administration (FHA). Of the $4.1 billion of home loan TDRs, approximately six percent, 38 percent and 56 percent had been discharged in Chapter 7 bankruptcy in the first quarter of 2013, in the year ended December 31, 2012 and in years prior to 2012, respectively. For more information on the regulatory guidance on loans discharged in Chapter 7 bankruptcy, see Nonperforming Loans and Leases in this Note.
In accordance with applicable accounting guidance, a home loan, excluding PCI loans which are reported separately, is not classified as impaired unless it is a TDR. Once such a loan has been designated as a TDR, it is then individually assessed for impairment. Home loan TDRs are measured primarily based on the net present value of the estimated cash flows discounted at the loan's original effective interest rate, as discussed in the paragraph below. If the carrying value of a TDR exceeds this amount, a specific allowance is recorded as a component of the allowance for loan and lease losses. Alternatively, home loan TDRs that are considered to be dependent solely on the collateral for repayment (e.g., due to the lack of income verification or as a result of being discharged in Chapter 7 bankruptcy) are measured based on the estimated fair value of the collateral and a charge-off is recorded if the carrying value exceeds the fair value of the collateral. Home loans that reached 180 days past due prior to modification had been charged off to their net realizable value before they were modified as TDRs in accordance with established policy. Therefore, modifications of home loans that are 180 or more days past due as TDRs do not have an impact on the allowance for loan and lease losses nor are additional charge-offs required at the time of modification. Subsequent declines in the fair value of the collateral after a loan has reached 180 days past due are recorded as charge-offs. Fully-insured loans are protected against principal loss, and therefore, the Corporation does not record an allowance for loan and lease losses on the outstanding principal balance, even after they have been modified in a TDR.
162
The net present value of the estimated cash flows is based on model-driven estimates of projected payments, prepayments, defaults and loss-given-default (LGD). Using statistical modeling methodologies, the Corporation estimates the probability that a loan will default prior to maturity based on the attributes of each loan. The factors that are most relevant to the probability of default are the refreshed LTV, or in the case of a subordinated lien, refreshed CLTV, borrower credit score, months since origination (i.e., vintage) and geography. Each of these factors is further broken down by present collection status (whether the loan is current, delinquent, in default or in bankruptcy). Severity (or LGD) is estimated based on the refreshed LTV for first mortgages or CLTV for subordinated liens. The estimates are based on the Corporation's historical experience, but are adjusted to reflect an assessment of environmental factors that may not be reflected in the historical data, such as changes in real estate values, local and national economies, underwriting standards and the regulatory environment. The probability of default models also incorporate recent experience with modification programs including redefaults subsequent to modification, a loan's default history prior to modification and the change in borrower payments post-modification.
At March 31, 2013 and December 31, 2012, remaining commitments to lend additional funds to debtors whose terms have been modified in a home loan TDR were immaterial. Home loan foreclosed properties totaled $620 million and $650 million at March 31, 2013 and December 31, 2012.
The table below presents impaired loans in the Corporation's Home Loans portfolio segment at March 31, 2013 and December 31, 2012, and for the three months ended March 31, 2013 and 2012 and includes primarily loans managed by Legacy Assets & Servicing. Certain impaired home loans do not have a related allowance as the current valuation of these impaired loans exceeded the carrying value.
Impaired Loans – Home Loans |
|||||||||||||||||||||||||||
Three Months Ended March 31 |
|||||||||||||||||||||||||||
March 31, 2013 |
2013 |
2012 |
|||||||||||||||||||||||||
(Dollars in millions) |
Unpaid Principal Balance |
Carrying Value |
Related Allowance |
Average Carrying Value |
Interest Income Recognized (1) |
Average Carrying Value |
Interest Income Recognized (1) |
||||||||||||||||||||
With no recorded allowance |
|||||||||||||||||||||||||||
Residential mortgage |
$ |
22,130 |
$ |
16,821 |
n/a |
$ |
15,894 |
$ |
144 |
$ |
8,704 |
$ |
75 |
||||||||||||||
Home equity |
2,796 |
1,164 |
n/a |
1,134 |
17 |
506 |
9 |
||||||||||||||||||||
With an allowance recorded |
|||||||||||||||||||||||||||
Residential mortgage |
$ |
15,698 |
$ |
14,641 |
$ |
1,425 |
$ |
13,900 |
$ |
154 |
$ |
11,174 |
$ |
100 |
|||||||||||||
Home equity |
1,168 |
955 |
370 |
988 |
11 |
1,255 |
9 |
||||||||||||||||||||
Total |
|||||||||||||||||||||||||||
Residential mortgage |
$ |
37,828 |
$ |
31,462 |
$ |
1,425 |
$ |
29,794 |
$ |
298 |
$ |
19,878 |
$ |
175 |
|||||||||||||
Home equity |
3,964 |
2,119 |
370 |
2,122 |
28 |
1,761 |
18 |
||||||||||||||||||||
December 31, 2012 |
|||||||||||||||||||||||||||
With no recorded allowance |
|||||||||||||||||||||||||||
Residential mortgage |
$ |
20,226 |
$ |
14,967 |
n/a |
||||||||||||||||||||||
Home equity |
2,624 |
1,103 |
n/a |
||||||||||||||||||||||||
With an allowance recorded |
|||||||||||||||||||||||||||
Residential mortgage |
$ |
14,223 |
$ |
13,158 |
$ |
1,252 |
|||||||||||||||||||||
Home equity |
1,256 |
1,022 |
448 |
||||||||||||||||||||||||
Total |
|||||||||||||||||||||||||||
Residential mortgage |
$ |
34,449 |
$ |
28,125 |
$ |
1,252 |
|||||||||||||||||||||
Home equity |
3,880 |
2,125 |
448 |
||||||||||||||||||||||||
(1) |
Interest income recognized includes interest accrued and collected on the outstanding balances of accruing impaired loans as well as interest cash collections on nonaccruing impaired loans for which the principal is considered collectible. |
n/a = not applicable
163
The table below presents the March 31, 2013 and 2012 unpaid principal balance, carrying value, and average pre- and post-modification interest rates of home loans that were modified in TDRs during the three months ended March 31, 2013 and 2012, and net charge-offs that were recorded during the period in which the modification occurred. The following Home Loans portfolio segment tables include loans that were initially classified as TDRs during the period and also loans that had previously been classified as TDRs and were modified again during the period. These TDRs are managed by Legacy Assets & Servicing.
Home Loans – TDRs Entered into During the Three Months Ended March 31, 2013 (1)
| |||||||||||||||||
March 31, 2013 |
Three Months Ended March 31, 2013 |
||||||||||||||||
(Dollars in millions) |
Unpaid Principal Balance |
Carrying Value |
Pre-Modification Interest Rate |
Post-Modification Interest Rate |
Net Charge-offs |
||||||||||||
Residential mortgage |
$ |
5,439 |
$ |
4,843 |
5.45 |
% |
4.65 |
% |
$ |
39 |
|||||||
Home equity |
265 |
154 |
5.90 |
4.58 |
64 |
||||||||||||
Total |
$ |
5,704 |
$ |
4,997 |
5.47 |
4.65 |
$ |
103 |
|||||||||
Home Loans – TDRs Entered into During the Three Months Ended March 31, 2012 (1)
| |||||||||||||||||
March 31, 2012 |
Three Months Ended March 31, 2012 |
||||||||||||||||
Residential mortgage |
$ |
1,578 |
$ |
1,382 |
5.69 |
% |
4.73 |
% |
$ |
56 |
|||||||
Home equity |
196 |
110 |
5.39 |
3.90 |
43 |
||||||||||||
Total |
$ |
1,774 |
$ |
1,492 |
5.66 |
4.64 |
$ |
99 |
|||||||||
(1) |
TDRs entered into during the three months ended March 31, 2013 include residential mortgage modifications with principal forgiveness of $219 million. For the three months ended March 31, 2012, the principal forgiveness amount was not significant.
|
164
The table below presents the March 31, 2013 and 2012 carrying value for home loans that were modified in a TDR during the three months ended March 31, 2013 and 2012 by type of modification.
Home Loans – Modification Programs | |||||||||||
|
TDRs Entered into During the
Three Months Ended March 31, 2013
|
|||||||||||
(Dollars in millions) |
Residential Mortgage |
Home
Equity
|
Total Carrying Value |
||||||||
Modifications under government programs |
|||||||||||
Contractual interest rate reduction |
$ |
626 |
$ |
12 |
$ |
638 |
|||||
Principal and/or interest forbearance |
4 |
9 |
13 |
||||||||
Other modifications (1)
|
46 |
— |
46 |
||||||||
Total modifications under government programs |
676 |
21 |
697 |
||||||||
Modifications under proprietary programs |
|||||||||||
Contractual interest rate reduction |
1,326 |
24 |
1,350 |
||||||||
Capitalization of past due amounts |
27 |
— |
27 |
||||||||
Principal and/or interest forbearance |
81 |
3 |
84 |
||||||||
Other modifications (1)
|
28 |
— |
28 |
||||||||
Total modifications under proprietary programs |
1,462 |
27 |
1,489 |
||||||||
Trial modifications |
2,103 |
31 |
2,134 |
||||||||
Loans discharged in Chapter 7 bankruptcy (2)
|
602 |
75 |
677 |
||||||||
Total modifications |
$ |
4,843 |
$ |
154 |
$ |
4,997 |
|||||
|
TDRs Entered into During the
Three Months Ended March 31, 2012
|
|||||||||||
Modifications under government programs |
|||||||||||
Contractual interest rate reduction |
$ |
39 |
$ |
31 |
$ |
70 |
|||||
Principal and/or interest forbearance |
1 |
10 |
11 |
||||||||
Other modifications (1)
|
16 |
— |
16 |
||||||||
Total modifications under government programs |
56 |
41 |
97 |
||||||||
Modifications under proprietary programs |
|||||||||||
Contractual interest rate reduction |
376 |
16 |
392 |
||||||||
Capitalization of past due amounts |
12 |
— |
12 |
||||||||
Principal and/or interest forbearance |
93 |
7 |
100 |
||||||||
Other modifications (1)
|
53 |
2 |
55 |
||||||||
Total modifications under proprietary programs |
534 |
25 |
559 |
||||||||
Trial modifications |
792 |
44 |
836 |
||||||||
Total modifications |
$ |
1,382 |
$ |
110 |
$ |
1,492 |
|||||
(1) |
Includes other modifications such as term or payment extensions and repayment plans. |
(2) |
Includes loans discharged in Chapter 7 bankruptcy with no change in repayment terms that are classified as TDRs in accordance with regulatory guidance issued in the third quarter of 2012. For the three months ended March 31, 2013, residential mortgage loans of $371 million, or 55 percent of loans discharged in Chapter 7 bankruptcy were current or less than 60 days past due.
|
165
The table below presents the carrying value of loans that entered into payment default during the three months ended March 31, 2013 and 2012 and that were modified in a TDR during the 12 months preceding payment default. A payment default for home loan TDRs is recognized when a borrower has missed three monthly payments (not necessarily consecutively) since modification. Payment default on trial modification where the borrower has not yet met the terms of the agreement are included in the table below if the borrower is 90 days or more past due three months after the offer to modify is made.
Home Loans – TDRs Entering Payment Default That Were Modified During the Preceding 12 Months | |||||||||||
Three Months Ended March 31, 2013 |
|||||||||||
(Dollars in millions) |
Residential Mortgage |
Home Equity |
Total Carrying Value |
||||||||
Modifications under government programs |
$ |
91 |
$ |
2 |
$ |
93 |
|||||
Modifications under proprietary programs |
282 |
3 |
285 |
||||||||
Loans discharged in Chapter 7 bankruptcy (1)
|
440 |
19 |
459 |
||||||||
Trial modifications |
552 |
3 |
555 |
||||||||
Total modifications |
$ |
1,365 |
$ |
27 |
$ |
1,392 |
|||||
Three Months Ended March 31, 2012 |
|||||||||||
Modifications under government programs |
$ |
75 |
$ |
2 |
$ |
77 |
|||||
Modifications under proprietary programs |
376 |
4 |
380 |
||||||||
Trial modifications |
125 |
5 |
130 |
||||||||
Total modifications |
$ |
576 |
$ |
11 |
$ |
587 |
|||||
(1) |
Includes loans discharged in Chapter 7 bankruptcy with no change in repayment terms that are classified as TDRs in accordance with regulatory guidance issued in the third quarter of 2012. |
Credit Card and Other Consumer
Impaired loans within the Credit Card and Other Consumer portfolio segment consist entirely of loans that have been modified in TDRs (the renegotiated credit card and other consumer TDR portfolio collectively referred to as the renegotiated TDR portfolio). The Corporation seeks to assist customers that are experiencing financial difficulty by modifying loans while ensuring compliance with federal laws and guidelines. Credit card and other consumer loan modifications generally involve reducing the interest rate on the account and placing the customer on a fixed payment plan not exceeding 60 months, all of which are considered TDRs. In addition, non-U.S. credit card modifications may involve reducing the interest rate on the account without placing the customer on a fixed payment plan, and are also considered TDRs. In all cases, the customer's available line of credit is canceled. The Corporation makes loan modifications directly with borrowers for debt held only by the Corporation (internal programs). Additionally, the Corporation makes loan modifications for borrowers working with third-party renegotiation agencies that provide solutions to customers' entire unsecured debt structures (external programs).
In 2012, regulatory guidance was issued addressing certain consumer real estate loans that have been discharged in Chapter 7 bankruptcy. The Corporation applies this guidance to other secured consumer loans that have been discharged in Chapter 7 bankruptcy, and such loans are classified as TDRs, written down to collateral value and placed on nonaccrual status no later than the time of discharge. For more information on the regulatory guidance on loans discharged in Chapter 7 bankruptcy, see Nonperforming Loans and Leases in this Note.
All credit card and substantially all other consumer loans that have been modified in TDRs remain on accrual status until the loan is either paid in full or charged off, which occurs no later than the end of the month in which the loan becomes 180 days past due or generally at 120 days past due for a loan that was placed on a fixed payment plan after July 1, 2012.
The allowance for impaired credit card and other consumer loans is based on the present value of projected cash flows, which incorporates the Corporation's historical payment default and loss experience on modified loans, discounted using the portfolio's average contractual interest rate, excluding promotionally priced loans, in effect prior to restructuring. Prior to modification, credit card and other consumer loans are included in homogeneous pools which are collectively evaluated for impairment. For these portfolios, loss forecast models are utilized that consider a variety of factors including, but not limited to, historical loss experience, delinquency status, economic trends and credit scores.
166
The table below provides information on the Corporation's renegotiated TDR portfolio in the Credit Card and Other Consumer portfolio segment at March 31, 2013 and December 31, 2012, and for the three months ended March 31, 2013 and 2012.
Impaired Loans – Credit Card and Other Consumer – Renegotiated TDRs |
|||||||||||||||||||||||||||
Three Months Ended March 31 |
|||||||||||||||||||||||||||
March 31, 2013 |
2013 |
2012 |
|||||||||||||||||||||||||
(Dollars in millions) |
Unpaid Principal Balance |
Carrying Value (1) |
Related Allowance |
Average Carrying Value |
Interest Income Recognized (2) |
Average Carrying Value |
Interest Income Recognized (2) |
||||||||||||||||||||
With an allowance recorded |
|||||||||||||||||||||||||||
U.S. credit card |
$ |
2,403 |
$ |
2,416 |
$ |
558 |
$ |
2,725 |
$ |
42 |
$ |
5,019 |
$ |
77 |
|||||||||||||
Non-U.S. credit card |
276 |
281 |
177 |
295 |
2 |
572 |
2 |
||||||||||||||||||||
Direct/Indirect consumer |
524 |
527 |
168 |
598 |
8 |
1,146 |
16 |
||||||||||||||||||||
Without an allowance recorded |
|||||||||||||||||||||||||||
Direct/Indirect consumer |
95 |
48 |
— |
52 |
— |
— |
— |
||||||||||||||||||||
Total |
|||||||||||||||||||||||||||
U.S. credit card |
$ |
2,403 |
$ |
2,416 |
$ |
558 |
$ |
2,725 |
$ |
42 |
$ |
5,019 |
$ |
77 |
|||||||||||||
Non-U.S. credit card |
276 |
281 |
177 |
295 |
2 |
572 |
2 |
||||||||||||||||||||
Direct/Indirect consumer |
619 |
575 |
168 |
650 |
8 |
1,146 |
16 |
||||||||||||||||||||
December 31, 2012 |
|||||||||||||||||||||||||||
With an allowance recorded |
|||||||||||||||||||||||||||
U.S. credit card |
$ |
2,856 |
$ |
2,871 |
$ |
719 |
|||||||||||||||||||||
Non-U.S. credit card |
311 |
316 |
198 |
||||||||||||||||||||||||
Direct/Indirect consumer |
633 |
636 |
210 |
||||||||||||||||||||||||
Without an allowance recorded |
|||||||||||||||||||||||||||
Direct/Indirect consumer |
105 |
58 |
— |
||||||||||||||||||||||||
Total |
|||||||||||||||||||||||||||
U.S. credit card |
$ |
2,856 |
$ |
2,871 |
$ |
719 |
|||||||||||||||||||||
Non-U.S. credit card |
311 |
316 |
198 |
||||||||||||||||||||||||
Direct/Indirect consumer |
738 |
694 |
210 |
||||||||||||||||||||||||
(1) |
Includes accrued interest and fees. |
(2) |
Interest income recognized includes interest accrued and collected on the outstanding balances of accruing impaired loans as well as interest cash collections on nonaccruing impaired loans for which the principal is considered collectible. |
The table below provides information on the Corporation's primary modification programs for the renegotiated TDR portfolio at March 31, 2013 and December 31, 2012.
Credit Card and Other Consumer – Renegotiated TDRs by Program Type | ||||||||||||||||||||||||||||||||
Internal Programs |
External Programs |
Other |
Total |
Percent of Balances Current or Less Than 30 Days Past Due |
||||||||||||||||||||||||||||
(Dollars in millions) |
March 31 2013 |
December 31 2012 |
March 31 2013 |
December 31 2012 |
March 31 2013 |
December 31 2012 |
March 31 2013 |
December 31 2012 |
March 31 2013 |
December 31 2012 |
||||||||||||||||||||||
U.S. credit card |
$ |
1,541 |
$ |
1,887 |
$ |
848 |
$ |
953 |
$ |
27 |
$ |
31 |
$ |
2,416 |
$ |
2,871 |
82.03 |
% |
81.48 |
% |
||||||||||||
Non-U.S. credit card |
87 |
99 |
33 |
38 |
161 |
179 |
281 |
316 |
45.57 |
43.71 |
||||||||||||||||||||||
Direct/Indirect consumer |
332 |
405 |
190 |
225 |
53 |
64 |
575 |
694 |
84.07 |
83.11 |
||||||||||||||||||||||
Total renegotiated TDRs |
$ |
1,960 |
$ |
2,391 |
$ |
1,071 |
$ |
1,216 |
$ |
241 |
$ |
274 |
$ |
3,272 |
$ |
3,881 |
79.26 |
78.69 |
||||||||||||||
At March 31, 2013 and December 31, 2012, the Corporation had a renegotiated TDR portfolio of $3.3 billion and $3.9 billion of which $2.6 billion was current or less than 30 days past due under the modified terms at March 31, 2013.
167
The table below provides information on the Corporation's renegotiated TDR portfolio including the unpaid principal balance, carrying value and average pre- and post-modification interest rates of loans that were modified in TDRs during the three months ended March 31, 2013 and 2012, and net charge-offs that were recorded during the period in which the modification occurred.
Credit Card and Other Consumer – Renegotiated TDRs Entered into During the Three Months March 31, 2013 | |||||||||||||||||
March 31, 2013 |
Three Months Ended March 31, 2013 |
||||||||||||||||
(Dollars in millions) |
Unpaid Principal Balance |
Carrying Value (1)
|
Pre-Modification Interest Rate |
Post-Modification Interest Rate |
Net Charge-offs |
||||||||||||
U.S. credit card |
$ |
84 |
$ |
85 |
17.00 |
% |
6.16 |
% |
$ |
2 |
|||||||
Non-U.S. credit card |
76 |
80 |
26.24 |
0.65 |
3 |
||||||||||||
Direct/Indirect consumer |
17 |
13 |
10.05 |
5.35 |
4 |
||||||||||||
Total |
$ |
177 |
$ |
178 |
20.63 |
3.64 |
$ |
9 |
|||||||||
Credit Card and Other Consumer – Renegotiated TDRs Entered into During the Three Months Ended March 31, 2012 | |||||||||||||||||
March 31, 2012 |
Three Months Ended March 31, 2012 |
||||||||||||||||
U.S. credit card |
$ |
152 |
$ |
156 |
18.29 |
% |
6.35 |
% |
$ |
2 |
|||||||
Non-U.S. credit card |
114 |
120 |
26.19 |
0.81 |
5 |
||||||||||||
Direct/Indirect consumer |
25 |
26 |
15.50 |
4.31 |
— |
||||||||||||
Total |
$ |
291 |
$ |
302 |
21.19 |
3.97 |
$ |
7 |
|||||||||
(1) |
Includes accrued interest and fees. |
The table below provides information on the Corporation's primary modification programs for the renegotiated TDR portfolio for loans that were modified in TDRs during the three months ended March 31, 2013 and 2012.
Credit Card and Other Consumer – Renegotiated TDRs Entered into During the Period by Program Type | |||||||||||||||
Three Months Ended March 31, 2013 |
|||||||||||||||
(Dollars in millions) |
Internal Programs |
External Programs |
Other |
Total |
|||||||||||
U.S. credit card |
$ |
46 |
$ |
39 |
$ |
— |
$ |
85 |
|||||||
Non-U.S. credit card |
43 |
37 |
— |
80 |
|||||||||||
Direct/Indirect consumer |
4 |
3 |
6 |
13 |
|||||||||||
Total renegotiated TDRs |
$ |
93 |
$ |
79 |
$ |
6 |
$ |
178 |
|||||||
Three Months Ended March 31, 2012 |
|||||||||||||||
U.S. credit card |
$ |
79 |
$ |
77 |
$ |
— |
$ |
156 |
|||||||
Non-U.S. credit card |
63 |
57 |
— |
120 |
|||||||||||
Direct/Indirect consumer |
14 |
12 |
— |
26 |
|||||||||||
Total renegotiated TDRs |
$ |
156 |
$ |
146 |
$ |
— |
$ |
302 |
|||||||
Credit card and other consumer loans are deemed to be in payment default during the quarter in which a borrower misses the second of two consecutive payments. Payment defaults are one of the factors considered when projecting future cash flows in the calculation of the allowance for loan and lease losses for impaired credit card and other consumer loans. Based on historical experience, the Corporation estimates that 27 percent of new U.S. credit card TDRs, 64 percent of new non-U.S. credit card TDRs and 24 percent of new direct/indirect consumer TDRs may be in payment default within 12 months after modification. Loans that entered into payment default during the three months ended March 31, 2013 that had been modified in a TDR during the 12 months preceding were $24 million for U.S. credit card, $62 million for non-U.S. credit card and $3 million for direct/indirect consumer. During the three months ended March 31, 2012, loans that entered into payment default that had been modified in a TDR during the 12 months preceding were $82 million for U.S. credit card, $82 million for non-U.S. credit card and $16 million for direct/indirect consumer.
168
Commercial Loans
Impaired commercial loans, which include nonperforming loans and TDRs (both performing and nonperforming), are primarily measured based on the present value of payments expected to be received, discounted at the loan's original effective interest rate. Commercial impaired loans may also be measured based on observable market prices or, for loans that are solely dependent on the collateral for repayment, the estimated fair value of collateral less costs to sell. If the carrying value of a loan exceeds this amount, a specific allowance is recorded as a component of the allowance for loan and lease losses.
Modifications of loans to commercial borrowers that are experiencing financial difficulty are designed to reduce the Corporation's loss exposure while providing the borrower with an opportunity to work through financial difficulties, often to avoid foreclosure or bankruptcy. Each modification is unique and reflects the individual circumstances of the borrower. Modifications that result in a TDR may include extensions of maturity at a concessionary (below market) rate of interest, payment forbearances or other actions designed to benefit the customer while mitigating the Corporation's risk exposure. Reductions in interest rates are rare. Instead, the interest rates are typically increased, although the increased rate may not represent a market rate of interest. Infrequently, concessions may also include principal forgiveness in connection with foreclosure, short sale or other settlement agreements leading to termination or sale of the loan.
At the time of restructuring, the loans are remeasured to reflect the impact, if any, on projected cash flows resulting from the modified terms. If there was no forgiveness of principal and the interest rate was not decreased, the modification may have little or no impact on the allowance established for the loan. If a portion of the loan is deemed to be uncollectible, a charge-off may be recorded at the time of restructuring. Alternatively, a charge-off may have already been recorded in a previous period such that no charge-off is required at the time of modification. For information concerning modifications for the U.S. small business commercial portfolio, see Credit Card and Other Consumer in this Note.
At March 31, 2013 and December 31, 2012, remaining commitments to lend additional funds to debtors whose terms have been modified in a commercial loan TDR were immaterial. Commercial foreclosed properties totaled $206 million and $250 million at March 31, 2013 and December 31, 2012.
169
The table below presents impaired loans in the Corporation's Commercial loan portfolio segment at March 31, 2013 and December 31, 2012, and for the three months ended March 31, 2013 and 2012. Certain impaired commercial loans do not have a related allowance as the valuation of these impaired loans exceeded the carrying value, which is net of previously recorded charge-offs.
Impaired Loans – Commercial |
|||||||||||||||||||||||||||
Three Months Ended March 31 |
|||||||||||||||||||||||||||
March 31, 2013 |
2013 |
2012 |
|||||||||||||||||||||||||
(Dollars in millions) |
Unpaid Principal Balance |
Carrying Value |
Related Allowance |
Average Carrying Value |
Interest Income Recognized (1) |
Average Carrying Value |
Interest Income Recognized (1) |
||||||||||||||||||||
With no recorded allowance |
|||||||||||||||||||||||||||
U.S. commercial |
$ |
1,080 |
$ |
1,004 |
n/a |
$ |
1,057 |
$ |
6 |
$ |
1,035 |
$ |
8 |
||||||||||||||
Commercial real estate |
833 |
760 |
n/a |
831 |
4 |
1,973 |
4 |
||||||||||||||||||||
Non-U.S. commercial |
136 |
136 |
n/a |
128 |
2 |
114 |
— |
||||||||||||||||||||
With an allowance recorded |
|||||||||||||||||||||||||||
U.S. commercial |
$ |
1,608 |
$ |
1,107 |
$ |
158 |
$ |
1,116 |
$ |
8 |
$ |
1,920 |
$ |
11 |
|||||||||||||
Commercial real estate |
1,534 |
1,017 |
152 |
1,137 |
5 |
2,256 |
6 |
||||||||||||||||||||
Non-U.S. commercial |
252 |
58 |
18 |
26 |
1 |
45 |
— |
||||||||||||||||||||
U.S. small business commercial (2)
|
290 |
277 |
80 |
288 |
2 |
472 |
4 |
||||||||||||||||||||
Total |
|||||||||||||||||||||||||||
U.S. commercial |
$ |
2,688 |
$ |
2,111 |
$ |
158 |
$ |
2,173 |
$ |
14 |
$ |
2,955 |
$ |
19 |
|||||||||||||
Commercial real estate |
2,367 |
1,777 |
152 |
1,968 |
9 |
4,229 |
10 |
||||||||||||||||||||
Non-U.S. commercial |
388 |
194 |
18 |
154 |
3 |
159 |
— |
||||||||||||||||||||
U.S. small business commercial (2)
|
290 |
277 |
80 |
288 |
2 |
472 |
4 |
||||||||||||||||||||
December 31, 2012 |
|||||||||||||||||||||||||||
With no recorded allowance |
|||||||||||||||||||||||||||
U.S. commercial |
$ |
1,220 |
$ |
1,109 |
n/a |
||||||||||||||||||||||
Commercial real estate |
1,003 |
902 |
n/a |
||||||||||||||||||||||||
Non-U.S. commercial |
240 |
120 |
n/a |
||||||||||||||||||||||||
With an allowance recorded |
|||||||||||||||||||||||||||
U.S. commercial |
$ |
1,782 |
$ |
1,138 |
$ |
159 |
|||||||||||||||||||||
Commercial real estate |
2,287 |
1,262 |
201 |
||||||||||||||||||||||||
Non-U.S. commercial |
280 |
33 |
18 |
||||||||||||||||||||||||
U.S. small business commercial (2)
|
361 |
317 |
97 |
||||||||||||||||||||||||
Total |
|||||||||||||||||||||||||||
U.S. commercial |
$ |
3,002 |
$ |
2,247 |
$ |
159 |
|||||||||||||||||||||
Commercial real estate |
3,290 |
2,164 |
201 |
||||||||||||||||||||||||
Non-U.S. commercial |
520 |
153 |
18 |
||||||||||||||||||||||||
U.S. small business commercial (2)
|
361 |
317 |
97 |
||||||||||||||||||||||||
(1) |
Interest income recognized includes interest accrued and collected on the outstanding balances of accruing impaired loans as well as interest cash collections on nonaccruing impaired loans for which the principal is considered collectible. |
(2) |
Includes U.S. small business commercial renegotiated TDR loans and related allowance. |
n/a = not applicable
170
The table below presents the March 31, 2013 and 2012 unpaid principal balance and carrying value of commercial loans that were modified as TDRs during the three months ended March 31, 2013 and 2012, and net charge-offs that were recorded during the period in which the modification occurred. The following table includes loans that were initially classified as TDRs during the period and, beginning in the first quarter of 2013, also loans that had previously been classified as TDRs and were modified again during the period.
Commercial – TDRs Entered into During the Three Months Ended March 31, 2013 | |||||||||||
March 31, 2013 |
Three Months Ended March 31, 2013 |
||||||||||
(Dollars in millions) |
Unpaid Principal Balance |
Carrying Value |
Net Charge-offs |
||||||||
U.S. commercial |
$ |
397 |
$ |
394 |
$ |
— |
|||||
Commercial real estate |
266 |
223 |
— |
||||||||
U.S. small business commercial (1)
|
3 |
4 |
— |
||||||||
Total |
$ |
666 |
$ |
621 |
$ |
— |
|||||
Commercial – TDRs Entered into During the Three Months Ended March 31, 2012 | |||||||||||
March 31, 2012 |
Three Months Ended March 31, 2012 |
||||||||||
U.S. commercial |
$ |
356 |
$ |
344 |
$ |
— |
|||||
Commercial real estate |
339 |
252 |
4 |
||||||||
U.S. small business commercial (1)
|
10 |
10 |
— |
||||||||
Total |
$ |
705 |
$ |
606 |
$ |
4 |
|||||
(1) |
U.S. small business commercial TDRs are comprised of renegotiated small business card loans.
|
A commercial TDR is generally deemed to be in payment default when the loan is 90 days or more past due, including delinquencies that were not resolved as part of the modification. U.S. small business commercial TDRs are deemed to be in payment default during the quarter in which a borrower misses the second of two consecutive payments. Payment defaults are one of the factors considered when projecting future cash flows, along with observable market prices or fair value of collateral when measuring the allowance for loan losses. TDRs that were in payment default at March 31, 2013 and 2012 had a carrying value of $156 million and $173 million for U.S. commercial, $416 million and $457 million for commercial real estate and $2 million and $8 million for U.S. small business commercial.
Purchased Credit-impaired Loans |
PCI loans are acquired loans with evidence of credit quality deterioration since origination for which it is probable at purchase date that the Corporation will be unable to collect all contractually required payments. The following table provides details on PCI loans acquired during the three months ended March 31, 2013.
Purchased Loans at Acquisition Date | |||
(Dollars in millions) |
|||
Contractually required payments including interest |
$ |
8,274 |
|
Less: Nonaccretable difference |
2,159 |
||
Cash flows expected to be collected (1)
|
6,115 |
||
Less: Accretable yield |
1,125 |
||
Fair value of loans acquired |
$ |
4,990 |
|
(1) |
Represents undiscounted expected principal and interest cash flows at acquisition. |
171
The table below shows activity for the accretable yield on PCI loans, which primarily include the Countrywide Financial Corporation (Countrywide) portfolio and loans repurchased in connection with the FNMA Settlement. For more information on the FNMA Settlement, see Note 8 – Representations and Warranties Obligations and Corporate Guarantees. Reclassifications from nonaccretable difference primarily result when there is a change in expected cash flows due to various factors, including changes in interest rates on variable-rate loans and prepayment assumptions. Changes in the prepayment assumption affect the expected remaining life of the portfolio which results in a change to the amount of future interest cash flows.
Rollforward of Accretable Yield | |||
(Dollars in millions) |
|||
Accretable yield, January 1, 2012 |
$ |
4,990 |
|
Accretion |
(1,034 |
) |
|
Disposals/transfers |
(109 |
) |
|
Reclassifications from nonaccretable difference |
797 |
||
Accretable yield, December 31, 2012 |
4,644 |
||
Accretion |
(298 |
) |
|
Loans purchased |
1,125 |
||
Disposals/transfers |
(103 |
) |
|
Reclassifications from nonaccretable difference |
661 |
||
Accretable yield, March 31, 2013 |
$ |
6,029 |
|
See Note 1 – Summary of Significant Accounting Principles to the Consolidated Financial Statements of the Corporation's 2012 Annual Report on Form 10-K for further information on PCI loans and Note 6 – Allowance for Credit Losses herein for the carrying value and valuation allowance for PCI loans.
Loans Held-for-sale |
The Corporation had LHFS of $19.3 billion and $19.4 billion at March 31, 2013 and December 31, 2012. Proceeds from sales, securitizations and paydowns of LHFS were $21.3 billion and $10.0 billion for the three months ended March 31, 2013 and 2012. Amounts used for originations and purchases of LHFS were $20.1 billion and $10.5 billion for the three months ended March 31, 2013 and 2012.
172
NOTE 6 – Allowance for Credit Losses |
The table below summarizes the changes in the allowance for credit losses by portfolio segment for the three months ended March 31, 2013 and 2012.
Three Months Ended March 31, 2013 |
|||||||||||||||
(Dollars in millions) |
Home Loans |
Credit Card and Other Consumer |
Commercial |
Total |
|||||||||||
Allowance for loan and lease losses, January 1 |
$ |
14,933 |
$ |
6,140 |
$ |
3,106 |
$ |
24,179 |
|||||||
Loans and leases charged off |
(1,193 |
) |
(1,553 |
) |
(316 |
) |
(3,062 |
) |
|||||||
Recoveries of loans and leases previously charged off |
126 |
318 |
101 |
545 |
|||||||||||
Net charge-offs |
(1,067 |
) |
(1,235 |
) |
(215 |
) |
(2,517 |
) |
|||||||
Provision for loan and lease losses |
484 |
1,007 |
240 |
1,731 |
|||||||||||
Write-offs of PCI loans |
(839 |
) |
— |
— |
(839 |
) |
|||||||||
Other (1)
|
(73 |
) |
(38 |
) |
(2 |
) |
(113 |
) |
|||||||
Allowance for loan and lease losses, March 31 |
13,438 |
5,874 |
3,129 |
22,441 |
|||||||||||
Reserve for unfunded lending commitments, January 1 |
— |
— |
513 |
513 |
|||||||||||
Provision for unfunded lending commitments |
— |
— |
(18 |
) |
(18 |
) |
|||||||||
Other (2)
|
— |
— |
(9 |
) |
(9 |
) |
|||||||||
Reserve for unfunded lending commitments, March 31 |
— |
— |
486 |
486 |
|||||||||||
Allowance for credit losses, March 31 |
$ |
13,438 |
$ |
5,874 |
$ |
3,615 |
$ |
22,927 |
|||||||
Three Months Ended March 31, 2012 |
|||||||||||||||
Allowance for loan and lease losses, January 1 |
$ |
21,079 |
$ |
8,569 |
$ |
4,135 |
$ |
33,783 |
|||||||
Loans and leases charged off |
(2,007 |
) |
(2,242 |
) |
(531 |
) |
(4,780 |
) |
|||||||
Recoveries of loans and leases previously charged off |
136 |
426 |
162 |
724 |
|||||||||||
Net charge-offs |
(1,871 |
) |
(1,816 |
) |
(369 |
) |
(4,056 |
) |
|||||||
Provision for loan and lease losses |
1,765 |
879 |
(187 |
) |
2,457 |
||||||||||
Other (1)
|
— |
32 |
(5 |
) |
27 |
||||||||||
Allowance for loan and lease losses, March 31 |
20,973 |
7,664 |
3,574 |
32,211 |
|||||||||||
Reserve for unfunded lending commitments, January 1 |
— |
— |
714 |
714 |
|||||||||||
Provision for unfunded lending commitments |
— |
— |
(39 |
) |
(39 |
) |
|||||||||
Other (2)
|
— |
— |
(24 |
) |
(24 |
) |
|||||||||
Reserve for unfunded lending commitments, March 31 |
— |
— |
651 |
651 |
|||||||||||
Allowance for credit losses, March 31 |
$ |
20,973 |
$ |
7,664 |
$ |
4,225 |
$ |
32,862 |
|||||||
(1) |
Primarily represents the net impact of portfolio sales, consolidations and deconsolidations, and foreign currency translation adjustments. |
(2) |
Primarily represents accretion of the Merrill Lynch purchase accounting adjustment. |
During the three months ended March 31, 2013 and 2012, for the PCI loan portfolios, the Corporation recorded a provision benefit of $207 million and provision expense of $487 million with a corresponding change in the valuation allowance included as part of the allowance for loan and lease losses. Subsequent to the substantial fulfillment of the principal reduction commitments associated with the National Mortgage Settlement, the Corporation reviewed certain PCI loans that were ineligible for the program but had similar characteristics as the eligible PCI loans. Based on this review, the Corporation updated its estimates as to the likelihood of any proceeds being received from the ineligible PCI loans and wrote off the loans where the expectation of future cash proceeds is now considered remote. This primarily resulted in write-offs in the PCI loan portfolios of $839 million with a corresponding decrease in the PCI valuation allowance during the three months ended March 31, 2013. The valuation allowance associated with the PCI loan portfolios was $4.5 billion and $5.5 billion at March 31, 2013 and December 31, 2012.
173
The table below presents the allowance and the carrying value of outstanding loans and leases by portfolio segment at March 31, 2013 and December 31, 2012.
Allowance and Carrying Value by Portfolio Segment |
|||||||||||||||
March 31, 2013 |
|||||||||||||||
(Dollars in millions) |
Home Loans |
Credit Card and Other Consumer |
Commercial |
Total |
|||||||||||
Impaired loans and troubled debt restructurings (1)
|
|||||||||||||||
Allowance for loan and lease losses (2)
|
$ |
1,795 |
$ |
903 |
$ |
408 |
$ |
3,106 |
|||||||
Carrying value (3)
|
33,581 |
3,272 |
4,359 |
41,212 |
|||||||||||
Allowance as a percentage of carrying value |
5.35 |
% |
27.60 |
% |
9.36 |
% |
7.54 |
% |
|||||||
Loans collectively evaluated for impairment |
|||||||||||||||
Allowance for loan and lease losses |
$ |
7,153 |
$ |
4,971 |
$ |
2,721 |
$ |
14,845 |
|||||||
Carrying value (3, 4)
|
296,897 |
180,609 |
354,390 |
831,896 |
|||||||||||
Allowance as a percentage of carrying value (4)
|
2.41 |
% |
2.75 |
% |
0.77 |
% |
1.78 |
% |
|||||||
Purchased credit-impaired loans |
|||||||||||||||
Valuation allowance |
$ |
4,490 |
n/a |
n/a |
$ |
4,490 |
|||||||||
Carrying value gross of valuation allowance |
29,664 |
n/a |
n/a |
29,664 |
|||||||||||
Valuation allowance as a percentage of carrying value |
15.14 |
% |
n/a |
n/a |
15.14 |
% |
|||||||||
Total |
|||||||||||||||
Allowance for loan and lease losses |
$ |
13,438 |
$ |
5,874 |
$ |
3,129 |
$ |
22,441 |
|||||||
Carrying value (3, 4)
|
360,142 |
183,881 |
358,749 |
902,772 |
|||||||||||
Allowance as a percentage of carrying value (4)
|
3.73 |
% |
3.19 |
% |
0.87 |
% |
2.49 |
% |
|||||||
December 31, 2012 |
|||||||||||||||
Impaired loans and troubled debt restructurings (1)
|
|||||||||||||||
Allowance for loan and lease losses (2)
|
$ |
1,700 |
$ |
1,127 |
$ |
475 |
$ |
3,302 |
|||||||
Carrying value (3)
|
30,250 |
3,881 |
4,881 |
39,012 |
|||||||||||
Allowance as a percentage of carrying value |
5.62 |
% |
29.04 |
% |
9.74 |
% |
8.46 |
% |
|||||||
Loans collectively evaluated for impairment |
|||||||||||||||
Allowance for loan and lease losses |
$ |
7,697 |
$ |
5,013 |
$ |
2,631 |
$ |
15,341 |
|||||||
Carrying value (3, 4)
|
304,701 |
187,484 |
341,502 |
833,687 |
|||||||||||
Allowance as a percentage of carrying value (4)
|
2.53 |
% |
2.67 |
% |
0.77 |
% |
1.84 |
% |
|||||||
Purchased credit-impaired loans |
|||||||||||||||
Valuation allowance |
$ |
5,536 |
n/a |
n/a |
$ |
5,536 |
|||||||||
Carrying value gross of valuation allowance |
26,118 |
n/a |
n/a |
26,118 |
|||||||||||
Valuation allowance as a percentage of carrying value |
21.20 |
% |
n/a |
n/a |
21.20 |
% |
|||||||||
Total |
|||||||||||||||
Allowance for loan and lease losses |
$ |
14,933 |
$ |
6,140 |
$ |
3,106 |
$ |
24,179 |
|||||||
Carrying value (3, 4)
|
361,069 |
191,365 |
346,383 |
898,817 |
|||||||||||
Allowance as a percentage of carrying value (4)
|
4.14 |
% |
3.21 |
% |
0.90 |
% |
2.69 |
% |
|||||||
(1) |
Impaired loans include nonperforming commercial loans and all TDRs, including both commercial and consumer TDRs. Impaired loans exclude nonperforming consumer loans unless they are TDRs, and all consumer and commercial loans accounted for under the fair value option. |
(2) |
Commercial impaired allowance for loan and lease losses includes $80 million and $97 million of renegotiated TDR loans related to U.S. small business commercial at March 31, 2013 and December 31, 2012.
|
(3) |
Amounts are presented gross of the allowance for loan and lease losses. |
(4) |
Outstanding loan and lease balances and ratios do not include loans accounted for under the fair value option of $8.8 billion and $9.0 billion at March 31, 2013 and December 31, 2012.
|
n/a = not applicable
174
NOTE 7 – Securitizations and Other Variable Interest Entities |
The Corporation utilizes VIEs in the ordinary course of business to support its own and its customers' financing and investing needs. The Corporation routinely securitizes loans and debt securities using VIEs as a source of funding for the Corporation and as a means of transferring the economic risk of the loans or debt securities to third parties. The assets are transferred into a trust or other securitization vehicle such that the assets are legally isolated from the creditors of the Corporation and are not available to satisfy its obligations. These assets can only be used to settle obligations of the trust or other securitization vehicle. The Corporation also administers, structures or invests in other VIEs including CDOs, investment vehicles and other entities. For additional information on the Corporation's utilization of VIEs, see Note 1 – Summary of Significant Accounting Principles and Note 7 – Securitizations and Other Variable Interest Entities to the Consolidated Financial Statements of the Corporation's 2012 Annual Report on Form 10-K.
The tables within this Note present the assets and liabilities of consolidated and unconsolidated VIEs at March 31, 2013 and December 31, 2012, in situations where the Corporation has continuing involvement with transferred assets or if the Corporation otherwise has a variable interest in the VIE. The tables also present the Corporation's maximum loss exposure at March 31, 2013 and December 31, 2012 resulting from its involvement with consolidated VIEs and unconsolidated VIEs in which the Corporation holds a variable interest. The Corporation's maximum loss exposure is based on the unlikely event that all of the assets in the VIEs become worthless and incorporates not only potential losses associated with assets recorded on the Consolidated Balance Sheet but also potential losses associated with off-balance sheet commitments such as unfunded liquidity commitments and other contractual arrangements. The Corporation's maximum loss exposure does not include losses previously recognized through write-downs of assets.
The Corporation invests in asset-backed securities (ABS) issued by third-party VIEs with which it has no other form of involvement. These securities are included in Note 2 – Trading Account Assets and Liabilities and Note 4 – Securities. In addition, the Corporation uses VIEs such as trust preferred securities trusts in connection with its funding activities. For additional information, see Note 12 – Long-term Debt to the Consolidated Financial Statements of the Corporation's 2012 Annual Report on Form 10-K. The Corporation also uses VIEs in the form of synthetic securitization vehicles to mitigate a portion of the credit risk on its residential mortgage loan portfolio, as described in Note 5 – Outstanding Loans and Leases. The Corporation uses VIEs, such as cash funds managed within Global Wealth & Investment Management (GWIM), to provide investment opportunities for clients. These VIEs, which are not consolidated by the Corporation, are not included in the tables within this Note.
Except as described below and in Note 7 – Securitizations and Other Variable Interest Entities to the Consolidated Financial Statements of the Corporation's 2012 Annual Report on Form 10-K, the Corporation did not provide financial support to consolidated or unconsolidated VIEs during the three months ended March 31, 2013 or the year ended December 31, 2012 that it was not previously contractually required to provide, nor does it intend to do so.
Mortgage-related Securitizations |
First-lien Mortgages
As part of its mortgage banking activities, the Corporation securitizes a portion of the first-lien residential mortgage loans it originates or purchases from third parties, generally in the form of MBS guaranteed by government-sponsored enterprises, FNMA and FHLMC (collectively the GSEs), or GNMA in the case of FHA-insured and U.S. Department of Veterans Affairs (VA)-guaranteed mortgage loans. Securitization usually occurs in conjunction with or shortly after loan closing or purchase. In addition, the Corporation may, from time to time, securitize commercial mortgages it originates or purchases from other entities. The Corporation typically services the loans it securitizes. Further, the Corporation may retain beneficial interests in the securitization trusts including senior and subordinate securities and equity tranches issued by the trusts. Except as described below and in Note 8 – Representations and Warranties Obligations and Corporate Guarantees, the Corporation does not provide guarantees or recourse to the securitization trusts other than standard representations and warranties.
175
The table below summarizes select information related to first-lien mortgage securitizations for the three months ended March 31, 2013 and 2012.
First-lien Mortgage Securitizations |
|||||||||||||
Three Months Ended March 31 |
|||||||||||||
|
Residential
Mortgage - Agency
|
Commercial Mortgage |
||||||||||||
(Dollars in millions) |
2013 |
2012 |
2013 |
2012 |
|||||||||
Cash proceeds from new securitizations (1)
|
$ |
12,013 |
$ |
6,338 |
$ |
— |
$ |
325 |
|||||
Gain (loss) on securitizations (2)
|
29 |
(17 |
) |
— |
— |
||||||||
(1) |
The Corporation sells residential mortgage loans to GSEs in the normal course of business and receives MBS in exchange which may then be sold into the market to third-party investors for cash proceeds. |
(2) |
Substantially all of the first-lien residential mortgage loans securitized are initially classified as LHFS and accounted for under the fair value option. As such, gains are recognized on these LHFS prior to securitization. The Corporation recognized $613 million and $319 million of gains, net of hedges, on loans securitized during the three months ended March 31, 2013 and 2012.
|
The Corporation recognizes consumer MSRs from the sale or securitization of first-lien mortgage loans. Servicing fee and ancillary fee income on consumer mortgage loans serviced, including securitizations where the Corporation has continuing involvement, were $897 million and $1.3 billion during the three months ended March 31, 2013 and 2012. Servicing advances on consumer mortgage loans, including securitizations where the Corporation has continuing involvement, were $21.9 billion and $23.2 billion at March 31, 2013 and December 31, 2012. The Corporation may have the option to repurchase delinquent loans out of securitization trusts, which reduces the amount of servicing advances it is required to make. During the three months ended March 31, 2013 and 2012, $3.2 billion and $195 million of loans were repurchased from first-lien securitization trusts as a result of loan delinquencies or in order to perform modifications. The majority of these loans repurchased were FHA-insured mortgages collateralizing GNMA securities. In addition, the Corporation has retained commercial MSRs from the sale or securitization of commercial mortgage loans. Servicing advances on commercial mortgage loans, including securitizations where the Corporation has continuing involvement, were $171 million and $186 million at March 31, 2013 and December 31, 2012. For additional information on MSRs, see Note 19 – Mortgage Servicing Rights.
176
The table below summarizes select information related to first-lien mortgage securitization trusts in which the Corporation held a variable interest at March 31, 2013 and December 31, 2012.
First-lien Mortgage VIEs |
||||||||||||||||||||||||||||||||||
Residential Mortgage |
||||||||||||||||||||||||||||||||||
Non-agency |
||||||||||||||||||||||||||||||||||
Agency |
Prime |
Subprime |
Alt-A |
Commercial Mortgage |
||||||||||||||||||||||||||||||
(Dollars in millions) |
March 31 2013 |
December 31 2012 |
March 31 2013 |
December 31 2012 |
March 31 2013 |
December 31 2012 |
March 31 2013 |
December 31 2012 |
March 31 2013 |
December 31 2012 |
||||||||||||||||||||||||
Unconsolidated VIEs |
||||||||||||||||||||||||||||||||||
Maximum loss exposure (1)
|
$ |
26,834 |
$ |
28,591 |
$ |
1,926 |
$ |
2,038 |
$ |
434 |
$ |
410 |
$ |
366 |
$ |
367 |
$ |
682 |
$ |
702 |
||||||||||||||
On-balance sheet assets |
||||||||||||||||||||||||||||||||||
Senior securities held (2):
|
||||||||||||||||||||||||||||||||||
Trading account assets |
$ |
968 |
$ |
619 |
$ |
12 |
$ |
16 |
$ |
36 |
$ |
14 |
$ |
1 |
$ |
— |
$ |
5 |
$ |
12 |
||||||||||||||
Debt securities carried at fair value |
25,192 |
26,421 |
1,302 |
1,388 |
218 |
210 |
131 |
128 |
575 |
581 |
||||||||||||||||||||||||
Subordinate securities held (2):
|
||||||||||||||||||||||||||||||||||
Trading account assets |
— |
— |
— |
— |
9 |
3 |
— |
— |
16 |
13 |
||||||||||||||||||||||||
Debt securities carried at fair value |
— |
— |
21 |
21 |
8 |
9 |
— |
— |
— |
— |
||||||||||||||||||||||||
Residual interests held |
— |
— |
16 |
18 |
4 |
9 |
— |
— |
39 |
40 |
||||||||||||||||||||||||
All other assets (3)
|
674 |
1,551 |
59 |
64 |
1 |
1 |
234 |
239 |
— |
— |
||||||||||||||||||||||||
Total retained positions |
$ |
26,834 |
$ |
28,591 |
$ |
1,410 |
$ |
1,507 |
$ |
276 |
$ |
246 |
$ |
366 |
$ |
367 |
$ |
635 |
$ |
646 |
||||||||||||||
Principal balance outstanding (4)
|
$ |
667,970 |
$ |
797,315 |
$ |
42,945 |
$ |
45,819 |
$ |
50,898 |
$ |
53,822 |
$ |
67,679 |
$ |
71,990 |
$ |
60,302 |
$ |
56,733 |
||||||||||||||
Consolidated VIEs |
||||||||||||||||||||||||||||||||||
Maximum loss exposure (1)
|
$ |
45,453 |
$ |
46,959 |
$ |
107 |
$ |
104 |
$ |
391 |
$ |
390 |
$ |
— |
$ |
— |
$ |
1,369 |
$ |
— |
||||||||||||||
On-balance sheet assets |
||||||||||||||||||||||||||||||||||
Loans and leases |
$ |
44,539 |
$ |
45,991 |
$ |
282 |
$ |
283 |
$ |
759 |
$ |
722 |
$ |
— |
$ |
— |
$ |
— |
$ |
— |
||||||||||||||
Allowance for loan and lease losses |
(4 |
) |
(4 |
) |
— |
— |
— |
— |
— |
— |
— |
— |
||||||||||||||||||||||
Loans held-for-sale |
— |
— |
— |
— |
762 |
914 |
— |
— |
1,369 |
— |
||||||||||||||||||||||||
All other assets |
918 |
972 |
5 |
10 |
86 |
91 |
— |
— |
— |
— |
||||||||||||||||||||||||
Total assets |
$ |
45,453 |
$ |
46,959 |
$ |
287 |
$ |
293 |
$ |
1,607 |
$ |
1,727 |
$ |
— |
$ |
— |
$ |
1,369 |
$ |
— |
||||||||||||||
On-balance sheet liabilities |
||||||||||||||||||||||||||||||||||
Short-term borrowings |
$ |
— |
$ |
— |
$ |
— |
$ |
— |
$ |
767 |
$ |
741 |
$ |
— |
$ |
— |
$ |
— |
$ |
— |
||||||||||||||
Long-term debt |
— |
— |
203 |
212 |
793 |
941 |
— |
— |
— |
— |
||||||||||||||||||||||||
Total liabilities |
$ |
— |
$ |
— |
$ |
203 |
$ |
212 |
$ |
1,560 |
$ |
1,682 |
$ |
— |
$ |
— |
$ |
— |
$ |
— |
||||||||||||||
(1) |
Maximum loss exposure excludes the liability for representations and warranties obligations and corporate guarantees and also excludes servicing advances and MSRs. For more information, see Note 8 – Representations and Warranties Obligations and Corporate Guarantees and Note 19 – Mortgage Servicing Rights.
|
(2) |
As a holder of these securities, the Corporation receives scheduled principal and interest payments. During the three months ended March 31, 2013 and 2012, there were no OTTI losses recorded on those securities classified as AFS debt securities.
|
(3) |
Not included in the table above are all other assets of $8.2 billion and $12.1 billion, representing the unpaid principal balance of mortgage loans eligible for repurchase from unconsolidated residential mortgage securitization vehicles, principally guaranteed by GNMA, and all other liabilities of $8.2 billion and $12.1 billion, representing the principal amount that would be payable to the securitization vehicles if the Corporation were to exercise the repurchase option, at March 31, 2013 and December 31, 2012.
|
(4) |
Principal balance outstanding includes loans the Corporation transferred with which the Corporation has continuing involvement, which may include servicing the loans. |
177
Home Equity Loans
The Corporation retains interests in home equity securitization trusts to which it transferred home equity loans. These retained interests include senior and subordinate securities and residual interests. In addition, the Corporation may be obligated to provide subordinate funding to the trusts during a rapid amortization event. The Corporation also services the loans in the trusts. Except as described below and in Note 8 – Representations and Warranties Obligations and Corporate Guarantees, the Corporation does not provide guarantees or recourse to the securitization trusts other than standard representations and warranties. There were no securitizations of home equity loans during the three months ended March 31, 2013 and 2012, and all of the home equity trusts have entered the rapid amortization phase.
The table below summarizes select information related to home equity loan securitization trusts in which the Corporation held a variable interest at March 31, 2013 and December 31, 2012.
Home Equity Loan VIEs |
|||||||||||||||||||||||
March 31, 2013 |
December 31, 2012 |
||||||||||||||||||||||
(Dollars in millions) |
Consolidated VIEs |
Unconsolidated VIEs |
Total |
Consolidated VIEs |
Unconsolidated VIEs |
Total |
|||||||||||||||||
Maximum loss exposure (1)
|
$ |
1,449 |
$ |
7,004 |
$ |
8,453 |
$ |
2,004 |
$ |
6,707 |
$ |
8,711 |
|||||||||||
On-balance sheet assets |
|||||||||||||||||||||||
Trading account assets |
$ |
— |
$ |
8 |
$ |
8 |
$ |
— |
$ |
8 |
$ |
8 |
|||||||||||
Debt securities carried at fair value |
— |
15 |
15 |
— |
14 |
14 |
|||||||||||||||||
Loans and leases |
1,566 |
— |
1,566 |
2,197 |
— |
2,197 |
|||||||||||||||||
Allowance for loan and lease losses |
(117 |
) |
— |
(117 |
) |
(193 |
) |
— |
(193 |
) |
|||||||||||||
Total |
$ |
1,449 |
$ |
23 |
$ |
1,472 |
$ |
2,004 |
$ |
22 |
$ |
2,026 |
|||||||||||
On-balance sheet liabilities |
|||||||||||||||||||||||
Long-term debt |
$ |
1,649 |
$ |
— |
$ |
1,649 |
$ |
2,331 |
$ |
— |
$ |
2,331 |
|||||||||||
All other liabilities |
85 |
— |
85 |
92 |
— |
92 |
|||||||||||||||||
Total |
$ |
1,734 |
$ |
— |
$ |
1,734 |
$ |
2,423 |
$ |
— |
$ |
2,423 |
|||||||||||
Principal balance outstanding |
$ |
1,566 |
$ |
10,932 |
$ |
12,498 |
$ |
2,197 |
$ |
12,644 |
$ |
14,841 |
|||||||||||
(1) |
For unconsolidated VIEs, the maximum loss exposure includes outstanding trust certificates issued by trusts in rapid amortization, net of recorded reserves, and excludes the liability for representations and warranties obligations and corporate guarantees. |
Included in the table above are consolidated and unconsolidated home equity loan securitizations that have entered a rapid amortization period and for which the Corporation is obligated to provide subordinated funding. During this period, cash payments from borrowers are accumulated to repay outstanding debt securities and the Corporation continues to make advances to borrowers when they draw on their lines of credit. For additional information, see Note 7 – Securitizations and Other Variable Interest Entities to the Consolidated Financial Statements of the Corporation's 2012 Annual Report on Form 10-K. At March 31, 2013 and December 31, 2012, home equity loan securitizations in rapid amortization for which the Corporation has a subordinated funding obligation, including both consolidated and unconsolidated trusts, had $8.7 billion and $9.0 billion of trust certificates outstanding. This amount is significantly greater than the amount the Corporation expects to fund. The charges that will ultimately be recorded as a result of the rapid amortization events depend on the undrawn available credit on the home equity lines, which totaled $111 million and $196 million at March 31, 2013 and December 31, 2012, as well as performance of the loans, the amount of subsequent draws and the timing of related cash flows. At March 31, 2013 and December 31, 2012, the reserve for losses on expected future draw obligations on the home equity loan securitizations in rapid amortization for which the Corporation has a subordinated funding obligation was $48 million and $51 million.
The Corporation has consumer MSRs from the sale or securitization of home equity loans. The Corporation recorded $13 million and $17 million of servicing fee income related to home equity loan securitizations during the three months ended March 31, 2013 and 2012. The Corporation repurchased $39 million of loans from home equity securitization trusts in order to perform modifications during the three months ended March 31, 2013 compared to none for the same period in 2012.
During the three months ended March 31, 2013, the Corporation transferred servicing for consolidated home equity securitization trusts with total assets of $475 million and total liabilities of $616 million to a third party. As the Corporation no longer services the underlying loans, these trusts were deconsolidated, resulting in a gain of $141 million that was recorded in other loss.
178
Credit Card Securitizations |
The Corporation securitizes originated and purchased credit card loans. The Corporation's continuing involvement with the securitization trusts includes servicing the receivables, retaining an undivided interest (seller's interest) in the receivables, and holding certain retained interests including senior and subordinate securities, discount receivables, subordinate interests in accrued interest and fees on the securitized receivables, and cash reserve accounts. The seller's interest in the trusts, which is pari passu to the investors' interest, and the discount receivables are classified in loans and leases.
The table below summarizes select information related to consolidated credit card securitization trusts in which the Corporation held a variable interest at March 31, 2013 and December 31, 2012.
Credit Card VIEs |
|||||||
(Dollars in millions) |
March 31 2013 |
December 31 2012 |
|||||
Consolidated VIEs |
|||||||
Maximum loss exposure |
$ |
40,931 |
$ |
42,487 |
|||
On-balance sheet assets |
|||||||
Derivative assets |
$ |
187 |
$ |
323 |
|||
Loans and leases (1)
|
62,365 |
66,427 |
|||||
Allowance for loan and lease losses |
(3,183 |
) |
(3,445 |
) |
|||
All other assets (2)
|
1,872 |
1,567 |
|||||
Total |
$ |
61,241 |
$ |
64,872 |
|||
On-balance sheet liabilities |
|||||||
Derivative liabilities |
$ |
20 |
$ |
— |
|||
Long-term debt |
20,222 |
22,291 |
|||||
All other liabilities |
68 |
94 |
|||||
Total |
$ |
20,310 |
$ |
22,385 |
|||
(1) |
At March 31, 2013 and December 31, 2012, loans and leases included $31.8 billion and $33.5 billion of seller's interest and $73 million and $124 million of discount receivables.
|
(2) |
At March 31, 2013 and December 31, 2012, all other assets included restricted cash and short-term investment accounts and unbilled accrued interest and fees.
|
The Corporation holds subordinate securities with a notional principal amount of $9.8 billion and $10.1 billion at March 31, 2013 and December 31, 2012, and a stated interest rate of zero percent issued by certain credit card securitization trusts. In addition, during 2010 and 2009, the Corporation elected to designate a specified percentage of new receivables transferred to the trusts as "discount receivables" such that principal collections thereon are added to finance charges which increases the yield in the trust. Through the designation of newly transferred receivables as discount receivables, the Corporation subordinated a portion of its seller's interest to the investors' interest. These actions were taken to address the decline in the excess spread of the U.S. and U.K. credit card securitization trusts.
During 2012, the Corporation transferred $553 million of credit card receivables to a third-party sponsored securitization vehicle. The Corporation no longer services the credit card receivables and does not consolidate the vehicle. At March 31, 2013 and December 31, 2012, the Corporation held a senior interest of $294 million and $309 million in these receivables, classified in loans and leases, that is not included in the table above.
179
Other Asset-backed Securitizations |
Other asset-backed securitizations include resecuritization trusts, municipal bond trusts, and automobile and other securitization trusts. The table below summarizes select information related to other asset-backed securitizations in which the Corporation held a variable interest at March 31, 2013 and December 31, 2012.
Other Asset-backed VIEs |
|||||||||||||||||||||||
Resecuritization Trusts |
Municipal Bond Trusts |
Automobile and Other Securitization Trusts |
|||||||||||||||||||||
(Dollars in millions) |
March 31 2013 |
December 31 2012 |
March 31 2013 |
December 31 2012 |
March 31 2013 |
December 31 2012 |
|||||||||||||||||
Unconsolidated VIEs |
|||||||||||||||||||||||
Maximum loss exposure |
$ |
18,487 |
$ |
20,715 |
$ |
3,193 |
$ |
3,341 |
$ |
85 |
$ |
122 |
|||||||||||
On-balance sheet assets |
|||||||||||||||||||||||
Senior securities held (1, 2):
|
|||||||||||||||||||||||
Trading account assets |
$ |
1,197 |
$ |
1,281 |
$ |
178 |
$ |
12 |
$ |
3 |
$ |
37 |
|||||||||||
Debt securities carried at fair value |
17,210 |
19,343 |
541 |
540 |
71 |
74 |
|||||||||||||||||
Subordinate securities held (1, 2):
|
|||||||||||||||||||||||
Debt securities carried at fair value |
74 |
75 |
— |
— |
— |
— |
|||||||||||||||||
Residual interests held (3)
|
6 |
16 |
— |
— |
— |
— |
|||||||||||||||||
All other assets |
— |
— |
— |
— |
11 |
11 |
|||||||||||||||||
Total retained positions |
$ |
18,487 |
$ |
20,715 |
$ |
719 |
$ |
552 |
$ |
85 |
$ |
122 |
|||||||||||
Total assets of VIEs (4)
|
$ |
39,300 |
$ |
42,818 |
$ |
4,870 |
$ |
4,980 |
$ |
1,676 |
$ |
1,890 |
|||||||||||
Consolidated VIEs |
|||||||||||||||||||||||
Maximum loss exposure |
$ |
1,249 |
$ |
126 |
$ |
1,881 |
$ |
2,505 |
$ |
525 |
$ |
1,255 |
|||||||||||
On-balance sheet assets |
|||||||||||||||||||||||
Trading account assets |
$ |
2,278 |
$ |
220 |
$ |
1,881 |
$ |
2,505 |
$ |
— |
$ |
— |
|||||||||||
Loans and leases |
— |
— |
— |
— |
1,475 |
2,523 |
|||||||||||||||||
Allowance for loan and lease losses |
— |
— |
— |
— |
(1 |
) |
(2 |
) |
|||||||||||||||
All other assets |
— |
— |
— |
— |
149 |
250 |
|||||||||||||||||
Total assets |
$ |
2,278 |
$ |
220 |
$ |
1,881 |
$ |
2,505 |
$ |
1,623 |
$ |
2,771 |
|||||||||||
On-balance sheet liabilities |
|||||||||||||||||||||||
Short-term borrowings |
$ |
— |
$ |
— |
$ |
1,755 |
$ |
2,859 |
$ |
— |
$ |
— |
|||||||||||
Long-term debt |
1,029 |
94 |
— |
— |
1,096 |
1,513 |
|||||||||||||||||
All other liabilities |
— |
— |
— |
— |
83 |
82 |
|||||||||||||||||
Total liabilities |
$ |
1,029 |
$ |
94 |
$ |
1,755 |
$ |
2,859 |
$ |
1,179 |
$ |
1,595 |
|||||||||||
(1) |
As a holder of these securities, the Corporation receives scheduled principal and interest payments. During the three months ended March 31, 2013 and 2012, there were no OTTI losses recorded on those securities classified as AFS debt securities.
|
(2) |
The retained senior and subordinate securities were valued using quoted market prices or observable market inputs (Level 2 of the fair value hierarchy). |
(3) |
The retained residual interests are carried at fair value which was derived using model valuations (Level 2 of the fair value hierarchy). |
(4) |
Total assets include loans the Corporation transferred with which the Corporation has continuing involvement, which may include servicing the loan. |
180
Resecuritization Trusts
The Corporation transfers existing securities, typically MBS, into resecuritization vehicles at the request of customers seeking securities with specific characteristics. The Corporation may also resecuritize securities within its investment portfolio for purposes of improving liquidity and capital, and managing credit or interest rate risk. Generally, there are no significant ongoing activities performed in a resecuritization trust and no single investor has the unilateral ability to liquidate the trust.
The Corporation resecuritized $6.9 billion and $9.9 billion of securities during the three months ended March 31, 2013 and 2012. All of the securities transferred into resecuritization vehicles during the three months ended March 31, 2013 and 2012 were classified as trading account assets. As such, changes in fair value were recorded in trading account profits prior to the resecuritization and no gain or loss on sale was recorded.
Municipal Bond Trusts
The Corporation administers municipal bond trusts that hold highly-rated, long-term, fixed-rate municipal bonds. The trusts obtain financing by issuing floating-rate trust certificates that reprice on a weekly or other basis to third-party investors. The Corporation may transfer assets into the trusts and may also serve as remarketing agent and/or liquidity provider for the trusts. The floating-rate investors have the right to tender the certificates at specified dates. Should the Corporation be unable to remarket the tendered certificates, it may be obligated to purchase them at par under standby liquidity facilities. The Corporation also provides credit enhancement to investors in certain municipal bond trusts whereby the Corporation guarantees the payment of interest and principal on floating-rate certificates issued by these trusts in the event of default by the issuer of the underlying municipal bond.
The Corporation's liquidity commitments to unconsolidated municipal bond trusts, including those for which the Corporation was transferor, totaled $2.5 billion and $2.8 billion at March 31, 2013 and December 31, 2012. The weighted-average remaining life of bonds held in the trusts at March 31, 2013 was 8.7 years. There were no material write-downs or downgrades of assets or issuers during the three months ended March 31, 2013 and 2012.
Automobile and Other Securitization Trusts
The Corporation transfers automobile and other loans into securitization trusts, typically to improve liquidity or manage credit risk. At March 31, 2013 and December 31, 2012, the Corporation serviced assets or otherwise had continuing involvement with automobile and other securitization trusts with outstanding balances of $3.3 billion and $4.7 billion, including trusts collateralized by automobile loans of $2.2 billion and $3.5 billion, student loans of $848 million and $897 million, and other loans of $279 million and $290 million.
181
Collateralized Debt Obligation Vehicles |
CDO vehicles hold diversified pools of fixed-income securities, typically corporate debt or ABS, which they fund by issuing multiple tranches of debt and equity securities. Synthetic CDOs enter into a portfolio of CDS to synthetically create exposure to fixed-income securities. CLOs, which are a subset of CDOs, hold pools of loans, typically corporate loans or commercial mortgages. CDOs are typically managed by third-party portfolio managers. The Corporation transfers assets to these CDOs, holds securities issued by the CDOs and may be a derivative counterparty to the CDOs, including a CDS counterparty for synthetic CDOs. The Corporation has also entered into total return swaps with certain CDOs whereby the Corporation absorbs the economic returns generated by specified assets held by the CDO. The Corporation receives fees for structuring CDOs and providing liquidity support for super senior tranches of securities issued by certain CDOs. No third parties provide a significant amount of similar commitments to these CDOs.
The table below summarizes select information related to CDO vehicles in which the Corporation held a variable interest at March 31, 2013 and December 31, 2012.
CDO Vehicle VIEs |
|||||||||||||||||||||||
March 31, 2013 |
December 31, 2012 |
||||||||||||||||||||||
(Dollars in millions) |
Consolidated |
Unconsolidated |
Total |
Consolidated |
Unconsolidated |
Total |
|||||||||||||||||
Maximum loss exposure |
$ |
2,325 |
$ |
1,302 |
$ |
3,627 |
$ |
2,201 |
$ |
1,376 |
$ |
3,577 |
|||||||||||
On-balance sheet assets |
|||||||||||||||||||||||
Trading account assets |
$ |
2,325 |
$ |
307 |
$ |
2,632 |
$ |
2,191 |
$ |
258 |
$ |
2,449 |
|||||||||||
Derivative assets |
— |
233 |
233 |
10 |
301 |
311 |
|||||||||||||||||
All other assets |
— |
71 |
71 |
— |
76 |
76 |
|||||||||||||||||
Total |
$ |
2,325 |
$ |
611 |
$ |
2,936 |
$ |
2,201 |
$ |
635 |
$ |
2,836 |
|||||||||||
On-balance sheet liabilities |
|||||||||||||||||||||||
Derivative liabilities |
$ |
— |
$ |
6 |
$ |
6 |
$ |
— |
$ |
9 |
$ |
9 |
|||||||||||
Long-term debt |
2,861 |
2 |
2,863 |
2,806 |
2 |
2,808 |
|||||||||||||||||
Total |
$ |
2,861 |
$ |
8 |
$ |
2,869 |
$ |
2,806 |
$ |
11 |
$ |
2,817 |
|||||||||||
Total assets of VIEs |
$ |
2,325 |
$ |
26,108 |
$ |
28,433 |
$ |
2,201 |
$ |
26,985 |
$ |
29,186 |
|||||||||||
The Corporation's maximum loss exposure of $3.6 billion at March 31, 2013 included $2.3 billion of exposure to CDO financing facilities, $140 million of super senior CDO exposure and $1.2 billion of other non-super senior exposure. This exposure is calculated on a gross basis and does not reflect any benefit from insurance purchased from third parties. The CDO financing facilities, which are consolidated, obtain funding from third parties for CDO positions which are principally classified in trading account assets. The CDO financing facilities' long-term debt at March 31, 2013 totaled $2.9 billion, all of which has recourse to the general credit of the Corporation. For unconsolidated CDO vehicles in the table above, the Corporation's maximum loss exposure is significantly less than the total assets of the VIEs because the Corporation typically has exposure to only a portion of the total assets.
At March 31, 2013, the Corporation had $1.5 billion of aggregate liquidity exposure to CDOs. This amount includes $98 million of commitments to CDOs to provide funding for super senior exposures and $1.4 billion notional amount of derivative contracts with unconsolidated VIEs, principally CDO vehicles, which hold non-super senior CDO debt securities or other debt securities on the Corporation's behalf. See Note 11 – Commitments and Contingencies for additional information. The Corporation's liquidity exposure to CDOs at March 31, 2013 is included in the table above to the extent that the Corporation sponsored the CDO vehicle or the liquidity exposure is more than insignificant compared to total assets of the CDO vehicle. Liquidity exposure included in the table is reported net of previously recorded losses.
182
Customer Vehicles |
Customer vehicles include credit-linked and equity-linked note vehicles, repackaging vehicles and asset acquisition vehicles, which are typically created on behalf of customers who wish to obtain market or credit exposure to a specific company or financial instrument. The Corporation may transfer assets to and invest in securities issued by these vehicles. The Corporation typically enters into credit, equity, interest rate or foreign currency derivatives to synthetically create or alter the investment profile of the issued securities. The Corporation also had liquidity commitments, including written put options and collateral value guarantees, with certain unconsolidated vehicles of $729 million and $742 million at March 31, 2013 and December 31, 2012.
The table below summarizes select information related to customer vehicles in which the Corporation held a variable interest at March 31, 2013 and December 31, 2012.
Customer Vehicle VIEs |
|||||||||||||||||||||||
March 31, 2013 |
December 31, 2012 |
||||||||||||||||||||||
(Dollars in millions) |
Consolidated |
Unconsolidated |
Total |
Consolidated |
Unconsolidated |
Total |
|||||||||||||||||
Maximum loss exposure |
$ |
3,442 |
$ |
1,296 |
$ |
4,738 |
$ |
2,994 |
$ |
1,401 |
$ |
4,395 |
|||||||||||
On-balance sheet assets |
|||||||||||||||||||||||
Trading account assets |
$ |
2,520 |
$ |
61 |
$ |
2,581 |
$ |
2,882 |
$ |
98 |
$ |
2,980 |
|||||||||||
Derivative assets |
— |
423 |
423 |
— |
516 |
516 |
|||||||||||||||||
Loans and leases |
784 |
— |
784 |
523 |
— |
523 |
|||||||||||||||||
Loans held-for-sale |
1,003 |
— |
1,003 |
950 |
— |
950 |
|||||||||||||||||
All other assets |
710 |
— |
710 |
763 |
— |
763 |
|||||||||||||||||
Total |
$ |
5,017 |
$ |
484 |
$ |
5,501 |
$ |
5,118 |
$ |
614 |
$ |
5,732 |
|||||||||||
On-balance sheet liabilities |
|||||||||||||||||||||||
Derivative liabilities |
$ |
24 |
$ |
7 |
$ |
31 |
$ |
26 |
$ |
7 |
$ |
33 |
|||||||||||
Short-term borrowings |
17 |
— |
17 |
131 |
— |
131 |
|||||||||||||||||
Long-term debt |
2,729 |
— |
2,729 |
3,179 |
— |
3,179 |
|||||||||||||||||
All other liabilities |
2 |
383 |
385 |
3 |
382 |
385 |
|||||||||||||||||
Total |
$ |
2,772 |
$ |
390 |
$ |
3,162 |
$ |
3,339 |
$ |
389 |
$ |
3,728 |
|||||||||||
Total assets of VIEs |
$ |
5,017 |
$ |
4,034 |
$ |
9,051 |
$ |
5,118 |
$ |
4,055 |
$ |
9,173 |
|||||||||||
The Corporation's maximum loss exposure from customer vehicles includes the notional amount of credit or equity derivatives to which the Corporation is a counterparty, net of losses previously recorded, and the Corporation's investment, if any, in securities issued by the vehicles. It has not been reduced to reflect the benefit of offsetting swaps with the customers or collateral arrangements.
183
Other Variable Interest Entities |
Other consolidated VIEs primarily include investment vehicles and leveraged lease trusts. Other unconsolidated VIEs primarily include investment vehicles and real estate vehicles.
The table below summarizes select information related to other VIEs in which the Corporation held a variable interest at March 31, 2013 and December 31, 2012.
Other VIEs |
|||||||||||||||||||||||
March 31, 2013 |
December 31, 2012 |
||||||||||||||||||||||
(Dollars in millions) |
Consolidated |
Unconsolidated |
Total |
Consolidated |
Unconsolidated |
Total |
|||||||||||||||||
Maximum loss exposure |
$ |
5,508 |
$ |
6,629 |
$ |
12,137 |
$ |
5,608 |
$ |
6,492 |
$ |
12,100 |
|||||||||||
On-balance sheet assets |
|||||||||||||||||||||||
Trading account assets |
$ |
109 |
$ |
— |
$ |
109 |
$ |
108 |
$ |
— |
$ |
108 |
|||||||||||
Derivative assets |
— |
507 |
507 |
— |
460 |
460 |
|||||||||||||||||
Debt securities carried at fair value |
— |
36 |
36 |
— |
39 |
39 |
|||||||||||||||||
Loans and leases |
4,466 |
53 |
4,519 |
4,561 |
67 |
4,628 |
|||||||||||||||||
Allowance for loan and lease losses |
(5 |
) |
— |
(5 |
) |
(14 |
) |
— |
(14 |
) |
|||||||||||||
Loans held-for-sale |
95 |
73 |
168 |
105 |
157 |
262 |
|||||||||||||||||
All other assets |
988 |
5,959 |
6,947 |
1,001 |
5,768 |
6,769 |
|||||||||||||||||
Total |
$ |
5,653 |
$ |
6,628 |
$ |
12,281 |
$ |
5,761 |
$ |
6,491 |
$ |
12,252 |
|||||||||||
On-balance sheet liabilities |
|||||||||||||||||||||||
Derivative liabilities |
$ |
— |
$ |
— |
$ |
— |
$ |
— |
$ |
9 |
$ |
9 |
|||||||||||
Long-term debt |
879 |
— |
879 |
889 |
— |
889 |
|||||||||||||||||
All other liabilities |
63 |
1,930 |
1,993 |
63 |
1,683 |
1,746 |
|||||||||||||||||
Total |
$ |
942 |
$ |
1,930 |
$ |
2,872 |
$ |
952 |
$ |
1,692 |
$ |
2,644 |
|||||||||||
Total assets of VIEs |
$ |
5,653 |
$ |
8,599 |
$ |
14,252 |
$ |
5,761 |
$ |
8,660 |
$ |
14,421 |
|||||||||||
Investment Vehicles
The Corporation sponsors, invests in or provides financing to a variety of investment vehicles that hold loans, real estate, debt securities or other financial instruments and are designed to provide the desired investment profile to investors or the Corporation. At March 31, 2013 and December 31, 2012, the Corporation's consolidated investment vehicles had total assets of $1.2 billion and $1.3 billion. The Corporation also held investments in unconsolidated vehicles with total assets of $2.8 billion and $3.0 billion at March 31, 2013 and December 31, 2012. The Corporation's maximum loss exposure associated with both consolidated and unconsolidated investment vehicles totaled $2.0 billion and $2.1 billion at March 31, 2013 and December 31, 2012 comprised primarily of on-balance sheet assets less non-recourse liabilities.
Leveraged Lease Trusts
The Corporation's net investment in consolidated leveraged lease trusts totaled $4.3 billion and $4.4 billion at March 31, 2013 and December 31, 2012. The trusts hold long-lived equipment such as rail cars, power generation and distribution equipment, and commercial aircraft. The Corporation structures the trusts and holds a significant residual interest. The net investment represents the Corporation's maximum loss exposure to the trusts in the unlikely event that the leveraged lease investments become worthless. Debt issued by the leveraged lease trusts is non-recourse to the Corporation. The Corporation has no liquidity exposure to these leveraged lease trusts.
184
Real Estate Vehicles
The Corporation held investments in unconsolidated real estate vehicles of $5.6 billion and $5.4 billion at March 31, 2013 and December 31, 2012, which primarily consisted of investments in unconsolidated limited partnerships that finance the construction and rehabilitation of affordable rental housing and commercial real estate. An unrelated third party is typically the general partner and has control over the significant activities of the partnership. The Corporation earns a return primarily through the receipt of tax credits allocated to the real estate projects. The Corporation's risk of loss is mitigated by policies requiring that the project qualify for the expected tax credits prior to making its investment. The Corporation may from time to time be asked to invest additional amounts to support a troubled project. Such additional investments have not been and are not expected to be significant.
Other Asset-backed Financing Arrangements
The Corporation transferred pools of securities to certain independent third parties and provided financing for up to 75 percent of the purchase price under asset-backed financing arrangements. At March 31, 2013 and December 31, 2012, the Corporation's maximum loss exposure under these financing arrangements was $2.0 billion and $2.5 billion, substantially all of which were classified in loans and leases. All principal and interest payments have been received when due in accordance with their contractual terms. These arrangements are not included in the Other VIEs table because the purchasers are not VIEs.
NOTE 8 – Representations and Warranties Obligations and Corporate Guarantees |
Background |
The Corporation securitizes first-lien residential mortgage loans generally in the form of MBS guaranteed by the GSEs or by GNMA in the case of FHA-insured, VA-guaranteed and Rural Housing Service-guaranteed mortgage loans. In addition, in prior years, legacy companies and certain subsidiaries sold pools of first-lien residential mortgage loans and home equity loans as private-label securitizations (in certain of these securitizations, monolines or financial guarantee providers insured all or some of the securities) or in the form of whole loans. In connection with these transactions, the Corporation or certain of its subsidiaries or legacy companies make or have made various representations and warranties. These representations and warranties, as set forth in the agreements, related to, among other things, the ownership of the loan, the validity of the lien securing the loan, the absence of delinquent taxes or liens against the property securing the loan, the process used to select the loan for inclusion in a transaction, the loan's compliance with any applicable loan criteria, including underwriting standards, and the loan's compliance with applicable federal, state and local laws. Breaches of these representations and warranties may result in the requirement to repurchase mortgage loans or to otherwise make whole or provide other remedies to the GSEs, HUD with respect to FHA-insured loans, VA, whole-loan investors, securitization trusts, monoline insurers or other financial guarantors (collectively, repurchases). In all such cases, the Corporation would be exposed to any credit loss on the repurchased mortgage loans after accounting for any mortgage insurance (MI) or mortgage guarantee payments that it may receive.
Subject to the requirements and limitations of the applicable sales and securitization agreements, these representations and warranties can be enforced by the GSEs, HUD, VA, the whole-loan investor, the securitization trustee or others as governed by the applicable agreement or, in certain first-lien and home equity securitizations where monoline insurers or other financial guarantee providers have insured all or some of the securities issued, by the monoline insurer or other financial guarantor, where the contract so provides. In the case of private-label securitizations, the applicable agreements may permit investors, which may include the GSEs, with contractually sufficient holdings to direct or influence action by the securitization trustee. In the case of loans sold to parties other than the GSEs or GNMA, the contractual liability to repurchase typically arises only if there is a breach of the representations and warranties that materially and adversely affects the interest of the investor, or investors, or of the monoline insurer or other financial guarantor (as applicable), in the loan. Contracts with the GSEs do not contain equivalent language, while GNMA generally limits repurchases to loans that are not insured or guaranteed as required. The Corporation believes that the longer a loan performs prior to default, the less likely it is that an alleged underwriting breach of representations and warranties would have a material impact on the loan's performance.
The Corporation's credit loss would be reduced by any recourse it may have to organizations (e.g., correspondents) that, in turn, had sold such loans to the Corporation based upon its agreements with these organizations. When a loan is originated by a correspondent or other third party, the Corporation typically has the right to seek a recovery of related repurchase losses from that originator. Many of the correspondent originators of loans in 2004 through 2008 are no longer in business, or are in a weakened condition, and the Corporation's ability to recover on valid claims is therefore impacted, or eliminated accordingly. In the event a loan is originated and underwritten by a correspondent who obtains FHA insurance, even if they are no longer in business, any breach of FHA guidelines is the direct obligation of the correspondent, not the Corporation. Generally the volume of unresolved repurchase claims from the FHA and VA for loans in GNMA-guaranteed securities is not significant because the requests are limited in number and are typically resolved quickly. At March 31, 2013, approximately 17 percent of the outstanding repurchase claims relate to loans purchased from correspondents or other parties compared to approximately 26 percent at December 31, 2012. During the three months ended March 31, 2013, the Corporation continued
185
to recover repurchase losses from correspondents and other parties; however, the actual recovery rate may vary from period to period based upon the underlying mix of correspondents and other parties.
The estimate of the liability for representations and warranties exposures and the corresponding estimated range of possible loss is based upon currently available information, significant judgment, and a number of factors and assumptions, including those discussed in Liability for Representations and Warranties and Corporate Guarantees in this Note, that are subject to change. Changes to any one of these factors could significantly impact the estimate of the liability and could have a material adverse impact on the Corporation's results of operations for any particular period. Given that these factors vary by counterparty, the Corporation analyzes representations and warranties obligations based on the specific counterparty, or type of counterparty, with whom the sale was made. For additional information, see Note 8 – Representations and Warranties Obligations and Corporate Guarantees to the Consolidated Financial Statements of the Corporation's 2012 Annual Report on Form 10-K.
Settlement Actions |
The Corporation has vigorously contested any request for repurchase when it concludes that a valid basis for repurchase does not exist and will continue to do so in the future. However, in an effort to resolve these legacy mortgage-related issues, the Corporation has reached bulk settlements, or agreements for bulk settlements, including settlement amounts which have been material, with counterparties in lieu of a loan-by-loan review process. The Corporation may reach other settlements in the future if opportunities arise on terms it believes to be advantageous. However, there can be no assurance that the Corporation will reach future settlements or, if it does, that the terms of past settlements can be relied upon to predict the terms of future settlements. For a summary of the larger bulk settlement actions beginning in the fourth quarter of 2010, including the settlement with Bank of New York Mellon (the BNY Mellon Settlement), as trustee (Trustee) for 525 Countrywide first-lien and five second-lien non-GSE securitization trusts (the Covered Trusts), the settlement with Assured Guaranty Ltd. and subsidiaries in 2011 (the Assured Guaranty Settlement), the settlement with Syncora Guarantee Inc. and Syncora Holdings, Ltd. in 2012, the settlement with MBIA Inc. and subsidiaries (MBIA) in 2013 (MBIA Settlement), and the December 31, 2010 agreements with the GSEs to resolve repurchase claims (the GSE Agreements), see Note 8 – Representations and Warranties Obligations and Corporate Guarantees to the Consolidated Financial Statements of the Corporation's 2012 Annual Report on Form 10-K.
MBIA Settlement
On May 7, 2013, the Corporation entered into a comprehensive settlement with MBIA to resolve all outstanding litigation between the parties, as well as other claims between the parties, including outstanding and potential claims from MBIA related to alleged representations and warranties breaches and other claims involving certain first- and second-lien RMBS trusts for which MBIA provided financial guarantee insurance, certain of which claims are the subject of litigation. As of March 31, 2013, the mortgages (first- and second-lien) in RMBS trusts covered by the MBIA Settlement had an original principal balance of $54.8 billion and an unpaid principal balance of $19.2 billion.
Under the MBIA Settlement, all pending litigation between the parties will be dismissed and each party will receive a global release of those claims. The Corporation will make a settlement payment to MBIA of $1.565 billion in cash and transfer to MBIA approximately $95 million in fair market value of notes issued by MBIA and currently held by the Corporation. In addition, MBIA will issue to the Corporation warrants to purchase up to approximately 4.9 percent of MBIA's currently outstanding common stock, at an exercise price of $9.59 per share, which may be exercised at any time prior to May 2018. In addition, the Corporation will provide a senior secured $500 million credit facility to an affiliate of MBIA.
The parties will also terminate various CDS transactions entered into between the Corporation and a MBIA-affiliate, LaCrosse Financial Products, LLC, and guaranteed by MBIA, which constitute all of the outstanding CDS protection agreements purchased by the Corporation from MBIA on commercial mortgage-backed securities (CMBS). Collectively, those CDS transactions had a notional value of $7.4 billion and a fair value of $813 million as of March 31, 2013. The parties will also terminate certain other trades in order to close out positions between the parties; the termination of these trades will not have a material impact on the financial statements.
The cost associated with the MBIA Settlement and related matters is covered by pre-existing reserves and additional charges recorded as of March 31, 2013. Because the MBIA Settlement occurred after quarter end, but before the Corporation filed this Form 10-Q and the MBIA Settlement related to conditions that existed at March 31, 2013, it is considered to be a subsequent event under the applicable accounting guidance that requires the Corporation to record any incremental charges resulting from the MBIA Settlement and related matters in the first quarter of 2013. As a result, the Corporation recorded approximately $1.6 billion of pre-tax additional charges in the first quarter of 2013, of which approximately $1.3 billion is litigation expense. For additional information, see Monoline Insurers Experience within this Note and Note 11 – Commitments and Contingencies to the Consolidated Financial Statements.
186
Fannie Mae Settlement
On January 6, 2013, the Corporation entered into an agreement with FNMA to resolve substantially all outstanding and potential repurchase and certain other claims relating to the origination, sale and delivery of residential mortgage loans originated from January 1, 2000 through December 31, 2008 and sold directly to FNMA by entities related to Countrywide and BANA.
This agreement covers loans with an aggregate original principal balance of approximately $1.4 trillion and an aggregate outstanding principal balance of approximately $300 billion. Unresolved repurchase claims submitted by FNMA for alleged breaches of selling representations and warranties with respect to these loans totaled $12.2 billion of unpaid principal balance at December 31, 2012. This agreement extinguished substantially all of those unresolved repurchase claims, as well as any future representations and warranties repurchase claims associated with such loans, subject to certain exceptions which the Corporation does not expect to be material.
In January 2013, the Corporation made a cash payment to FNMA of $3.6 billion and also repurchased for $6.6 billion certain residential mortgage loans that had previously been sold to FNMA, which the Corporation has valued at less than the purchase price.
This agreement also clarified the parties' obligations with respect to MI including establishing timeframes for certain payments and other actions, setting parameters for potential bulk settlements and providing for cooperation in future dealings with mortgage insurers. For additional information, see Mortgage Insurance Rescission Notices in this Note.
In addition, pursuant to a separate agreement, the Corporation settled substantially all of FNMA's outstanding and future claims for compensatory fees arising out of past foreclosure delays.
Collectively, these agreements are referred to herein as the FNMA Settlement. The Corporation was fully reserved at December 31, 2012 for the settlement with FNMA.
Settlement with the Bank of New York Mellon, as Trustee
With regard to the BNY Mellon Settlement, the court approval hearing is scheduled to begin on May 30, 2013. Although the Corporation is not a party to the proceeding, certain of its rights and obligations under the settlement agreement are conditioned on final court approval of the settlement.
Unresolved Repurchase Claims |
Unresolved representations and warranties repurchase claims represent the notional amount of repurchase claims made by counterparties, typically the outstanding principal balance or the unpaid principal balance at the time of default. In the case of first-lien mortgages, the claim amount is often significantly greater than the expected loss amount due to the benefit of collateral and, in some cases, MI or mortgage guarantee payments. Claims received from a counterparty remain outstanding until the underlying loan is repurchased, the claim is rescinded by the counterparty, or the claim is otherwise resolved. When a claim is denied and the Corporation does not receive a response from the counterparty, the claim remains in the unresolved repurchase claims balance until resolution.
187
The table below presents unresolved repurchase claims at March 31, 2013 and December 31, 2012. The unresolved repurchase claims include only claims where the Corporation believes that the counterparty has a basis to submit claims. For additional information, see Whole Loan Sales and Private-label Securitizations Experience in this Note and Note 11 – Commitments and Contingencies herein. These repurchase claims do not include any repurchase claims related to the BNY Mellon Settlement regarding the Covered Trusts.
Unresolved Repurchase Claims by Counterparty and Product Type (1, 2)
|
|||||||
(Dollars in millions) |
March 31 2013 |
December 31 2012 |
|||||
By counterparty |
|||||||
GSEs |
$ |
1,138 |
$ |
13,530 |
|||
Monolines (3)
|
2,488 |
2,449 |
|||||
Whole-loan investors, private-label securitization trustees, third-party securitization sponsors and other |
13,509 |
12,299 |
|||||
Total unresolved repurchase claims by counterparty |
$ |
17,135 |
$ |
28,278 |
|||
By product type |
|||||||
Prime loans |
$ |
1,359 |
$ |
8,793 |
|||
Alt-A |
1,034 |
5,428 |
|||||
Home equity |
2,467 |
2,394 |
|||||
Pay option |
5,594 |
5,884 |
|||||
Subprime |
4,533 |
3,687 |
|||||
Other |
2,148 |
2,092 |
|||||
Total unresolved repurchase claims by product type |
$ |
17,135 |
$ |
28,278 |
|||
(1) |
Excludes certain MI rescission notices. However, at March 31, 2013 and December 31, 2012, included $427 million and $2.3 billion of repurchase requests received from the GSEs that have resulted solely from MI rescission notices. For additional information, see Mortgage Insurance Rescission Notices in this Note.
|
(2) |
At both March 31, 2013 and December 31, 2012, unresolved repurchase claims did not include repurchase demands of $1.6 billion where the Corporation believes the claimants have not satisfied the contractual thresholds as noted on page 189.
|
(3) |
As a result of the MBIA Settlement, $945 million of monoline repurchase claims outstanding at March 31, 2013 were resolved in May 2013.
|
The notional amount of unresolved GSE repurchase claims totaled $1.1 billion at March 31, 2013 compared to $13.5 billion at December 31, 2012. As a result of the FNMA Settlement, $12.2 billion of GSE repurchase claims outstanding at December 31, 2012 were resolved in January 2013. For further discussion of the Corporation's experience with the GSEs, see Government-sponsored Enterprises Experience in this Note.
The notional amount of unresolved monoline repurchase claims totaled $2.5 billion at March 31, 2013 compared to $2.4 billion at December 31, 2012. The Corporation has had limited loan-level repurchase claims experience with the majority of the monoline insurers due to ongoing litigation. In the Corporation's experience, the monolines have been generally unwilling to withdraw repurchase claims, regardless of whether and what evidence was offered to refute a claim. Substantially all of the unresolved monoline claims pertain to second-lien loans and are currently the subject of litigation. As a result of the MBIA Settlement, $945 million of monoline repurchase claims outstanding at March 31, 2013 were resolved in May 2013. For further discussion of the Corporation's practices regarding litigation accruals and estimated range of possible loss for litigation and regulatory matters, which includes the status of its monoline litigation, see Estimated Range of Possible Loss in this Note.
The notional amount of unresolved repurchase claims from private-label securitization trustees, third-party securitization sponsors, whole-loan investors and others increased to $13.5 billion at March 31, 2013 compared to $12.3 billion at December 31, 2012. The increase in the notional amount of unresolved repurchase claims is primarily due to continued submission of claims by private-label securitization trustees and a third-party securitization sponsor; the level of detail, support and analysis which impacts overall claim quality and, therefore, claims resolution; and the lack of an established process to resolve disputes related to these claims. The Corporation expects unresolved repurchase claims related to private-label securitizations to continue to increase as claims continue to be submitted by private-label securitization trustees and third-party securitization sponsors and there is not an established process for the ultimate resolution of claims on which there is a disagreement. For further discussion of the Corporation's experience with whole loans and private-label securitizations, see Whole Loan Sales and Private-label Securitizations Experience in this Note.
188
During the three months ended March 31, 2013, the Corporation received $1.8 billion in new repurchase claims, including $398 million submitted by the GSEs for both Countrywide and legacy Bank of America originations not covered by the bulk settlements with the GSEs, $1.3 billion submitted by private-label securitization trustees, $134 million submitted by whole-loan investors, primarily third-party securitization sponsors, and $42 million submitted by monoline insurers. During the three months ended March 31, 2013, $13.0 billion in claims were resolved, primarily with the GSEs, including $12.2 billion in GSE claims resolved through the FNMA Settlement. Of the remaining claims that were resolved, $409 million were resolved through rescissions and $311 million were resolved through mortgage repurchases and make-whole payments.
In addition to, and not included in, the total unresolved repurchase claims of $17.1 billion at March 31, 2013, the Corporation has received repurchase demands from private-label securitization investors and a master servicer where it believes the claimants have not satisfied the contractual thresholds to direct the securitization trustee to take action and/or that these demands are otherwise procedurally or substantively invalid. The total amounts outstanding of such demands were $1.6 billion at both March 31, 2013 and December 31, 2012, comprised of $1.3 billion in claims received during 2012 and approximately $300 million related to trusts covered by the BNY Mellon Settlement. The Corporation does not believe that the $1.6 billion in demands outstanding at March 31, 2013 represents valid repurchase claims and, therefore, it is not possible to predict the resolution with respect to such demands.
Mortgage Insurance Rescission Notices
In addition to repurchase claims, the Corporation receives notices from mortgage insurance companies of claim denials, cancellations or coverage rescission (collectively, MI rescission notices) and the number of such notices has remained elevated. At March 31, 2013, the Corporation had approximately 109,000 open MI rescission notices compared to 110,000 at December 31, 2012, including 48,000 pertaining principally to first-lien mortgages serviced for others, 11,000 pertaining to loans held-for-investment and 50,000 pertaining to ongoing litigation for second-lien mortgages. Approximately 26,000 of the open MI rescission notices pertaining to first-lien mortgages serviced for others are related to loans sold to FNMA. As of March 31, 2013, 35 percent of the MI rescission notices received have been resolved.
Although the FNMA Settlement did not resolve underlying MI rescission notices, the FNMA Settlement resolved significant representations and warranties exposures, including unresolved and potential repurchase claims from FNMA resulting solely from MI rescission notices relating to loans covered by the FNMA Settlement. The Corporation's pipeline of unresolved repurchase claims from the GSEs resulting solely from MI rescission notices decreased to $427 million at March 31, 2013 from $2.3 billion at December 31, 2012 as the FNMA Settlement resolved approximately $1.9 billion of such unresolved repurchase claims. Many of these claims represent repurchase claims on loans for which the Corporation received an MI rescission notice that is included in the 26,000 open MI rescission notices referenced in the paragraph above. In addition, the FNMA Settlement clarified the parties' obligations with respect to MI rescission notices including establishing timeframes for certain payments and other actions, setting parameters for potential bulk settlements and providing for cooperation in future dealings with mortgage insurers. As a result, the Corporation is required to pay the amount of certain MI coverage to FNMA as a result of MI claims rescissions in advance of collection from the mortgage insurance companies and has remitted the amounts required under the agreement related to the 26,000 open MI rescissions notices. In certain cases, it may not ultimately collect all such amounts from the mortgage insurance companies.
For additional information, see Note 8 – Representations and Warranties Obligations and Corporate Guarantees to the Consolidated Financial Statements of the Corporation's 2012 Annual Report on Form 10-K.
189
Cash Settlements
The table below presents first-lien and home equity loan repurchases and indemnification payments for the three months ended March 31, 2013 and 2012. During the three months ended March 31, 2013 and 2012, the Corporation paid $508 million and $423 million to resolve $564 million and $532 million of repurchase claims through repurchase or reimbursement to the investor or securitization trust for losses they incurred, resulting in a loss on the related loans at the time of repurchase or reimbursement of $127 million and $264 million. The amounts shown in the table below exclude $62 million and $75 million in payments to settle monoline claims for the three months ended March 31, 2013 and 2012. Additionally, the amounts in the table below exclude a cash payment of $3.6 billion made in January 2013 to FNMA and the repurchase for $6.6 billion of certain residential mortgage loans which the Corporation valued at less than the purchase price, both of which were part of the FNMA Settlement.
For additional information, see Note 8 – Representations and Warranties Obligations and Corporate Guarantees to the Consolidated Financial Statements of the Corporation's 2012 Annual Report on Form 10-K.
Loan Repurchases and Indemnification Payments | |||||||||||||||||||||||
Three Months Ended March 31 |
|||||||||||||||||||||||
2013 |
2012 |
||||||||||||||||||||||
(Dollars in millions) |
Unpaid
Principal
Balance
|
Cash Paid
for
Repurchases
|
Loss |
Unpaid
Principal
Balance
|
Cash Paid
for
Repurchases
|
Loss |
|||||||||||||||||
First-lien |
|||||||||||||||||||||||
Repurchases |
$ |
421 |
$ |
437 |
$ |
56 |
$ |
250 |
$ |
284 |
$ |
129 |
|||||||||||
Indemnification payments |
135 |
62 |
62 |
267 |
124 |
124 |
|||||||||||||||||
Total first-lien |
556 |
499 |
118 |
517 |
408 |
253 |
|||||||||||||||||
Home equity |
|||||||||||||||||||||||
Repurchases |
— |
— |
— |
4 |
4 |
— |
|||||||||||||||||
Indemnification payments |
8 |
9 |
9 |
11 |
11 |
11 |
|||||||||||||||||
Total home equity |
8 |
9 |
9 |
15 |
15 |
11 |
|||||||||||||||||
Total first-lien and home equity |
$ |
564 |
$ |
508 |
$ |
127 |
$ |
532 |
$ |
423 |
$ |
264 |
|||||||||||
Liability for Representations and Warranties and Corporate Guarantees |
The liability for representations and warranties and corporate guarantees is included in accrued expenses and other liabilities on the Consolidated Balance Sheet and the related provision is included in mortgage banking income in the Consolidated Statement of Income. The liability for representations and warranties is established when those obligations are both probable and reasonably estimable.
The Corporation's estimated liability at March 31, 2013 for obligations under representations and warranties given to the GSEs and the corresponding estimated range of possible loss considers, and is necessarily dependent on, and limited by, a number of factors, including the Corporation's experience related to actual defaults, projected future defaults, historical loss experience, estimated home prices and other economic conditions. The methodology also considers such factors as the number of payments made by the borrower prior to default as well as certain other assumptions and judgmental factors. See Estimated Range of Possible Loss below for a discussion of the representations and warranties liability and the corresponding estimated range of possible loss.
The Corporation's estimate of the non-GSE representations and warranties liability and the corresponding estimated range of possible loss considers, among other things, repurchase experience based on the BNY Mellon Settlement, adjusted to reflect differences between the Covered Trusts and the remainder of the population of private-label securitizations, and assumes that the conditions to the BNY Mellon Settlement will be met. Since the non-GSE securitization trusts that were included in the BNY Mellon Settlement differ from those that were not included in the BNY Mellon Settlement, the Corporation adjusted the repurchase experience implied in the settlement in order to determine the estimated non-GSE representations and warranties liability and the corresponding estimated range of possible loss. The judgmental adjustments made include consideration of the differences in the mix of products in the subject securitizations, loan originator, likelihood of claims expected, the differences in the number of payments that the borrower has made prior to default and the sponsor of the securitizations. Where relevant, the Corporation also takes into account more recent experience, such as increased claims and other facts and circumstances, such as bulk settlements, as the Corporation believes appropriate.
190
Additional factors that impact the non-GSE representations and warranties liability and the portion of the estimated range of possible loss corresponding to non-GSE representations and warranties exposures include: (1) contractual material adverse effect requirements; (2) the representations and warranties provided; and (3) the requirement to meet certain presentation thresholds. For more information on these factors, see Note 8 – Representations and Warranties Obligations and Corporate Guarantees to the Consolidated Financial Statements of the Corporation's 2012 Annual Report on Form 10-K.
The table below presents a rollforward of the liability for representations and warranties and corporate guarantees.
Representations and Warranties and Corporate Guarantees |
|||||||
Three Months Ended March 31 |
|||||||
(Dollars in millions) |
2013 |
2012 |
|||||
Liability for representations and warranties and corporate guarantees, January 1 |
$ |
19,021 |
$ |
15,858 |
|||
Additions for new sales |
10 |
5 |
|||||
Net reductions |
(5,205 |
) |
(399 |
) |
|||
Provision |
250 |
282 |
|||||
Liability for representations and warranties and corporate guarantees, March 31 |
$ |
14,076 |
$ |
15,746 |
|||
Estimated Range of Possible Loss |
The representations and warranties liability represents the Corporation's best estimate of probable incurred losses as of March 31, 2013. However, it is reasonably possible that future representations and warranties losses may occur in excess of the amounts recorded for these exposures. In addition, the Corporation has not recorded any representations and warranties liability for certain potential private-label securitization and whole-loan exposures where it has little to no claim activity. The Corporation currently estimates that the range of possible loss for representations and warranties exposures could be up to $4 billion over accruals at both March 31, 2013 and December 31, 2012. The estimated range of possible loss reflects the impact of the FNMA Settlement and, as a result, addresses principally non-GSE exposures. The estimated range of possible loss related to these representations and warranties exposures does not represent a probable loss, and is based on currently available information, significant judgment and a number of assumptions that are subject to change. The Corporation's estimated range of possible loss related to representations and warranties exposures does not include possible losses related to monoline insurers.
Future provisions and/or ranges of possible loss for representations and warranties may be significantly impacted if actual experiences are different from the Corporation's assumptions in its predictive models, including, without limitation, ultimate resolution of the BNY Mellon Settlement, estimated repurchase rates, estimated MI rescission rates, economic conditions, estimated home prices, consumer and counterparty behavior, and a variety of other judgmental factors. Adverse developments with respect to one or more of the assumptions underlying the liability for representations and warranties and the corresponding estimated range of possible loss could result in significant increases to future provisions and/or the estimated range of possible loss. For example, an appellate court, in the context of claims brought by a monoline insurer, recently disagreed with the Corporation's interpretation that a loan must be in default in order to satisfy the underlying agreements' requirement that a breach have a material and adverse effect. If that decision is extended to non-monoline contexts, it could significantly impact the Corporation's provision and/or the estimated range of possible loss. Additionally, if court rulings related to monoline litigation, including one related to the Corporation, that have allowed sampling of loan files instead of requiring a loan-by-loan review to determine if a representations and warranties breach has occurred, are followed generally by the courts in future monoline litigation, private-label securitization counterparties may view litigation as a more attractive alternative compared to a loan-by-loan review. Finally, although the Corporation believes that the representations and warranties typically given in non-GSE transactions are less rigorous and actionable than those given in GSE transactions, the Corporation does not have significant experience resolving loan-level claims in non-GSE transactions to measure the impact of these differences on the probability that a loan will be required to be repurchased. For additional information, see Note 13 – Commitments and Contingencies to the Consolidated Financial Statements of the Corporation's 2012 Annual Report on Form 10-K.
The liability for obligations and representations and warranties exposures and the corresponding estimated range of possible loss do not consider any losses related to litigation matters, including litigation brought by monoline insurers, nor do they include any separate foreclosure costs and related costs, assessments and compensatory fees or any other possible losses related to potential claims for breaches of performance of servicing obligations (except as such losses are included as potential costs of the BNY Mellon Settlement), potential securities law or fraud claims or potential indemnity or other claims against the Corporation, including claims related to loans insured by the FHA. The Corporation is not able to reasonably estimate the amount of any possible loss with respect to any such servicing, securities law, fraud or other claims against the Corporation, except to the extent reflected in the aggregate estimated range of possible loss for litigation and regulatory matters disclosed in Note 11 – Commitments and Contingencies; however, such loss could be material.
191
Government-sponsored Enterprises Experience |
The Corporation and its subsidiaries have an established history of working with the GSEs on repurchase claims. Generally, the Corporation first becomes aware that a GSE is evaluating a particular loan for repurchase when the Corporation receives a request from a GSE to review the underlying loan file (file request). Upon completing its review, the GSE may submit a repurchase claim to the Corporation. As soon as practicable after receiving a repurchase claim from a GSE, the Corporation evaluates the claim and takes appropriate action. Claim disputes are generally handled through loan-level negotiations with the GSEs and the Corporation seeks to resolve the repurchase claim within 90 to 120 days of the receipt of the claim although claims remain open beyond this timeframe. Disputes include reasonableness of stated income, occupancy, undisclosed liabilities, and the validity of MI claim rescissions in the vintages with the highest default rates.
At March 31, 2013, for loans originated prior to 2009, the notional amount of unresolved repurchase claims submitted by the GSEs was $861 million. The Corporation has performed an initial review with respect to $690 million of these claims and does not believe a valid basis for repurchase has been established by the claimant and is still in the process of reviewing the remaining $171 million of these claims.
At March 31, 2013, for loans originated after 2008, the notional amount of unresolved repurchase claims submitted by the GSEs was $277 million. The Corporation has performed an initial review with respect to $244 million of these claims and does not believe a valid basis for repurchase has been established by the claimant and is still in the process of reviewing the remaining $33 million of these claims.
Monoline Insurers Experience |
The Corporation has had limited representations and warranties repurchase claims experience with the monoline insurers due to ongoing litigation against Countrywide and/or Bank of America. During the three months ended March 31, 2013, there was minimal repurchase claim activity with the monolines.
The MBIA Settlement resolved outstanding and potential claims between the parties to the settlement involving 31 first- and 17 second-lien RMBS trusts for which MBIA provided financial guarantee insurance, including $945 million of monoline repurchase claims outstanding at March 31, 2013. In addition, this settlement covered loans with an unpaid principal balance of $2.6 billion for which the Corporation has received file requests but for which no repurchase claim was received as of March 31, 2013. The first- and second-lien mortgages in the covered RMBS trusts had an original principal balance of $29.3 billion and $25.5 billion, and an unpaid principal balance of $9.8 billion and $9.4 billion as of March 31, 2013.
For additional information related to the monolines, see Note 11 – Commitments and Contingencies herein and Note 8 – Representations and Warranties Obligations and Corporate Guarantees to the Consolidated Financial Statements of the Corporation's 2012 Annual Report on Form 10-K.
192
Whole Loan Sales and Private-label Securitizations Experience |
The majority of the repurchase claims that the Corporation has received and resolved outside of those from the GSEs and monolines are from third-party whole-loan investors. The Corporation provided representations and warranties and the whole-loan investors may retain those rights even when the loans were aggregated with other collateral into private-label securitizations sponsored by the whole-loan investors. The Corporation reviews properly presented repurchase claims for these whole loans on a loan-by-loan basis. If, after the Corporation's review, it does not believe a claim is valid, it will deny the claim and generally indicate a reason for the denial. When the whole-loan investor agrees with the Corporation's denial of the claim, the whole-loan investor may rescind the claim. When there is disagreement as to the resolution of the claim, meaningful dialogue and negotiation between the parties are generally necessary to reach a resolution on an individual claim. Generally, a whole-loan investor is engaged in the repurchase process and the Corporation and the whole-loan investor reach resolution, either through loan-by-loan negotiation or at times, through a bulk settlement. As of March 31, 2013, 15 percent of the whole-loan claims that the Corporation initially denied have subsequently been resolved through repurchase or make-whole payments and 42 percent have been resolved through rescission or repayment in full by the borrower. Although the timeline for resolution varies, once an actionable breach is identified on a given loan, settlement is generally reached as to that loan within 60 to 90 days. When a claim has been denied and the Corporation does not have communication with the counterparty for six months, the Corporation views these claims as inactive; however, they remain in the outstanding claims balance until resolution.
In private-label securitizations, certain presentation thresholds need to be met in order for investors to direct a trustee to assert repurchase claims. Continued high levels of new private-label claims are primarily related to repurchase requests received from trustees and third-party sponsors for private-label securitization transactions not included in the BNY Mellon Settlement, including claims related to first-lien third-party sponsored securitizations that include monoline insurance. Over time, there has been an increase in requests for loan files from certain private-label securitization trustees, as well as requests for tolling agreements to toll the applicable statutes of limitation relating to representations and warranties repurchase claims, and the Corporation believes it is likely that these requests will lead to an increase in repurchase claims from private-label securitization trustees with standing to bring such claims. In addition, private-label securitization trustees may have obtained loan files through other means, including litigation and administrative subpoenas. The representations and warranties, as governed by the private-label securitization agreements, generally require that counterparties have the ability to both assert a claim and actually prove that a loan has an actionable defect under the applicable contracts. While the Corporation believes the agreements for private-label securitizations generally contain less rigorous representations and warranties and place higher burdens on claimants seeking repurchases than the express provisions of comparable agreements with the GSEs, without regard to any variations that may have arisen as a result of dealings with the GSEs, the agreements generally include a representation that underwriting practices were prudent and customary. In the case of private-label securitization trustees and third-party sponsors, there is currently no established process in place for the parties to reach a conclusion on an individual loan if there is a disagreement on the resolution of the claim. For additional information on repurchase demands, see Unresolved Repurchase Claims on page 187.
At March 31, 2013, for loans originated between 2004 and 2008, the notional amount of unresolved repurchase claims submitted by private-label securitization trustees and whole-loan investors was $13.3 billion. The Corporation has performed an initial review with respect to $12.4 billion of these claims and does not believe a valid basis for repurchase has been established by the claimant and is still in the process of reviewing the remaining $908 million of these claims.
193
NOTE 9 – Goodwill and Intangible Assets |
Goodwill |
The table below presents goodwill balances by business segment at March 31, 2013 and December 31, 2012. The reporting units utilized for goodwill impairment tests are the operating segments or one level below. For more information, see Note 9 – Goodwill and Intangible Assets to the Consolidated Financial Statements of the Corporation's 2012 Annual Report on Form 10-K.
Goodwill | |||||||
(Dollars in millions) |
March 31 2013 |
December 31 2012 |
|||||
Consumer & Business Banking |
$ |
29,986 |
$ |
29,986 |
|||
Global Banking |
24,335 |
24,335 |
|||||
Global Markets |
4,918 |
4,918 |
|||||
Global Wealth & Investment Management |
9,698 |
9,698 |
|||||
All Other |
993 |
1,039 |
|||||
Total goodwill |
$ |
69,930 |
$ |
69,976 |
|||
Effective January 1, 2013, on a prospective basis, the Corporation adjusted the amount of capital being allocated to the business segments. The adjustment reflects a refinement to the prior-year methodology (economic capital) which focused solely on internal risk-based economic capital models. The refined methodology (allocated capital) now also considers the effect of regulatory capital requirements in addition to internal risk-based economic capital models. For purposes of goodwill impairment testing, the Corporation utilizes allocated equity as a proxy for the carrying value of its reporting units. Allocated equity in the reporting units is comprised of allocated capital plus capital for the portion of goodwill and intangibles specifically assigned to the reporting unit. For additional information regarding annual goodwill impairment testing, see Note 9 – Goodwill and Intangible Assets to the Consolidated Financial Statements of the Corporation's 2012 Annual Report on Form 10-K.
There was no goodwill in Consumer Real Estate Services (CRES) at March 31, 2013 and December 31, 2012.
In 2012, the International Wealth Management businesses within GWIM, including $230 million of goodwill, were moved to All Other in connection with the Corporation's agreement in 2012 to sell these businesses in a series of transactions. Certain of the sales transactions were completed during the three months ended March 31, 2013 and the remainder of the sales transactions are expected to close over the next 12 to 18 months.
Intangible Assets |
The table below presents the gross carrying amount and accumulated amortization for intangible assets at March 31, 2013 and December 31, 2012.
Intangible Assets (1)
| |||||||||||||||
March 31, 2013 |
December 31, 2012 |
||||||||||||||
(Dollars in millions) |
Gross
Carrying Value
|
Accumulated
Amortization
|
Gross
Carrying Value
|
Accumulated
Amortization
|
|||||||||||
Purchased credit card relationships |
$ |
6,117 |
$ |
4,539 |
$ |
6,184 |
$ |
4,494 |
|||||||
Core deposit intangibles |
3,592 |
2,909 |
3,592 |
2,858 |
|||||||||||
Customer relationships |
4,012 |
1,976 |
4,025 |
1,884 |
|||||||||||
Affinity relationships |
1,561 |
1,106 |
1,572 |
1,087 |
|||||||||||
Other intangibles |
2,046 |
419 |
2,139 |
505 |
|||||||||||
Total intangible assets |
$ |
17,328 |
$ |
10,949 |
$ |
17,512 |
$ |
10,828 |
|||||||
(1) |
Excludes fully amortized intangible assets. |
194
At March 31, 2013 and December 31, 2012, none of the intangible assets were impaired. Amortization of intangibles expense was $276 million and $319 million for the three months ended March 31, 2013 and 2012. The Corporation estimates aggregate amortization expense will be approximately $270 million for each of the remaining quarters of 2013, and $940 million, $840 million, $740 million, $650 million and $570 million for 2014 through 2018, respectively.
NOTE 10 – Federal Funds Sold or Purchased, Securities Financing Agreements and Short-term Borrowings |
The table below presents federal funds sold or purchased, securities financing agreements which include securities borrowed or purchased under agreements to resell and securities loaned or sold under agreements to repurchase, and short-term borrowings.
Three Months Ended March 31 |
||||||||||||||
Amount |
Rate |
|||||||||||||
(Dollars in millions) |
2013 |
2012 |
2013 |
2012 |
||||||||||
Average during period |
||||||||||||||
Federal funds sold |
$ |
2 |
$ |
107 |
0.60 |
% |
0.73 |
% |
||||||
Securities borrowed or purchased under agreements to resell |
237,461 |
232,954 |
0.54 |
0.79 |
||||||||||
Total |
$ |
237,463 |
$ |
233,061 |
0.54 |
0.79 |
||||||||
Federal funds purchased |
$ |
192 |
$ |
261 |
0.05 |
% |
0.05 |
% |
||||||
Securities loaned or sold under agreements to repurchase |
300,746 |
256,144 |
0.72 |
1.10 |
||||||||||
Short-term borrowings |
36,706 |
36,651 |
2.36 |
1.99 |
||||||||||
Total |
$ |
337,644 |
$ |
293,056 |
0.90 |
1.21 |
||||||||
Maximum month-end balance during period |
||||||||||||||
Federal funds sold |
$ |
— |
$ |
102 |
||||||||||
Securities borrowed or purchased under agreements to resell |
249,791 |
248,267 |
||||||||||||
Federal funds purchased |
176 |
331 |
||||||||||||
Securities loaned or sold under agreements to repurchase |
319,608 |
276,403 |
||||||||||||
Short-term borrowings |
42,148 |
39,499 |
||||||||||||
March 31, 2013 |
December 31, 2012 |
|||||||||||||
Amount |
Rate |
Amount |
Rate |
|||||||||||
Period-end balance |
||||||||||||||
Federal funds sold |
$ |
— |
— |
% |
$ |
600 |
0.54 |
% |
||||||
Securities borrowed or purchased under agreements to resell |
220,623 |
0.53 |
219,324 |
0.92 |
||||||||||
Total |
$ |
220,623 |
0.53 |
$ |
219,924 |
0.92 |
||||||||
Federal funds purchased |
$ |
161 |
0.05 |
% |
$ |
1,151 |
0.17 |
% |
||||||
Securities loaned or sold under agreements to repurchase |
247,988 |
0.77 |
292,108 |
1.11 |
||||||||||
Short-term borrowings |
42,148 |
2.59 |
30,731 |
3.08 |
||||||||||
Total |
$ |
290,297 |
1.00 |
$ |
323,990 |
1.29 |
||||||||
195
Offsetting of Securities Financing Agreements |
Substantially all repurchase and resale activities are transacted under legally enforceable master repurchase agreements that give the Corporation, in the event of default by the counterparty, the right to liquidate securities held and to offset receivables and payables with the same counterparty. The Corporation offsets repurchase and resale transactions with the same counterparty on the Consolidated Balance Sheet where it has such a legally enforceable master netting agreement and the transactions have the same maturity date.
Substantially all securities borrowing and lending activities are transacted under legally enforceable master securities lending agreements that give the Corporation, in the event of default by the counterparty, the right to liquidate securities held and to offset receivables and payables with the same counterparty. In certain instances, the Corporation offsets securities borrowing and lending transactions with the same counterparty on the Consolidated Balance Sheet where it has such a legally enforceable master netting agreement and the transactions have the same maturity date.
The table below presents securities financing agreements included on the Consolidated Balance Sheet in federal funds sold and securities borrowed or purchased under agreements to resell and federal funds purchased and securities loaned or sold under agreements to repurchase at March 31, 2013 and December 31, 2012. Balances are presented on a gross basis, prior to the application of counterparty netting. Gross assets and liabilities are adjusted on an aggregate basis to take into consideration the effects of legally enforceable master netting agreements. For information on the offsetting of derivatives, see Note 3 – Derivatives.
The "other" amount in the table below relates to transactions where the Corporation acts as the lender in a securities lending agreement and receives securities that can be pledged or sold as collateral. In these transactions, the Corporation recognizes an asset at fair value, representing the securities received, and a liability for the same amount, representing the obligation to return those securities. The "other" amount is included on the Consolidated Balance Sheet in other assets and accrued expenses and other liabilities.
The column titled "Financial Instruments" in the table below includes securities collateral purchased or sold, and received or pledged where there is a legally enforceable master netting agreement. These amounts are not offset on the Consolidated Balance Sheet, but are shown as a reduction to the net balance sheet amount in the table to derive a net asset or liability.
Gross assets and liabilities include activity where the enforceability of certain master netting agreements under bankruptcy laws in some countries or industries is not certain and accordingly are reported on a gross basis.
Securities Financing Agreements | |||||||||||||||||||
March 31, 2013 |
|||||||||||||||||||
(Dollars in millions) |
Gross Assets/Liabilities |
Amounts Offset |
Net Balance Sheet Amount |
Financial Instruments |
Net Asset/Liability |
||||||||||||||
Securities borrowed or purchased under agreements to resell |
$ |
356,816 |
$ |
(136,193 |
) |
$ |
220,623 |
$ |
(194,312 |
) |
$ |
26,311 |
|||||||
December 31, 2012 |
|||||||||||||||||||
Securities borrowed or purchased under agreements to resell |
$ |
366,238 |
$ |
(146,914 |
) |
$ |
219,324 |
$ |
(191,806 |
) |
$ |
27,518 |
|||||||
March 31, 2013 |
|||||||||||||||||||
Securities loaned or sold under agreements to repurchase |
$ |
384,181 |
$ |
(136,193 |
) |
$ |
247,988 |
$ |
(210,823 |
) |
$ |
37,165 |
|||||||
Other |
13,366 |
— |
13,366 |
(13,356 |
) |
10 |
|||||||||||||
Total |
$ |
397,547 |
$ |
(136,193 |
) |
$ |
261,354 |
$ |
(224,179 |
) |
$ |
37,175 |
|||||||
December 31, 2012 |
|||||||||||||||||||
Securities loaned or sold under agreements to repurchase |
$ |
439,022 |
$ |
(146,914 |
) |
$ |
292,108 |
$ |
(247,756 |
) |
$ |
44,352 |
|||||||
Other |
12,306 |
— |
12,306 |
(12,302 |
) |
4 |
|||||||||||||
Total |
$ |
451,328 |
$ |
(146,914 |
) |
$ |
304,414 |
$ |
(260,058 |
) |
$ |
44,356 |
|||||||
196
NOTE 11 – Commitments and Contingencies |
In the normal course of business, the Corporation enters into a number of off-balance sheet commitments. These commitments expose the Corporation to varying degrees of credit and market risk and are subject to the same credit and market risk limitation reviews as those instruments recorded on the Consolidated Balance Sheet. For additional information on commitments and contingencies, see Note 13 – Commitments and Contingencies to the Consolidated Financial Statements of the Corporation's 2012 Annual Report on Form 10-K.
Credit Extension Commitments |
The Corporation enters into commitments to extend credit such as loan commitments, standby letters of credit and commercial letters of credit to meet the financing needs of its customers. The Credit Extension Commitments table includes the notional amount of unfunded legally binding lending commitments net of amounts distributed (e.g., syndicated) to other financial institutions of $23.1 billion and $23.9 billion at March 31, 2013 and December 31, 2012. At March 31, 2013, the carrying amount of these commitments, excluding commitments accounted for under the fair value option, was $507 million, including deferred revenue of $21 million and a reserve for unfunded lending commitments of $486 million. At December 31, 2012, the comparable amounts were $534 million, $21 million and $513 million, respectively. The carrying amount of these commitments is classified in accrued expenses and other liabilities on the Consolidated Balance Sheet.
The table below also includes the notional amount of commitments of $15.7 billion and $18.3 billion at March 31, 2013 and December 31, 2012 that are accounted for under the fair value option. However, the table below excludes cumulative net fair value adjustments of $468 million and $528 million on these commitments, which are classified in accrued expenses and other liabilities. For information regarding the Corporation's loan commitments accounted for under the fair value option, see Note 17 – Fair Value Option.
Credit Extension Commitments |
|||||||||||||||||||
March 31, 2013 |
|||||||||||||||||||
(Dollars in millions) |
Expire in
One Year
or Less
|
Expire After
One Year Through
Three Years |
Expire After Three Years Through Five Years |
Expire After Five Years |
Total |
||||||||||||||
Notional amount of credit extension commitments |
|||||||||||||||||||
Loan commitments |
$ |
93,870 |
$ |
83,884 |
$ |
129,988 |
$ |
20,187 |
$ |
327,929 |
|||||||||
Home equity lines of credit |
2,164 |
14,949 |
23,904 |
18,978 |
59,995 |
||||||||||||||
Standby letters of credit and financial guarantees (1)
|
23,756 |
10,857 |
3,079 |
4,248 |
41,940 |
||||||||||||||
Letters of credit |
1,911 |
78 |
2 |
717 |
2,708 |
||||||||||||||
Legally binding commitments |
121,701 |
109,768 |
156,973 |
44,130 |
432,572 |
||||||||||||||
Credit card lines (2)
|
403,687 |
— |
— |
— |
403,687 |
||||||||||||||
Total credit extension commitments |
$ |
525,388 |
$ |
109,768 |
$ |
156,973 |
$ |
44,130 |
$ |
836,259 |
|||||||||
December 31, 2012 |
|||||||||||||||||||
Notional amount of credit extension commitments |
|||||||||||||||||||
Loan commitments |
$ |
103,791 |
$ |
83,885 |
$ |
130,805 |
$ |
19,942 |
$ |
338,423 |
|||||||||
Home equity lines of credit |
2,134 |
13,584 |
23,344 |
21,856 |
60,918 |
||||||||||||||
Standby letters of credit and financial guarantees (1)
|
24,593 |
11,387 |
3,094 |
4,751 |
43,825 |
||||||||||||||
Letters of credit |
2,003 |
70 |
10 |
546 |
2,629 |
||||||||||||||
Legally binding commitments |
132,521 |
108,926 |
157,253 |
47,095 |
445,795 |
||||||||||||||
Credit card lines (2)
|
414,044 |
— |
— |
— |
414,044 |
||||||||||||||
Total credit extension commitments |
$ |
546,565 |
$ |
108,926 |
$ |
157,253 |
$ |
47,095 |
$ |
859,839 |
|||||||||
(1) |
The notional amounts of SBLCs and financial guarantees classified as investment grade and non-investment grade based on the credit quality of the underlying reference name within the instrument were $30.2 billion and $11.2 billion at March 31, 2013, and $31.5 billion and $11.6 billion at December 31, 2012. Amounts include consumer SBLCs of $562 million and $669 million at March 31, 2013 and December 31, 2012.
|
(2) |
Includes business card unused lines of credit. |
Legally binding commitments to extend credit generally have specified rates and maturities. Certain of these commitments have adverse change clauses that help to protect the Corporation against deterioration in the borrower's ability to pay.
197
Other Commitments |
Global Principal Investments and Other Equity Investments
At March 31, 2013 and December 31, 2012, the Corporation had unfunded equity investment commitments of $275 million and $307 million. In light of proposed Basel Committee on Banking Supervision regulatory capital changes related to unfunded commitments, over the past three years, the Corporation has actively reduced these commitments in a series of sale transactions involving its private equity fund investments.
Other Commitments
At March 31, 2013 and December 31, 2012, the Corporation had commitments to purchase loans (e.g., residential mortgage and commercial real estate) of $1.7 billion and $1.3 billion, which upon settlement will be included in loans or LHFS.
At March 31, 2013 and December 31, 2012, the Corporation had commitments to enter into forward-dated resale and securities borrowing agreements of $86.9 billion and $67.3 billion and commitments to enter into forward-dated repurchase and securities lending agreements of $56.9 billion and $42.3 billion. All of these commitments expire within the next 12 months.
The Corporation is a party to operating leases for certain of its premises and equipment. Commitments under these leases are approximately $2.3 billion, $2.6 billion, $2.3 billion, $1.9 billion and $1.5 billion for the remainder of 2013 and the years through 2017, respectively, and $6.7 billion in the aggregate for all years thereafter.
Other Guarantees |
Bank-owned Life Insurance Book Value Protection
The Corporation sells products that offer book value protection to insurance carriers who offer group life insurance policies to corporations, primarily banks. The book value protection is provided on portfolios of intermediate investment-grade fixed-income securities and is intended to cover any shortfall in the event that policyholders surrender their policies and market value is below book value. These guarantees are recorded as derivatives and carried at fair value in the trading portfolio. At March 31, 2013 and December 31, 2012, the notional amount of these guarantees totaled $13.2 billion and $13.4 billion and the Corporation's maximum exposure related to these guarantees for both periods totaled $3.0 billion with estimated maturity dates between 2030 and 2040. The net fair value including the fee receivable associated with these guarantees was $49 million and $52 million at March 31, 2013 and December 31, 2012 and reflects the probability of surrender as well as the multiple structural protection features in the contracts.
Employee Retirement Protection
The Corporation sells products that offer book value protection primarily to plan sponsors of the Employee Retirement Income Security Act of 1974 (ERISA) governed pension plans, such as 401(k) plans and 457 plans. The book value protection is provided on portfolios of intermediate/short-term investment-grade fixed-income securities and is intended to cover any shortfall in the event that plan participants continue to make qualified withdrawals after all securities have been liquidated and there is remaining book value. The Corporation retains the option to exit the contract at any time. If the Corporation exercises its option, the investment manager will either terminate the contract or convert the portfolio into a high-quality fixed-income portfolio, typically all government or government-backed agency securities, with the proceeds of the liquidated assets to assure the return of principal. To manage its exposure, the Corporation imposes restrictions and constraints on the timing of the withdrawals, the manner in which the portfolio is liquidated and the funds are accessed, and the investment parameters of the underlying portfolio. These constraints, combined with significant structural protections, are designed to provide adequate buffers and guard against payments even under extreme stress scenarios. These guarantees are recorded as derivatives and carried at fair value in the trading portfolio. At March 31, 2013 and December 31, 2012, the notional amount of these guarantees totaled $15.7 billion and $18.4 billion with estimated maturity dates up to 2015 if the exit option is exercised on all deals. As of March 31, 2013, the Corporation had not made a payment under these products.
198
Merchant Services
In accordance with credit and debit card association rules, the Corporation sponsors merchant processing servicers that process credit and debit card transactions on behalf of various merchants. In connection with these services, a liability may arise in the event of a billing dispute between the merchant and a cardholder that is ultimately resolved in the cardholder's favor. If the merchant defaults on its obligation to reimburse the cardholder, the cardholder, through its issuing bank, generally has until six months after the date of the transaction to present a chargeback to the merchant processor, which is primarily liable for any losses on covered transactions. However, if the merchant processor fails to meet its obligation to reimburse the cardholder for disputed transactions, then the Corporation, as the sponsor, could be held liable for the disputed amount. For the three months ended March 31, 2013 and 2012, the sponsored entities processed and settled $148.3 billion and $133.2 billion of transactions and recorded losses of $4 million and $2 million. A significant portion of this activity was processed by a joint venture in which the Corporation holds a 49 percent ownership. At March 31, 2013 and December 31, 2012, the sponsored merchant processing servicers held as collateral $226 million and $202 million of merchant escrow deposits which may be used to offset amounts due from the individual merchants.
The Corporation believes the maximum potential exposure for chargebacks would not exceed the total amount of merchant transactions processed through Visa, MasterCard and Discover for the last six months, which represents the claim period for the cardholder, plus any outstanding delayed-delivery transactions. As of March 31, 2013 and December 31, 2012, the maximum potential exposure for sponsored transactions totaled $259.1 billion and $263.9 billion. However, the Corporation believes that the maximum potential exposure is not representative of the actual potential loss exposure and does not expect to make material payments in connection with these guarantees.
Other Derivative Contracts
The Corporation funds selected assets, including securities issued by CDOs and CLOs, through derivative contracts, typically total return swaps, with third parties and VIEs that are not consolidated on the Consolidated Balance Sheet. At March 31, 2013 and December 31, 2012, the total notional amount of these derivative contracts was $2.6 billion and $2.9 billion with commercial banks and $1.4 billion with VIEs for both periods. The underlying securities are senior securities and substantially all of the Corporation's exposures are insured. Accordingly, the Corporation's exposure to loss consists principally of counterparty risk to the insurers. In certain circumstances, generally as a result of ratings downgrades, the Corporation may be required to purchase the underlying assets, which would not result in additional gain or loss to the Corporation as such exposure is already reflected in the fair value of the derivative contracts.
Other Guarantees
The Corporation has entered into additional guarantee agreements and commitments, including lease-end obligation agreements, partial credit guarantees on certain leases, real estate joint venture guarantees, sold risk participation swaps, divested business commitments and sold put options that require gross settlement. The maximum potential future payment under these agreements was approximately $3.3 billion and $3.1 billion at March 31, 2013 and December 31, 2012. The estimated maturity dates of these obligations extend up to 2033. The Corporation has made no material payments under these guarantees.
In the normal course of business, the Corporation periodically guarantees the obligations of its affiliates in a variety of transactions including ISDA-related transactions and non-ISDA related transactions such as commodities trading, repurchase agreements, prime brokerage agreements and other transactions.
Payment Protection Insurance Claims Matter
In the U.K., the Corporation previously sold payment protection insurance (PPI) through its international card services business to credit card customers and consumer loan customers. PPI covers a consumer's loan or debt repayment if certain events occur such as loss of job or illness. In response to an elevated level of customer complaints across the industry, heightened media coverage and pressure from consumer advocacy groups, the U.K. Financial Services Authority investigated and raised concerns about the way some companies have handled complaints related to the sale of these insurance policies. In connection with this matter, the Corporation established a reserve for PPI. The reserve was $391 million and $510 million at March 31, 2013 and December 31, 2012. The Corporation recorded no expense for the three months ended March 31, 2013 compared to $200 million for the same period in 2012. It is reasonably possible that the Corporation will incur additional expense related to PPI claims; however, the amount of such additional expense cannot be reasonably estimated.
Identity Theft Protection
The Corporation has received inquiries from and has been in discussions with regulatory authorities concerning activities related to identity theft protection services, including customers who may have paid for but did not receive certain of such services from third-party vendors of the Corporation, and whether appropriate oversight existed.
199
Litigation and Regulatory Matters |
The following supplements the disclosure in Note 13 – Commitments and Contingencies to the Consolidated Financial Statements of the Corporation's 2012 Annual Report on Form 10-K (the prior commitments and contingencies disclosure).
In the ordinary course of business, the Corporation and its subsidiaries are routinely defendants in or parties to many pending and threatened legal actions and proceedings, including actions brought on behalf of various classes of claimants. These actions and proceedings are generally based on alleged violations of consumer protection, securities, environmental, banking, employment, contract and other laws. In some of these actions and proceedings, claims for substantial monetary damages are asserted against the Corporation and its subsidiaries.
In the ordinary course of business, the Corporation and its subsidiaries are also subject to regulatory examinations, information gathering requests, inquiries, investigations, and threatened legal actions and proceedings. Certain subsidiaries of the Corporation are registered broker/dealers or investment advisors and are subject to regulation by the SEC, the Financial Industry Regulatory Authority, the Prudential Regulatory Authority, the Financial Conduct Authority and other international, federal and state securities regulators. In connection with formal and informal inquiries by those agencies, such subsidiaries receive numerous requests, subpoenas and orders for documents, testimony and information in connection with various aspects of their regulated activities.
In view of the inherent difficulty of predicting the outcome of such litigation and regulatory matters, particularly where the claimants seek very large or indeterminate damages or where the matters present novel legal theories or involve a large number of parties, the Corporation generally cannot predict what the eventual outcome of the pending matters will be, what the timing of the ultimate resolution of these matters will be, or what the eventual loss, fines or penalties related to each pending matter may be.
In accordance with applicable accounting guidance, the Corporation establishes an accrued liability for litigation and regulatory matters when those matters present loss contingencies that are both probable and estimable. In such cases, there may be an exposure to loss in excess of any amounts accrued. When a loss contingency is not both probable and estimable, the Corporation does not establish an accrued liability. As a litigation or regulatory matter develops, the Corporation, in conjunction with any outside counsel handling the matter, evaluates on an ongoing basis whether such matter presents a loss contingency that is probable and estimable. If, at the time of evaluation, the loss contingency related to a litigation or regulatory matter is not both probable and estimable, the matter will continue to be monitored for further developments that would make such loss contingency both probable and estimable. Once the loss contingency related to a litigation or regulatory matter is deemed to be both probable and estimable, the Corporation will establish an accrued liability with respect to such loss contingency and record a corresponding amount of litigation-related expense. The Corporation continues to monitor the matter for further developments that could affect the amount of the accrued liability that has been previously established. Excluding expenses of internal or external legal service providers, litigation-related expense of $2.2 billion was recognized for the three months ended March 31, 2013 compared to $793 million for the same period in 2012.
For a limited number of the matters disclosed in this Note, and in the prior commitments and contingencies disclosure, for which a loss is probable or reasonably possible in future periods, whether in excess of a related accrued liability or where there is no accrued liability, the Corporation is able to estimate a range of possible loss. In determining whether it is possible to provide an estimate of loss or range of possible loss, the Corporation reviews and evaluates its material litigation and regulatory matters on an ongoing basis, in conjunction with any outside counsel handling the matter, in light of potentially relevant factual and legal developments. These may include information learned through the discovery process, rulings on dispositive motions, settlement discussions, and other rulings by courts, arbitrators or others. In cases in which the Corporation possesses sufficient appropriate information to develop an estimate of loss or range of possible loss, that estimate is aggregated and disclosed below. There may be other disclosed matters for which a loss is probable or reasonably possible but such an estimate may not be possible. For those matters where an estimate is possible, management currently estimates the aggregate range of possible loss is $0 to $2.6 billion in excess of the accrued liability (if any) related to those matters. This estimated range of possible loss is based upon currently available information and is subject to significant judgment and a variety of assumptions, and known and unknown uncertainties. The matters underlying the estimated range will change from time to time, and actual results may vary significantly from the current estimate. Those matters for which an estimate is not possible are not included within this estimated range. Therefore, this estimated range of possible loss represents what the Corporation believes to be an estimate of possible loss only for certain matters meeting these criteria. It does not represent the Corporation's maximum loss exposure. Information is provided below, or in the prior commitments and contingencies disclosure, regarding the nature of all of these contingencies and, where specified, the amount of the claim associated with these loss contingencies. Based on current knowledge, management does not believe that loss contingencies arising from pending matters, including the matters described herein, and in the prior commitments and contingencies disclosure, will have a material adverse effect on the consolidated financial position or liquidity of the Corporation. However, in light of the inherent uncertainties involved in these matters, some of which are beyond the Corporation's control, and the very large or indeterminate damages sought in some of these matters, an adverse outcome in one or more of these matters could be material to the Corporation's results of operations or cash flows for any particular reporting period.
200
Auction Rate Securities Litigation
Antitrust Actions
On March 5, 2013, the U.S. Court of Appeals for the Second Circuit affirmed the January 25, 2010 dismissal of the antitrust actions.
Countrywide Bond Insurance Litigation
MBIA
On April 2, 2013, the New York Supreme Court, Appellate Division, First Department, modified the lower court's January 3, 2012 decision regarding MBIA's motion for partial summary judgment. The First Department reversed the lower court's ruling that MBIA could recover rescissory damages, holding that rescission is legally unavailable to MBIA. The First Department also reversed the lower court's ruling with respect to the interpretation of the “materially and adversely affects” language of the transactional documents, holding that MBIA was entitled to a finding that a loan need not be in default in order to trigger Countrywide's obligation to repurchase that loan. The Court held that “to the extent plaintiff can prove that a loan which continues to perform 'materially and adversely affect[ed]' its interest, it is entitled to have defendants repurchase that loan.” The First Department affirmed the lower court's ruling that, under the New York Insurance Law, in order to prove its fraud and breach of contract claims, MBIA does not need to establish a direct causal link between Countrywide's alleged misrepresentations or warranty breaches and MBIA's claimed damages. On May 3, 2013, Countrywide filed a motion for leave to appeal the First Department's decision to the New York Court of Appeals.
On April 29, 2013, the New York Supreme Court, New York County, issued rulings granting in part and denying in part Countrywide's motion for summary judgment and MBIA's motion for summary judgment. With respect to Countrywide's motion for summary judgment, the court granted summary judgment dismissing MBIA's claim for indemnification and claim for rescissory damages (consistent with the April 2, 2013 decision of the Appellate Division, First Department), but otherwise denied summary judgment regarding MBIA's claims for fraud, breach of the Insurance Agreements, breach of Countrywide's servicing obligations and punitive damages. With respect to MBIA's motion for summary judgment, the court found that MBIA had established breaches of representations and warranties with respect to certain of the loans in its sample and had not done so with respect to other loans in the sample but denied summary judgment to MBIA on any loan on the ground that whether the material and adverse effect requirement had been satisfied was not susceptible to resolution on summary judgment. On May 3, 2013, Countrywide filed a notice of appeal from the court's rulings.
The same day, the court also denied the Corporation's and MBIA's motions for summary judgment regarding MBIA's successor liability claims. The court ruled that New York law governs MBIA's contentions that the Corporation is liable for Countrywide's debts, but that factual disputes with respect to the application of New York law of de facto merger rendered summary judgment inappropriate. The court also ruled that, due to material factual disputes, summary judgment was not appropriate with respect to MBIA's claim that the Corporation impliedly assumed Countrywide's liabilities. On May 3, 2013, the Corporation filed a notice of appeal from the portion of the court's ruling that denied the Corporation's motion for summary judgment.
On May 7, 2013, the Corporation entered into the MBIA Settlement which resolved all outstanding litigation between the parties, as well as other claims between the parties, including outstanding and potential claims by MBIA related to alleged representations and warranties breaches and other claims involving certain first- and second-lien RMBS trusts for which MBIA provided financial guarantee insurance. Certain of these claims were the subject of the litigation in the New York Supreme Court, New York County (MBIA Insurance Corporation, Inc. v. Countrywide Home Loans, et al., filed on September 30, 2008) described above and also litigation in the California Superior Court, Los Angeles County (MBIA Insurance Corporation, Inc. v. Bank of America Corporation, Countrywide Financial Corporation, Countrywide Home Loans, Inc., Countrywide Securities Corporation, et al., filed on July 10, 2009). Under the MBIA Settlement, all pending litigation between the parties will be dismissed and each party will receive a global release of those claims. For additional information, see Note 8 – Representations and Warranties Obligations and Corporate Guarantees.
In re Bank of America Securities, Derivative and Employee Retirement Income Security Act (ERISA) Litigation
Consolidated Securities Class Action
On April 5, 2013, the U.S. District Court for the Southern District of New York granted final approval to the settlement of the Consolidated Securities Class Action.
201
LIBOR and Other Reference Rate Inquiries and Litigation
Defendants moved to dismiss the initially filed actions which had been coordinated in the U.S. District Court for the Southern District of New York. On March 29, 2013, the court dismissed the antitrust, RICO and related state law claims and, based on the statute of limitations, substantially limited the manipulation claims under the Commodities Exchange Act that are allowed to proceed. The court's rulings will be applicable to later filed actions to the extent they assert similar claims.
Mortgage-backed Securities Litigation
The Corporation and its affiliates, Countrywide entities and their affiliates, and/or Merrill Lynch entities and their affiliates have been named as defendants in a number of cases relating to their various roles as issuer, originator, seller, depositor, sponsor, underwriter and/or controlling entity in MBS offerings, pursuant to which the MBS investors were entitled to a portion of the cash flow from the underlying pools of mortgages. These cases generally include purported class action suits and actions by individual MBS purchasers. Although the allegations vary by lawsuit, these cases generally allege that the registration statements, prospectuses and prospectus supplements for securities issued by securitization trusts contained material misrepresentations and omissions, in violation of Sections 11, 12 and/or 15 of the Securities Act of 1933, Sections 10(b) and/or 20 of the Securities Exchange Act of 1934 and/or state securities laws, and other state statutory and common laws.
These cases generally involve allegations of false and misleading statements regarding: (i) the process by which the properties that served as collateral for the mortgage loans underlying the MBS were appraised; (ii) the percentage of equity that mortgage borrowers had in their homes; (iii) the borrowers' ability to repay their mortgage loans; (iv) the underwriting practices by which those mortgage loans were originated; (v) the ratings given to the different tranches of MBS by rating agencies; and (vi) the validity of each issuing trust's title to the mortgage loans comprising the pool for that securitization (collectively, MBS Claims). Plaintiffs in these cases generally seek unspecified compensatory damages, unspecified costs and legal fees and, in some instances, seek rescission. A number of other entities have threatened legal actions against the Corporation and its affiliates, Countrywide entities and their affiliates, and/or Merrill Lynch entities and their affiliates concerning MBS offerings. On March 29, 2013, the Corporation and the National Credit Union Administration (NCUA) agreed to resolve claims concerning certain MBS offerings that the NCUA had threatened to bring against the Corporation, Merrill Lynch, Countrywide and certain of their affiliates. The settlement amount will be covered by existing reserves.
On August 15, 2011, the U.S. Judicial Panel on Multidistrict Litigation ordered multiple federal court cases involving Countrywide MBS consolidated for pretrial purposes in the U.S. District Court for the Central District of California in a multi-district litigation entitled In re Countrywide Financial Corp. Mortgage-Backed Securities Litigation (the Countrywide RMBS MDL).
AIG Litigation
On April 19, 2013, the U.S. Court of Appeals for the Second Circuit issued a decision vacating the order of the U.S. District Court for the Southern District of New York denying AIG's motion to remand, and remanded the case to the district court for further proceedings concerning whether the court will exercise its jurisdiction on other grounds.
On May 6, 2013, the U.S. District Court for the Central District of California granted in part and denied in part defendants' motion to dismiss. The court dismissed claims concerning certain types of misrepresentations as well as successor liability claims. Other claims with respect to the securities at issue remain pending.
FHFA Litigation
On February 6, 2013, in Federal Housing Finance Agency v. Countrywide Financial Corporation, et al., FHFA agreed to voluntarily dismiss certain of its Virginia blue sky claims. On March 15, 2013, the court dismissed the negligent misrepresentation and aiding and abetting claims as to all defendants, and the Securities Act of 1933 and Washington D.C. blue sky claims as to certain defendants. The court also dismissed FHFA's successor liability claims but permitted FHFA leave to amend its fraudulent conveyance claims. The court otherwise denied defendants' motions to dismiss.
On April 5, 2013, the U.S. Court of Appeals for the Second Circuit affirmed the district court's ruling in the UBS Action pertaining to the statute of repose on the federal and state securities law claims and the statute of limitations on the federal securities law claims. FHFA had asserted similar claims in Federal Housing Finance Agency v. Bank of America Corporation, et al. and Federal Housing Finance Agency v. Merrill Lynch & Co., Inc., et al.
202
Luther Litigation and Related Actions
On April 16, 2013, a settlement in principle was reached to resolve three putative and certified class action lawsuits involving Countrywide-issued RMBS: Maine State Retirement System v. Countrywide Financial Corp., David H. Luther v. Countrywide Financial Corp. and Western Conference of Teamsters Pension Trust Fund v. Countrywide Financial Corp. The first of these suits was filed in November 2007, and they collectively concern the disclosures that were made in connection with 429 Countrywide RMBS offerings issued from 2005 through 2007. Under the settlement in principle, the lawsuits will be dismissed in their entirety, and defendants will receive a global release in exchange for a settlement payment of $500 million. The settlement is subject to court approval. The settlement amount is covered by a combination of pre-existing litigation reserves and additional litigation reserves recorded in the three months ended March 31, 2013.
Ocala Litigation
FDIC Action
On February 5, 2013, BANA filed a motion for clarification of the court's December 10, 2012 ruling on BANA's motion to dismiss the FDIC's counterclaims. On March 6, 2013, the court ruled that certain language in the custodial agreement between BANA and Colonial Bank purporting to limit BANA's liability is unenforceable due to ambiguity, and that BANA is foreclosed from introducing extrinsic evidence to resolve the ambiguity. On March 27, 2013, BANA filed a motion seeking certification for interlocutory appeal of the court's December 10, 2012 ruling as so clarified.
Mortgage Repurchase Litigation
TMST, Inc. Litigation
On March 27, 2013, the settlement agreement was approved by the bankruptcy court overseeing the Thornburg bankruptcy; consequently, on April 29, 2013, the case against Countrywide Home Loans, Inc. and the Corporation was dismissed with prejudice.
Pennsylvania Public School Employees' Retirement System
The Corporation and several current and former officers were named as defendants in a putative class action filed in the U.S. District Court for the Southern District of New York entitled Pennsylvania Public School Employees' Retirement System v. Bank of America, et al.
Following the filing of a complaint on February 2, 2011, plaintiff subsequently filed an amended complaint on September 23, 2011 in which plaintiff sought to sue on behalf of all persons who acquired the Corporation's common stock between February 27, 2009 and October 19, 2010 and “Common Equivalent Securities” sold in a December 2009 offering. The amended complaint asserted claims under Sections 10(b) and 20(a) of the Securities Exchange Act of 1934 (Exchange Act) and Sections 11 and 15 of the Securities Act of 1933 (Securities Act), and alleged that the Corporation's public statements: (i) concealed problems in the Corporation's mortgage servicing business resulting from the widespread use of the Mortgage Electronic Recording System; (ii) failed to disclose the Corporation's exposure to mortgage repurchase claims; (iii) misrepresented the adequacy of internal controls; and (iv) violated certain Generally Accepted Accounting Principles. The amended complaint sought unspecified damages.
On July 11, 2012, the court granted in part and denied in part defendants' motions to dismiss the amended complaint. All claims under the Securities Act were dismissed against all defendants, with prejudice. The motion to dismiss the claim against the Corporation under Section 10(b) of the Exchange Act was denied. All claims under the Exchange Act against the officers were dismissed, with leave to replead. Defendants moved to dismiss a second amended complaint in which plaintiff sought to re-plead claims against certain current and former officers under Sections 10(b) and 20(a). On April 17, 2013, the court granted in part and denied in part the motion to dismiss. Certain claims against the current and former officers under Sections 10(b) and 20(a) were sustained.
203
NOTE 12 – Shareholders' Equity |
Common Stock |
The table below presents the declared quarterly cash dividends on common stock during 2013 and through May 7, 2013.
Declaration Date |
Record Date |
Payment Date |
Dividend Per Share |
||||
April 30, 2013 |
June 7, 2013 |
June 28, 2013 |
$ |
0.01 |
|||
January 23, 2013 |
March 1, 2013 |
March 22, 2013 |
0.01 |
||||
On March 14, 2013, the Corporation announced that its Board of Directors authorized the repurchase of up to $5.0 billion of common stock. The timing and amount of common share repurchases will be consistent with the Corporation's 2013 capital plan. The Corporation did not have any unregistered sales of its equity securities during the three months ended March 31, 2013.
During the three months ended March 31, 2013, in connection with employee stock plans, the Corporation issued approximately 72 million shares and repurchased approximately 28 million shares of its common stock to satisfy tax withholding obligations. At March 31, 2013, the Corporation had reserved 1.8 billion unissued shares of common stock for future issuances under employee stock plans, common stock warrants, convertible notes and preferred stock.
Preferred Stock |
During the three months ended March 31, 2013, the dividends declared on preferred stock were $373 million.
On May 1, 2013, the Corporation redeemed approximately $2.9 billion of its 8.20% Non-Cumulative Preferred Stock, Series H. On April 1, 2013, a notice of redemption was sent to holders of the Corporation's 8.625% Non-Cumulative Preferred Stock, Series 8, including holders of depositary shares representing interests therein, to redeem approximately $2.7 billion of the Series 8 Preferred Stock on May 28, 2013.
204
NOTE 13 – Accumulated Other Comprehensive Income (Loss) |
The table below presents the changes in accumulated OCI after-tax for the three months ended March 31, 2013 and 2012.
(Dollars in millions) |
Available-for-sale Debt Securities |
Available-for-sale
Marketable
Equity Securities
|
Derivatives |
Employee
Benefit Plans
|
Foreign
Currency (1)
|
Total |
|||||||||||||||||
Balance, December 31, 2011 |
$ |
3,100 |
$ |
3 |
$ |
(3,785 |
) |
$ |
(4,391 |
) |
$ |
(364 |
) |
$ |
(5,437 |
) |
|||||||
Net change |
(938 |
) |
14 |
382 |
952 |
31 |
441 |
||||||||||||||||
Balance, March 31, 2012 |
$ |
2,162 |
$ |
17 |
$ |
(3,403 |
) |
$ |
(3,439 |
) |
$ |
(333 |
) |
$ |
(4,996 |
) |
|||||||
Balance, December 31, 2012 |
$ |
4,443 |
$ |
462 |
$ |
(2,869 |
) |
$ |
(4,456 |
) |
$ |
(377 |
) |
$ |
(2,797 |
) |
|||||||
Net change |
(946 |
) |
40 |
172 |
85 |
(42 |
) |
(691 |
) |
||||||||||||||
Balance, March 31, 2013 |
$ |
3,497 |
$ |
502 |
$ |
(2,697 |
) |
$ |
(4,371 |
) |
$ |
(419 |
) |
$ |
(3,488 |
) |
|||||||
(1) |
Net change in fair value represents the impact of changes in spot foreign exchange rates on the Corporation's net investment in non-U.S. operations and related hedges. |
The table below presents additional information on each component of OCI before- and after-tax for the three months ended March 31, 2013 and 2012.
Changes in OCI Components Before- and After-tax | |||||||||||||||||||||||
Three Months Ended March 31 |
|||||||||||||||||||||||
2013 |
2012 |
||||||||||||||||||||||
(Dollars in millions) |
Before-tax |
Tax effect |
After-tax |
Before-tax |
Tax effect |
After-tax |
|||||||||||||||||
Available-for-sale debt securities: |
|||||||||||||||||||||||
Net change in fair value recorded in accumulated OCI |
$ |
(1,444 |
) |
$ |
535 |
$ |
(909 |
) |
$ |
(780 |
) |
$ |
291 |
$ |
(489 |
) |
|||||||
Net realized (gains) losses reclassified into earnings |
(59 |
) |
22 |
(37 |
) |
(712 |
) |
263 |
(449 |
) |
|||||||||||||
Net change |
(1,503 |
) |
557 |
(946 |
) |
(1,492 |
) |
554 |
(938 |
) |
|||||||||||||
Available-for-sale marketable equity securities: |
|||||||||||||||||||||||
Net change in fair value recorded in accumulated OCI |
64 |
(24 |
) |
40 |
25 |
(10 |
) |
15 |
|||||||||||||||
Net realized (gains) losses reclassified into earnings |
(1 |
) |
1 |
— |
(2 |
) |
1 |
(1 |
) |
||||||||||||||
Net change |
63 |
(23 |
) |
40 |
23 |
(9 |
) |
14 |
|||||||||||||||
Derivatives: |
|||||||||||||||||||||||
Net change in fair value recorded in accumulated OCI |
41 |
(17 |
) |
24 |
413 |
(153 |
) |
260 |
|||||||||||||||
Net realized (gains) losses reclassified into earnings |
235 |
(87 |
) |
148 |
194 |
(72 |
) |
122 |
|||||||||||||||
Net change |
276 |
(104 |
) |
172 |
607 |
(225 |
) |
382 |
|||||||||||||||
Employee benefit plans: |
|||||||||||||||||||||||
Net realized (gains) losses reclassified into earnings |
74 |
(21 |
) |
53 |
131 |
(49 |
) |
82 |
|||||||||||||||
Settlements and curtailments |
42 |
(10 |
) |
32 |
1,381 |
(511 |
) |
870 |
|||||||||||||||
Net change |
116 |
(31 |
) |
85 |
1,512 |
(560 |
) |
952 |
|||||||||||||||
Foreign currency: |
|||||||||||||||||||||||
Net change in fair value recorded in accumulated OCI |
528 |
(569 |
) |
(41 |
) |
(256 |
) |
287 |
31 |
||||||||||||||
Net realized (gains) losses reclassified into earnings |
34 |
(35 |
) |
(1 |
) |
— |
— |
— |
|||||||||||||||
Net change |
562 |
(604 |
) |
(42 |
) |
(256 |
) |
287 |
31 |
||||||||||||||
Total other comprehensive income (loss) |
$ |
(486 |
) |
$ |
(205 |
) |
$ |
(691 |
) |
$ |
394 |
$ |
47 |
$ |
441 |
||||||||
205
The table below presents effects on net income of significant amounts reclassified out of each component of accumulated OCI before- and after-tax for the three months ended March 31, 2013 and 2012.
Reclassifications Out of Accumulated OCI | |||||||||||
(Dollars in millions) |
Three Months Ended March 31 |
||||||||||
2013 |
2012 |
||||||||||
Accumulated OCI Components |
Reclassifications Out of Accumulated OCI |
Income Statement Line Item |
Reclassifications Out of
Accumulated OCI
|
Income Statement Line Item |
|||||||
Available-for-sale debt securities: |
|||||||||||
$ |
68 |
Gains on sales of debt securities |
$ |
752 |
Gains on sales of debt securities |
||||||
(9 |
) |
Other-than-temporary impairment |
(40 |
) |
Other-than-temporary impairment |
||||||
59 |
Income before income taxes |
712 |
Income before income taxes |
||||||||
22 |
Income tax expense |
263 |
Income tax expense |
||||||||
37 |
Net income |
449 |
Net income |
||||||||
Derivatives: |
|||||||||||
Commodity contracts |
— |
Trading account profits |
(5 |
) |
Trading account profits |
||||||
Equity compensation contracts |
40 |
Personnel |
(37 |
) |
Personnel |
||||||
Interest rate contracts |
(275 |
) |
Net interest income |
(152 |
) |
Net interest income |
|||||
(235 |
) |
Loss before income taxes |
(194 |
) |
Loss before income taxes |
||||||
(87 |
) |
Income tax benefit |
(72 |
) |
Income tax benefit |
||||||
(148 |
) |
Net loss |
(122 |
) |
Net loss |
||||||
Employee benefit plans: |
|||||||||||
Prior service costs |
(1 |
) |
Personnel |
(4 |
) |
Personnel |
|||||
Transition obligation |
— |
Personnel |
(8 |
) |
Personnel |
||||||
Actuarial losses |
(73 |
) |
Personnel |
(119 |
) |
Personnel |
|||||
Settlements and curtailments |
— |
Personnel |
(61 |
) |
Personnel |
||||||
(74 |
) |
Loss before income taxes |
(192 |
) |
Loss before income taxes |
||||||
(21 |
) |
Income tax benefit |
(71 |
) |
Income tax benefit |
||||||
(53 |
) |
Net loss |
(121 |
) |
Net loss |
||||||
Foreign currency: |
|||||||||||
Insignificant items |
(34 |
) |
Other loss |
— |
Other income |
||||||
(34 |
) |
Loss before income taxes |
— |
Income before income taxes |
|||||||
(35 |
) |
Income tax benefit |
— |
Income tax expense |
|||||||
1 |
Net income |
— |
Net income |
||||||||
Total reclassification adjustments |
$ |
(163 |
) |
$ |
206 |
||||||
206
NOTE 14 – Earnings Per Common Share |
The calculation of earnings per common share (EPS) and diluted EPS for the three months ended March 31, 2013 and 2012 is presented below. See Note 1 – Summary of Significant Accounting Principles to the Consolidated Financial Statements of the Corporation's 2012 Annual Report on Form 10-K for additional information on the calculation of EPS.
Three Months Ended March 31 |
|||||||
(Dollars in millions, except per share information; shares in thousands) |
2013 |
2012 |
|||||
Earnings per common share |
|||||||
Net income |
$ |
1,483 |
$ |
653 |
|||
Preferred stock dividends |
(373 |
) |
(325 |
) |
|||
Net income applicable to common shareholders |
1,110 |
328 |
|||||
Dividends and undistributed earnings allocated to participating securities |
— |
(1 |
) |
||||
Net income allocated to common shareholders |
$ |
1,110 |
$ |
327 |
|||
Average common shares issued and outstanding |
10,798,975 |
10,651,367 |
|||||
Earnings per common share |
$ |
0.10 |
$ |
0.03 |
|||
Diluted earnings per common share |
|||||||
Net income applicable to common shareholders |
$ |
1,110 |
$ |
328 |
|||
Dividends and undistributed earnings allocated to participating securities |
— |
(1 |
) |
||||
Net income allocated to common shareholders |
$ |
1,110 |
$ |
327 |
|||
Average common shares issued and outstanding |
10,798,975 |
10,651,367 |
|||||
Dilutive potential common shares (1)
|
355,803 |
110,550 |
|||||
Total diluted average common shares issued and outstanding |
11,154,778 |
10,761,917 |
|||||
Diluted earnings per common share |
$ |
0.10 |
$ |
0.03 |
|||
(1) |
Includes incremental shares from restricted stock units, restricted stock, stock options and warrants. |
The Corporation previously issued a warrant to purchase 700 million shares of the Corporation's common stock to the holder of the Corporation's 6% Cumulative Perpetual Preferred Stock Series T (the Series T Preferred Stock). The warrant may be exercised, at the option of the holder, through tendering the Series T Preferred Stock or paying cash. Due to changes in the fair value of the Series T Preferred Stock during the three months ended March 31, 2013, it became more advantageous for the holder to tender cash to exercise the warrant. As a result, for the three months ended March 31, 2013, the impact of the 700 million common shares underlying the warrant was included in the diluted share count under the treasury stock method. For the three months ended March 31, 2012, the common shares associated with the warrant were not included in the diluted share count because the result would have been antidilutive under the "if-converted" method.
For both the three months ended March 31, 2013 and 2012, 62 million average dilutive potential common shares associated with the Series L Preferred Stock were not included in the diluted share count because the result would have been antidilutive under the "if-converted" method. For the three months ended March 31, 2013 and 2012, average options to purchase 135 million and 176 million shares of common stock were outstanding but not included in the computation of EPS because the result would have been antidilutive under the treasury stock method. For both the three months ended March 31, 2013 and 2012, average warrants to purchase 272 million shares of common stock were outstanding but not included in the computation of EPS because the result would have been antidilutive under the treasury stock method.
207
NOTE 15 – Pension, Postretirement and Certain Compensation Plans |
Pension and Postretirement Plans |
The Corporation sponsors noncontributory trusteed pension plans, a number of noncontributory nonqualified pension plans, and postretirement health and life plans that cover eligible employees. As a result of acquisitions, the Corporation assumed the obligations related to the pension plans of certain legacy companies. These acquired pension plans have been merged into a separate defined benefit pension plan which, together with the Bank of America Pension Plan, are referred to as the Qualified Pension Plans. Effective June 30, 2012, the benefits earned in the Qualified Pension Plans were frozen. Additional information on these plans is presented in Note 18 – Employee Benefit Plans to the Consolidated Financial Statements of the Corporation's 2012 Annual Report on Form 10-K.
Net periodic benefit cost of the Corporation's plans for the three months ended March 31, 2013 and 2012 included the following components.
Components of Net Periodic Benefit Cost | |||||||||||||||
Three Months Ended March 31, 2013 |
|||||||||||||||
(Dollars in millions) |
Qualified Pension Plans |
Non-U.S. Pension Plans |
Nonqualified and Other Pension Plans (1)
|
Postretirement
Health and Life
Plans
|
|||||||||||
Service cost |
$ |
— |
$ |
9 |
$ |
— |
$ |
4 |
|||||||
Interest cost |
151 |
25 |
30 |
13 |
|||||||||||
Expected return on plan assets |
(253 |
) |
(32 |
) |
(27 |
) |
(1 |
) |
|||||||
Amortization of prior service cost |
— |
— |
— |
1 |
|||||||||||
Amortization of net actuarial loss (gain) |
71 |
1 |
6 |
(5 |
) |
||||||||||
Recognized loss (gain) due to settlements and curtailments |
17 |
(7 |
) |
— |
— |
||||||||||
Net periodic benefit cost (income) |
$ |
(14 |
) |
$ |
(4 |
) |
$ |
9 |
$ |
12 |
|||||
Three Months Ended March 31, 2012 |
|||||||||||||||
Service cost |
$ |
114 |
$ |
10 |
$ |
— |
$ |
4 |
|||||||
Interest cost |
172 |
24 |
35 |
18 |
|||||||||||
Expected return on plan assets |
(309 |
) |
(34 |
) |
(38 |
) |
(2 |
) |
|||||||
Amortization of transition obligation |
— |
— |
— |
8 |
|||||||||||
Amortization of prior service cost (credits) |
5 |
— |
(2 |
) |
1 |
||||||||||
Amortization of net actuarial loss (gain) |
123 |
(2 |
) |
3 |
(5 |
) |
|||||||||
Recognized loss due to settlements and curtailments |
58 |
— |
3 |
— |
|||||||||||
Net periodic benefit cost (income) |
$ |
163 |
$ |
(2 |
) |
$ |
1 |
$ |
24 |
||||||
(1) |
Includes nonqualified pension plans and the terminated Merrill Lynch U.S. pension plan. |
The Corporation's best estimate of its contributions to be made to the Non-U.S. Pension Plans, Nonqualified and Other Pension Plans, and Postretirement Health and Life Plans in 2013 is $105 million, $103 million and $107 million, respectively. For the three months ended March 31, 2013, the Corporation contributed $78 million, $39 million and $27 million, respectively, to these plans. The Corporation has not made and does not expect to make a contribution to the Qualified Pension Plans in 2013.
208
Certain Compensation Plans |
During the three months ended March 31, 2013, the Corporation granted 183 million restricted stock unit (RSU) awards to certain employees under the Key Associate Stock Plan. Generally, one-third of the RSUs vest on each of the first three anniversaries of the grant date provided that the employee remains continuously employed with the Corporation during that time. Except for two million RSUs that are authorized to settle in shares of common stock of the Corporation, the RSUs will be paid in cash to the employees on the vesting date based on the fair value of the Corporation's common stock as of the vesting date. The RSUs are expensed ratably over the vesting period, net of estimated forfeitures, for non-retirement eligible employees based upon the fair value of the Corporation's common stock on the accrual date. For RSUs granted to employees who are retirement eligible or will become retirement eligible during the vesting period, the RSUs are expensed as of the grant date or ratably over the period from the grant date to the date the employee becomes retirement eligible, respectively, net of estimated forfeitures. The accrued liability for the RSUs is adjusted to fair value based on changes in the fair value of the Corporation's common stock. The Corporation enters into cash-settled equity derivatives for a significant portion of the RSUs to minimize the change in expense driven by fluctuations in the fair value of the RSUs over the applicable vesting period. For additional information, see Note 19 – Stock-based Compensation Plans to the Consolidated Financial Statements of the Corporation's 2012 Annual Report on Form 10-K.
NOTE 16 – Fair Value Measurements |
Under applicable accounting guidance, fair value is defined as the exchange price that would be received for an asset or paid to transfer a liability (an exit price) in the principal or most advantageous market for the asset or liability in an orderly transaction between market participants on the measurement date. The Corporation determines the fair values of its financial instruments based on the fair value hierarchy established under applicable accounting guidance which requires an entity to maximize the use of observable inputs and minimize the use of unobservable inputs when measuring fair value. There are three levels of inputs used to measure fair value. The Corporation conducts a review of its fair value hierarchy classifications on a quarterly basis. Transfers into or out of fair value hierarchy classifications are made if the significant inputs used in the financial models measuring the fair values of the assets and liabilities became unobservable or observable, respectively, in the current marketplace. These transfers are considered to be effective as of the beginning of the quarter in which they occur. For more information regarding the fair value hierarchy and how the Corporation measures fair value, see Note 1 – Summary of Significant Accounting Principles to the Consolidated Financial Statements of the Corporation's 2012 Annual Report on Form 10-K. The Corporation accounts for certain financial instruments under the fair value option. For more information, see Note 17 – Fair Value Option.
Valuation Processes and Techniques |
The Corporation has various processes and controls in place to ensure that fair value is reasonably estimated. A model validation policy governs the use and control of valuation models used to estimate fair value. This policy requires review and approval of models by personnel who are independent of the front office, and periodic reassessments of models to ensure that they are continuing to perform as designed. In addition, detailed reviews of trading gains and losses are conducted on a daily basis by personnel who are independent of the front office. A price verification group, which is also independent of the front office, utilizes available market information including executed trades, market prices and market-observable valuation model inputs to ensure that fair values are reasonably estimated. The Corporation performs due diligence procedures over third-party pricing service providers in order to support their use in the valuation process. Where market information is not available to support internal valuations, independent reviews of the valuations are performed and any material exposures are escalated through a management review process.
While the Corporation believes its valuation methods are appropriate and consistent with other market participants, the use of different methodologies or assumptions to determine the fair value of certain financial instruments could result in a different estimate of fair value at the reporting date.
During the three months ended March 31, 2013, there were no changes to the valuation techniques that had, or are expected to have, a material impact on its consolidated financial position or results of operations.
209
Level 1, 2 and 3 Valuation Techniques
Financial instruments are considered Level 1 when the valuation is based on quoted prices in active markets for identical assets or liabilities. Level 2 financial instruments are valued using quoted prices for similar assets or liabilities, quoted prices in markets that are not active, or models using inputs that are observable or can be corroborated by observable market data for substantially the full term of the assets or liabilities. Financial instruments are considered Level 3 when their values are determined using pricing models, discounted cash flow methodologies or similar techniques, and at least one significant model assumption or input is unobservable and when determination of the fair value requires significant management judgment or estimation.
Trading Account Assets and Liabilities and Debt Securities
The fair values of trading account assets and liabilities are primarily based on actively traded markets where prices are based on either direct market quotes or observed transactions. The fair values of debt securities are generally based on quoted market prices or market prices for similar assets. Liquidity is a significant factor in the determination of the fair values of trading account assets and liabilities and debt securities. Market price quotes may not be readily available for some positions, or positions within a market sector where trading activity has slowed significantly or ceased. Some of these instruments are valued using a discounted cash flow model, which estimates the fair value of the securities using internal credit risk, interest rate and prepayment risk models that incorporate management's best estimate of current key assumptions such as default rates, loss severity and prepayment rates. Principal and interest cash flows are discounted using an observable discount rate for similar instruments with adjustments that management believes a market participant would consider in determining fair value for the specific security. Other instruments are valued using a net asset value approach which considers the value of the underlying securities. Underlying assets are valued using external pricing services, where available, or matrix pricing based on the vintages and ratings. Situations of illiquidity generally are triggered by the market's perception of credit uncertainty regarding a single company or a specific market sector. In these instances, fair value is determined based on limited available market information and other factors, principally from reviewing the issuer's financial statements and changes in credit ratings made by one or more rating agencies.
Derivative Assets and Liabilities
The fair values of derivative assets and liabilities traded in the OTC market are determined using quantitative models that utilize multiple market inputs including interest rates, prices and indices to generate continuous yield or pricing curves and volatility factors to value the position. The majority of market inputs are actively quoted and can be validated through external sources, including brokers, market transactions and third-party pricing services. When third-party pricing services are used, the methods and assumptions used are reviewed by the Corporation. Estimation risk is greater for derivative asset and liability positions that are either option-based or have longer maturity dates where observable market inputs are less readily available, or are unobservable, in which case, quantitative-based extrapolations of rate, price or index scenarios are used in determining fair values. The fair values of derivative assets and liabilities include adjustments for market liquidity, counterparty credit quality and other instrument-specific factors, where appropriate. In addition, the Corporation incorporates within its fair value measurements of OTC derivatives a valuation adjustment to reflect the credit risk associated with the net position. Positions are netted by counterparty, and fair value for net long exposures is adjusted for counterparty credit risk while the fair value for net short exposures is adjusted for the Corporation's own credit risk. An estimate of severity of loss is also used in the determination of fair value, primarily based on market data.
Loans and Loan Commitments
The fair values of loans and loan commitments are based on market prices, where available, or discounted cash flow analyses using market-based credit spreads of comparable debt instruments or credit derivatives of the specific borrower or comparable borrowers. Results of discounted cash flow calculations may be adjusted, as appropriate, to reflect other market conditions or the perceived credit risk of the borrower.
Mortgage Servicing Rights
The fair values of MSRs are determined using models that rely on estimates of prepayment rates, the resultant weighted-average lives of the MSRs and the option-adjusted spread (OAS) levels. For more information on MSRs, see Note 19 – Mortgage Servicing Rights.
Loans Held-for-sale
The fair values of LHFS are based on quoted market prices, where available, or are determined by discounting estimated cash flows using interest rates approximating the Corporation's current origination rates for similar loans adjusted to reflect the inherent credit risk.
210
Private Equity Investments
Private equity investments consist of direct investments and fund investments which are initially valued at their transaction price. Thereafter, the fair value of direct investments is based on an assessment of each individual investment using methodologies that include publicly-traded comparables derived by multiplying a key performance metric (e.g., earnings before interest, taxes, depreciation and amortization) of the portfolio company by the relevant valuation multiple observed for comparable companies, acquisition comparables, entry level multiples and discounted cash flow analyses, and are subject to appropriate discounts for lack of liquidity or marketability. After initial recognition, the fair value of fund investments is based on the Corporation's proportionate interest in the fund's capital as reported by the respective fund managers.
Securities Financing Agreements
The fair values of certain reverse repurchase agreements, repurchase agreements and securities borrowed transactions are determined using quantitative models, including discounted cash flow models that require the use of multiple market inputs including interest rates and spreads to generate continuous yield or pricing curves, and volatility factors. The majority of market inputs are actively quoted and can be validated through external sources, including brokers, market transactions and third-party pricing services.
Deposits and Short-term Borrowings
The fair values of deposits and short-term borrowings are determined using quantitative models, including discounted cash flow models that require the use of multiple market inputs including interest rates and spreads to generate continuous yield or pricing curves, and volatility factors. The majority of market inputs are actively quoted and can be validated through external sources, including brokers, market transactions and third-party pricing services. The Corporation considers the impact of its own credit spreads in the valuation of these liabilities. The credit risk is determined by reference to observable credit spreads in the secondary cash market.
Long-term Debt
The Corporation issues structured liabilities that have coupons or repayment terms linked to the performance of debt or equity securities, indices, currencies or commodities. The fair values of these structured liabilities are estimated using quantitative models for the combined derivative and debt portions of the notes. These models incorporate observable and, in some instances, unobservable inputs including security prices, interest rate yield curves, option volatility, currency, commodity or equity rates and correlations between these inputs. The Corporation also considers the impact of its own credit spreads in determining the discount rate used to value these liabilities. The credit spread is determined by reference to observable spreads in the secondary bond market.
Asset-backed Secured Financings
The fair values of asset-backed secured financings are based on external broker bids, where available, or are determined by discounting estimated cash flows using interest rates approximating the Corporation's current origination rates for similar loans adjusted to reflect the inherent credit risk.
211
Recurring Fair Value |
Assets and liabilities carried at fair value on a recurring basis at March 31, 2013 and December 31, 2012, including financial instruments which the Corporation accounts for under the fair value option, are summarized in the following tables.
March 31, 2013 |
|||||||||||||||||||
Fair Value Measurements |
|||||||||||||||||||
(Dollars in millions) |
Level 1 (1)
|
Level 2 (1)
|
Level 3 |
Netting
Adjustments (2)
|
Assets/Liabilities
at Fair Value
|
||||||||||||||
Assets |
|||||||||||||||||||
Federal funds sold and securities borrowed or purchased under agreements to resell |
$ |
— |
$ |
94,673 |
$ |
— |
$ |
— |
$ |
94,673 |
|||||||||
Trading account assets: |
|||||||||||||||||||
U.S. government and agency securities |
47,957 |
24,921 |
— |
— |
72,878 |
||||||||||||||
Corporate securities, trading loans and other |
1,702 |
33,874 |
3,607 |
— |
39,183 |
||||||||||||||
Equity securities |
31,398 |
13,968 |
497 |
— |
45,863 |
||||||||||||||
Non-U.S. sovereign debt |
33,681 |
14,536 |
417 |
— |
48,634 |
||||||||||||||
Mortgage trading loans and ABS |
— |
11,990 |
4,480 |
— |
16,470 |
||||||||||||||
Total trading account assets |
114,738 |
99,289 |
9,001 |
— |
223,028 |
||||||||||||||
Derivative assets (3)
|
5,078 |
1,201,709 |
8,011 |
(1,162,551 |
) |
52,247 |
|||||||||||||
AFS debt securities: |
|||||||||||||||||||
U.S. Treasury securities and agency securities |
14,639 |
2,800 |
— |
— |
17,439 |
||||||||||||||
Mortgage-backed securities: |
|||||||||||||||||||
Agency |
— |
174,268 |
— |
— |
174,268 |
||||||||||||||
Agency-collateralized mortgage obligations |
— |
34,761 |
— |
— |
34,761 |
||||||||||||||
Non-agency residential |
— |
8,877 |
— |
— |
8,877 |
||||||||||||||
Non-agency commercial |
— |
3,824 |
10 |
— |
3,834 |
||||||||||||||
Non-U.S. securities |
2,699 |
2,950 |
1 |
— |
5,650 |
||||||||||||||
Corporate/Agency bonds |
— |
1,289 |
96 |
— |
1,385 |
||||||||||||||
Other taxable securities |
20 |
6,989 |
4,045 |
— |
11,054 |
||||||||||||||
Tax-exempt securities |
— |
3,541 |
1,041 |
— |
4,582 |
||||||||||||||
Total AFS debt securities |
17,358 |
239,299 |
5,193 |
— |
261,850 |
||||||||||||||
Other debt securities carried at fair value: |
|||||||||||||||||||
U.S. Treasury securities and agency securities |
3,861 |
— |
— |
— |
3,861 |
||||||||||||||
Mortgage-backed securities: |
|||||||||||||||||||
Agency |
— |
29,178 |
— |
— |
29,178 |
||||||||||||||
Agency-collateralized mortgage obligations |
— |
958 |
— |
— |
958 |
||||||||||||||
Non-agency commercial |
— |
103 |
— |
— |
103 |
||||||||||||||
Non-U.S. securities |
8,872 |
310 |
— |
— |
9,182 |
||||||||||||||
Total other debt securities carried at fair value |
12,733 |
30,549 |
— |
— |
43,282 |
||||||||||||||
Loans and leases |
— |
6,457 |
2,363 |
— |
8,820 |
||||||||||||||
Mortgage servicing rights |
— |
— |
5,776 |
— |
5,776 |
||||||||||||||
Loans held-for-sale |
— |
11,482 |
2,405 |
— |
13,887 |
||||||||||||||
Other assets |
15,578 |
5,036 |
2,629 |
— |
23,243 |
||||||||||||||
Total assets |
$ |
165,485 |
$ |
1,688,494 |
$ |
35,378 |
$ |
(1,162,551 |
) |
$ |
726,806 |
||||||||
Liabilities |
|||||||||||||||||||
Interest-bearing deposits in U.S. offices |
$ |
— |
$ |
2,130 |
$ |
— |
$ |
— |
$ |
2,130 |
|||||||||
Federal funds purchased and securities loaned or sold under agreements to repurchase |
— |
47,842 |
— |
— |
47,842 |
||||||||||||||
Trading account liabilities: |
|||||||||||||||||||
U.S. government and agency securities |
25,292 |
472 |
— |
— |
25,764 |
||||||||||||||
Equity securities |
21,786 |
2,963 |
— |
— |
24,749 |
||||||||||||||
Non-U.S. sovereign debt |
27,945 |
1,432 |
— |
— |
29,377 |
||||||||||||||
Corporate securities and other |
574 |
10,025 |
58 |
— |
10,657 |
||||||||||||||
Total trading account liabilities |
75,597 |
14,892 |
58 |
— |
90,547 |
||||||||||||||
Derivative liabilities (3)
|
3,888 |
1,184,636 |
6,948 |
(1,147,647 |
) |
47,825 |
|||||||||||||
Short-term borrowings |
— |
3,168 |
— |
— |
3,168 |
||||||||||||||
Accrued expenses and other liabilities |
12,016 |
1,814 |
455 |
— |
14,285 |
||||||||||||||
Long-term debt |
— |
50,006 |
2,355 |
— |
52,361 |
||||||||||||||
Total liabilities |
$ |
91,501 |
$ |
1,304,488 |
$ |
9,816 |
$ |
(1,147,647 |
) |
$ |
258,158 |
||||||||
(1) |
During the three months ended March 31, 2013, $500 million of assets were transferred from Level 1 to Level 2 primarily due to a restriction that became effective for a private equity investment.
|
(2) |
Amounts represent the impact of legally enforceable master netting agreements and also cash collateral held or placed with the same counterparties. |
(3) |
For further disaggregation of derivative assets and liabilities, see Note 3 – Derivatives.
|
212
December 31, 2012 |
|||||||||||||||||||
Fair Value Measurements |
|||||||||||||||||||
(Dollars in millions) |
Level 1 (1)
|
Level 2 (1)
|
Level 3 |
Netting
Adjustments (2)
|
Assets/Liabilities
at Fair Value
|
||||||||||||||
Assets |
|||||||||||||||||||
Federal funds sold and securities borrowed or purchased under agreements to resell |
$ |
— |
$ |
98,670 |
$ |
— |
$ |
— |
$ |
98,670 |
|||||||||
Trading account assets: |
|||||||||||||||||||
U.S. government and agency securities |
57,655 |
29,319 |
— |
— |
86,974 |
||||||||||||||
Corporate securities, trading loans and other |
1,292 |
32,882 |
3,726 |
— |
37,900 |
||||||||||||||
Equity securities |
28,144 |
14,626 |
545 |
— |
43,315 |
||||||||||||||
Non-U.S. sovereign debt |
29,254 |
13,139 |
353 |
— |
42,746 |
||||||||||||||
Mortgage trading loans and ABS |
— |
11,905 |
4,935 |
— |
16,840 |
||||||||||||||
Total trading account assets |
116,345 |
101,871 |
9,559 |
— |
227,775 |
||||||||||||||
Derivative assets (3)
|
2,997 |
1,372,398 |
8,073 |
(1,329,971 |
) |
53,497 |
|||||||||||||
AFS debt securities: |
|||||||||||||||||||
U.S. Treasury securities and agency securities |
21,514 |
2,958 |
— |
— |
24,472 |
||||||||||||||
Mortgage-backed securities: |
|||||||||||||||||||
Agency |
— |
188,149 |
— |
— |
188,149 |
||||||||||||||
Agency-collateralized mortgage obligations |
— |
37,538 |
— |
— |
37,538 |
||||||||||||||
Non-agency residential |
— |
9,494 |
— |
— |
9,494 |
||||||||||||||
Non-agency commercial |
— |
3,914 |
10 |
— |
3,924 |
||||||||||||||
Non-U.S. securities |
2,637 |
2,981 |
— |
— |
5,618 |
||||||||||||||
Corporate/Agency bonds |
— |
1,358 |
92 |
— |
1,450 |
||||||||||||||
Other taxable securities |
20 |
8,180 |
3,928 |
— |
12,128 |
||||||||||||||
Tax-exempt securities |
— |
3,072 |
1,061 |
— |
4,133 |
||||||||||||||
Total AFS debt securities |
24,171 |
257,644 |
5,091 |
— |
286,906 |
||||||||||||||
Other debt securities carried at fair value: |
|||||||||||||||||||
U.S. Treasury securities and agency securities |
491 |
— |
— |
— |
491 |
||||||||||||||
Mortgage-backed securities: |
|||||||||||||||||||
Agency |
— |
13,073 |
— |
— |
13,073 |
||||||||||||||
Agency-collateralized mortgage obligations |
— |
929 |
— |
— |
929 |
||||||||||||||
Non-U.S. securities |
9,151 |
300 |
— |
— |
9,451 |
||||||||||||||
Total other debt securities carried at fair value |
9,642 |
14,302 |
— |
— |
23,944 |
||||||||||||||
Loans and leases |
— |
6,715 |
2,287 |
— |
9,002 |
||||||||||||||
Mortgage servicing rights |
— |
— |
5,716 |
— |
5,716 |
||||||||||||||
Loans held-for-sale |
— |
8,926 |
2,733 |
— |
11,659 |
||||||||||||||
Other assets |
18,535 |
4,826 |
3,129 |
— |
26,490 |
||||||||||||||
Total assets |
$ |
171,690 |
$ |
1,865,352 |
$ |
36,588 |
$ |
(1,329,971 |
) |
$ |
743,659 |
||||||||
Liabilities |
|||||||||||||||||||
Interest-bearing deposits in U.S. offices |
$ |
— |
$ |
2,262 |
$ |
— |
$ |
— |
$ |
2,262 |
|||||||||
Federal funds purchased and securities loaned or sold under agreements to repurchase |
— |
42,639 |
— |
— |
42,639 |
||||||||||||||
Trading account liabilities: |
|||||||||||||||||||
U.S. government and agency securities |
22,351 |
1,079 |
— |
— |
23,430 |
||||||||||||||
Equity securities |
19,852 |
2,640 |
— |
— |
22,492 |
||||||||||||||
Non-U.S. sovereign debt |
18,875 |
1,369 |
— |
— |
20,244 |
||||||||||||||
Corporate securities and other |
487 |
6,870 |
64 |
— |
7,421 |
||||||||||||||
Total trading account liabilities |
61,565 |
11,958 |
64 |
— |
73,587 |
||||||||||||||
Derivative liabilities (3)
|
2,859 |
1,355,309 |
6,605 |
(1,318,757 |
) |
46,016 |
|||||||||||||
Short-term borrowings |
— |
4,074 |
— |
— |
4,074 |
||||||||||||||
Accrued expenses and other liabilities |
15,457 |
1,122 |
15 |
— |
16,594 |
||||||||||||||
Long-term debt |
— |
46,860 |
2,301 |
— |
49,161 |
||||||||||||||
Total liabilities |
$ |
79,881 |
$ |
1,464,224 |
$ |
8,985 |
$ |
(1,318,757 |
) |
$ |
234,333 |
||||||||
(1) |
During 2012, $2.0 billion and $350 million of assets and liabilities were transferred from Level 1 to Level 2, and $785 million and $40 million of assets and liabilities were transferred from Level 2 to Level 1. Of the asset transfers from Level 1 to Level 2, $940 million was due to a restriction that became effective for a private equity investment during 2012, while $535 million of the transfers from Level 2 to Level 1 was due to the lapse of this restriction during 2012. The remaining transfers were the result of additional information associated with certain equities, derivative contracts and private equity investments.
|
(2) |
Amounts represent the impact of legally enforceable master netting agreements and also cash collateral held or placed with the same counterparties. |
(3) |
For further disaggregation of derivative assets and liabilities, see Note 3 – Derivatives.
|
213
The following tables present a reconciliation of all assets and liabilities measured at fair value on a recurring basis using significant unobservable inputs (Level 3) during the three months ended March 31, 2013 and 2012, including net realized and unrealized gains (losses) included in earnings and accumulated OCI.
Level 3 – Fair Value Measurements (1)
| ||||||||||||||||||||||||||||||
Three Months Ended March 31, 2013 |
||||||||||||||||||||||||||||||
Gross |
||||||||||||||||||||||||||||||
(Dollars in millions) |
Balance
January 1
2013
|
Gains
(Losses) in
Earnings
|
Gains
(Losses) in
OCI
|
Purchases |
Sales |
Issuances |
Settlements |
Gross
Transfers
into
Level 3
|
Gross
Transfers
out of
Level 3
|
Balance March 31 2013 |
||||||||||||||||||||
Trading account assets: |
||||||||||||||||||||||||||||||
Corporate securities, trading loans and other |
$ |
3,726 |
$ |
88 |
$ |
— |
$ |
805 |
$ |
(966 |
) |
$ |
— |
$ |
(140 |
) |
$ |
218 |
$ |
(124 |
) |
$ |
3,607 |
|||||||
Equity securities |
545 |
42 |
— |
29 |
(109 |
) |
— |
— |
8 |
(18 |
) |
497 |
||||||||||||||||||
Non-U.S. sovereign debt |
353 |
51 |
— |
15 |
(1 |
) |
— |
— |
— |
(1 |
) |
417 |
||||||||||||||||||
Mortgage trading loans and ABS |
4,935 |
162 |
— |
653 |
(643 |
) |
— |
(631 |
) |
5 |
(1 |
) |
4,480 |
|||||||||||||||||
Total trading account assets |
9,559 |
343 |
— |
1,502 |
(1,719 |
) |
— |
(771 |
) |
231 |
(144 |
) |
9,001 |
|||||||||||||||||
Net derivative assets (2)
|
1,468 |
293 |
— |
179 |
(466 |
) |
— |
(660 |
) |
52 |
197 |
1,063 |
||||||||||||||||||
AFS debt securities: |
||||||||||||||||||||||||||||||
Non-agency commercial MBS |
10 |
— |
— |
— |
— |
— |
— |
— |
— |
10 |
||||||||||||||||||||
Non-U.S. securities |
— |
— |
— |
1 |
— |
— |
— |
— |
— |
1 |
||||||||||||||||||||
Corporate/Agency bonds |
92 |
— |
4 |
— |
— |
— |
— |
— |
— |
96 |
||||||||||||||||||||
Other taxable securities |
3,928 |
— |
2 |
243 |
— |
— |
(128 |
) |
— |
— |
4,045 |
|||||||||||||||||||
Tax-exempt securities |
1,061 |
1 |
3 |
— |
— |
— |
(24 |
) |
— |
— |
1,041 |
|||||||||||||||||||
Total AFS debt securities |
5,091 |
1 |
9 |
244 |
— |
— |
(152 |
) |
— |
— |
5,193 |
|||||||||||||||||||
Loans and leases (3, 4)
|
2,287 |
51 |
— |
71 |
— |
5 |
(41 |
) |
— |
(10 |
) |
2,363 |
||||||||||||||||||
Mortgage servicing rights (4)
|
5,716 |
434 |
— |
— |
(183 |
) |
123 |
(314 |
) |
— |
— |
5,776 |
||||||||||||||||||
Loans held-for-sale (3)
|
2,733 |
(39 |
) |
— |
— |
(210 |
) |
— |
(101 |
) |
22 |
— |
2,405 |
|||||||||||||||||
Other assets (5)
|
3,129 |
(448 |
) |
— |
17 |
(27 |
) |
— |
(42 |
) |
— |
— |
2,629 |
|||||||||||||||||
Trading account liabilities – Corporate securities and other |
(64 |
) |
— |
— |
7 |
(14 |
) |
— |
— |
(8 |
) |
21 |
(58 |
) |
||||||||||||||||
Accrued expenses and other liabilities (3)
|
(15 |
) |
29 |
— |
— |
— |
(586 |
) |
116 |
— |
1 |
(455 |
) |
|||||||||||||||||
Long-term debt (3)
|
(2,301 |
) |
11 |
— |
89 |
(4 |
) |
(36 |
) |
60 |
(381 |
) |
207 |
(2,355 |
) |
|||||||||||||||
(1) |
Assets (liabilities). For assets, increase / (decrease) to Level 3 and for liabilities, (increase) / decrease to Level 3. |
(2) |
Net derivatives include derivative assets of $8.0 billion and derivative liabilities of $6.9 billion.
|
(3) |
Amounts represent instruments that are accounted for under the fair value option. |
(4) |
Issuances represent loan originations and mortgage servicing rights retained following securitizations or whole loan sales. |
(5) |
Other assets is primarily comprised of net monoline exposure to a single counterparty and private equity investments. |
During the three months ended March 31, 2013, the transfers into Level 3 included $231 million of trading account assets and $381 million of long-term debt. Transfers into Level 3 for trading account assets were primarily the result of decreased market liquidity for certain corporate loans and securities. Transfers into Level 3 for long-term debt were primarily due to changes in the impact of unobservable inputs on the value of certain structured liabilities. Transfers occur on a regular basis for these long-term debt instruments due to changes in the impact of unobservable inputs on the value of the embedded derivative in relation to the instrument as a whole.
During the three months ended March 31, 2013, the transfers out of Level 3 included $144 million of trading account assets, $197 million of net derivative assets and $207 million of long-term debt. Transfers out of Level 3 for trading account assets primarily related to increased market liquidity for certain corporate loans and securities. Transfers out of Level 3 for net derivative assets primarily related to increased price observability (i.e., market comparables for the referenced instruments) for certain options. Transfers out of Level 3 for long-term debt were primarily due to changes in the impact of unobservable inputs on the value of certain structured liabilities.
214
Level 3 – Fair Value Measurements (1)
| ||||||||||||||||||||||||||||||
Three Months Ended March 31, 2012 |
||||||||||||||||||||||||||||||
Gross |
||||||||||||||||||||||||||||||
(Dollars in millions) |
Balance
January 1
2012
|
Gains
(Losses) in
Earnings
|
Gains
(Losses) in
OCI
|
Purchases |
Sales |
Issuances |
Settlements |
Gross
Transfers
into
Level 3
|
Gross
Transfers
out of
Level 3
|
Balance March 31 2012 |
||||||||||||||||||||
Trading account assets: |
||||||||||||||||||||||||||||||
Corporate securities, trading loans and other |
$ |
6,880 |
$ |
93 |
$ |
— |
$ |
675 |
$ |
(1,065 |
) |
$ |
— |
$ |
(189 |
) |
$ |
59 |
$ |
(452 |
) |
$ |
6,001 |
|||||||
Equity securities |
544 |
15 |
— |
79 |
(109 |
) |
— |
(10 |
) |
8 |
(2 |
) |
525 |
|||||||||||||||||
Non-U.S. sovereign debt |
342 |
24 |
— |
273 |
(81 |
) |
— |
— |
— |
(12 |
) |
546 |
||||||||||||||||||
Mortgage trading loans and ABS |
3,689 |
99 |
— |
184 |
(455 |
) |
— |
(89 |
) |
742 |
(158 |
) |
4,012 |
|||||||||||||||||
Total trading account assets |
11,455 |
231 |
— |
1,211 |
(1,710 |
) |
— |
(288 |
) |
809 |
(624 |
) |
11,084 |
|||||||||||||||||
Net derivative assets (2)
|
5,866 |
(837 |
) |
— |
359 |
(321 |
) |
— |
(634 |
) |
106 |
(352 |
) |
4,187 |
||||||||||||||||
AFS debt securities: |
||||||||||||||||||||||||||||||
Mortgage-backed securities: |
||||||||||||||||||||||||||||||
Agency |
37 |
— |
— |
— |
— |
— |
(4 |
) |
— |
— |
33 |
|||||||||||||||||||
Non-agency residential |
860 |
(69 |
) |
19 |
— |
(293 |
) |
— |
— |
— |
(488 |
) |
29 |
|||||||||||||||||
Non-agency commercial |
40 |
— |
— |
— |
— |
— |
(2 |
) |
— |
— |
38 |
|||||||||||||||||||
Corporate/Agency bonds |
162 |
(2 |
) |
— |
(2 |
) |
— |
— |
— |
— |
(27 |
) |
131 |
|||||||||||||||||
Other taxable securities |
4,265 |
7 |
17 |
362 |
— |
— |
(418 |
) |
— |
(58 |
) |
4,175 |
||||||||||||||||||
Tax-exempt securities |
2,648 |
26 |
18 |
— |
(35 |
) |
— |
(762 |
) |
— |
— |
1,895 |
||||||||||||||||||
Total AFS debt securities |
8,012 |
(38 |
) |
54 |
360 |
(328 |
) |
— |
(1,186 |
) |
— |
(573 |
) |
6,301 |
||||||||||||||||
Loans and leases (3, 4)
|
2,744 |
164 |
— |
— |
— |
— |
(117 |
) |
— |
(9 |
) |
2,782 |
||||||||||||||||||
Mortgage servicing rights (4)
|
7,378 |
655 |
— |
— |
— |
77 |
(521 |
) |
— |
— |
7,589 |
|||||||||||||||||||
Loans held-for-sale (3)
|
3,387 |
169 |
— |
4 |
— |
— |
(97 |
) |
31 |
(632 |
) |
2,862 |
||||||||||||||||||
Other assets (5)
|
4,235 |
(32 |
) |
— |
43 |
(581 |
) |
— |
(167 |
) |
— |
(11 |
) |
3,487 |
||||||||||||||||
Trading account liabilities – Corporate securities and other |
(114 |
) |
— |
— |
48 |
(27 |
) |
— |
— |
(65 |
) |
34 |
(124 |
) |
||||||||||||||||
Accrued expenses and other liabilities (3)
|
(14 |
) |
3 |
— |
5 |
— |
— |
— |
— |
3 |
(3 |
) |
||||||||||||||||||
Long-term debt (3)
|
(2,943 |
) |
(241 |
) |
— |
76 |
(33 |
) |
(65 |
) |
433 |
(532 |
) |
805 |
(2,500 |
) |
||||||||||||||
(1) |
Assets (liabilities). For assets, increase / (decrease) to Level 3 and for liabilities, (increase) / decrease to Level 3. |
(2) |
Net derivatives include derivative assets of $11.3 billion and derivative liabilities of $7.1 billion.
|
(3) |
Amounts represent instruments that are accounted for under the fair value option. |
(4) |
Issuances represent loan originations and mortgage servicing rights retained following securitizations or whole loan sales. |
(5) |
Other assets is primarily comprised of net monoline exposure to a single counterparty and private equity investments. |
During the three months ended March 31, 2012, the transfers into Level 3 included $809 million of trading account assets, $106 million of net derivative assets and $532 million of long-term debt. Transfers into Level 3 for trading account assets were primarily the result of updated information related to certain CLOs. Transfers into Level 3 for net derivative assets primarily related to decreased market activity (i.e., executed trades) for certain structured rate derivatives. Transfers into Level 3 for long-term debt were primarily due to changes in the impact of unobservable inputs on the value of certain structured liabilities. Transfers occur on a regular basis for these long-term debt instruments due to changes in the impact of unobservable inputs on the value of the embedded derivative in relation to the instrument as a whole.
During the three months ended March 31, 2012, the transfers out of Level 3 included $624 million of trading account assets, $352 million of net derivative assets, $573 million of AFS debt securities, $632 million of LHFS and $805 million of long-term debt. Transfers out of Level 3 for trading account assets primarily related to increased market liquidity for certain corporate and commercial real estate loans. Transfers out of Level 3 for net derivative assets primarily related to increased price observability (i.e., market comparables for the referenced instruments) for certain total return swaps and foreign exchange swaps. Transfers out of Level 3 for AFS debt securities primarily related to increased price observability for certain non-agency RMBS. Transfers out of Level 3 for LHFS primarily related to increased observable inputs, primarily liquid comparables. Transfers out of Level 3 for long-term debt were primarily due to changes in the impact of unobservable inputs on the value of certain structured liabilities.
215
The following tables summarize gains (losses) due to changes in fair value, including both realized and unrealized gains (losses), recorded in earnings for Level 3 assets and liabilities during the three months ended March 31, 2013 and 2012. These amounts include gains (losses) on loans, LHFS, loan commitments and structured liabilities that are accounted for under the fair value option.
Level 3 – Total Realized and Unrealized Gains (Losses) Included in Earnings | |||||||||||||||||||
Three Months Ended March 31, 2013 |
|||||||||||||||||||
(Dollars in millions) |
Equity
Investment
Income
(Loss)
|
Trading
Account
Profits
(Losses)
|
Mortgage
Banking
Income
(Loss) (1)
|
Other
Income
(Loss)
|
Total |
||||||||||||||
Trading account assets: |
|||||||||||||||||||
Corporate securities, trading loans and other |
$ |
— |
$ |
88 |
$ |
— |
$ |
— |
$ |
88 |
|||||||||
Equity securities |
— |
42 |
— |
— |
42 |
||||||||||||||
Non-U.S. sovereign debt |
— |
51 |
— |
— |
51 |
||||||||||||||
Mortgage trading loans and ABS |
— |
162 |
— |
— |
162 |
||||||||||||||
Total trading account assets |
— |
343 |
— |
— |
343 |
||||||||||||||
Net derivative assets |
— |
(114 |
) |
407 |
— |
293 |
|||||||||||||
AFS debt securities – Tax-exempt securities |
— |
— |
— |
1 |
1 |
||||||||||||||
Loans and leases (2)
|
— |
— |
— |
51 |
51 |
||||||||||||||
Mortgage servicing rights |
— |
— |
434 |
— |
434 |
||||||||||||||
Loans held-for-sale (2)
|
— |
— |
4 |
(43 |
) |
(39 |
) |
||||||||||||
Other assets |
2 |
— |
(3 |
) |
(447 |
) |
(448 |
) |
|||||||||||
Accrued expenses and other liabilities (2)
|
— |
— |
29 |
— |
29 |
||||||||||||||
Long-term debt (2)
|
— |
22 |
— |
(11 |
) |
11 |
|||||||||||||
Total |
$ |
2 |
$ |
251 |
$ |
871 |
$ |
(449 |
) |
$ |
675 |
||||||||
Three Months Ended March 31, 2012 |
|||||||||||||||||||
Trading account assets: |
|||||||||||||||||||
Corporate securities, trading loans and other |
$ |
— |
$ |
93 |
$ |
— |
$ |
— |
$ |
93 |
|||||||||
Equity securities |
— |
15 |
— |
— |
15 |
||||||||||||||
Non-U.S. sovereign debt |
— |
24 |
— |
— |
24 |
||||||||||||||
Mortgage trading loans and ABS |
— |
99 |
— |
— |
99 |
||||||||||||||
Total trading account assets |
— |
231 |
— |
— |
231 |
||||||||||||||
Net derivative assets |
— |
(1,373 |
) |
536 |
— |
(837 |
) |
||||||||||||
AFS debt securities: |
|||||||||||||||||||
Non-agency residential MBS |
— |
— |
— |
(69 |
) |
(69 |
) |
||||||||||||
Corporate/Agency bonds |
— |
— |
— |
(2 |
) |
(2 |
) |
||||||||||||
Other taxable securities |
— |
— |
— |
7 |
7 |
||||||||||||||
Tax-exempt securities |
— |
— |
— |
26 |
26 |
||||||||||||||
Total AFS debt securities |
— |
— |
— |
(38 |
) |
(38 |
) |
||||||||||||
Loans and leases (2)
|
— |
— |
— |
164 |
164 |
||||||||||||||
Mortgage servicing rights |
— |
— |
655 |
— |
655 |
||||||||||||||
Loans held-for-sale (2)
|
— |
— |
90 |
79 |
169 |
||||||||||||||
Other assets |
10 |
— |
(8 |
) |
(34 |
) |
(32 |
) |
|||||||||||
Accrued expenses and other liabilities (2)
|
— |
— |
— |
3 |
3 |
||||||||||||||
Long-term debt (2)
|
— |
(139 |
) |
— |
(102 |
) |
(241 |
) |
|||||||||||
Total |
$ |
10 |
$ |
(1,281 |
) |
$ |
1,273 |
$ |
72 |
$ |
74 |
||||||||
(1) |
Mortgage banking income does not reflect the impact of Level 1 and Level 2 hedges on MSRs. |
(2) |
Amounts represent instruments that are accounted for under the fair value option. |
216
The following tables summarize changes in unrealized gains (losses) recorded in earnings during the three months ended March 31, 2013 and 2012 for Level 3 assets and liabilities that were still held at March 31, 2013 and 2012. These amounts include changes in fair value on loans, LHFS, loan commitments and structured liabilities that are accounted for under the fair value option.
Level 3 – Changes in Unrealized Gains (Losses) Relating to Assets and Liabilities Still Held at Reporting Date | |||||||||||||||||||
Three Months Ended March 31, 2013 |
|||||||||||||||||||
(Dollars in millions) |
Equity
Investment
Income
(Loss)
|
Trading
Account
Profits
(Losses)
|
Mortgage
Banking
Income
(Loss) (1)
|
Other
Income
(Loss)
|
Total |
||||||||||||||
Trading account assets: |
|||||||||||||||||||
Corporate securities, trading loans and other |
$ |
— |
$ |
48 |
$ |
— |
$ |
— |
$ |
48 |
|||||||||
Equity securities |
— |
33 |
— |
— |
33 |
||||||||||||||
Non-U.S. sovereign debt |
— |
51 |
— |
— |
51 |
||||||||||||||
Mortgage trading loans and ABS |
— |
89 |
— |
— |
89 |
||||||||||||||
Total trading account assets |
— |
221 |
— |
— |
221 |
||||||||||||||
Net derivative assets |
— |
(169 |
) |
246 |
— |
77 |
|||||||||||||
Loans and leases (2)
|
— |
— |
— |
43 |
43 |
||||||||||||||
Mortgage servicing rights |
— |
— |
336 |
— |
336 |
||||||||||||||
Loans held-for-sale (2)
|
— |
— |
10 |
(52 |
) |
(42 |
) |
||||||||||||
Other assets |
(15 |
) |
— |
12 |
(447 |
) |
(450 |
) |
|||||||||||
Accrued expenses and other liabilities (2)
|
— |
— |
25 |
— |
25 |
||||||||||||||
Long-term debt (2)
|
— |
21 |
— |
(11 |
) |
10 |
|||||||||||||
Total |
$ |
(15 |
) |
$ |
73 |
$ |
629 |
$ |
(467 |
) |
$ |
220 |
|||||||
Three Months Ended March 31, 2012 |
|||||||||||||||||||
Trading account assets: |
|||||||||||||||||||
Corporate securities, trading loans and other |
$ |
— |
$ |
56 |
$ |
— |
$ |
— |
$ |
56 |
|||||||||
Equity securities |
— |
11 |
— |
— |
11 |
||||||||||||||
Non-U.S. sovereign debt |
— |
13 |
— |
— |
13 |
||||||||||||||
Mortgage trading loans and ABS |
— |
53 |
— |
— |
53 |
||||||||||||||
Total trading account assets |
— |
133 |
— |
— |
133 |
||||||||||||||
Net derivative assets |
— |
(1,314 |
) |
300 |
— |
(1,014 |
) |
||||||||||||
Loans and leases (2)
|
— |
— |
— |
163 |
163 |
||||||||||||||
Mortgage servicing rights |
— |
— |
470 |
— |
470 |
||||||||||||||
Loans held-for-sale (2)
|
— |
— |
51 |
23 |
74 |
||||||||||||||
Other assets |
(19 |
) |
— |
6 |
(34 |
) |
(47 |
) |
|||||||||||
Accrued expenses and other liabilities (2)
|
— |
— |
— |
3 |
3 |
||||||||||||||
Long-term debt (2)
|
— |
(129 |
) |
— |
(102 |
) |
(231 |
) |
|||||||||||
Total |
$ |
(19 |
) |
$ |
(1,310 |
) |
$ |
827 |
$ |
53 |
$ |
(449 |
) |
||||||
(1) |
Mortgage banking income does not reflect the impact of Level 1 and Level 2 hedges on MSRs. |
(2) |
Amounts represent instruments that are accounted for under the fair value option. |
217
The following tables present information about significant unobservable inputs related to the Corporation's material categories of Level 3 financial assets and liabilities at March 31, 2013 and December 31, 2012.
Quantitative Information about Level 3 Fair Value Measurements at March 31, 2013 |
||||||||
(Dollars in millions) |
Inputs |
|||||||
Financial Instrument |
Fair Value |
Valuation Technique |
Significant Unobservable
Inputs
|
Ranges of Inputs |
Weighted Average |
|||
Loans and Securities (1)
|
||||||||
Instruments backed by residential real estate assets |
$ |
3,676 |
Discounted cash flow, Market comparables |
Yield |
0% to 25% |
6 |
% |
|
Trading account assets – Mortgage trading loans and ABS |
365 |
Prepayment speed |
1% to 35% CPR |
10 |
% |
|||
Loans and leases |
906 |
Default rate |
0% to 35% CDR |
5 |
% |
|||
Loans held-for-sale |
2,405 |
Loss severity |
4% to 85% |
41 |
% |
|||
Instruments backed by commercial real estate assets |
$ |
1,454 |
Discounted cash flow |
Yield |
5% |
n/a |
||
Other assets |
1,454 |
Loss severity |
51% to 100% |
80 |
% |
|||
Commercial loans, debt securities and other |
$ |
11,257 |
Discounted cash flow, Market comparables |
Yield |
0% to 33% |
4 |
% |
|
Trading account assets – Corporate securities, trading loans and other |
2,471 |
Enterprise value/EBITDA multiple |
1x to 17x |
6 |
x |
|||
Trading account assets – Mortgage trading loans and ABS |
4,115 |
Prepayment speed |
5% to 40% |
19 |
% |
|||
AFS debt securities – Other taxable securities |
3,214 |
Default rate |
1% to 5% |
4 |
% |
|||
Loans and leases |
1,457 |
Loss severity |
25% to 40% |
36 |
% |
|||
Auction rate securities |
$ |
3,008 |
Discounted cash flow, Market comparables |
Discount rate |
4% to 5% |
5 |
% |
|
Trading account assets – Corporate securities, trading loans and other |
1,136 |
Projected tender price/Re-financing level |
50% to 100% |
93 |
% |
|||
AFS debt securities – Other taxable securities |
831 |
|||||||
AFS debt securities – Tax-exempt securities |
1,041 |
|||||||
Structured liabilities |
||||||||
Long-term debt |
$ |
(2,355 |
) |
Industry standard derivative pricing (2)
|
Equity correlation |
30% to 97% |
73 |
% |
Long-dated volatilities |
15% to 115% |
26 |
% |
|||||
Net derivatives assets |
||||||||
Credit derivatives |
$ |
1,839 |
Discounted cash flow, Stochastic recovery correlation model |
Yield |
3% to 30% |
16 |
% |
|
Credit spreads |
37 bps to 346 bps |
200 bps |
||||||
Upfront points |
12 points to 100 points |
71 points |
||||||
Spread to index |
-1,657 bps to 1,988 bps |
400 bps |
||||||
Credit correlation |
21% to 75% |
39 |
% |
|||||
Prepayment speed |
4% to 30% CPR |
9 |
% |
|||||
Default rate |
1% to 5% CDR |
3 |
% |
|||||
Loss severity |
27% to 50% |
37 |
% |
|||||
Equity derivatives |
$ |
(1,215 |
) |
Industry standard derivative pricing (2)
|
Equity correlation |
30% to 97% |
73 |
% |
Long-dated volatilities |
15% to 115% |
26 |
% |
|||||
Commodity derivatives |
$ |
(4 |
) |
Discounted cash flow |
Natural gas forward price |
$3/MMBtu to $12/MMBtu |
$7/MMBtu |
|
Interest rate derivatives |
$ |
443 |
Industry standard derivative pricing (3)
|
Correlation (IR/IR) |
19% to 99% |
69 |
% |
|
Correlation (FX/IR) |
-65% to 50% |
7 |
% |
|||||
Long-dated inflation rates |
2% to 3% |
2 |
% |
|||||
Long-dated inflation volatilities |
0% to 2% |
1 |
% |
|||||
Total net derivative assets |
$ |
1,063 |
||||||
(1) |
The categories are aggregated based upon product type which differs from financial statement classification. The following is a reconciliation to the line items in the table on page 214: Trading account assets – Corporate securities, trading loans and other of $3.6 billion, Trading account assets – Mortgage trading loans and ABS of $4.5 billion, AFS debt securities – Other taxable securities of $4.0 billion, AFS debt securities – Tax-exempt securities of $1.0 billion, Loans and leases of $2.4 billion, LHFS of $2.4 billion and Other assets of $1.5 billion.
|
(2) |
Includes models such as Monte Carlo simulation and Black-Scholes. |
(3) |
Includes models such as Monte Carlo simulation, Black-Scholes and other methods that model the joint dynamics of interest, inflation and foreign exchange rates. |
n/a = not applicable
CPR = Constant Prepayment Rate
CDR = Constant Default Rate
EBITDA = Earnings before interest, taxes, depreciation and amortization
MMBtu = Million British thermal units
IR = Interest Rate
FX = Foreign Exchange
218
Quantitative Information about Level 3 Fair Value Measurements for Loans, Securities and Structured Liabilities at December 31, 2012 |
||||||||
(Dollars in millions) |
Inputs |
|||||||
Financial Instrument |
Fair Value |
Valuation Technique |
Significant Unobservable
Inputs
|
Ranges of Inputs |
Weighted Average |
|||
Loans and Securities (1)
|
||||||||
Instruments backed by residential real estate assets |
$ |
4,478 |
Discounted cash flow, Market comparables |
Yield |
2% to 25% |
6 |
% |
|
Trading account assets – Mortgage trading loans and ABS |
459 |
Prepayment speed |
1% to 30% CPR |
10 |
% |
|||
Loans and leases |
1,286 |
Default rate |
0% to 44% CDR |
6 |
% |
|||
Loans held-for-sale |
2,733 |
Loss severity |
6% to 85% |
43 |
% |
|||
Instruments backed by commercial real estate assets |
$ |
1,910 |
Discounted cash flow |
Yield |
5% |
n/a |
||
Other assets |
1,910 |
Loss severity |
51% to 100% |
88 |
% |
|||
Commercial loans, debt securities and other |
$ |
10,778 |
Discounted cash flow, Market comparables |
Yield |
0% to 25% |
4 |
% |
|
Trading account assets – Corporate securities, trading loans and other |
2,289 |
Enterprise value/EBITDA multiple |
2x to 11x |
5x |
||||
Trading account assets – Mortgage trading loans and ABS |
4,476 |
Prepayment speed |
5% to 30% |
20 |
% |
|||
AFS debt securities – Other taxable securities |
3,012 |
Default rate |
1% to 5% |
4 |
% |
|||
Loans and leases |
1,001 |
Loss severity |
25% to 40% |
35 |
% |
|||
Auction rate securities |
$ |
3,414 |
Discounted cash flow, Market comparables |
Discount rate |
4% to 5% |
4 |
% |
|
Trading account assets – Corporate securities, trading loans and other |
1,437 |
Projected tender price/Re-financing level |
50% to 100% |
92 |
% |
|||
AFS debt securities – Other taxable securities |
916 |
|||||||
AFS debt securities – Tax-exempt securities |
1,061 |
|||||||
Structured liabilities |
||||||||
Long-term debt (2)
|
$ |
(2,301 |
) |
Industry standard derivative pricing (3)
|
Equity correlation |
30% to 97% |
n/m |
|
Long-dated volatilities |
20% to 70% |
n/m |
||||||
Quantitative Information about Level 3 Fair Value Measurements for Net Derivative Assets at December 31, 2012 | ||||||
(Dollars in millions) |
Inputs |
|||||
Financial Instrument |
Fair Value |
Valuation Technique |
Significant Unobservable
Inputs
|
Ranges of Inputs |
||
Net derivatives assets |
||||||
Credit derivatives |
$ |
2,327 |
Discounted cash flow, Stochastic recovery correlation model |
Yield |
2% to 25% |
|
Credit spreads |
58 bps to 615 bps |
|||||
Upfront points |
25 points to 99 points |
|||||
Spread to index |
-2,080 bps to 1,972 bps |
|||||
Credit correlation |
19% to 75% |
|||||
Prepayment speed |
3% to 30% CPR |
|||||
Default rate |
0% to 8% CDR |
|||||
Loss severity |
25% to 42% |
|||||
Equity derivatives |
$ |
(1,295 |
) |
Industry standard derivative pricing (3)
|
Equity correlation |
30% to 97% |
Long-dated volatilities |
20% to 70% |
|||||
Commodity derivatives |
$ |
(5 |
) |
Discounted cash flow |
Natural gas forward price |
$3/MMBtu to $12/MMBtu |
Interest rate derivatives |
$ |
441 |
Industry standard derivative pricing (4)
|
Correlation (IR/IR) |
15% to 99% |
|
Correlation (FX/IR) |
-65% to 50% |
|||||
Long-dated inflation rates |
2% to 3% |
|||||
Long-dated inflation volatilities |
0% to 1% |
|||||
Long-dated volatilities (FX) |
5% to 36% |
|||||
Long-dated swap rates |
8% to 10% |
|||||
Total net derivative assets |
$ |
1,468 |
||||
(1) |
The categories are aggregated based upon product type which differs from financial statement classification. The following is a reconciliation to the line items in the table on page 215: Trading account assets – Corporate securities, trading loans and other of $3.7 billion, Trading account assets – Mortgage trading loans and ABS of $4.9 billion, AFS debt securities – Other taxable securities of $3.9 billion, AFS debt securities – Tax-exempt securities of $1.1 billion, Loans and leases of $2.3 billion, LHFS of $2.7 billion and Other assets of $1.9 billion.
|
(2) |
For additional information on the ranges of inputs for equity correlation and long-dated volatilities, see the qualitative equity derivatives discussion on page 220.
|
(3) |
Includes models such as Monte Carlo simulation and Black-Scholes. |
(4) |
Includes models such as Monte Carlo simulation, Black-Scholes and other methods that model the joint dynamics of interest, inflation and foreign exchange rates. |
n/a = not applicable
n/m = not meaningful
CPR = Constant Prepayment Rate
CDR = Constant Default Rate
EBITDA = Earnings before interest, taxes, depreciation and amortization
MMBtu = Million British thermal units
IR = Interest Rate
FX = Foreign Exchange
219
In the tables above, instruments backed by residential and commercial real estate assets include RMBS, CMBS, whole loans, mortgage CDOs and net monoline exposure. Commercial loans, debt securities and other includes corporate CLOs and CDOs, commercial loans and bonds, and securities backed by non-real estate assets. Structured liabilities primarily includes equity-linked notes that are accounted for under the fair value option.
In addition to the instruments in the tables above, the Corporation held $1.2 billion of instruments at both March 31, 2013 and December 31, 2012 consisting primarily of certain direct private equity investments and private equity funds that were classified as Level 3 and reported within other assets. Valuations of direct private equity investments are based on the most recent company financial information. Inputs generally include market and acquisition comparables, entry level multiples, as well as other variables. The Corporation selects a valuation methodology (e.g., market comparables) for each investment and, in certain instances, multiple inputs are weighted to derive the most representative value. Discounts are applied as appropriate to consider the lack of liquidity and marketability versus publicly-traded companies. For private equity funds, fair value is determined using the net asset value as provided by the individual fund's general partner.
For information on the inputs and techniques used in the valuation of MSRs, see Note 19 – Mortgage Servicing Rights.
The Corporation uses multiple market approaches in valuing certain of its Level 3 financial instruments. For example, market comparables and discounted cash flows are used together. For a given product, such as corporate debt securities, market comparables may be used to estimate some of the unobservable inputs and then these inputs are incorporated into a discounted cash flow model. Therefore, the balances disclosed encompass both of these techniques.
The level of aggregation and diversity within the products disclosed in the tables result in certain ranges of inputs being wide and unevenly distributed across asset and liability categories. At December 31, 2012, weighted averages were disclosed for all loans and securities. At March 31, 2013, weighted averages are disclosed for all loans, securities, structured liabilities and net derivative assets.
For credit derivatives, the range of credit spreads represented positions with varying levels of default risk to the underlying instruments. The lower end of the credit spread range typically represented shorter-dated instruments and those with better perceived credit risk. The higher end of the range represented longer-dated instruments and those referencing debt issuances that were more likely to be impaired or nonperforming. At December 31, 2012, the majority of inputs were concentrated in the lower end of the range. Similarly, the spread to index could vary significantly based on the risk of the instrument. The spread will be positive for instruments that have a higher risk of default than the index (which is based on a weighted average of its components) and negative for instruments that have a lower risk of default than the index. At December 31, 2012, inputs were distributed evenly throughout the range for spread to index. In addition, for yield and credit correlation, the majority of the inputs were concentrated in the center of the range. Inputs were concentrated in the middle to lower end of the range for upfront points. The range for loss severity reflected exposures that were concentrated in the middle to upper end of the range while the ranges for prepayment speed and default rates reflected exposures that were concentrated in the lower end of the range.
For equity derivatives at December 31, 2012, including those embedded in long-term debt, the range for equity correlation represented exposure primarily concentrated toward the upper end of the range. The range for long-dated volatilities represented exposure primarily concentrated toward the lower end of the range.
For interest rate derivatives, the diversity in the portfolio was reflected in wide ranges of inputs because the variety of currencies and tenors of the transactions required the use of numerous foreign exchange and interest rate curves. Since foreign exchange and interest rate correlations were measured between curves and across the various tenors on the same curve, the range of potential values could include both negative and positive values. For the correlation (IR/IR) range, the exposure represented the valuation of interest rate correlations on less liquid pairings and was concentrated at the upper end of the range at December 31, 2012. For the correlation (FX/IR) range, the exposure was the sensitivity to a broad mix of interest rate and foreign exchange correlations and was distributed evenly throughout the range at December 31, 2012. For long-dated inflation rates and volatilities as well as long-dated volatilities (FX), the inputs were concentrated in the middle of the range.
Sensitivity of Fair Value Measurements to Changes in Unobservable Inputs
Loans and Securities
For instruments backed by residential real estate assets, commercial real estate assets, and commercial loans, debt securities and other, a significant increase in market yields, default rates or loss severities would result in a significantly lower fair value for long positions. Short positions would be impacted in a directionally opposite way. The impact of changes in prepayment speeds would have differing impacts depending on the seniority of the instrument and, in the case of CLOs, whether prepayments can be reinvested.
220
For closed-end auction rate securities (ARS), a significant increase in discount rates would result in a significantly lower fair value. For student loan and municipal ARS, a significant increase in projected tender price/refinancing levels would result in a significantly higher fair value.
Structured Liabilities and Derivatives
For credit derivatives, a significant increase in market yield, including spreads to indices, upfront points (i.e., a single upfront payment made by a protection buyer at inception), credit spreads, default rates or loss severities would result in a significantly lower fair value for protection sellers and higher fair value for protection buyers. The impact of changes in prepayment speeds would have differing impacts depending on the seniority of the instrument and, in the case of CLOs, whether prepayments can be reinvested.
Structured credit derivatives, which include tranched portfolio CDS and derivatives with derivative product company (DPC) and monoline counterparties, are impacted by credit correlation, including default and wrong-way correlation. Default correlation is a parameter that describes the degree of dependence among credit default rates within a credit portfolio that underlies a credit derivative instrument. The sensitivity of this input on the fair value varies depending on the level of subordination of the tranche. For senior tranches that are net purchases of protection, a significant increase in default correlation would result in a significantly higher fair value. Net short protection positions would be impacted in a directionally opposite way. Wrong-way correlation is a parameter that describes the probability that as exposure to a counterparty increases, the credit quality of the counterparty decreases. A significantly higher degree of wrong-way correlation between a DPC counterparty and underlying derivative exposure would result in a significantly lower fair value.
For equity derivatives, equity-linked long-term debt (structured liabilities) and interest rate derivatives, a significant change in long-dated rates and volatilities and correlation inputs (e.g., the degree of correlation between an equity security and an index, between two different interest rates, or between interest rates and foreign exchange rates) would result in a significant impact to the fair value; however, the magnitude and direction of the impact depends on whether the Corporation is long or short the exposure.
Nonrecurring Fair Value |
The Corporation holds certain assets that are measured at fair value, but only in certain situations (for example, impairment) and these measurements are referred to herein as nonrecurring. These assets primarily include LHFS, certain loans and leases, and foreclosed properties. The amounts below represent only balances measured at fair value during the three months ended March 31, 2013 and 2012, and still held as of the reporting date.
Assets Measured at Fair Value on a Nonrecurring Basis | |||||||||||
March 31, 2013 |
Three Months Ended March 31, 2013 |
||||||||||
(Dollars in millions) |
Level 2 |
Level 3 |
Gains (Losses) |
||||||||
Assets |
|||||||||||
Loans held-for-sale |
$ |
3,902 |
$ |
795 |
$ |
(96 |
) |
||||
Loans and leases (1)
|
20 |
3,619 |
(640 |
) |
|||||||
Foreclosed properties (2)
|
48 |
1,981 |
(19 |
) |
|||||||
Other assets |
65 |
12 |
(6 |
) |
|||||||
March 31, 2012 |
Three Months Ended March 31, 2012 |
||||||||||
(Dollars in millions) |
Level 2 |
Level 3 |
Gains (Losses) |
||||||||
Assets |
|||||||||||
Loans held-for-sale |
$ |
3,465 |
$ |
857 |
$ |
60 |
|||||
Loans and leases (1)
|
21 |
5,813 |
(1,497 |
) |
|||||||
Foreclosed properties (2)
|
— |
2,149 |
(67 |
) |
|||||||
Other assets |
— |
14 |
— |
||||||||
(1) |
Losses represent charge-offs on real estate-secured loans. |
(2) |
Amounts are included in other assets on the Consolidated Balance Sheet and represent fair value and related losses on foreclosed properties that were written down subsequent to their initial classification as foreclosed properties. |
221
The table below presents information about significant unobservable inputs related to the Corporation's nonrecurring Level 3 financial assets and liabilities at March 31, 2013 and December 31, 2012.
Quantitative Information about Nonrecurring Level 3 Fair Value Measurements at March 31, 2013 |
||||||||
(Dollars in millions) |
Inputs |
|||||||
Financial Instrument |
Fair Value |
Valuation Technique |
Significant Unobservable
Inputs
|
Ranges of Inputs |
Weighted Average |
|||
Instruments backed by residential real estate assets |
$ |
4,312 |
Discounted cash flow, Market comparables |
Yield |
4% to 5% |
4 |
% |
|
Loans held-for-sale |
693 |
Prepayment speed |
3% to 26% |
14 |
% |
|||
Loans and leases |
3,619 |
Default rate |
0% to 51% |
7 |
% |
|||
Loss severity |
5% to 63% |
44 |
% |
|||||
OREO discount |
0% to 28% |
15 |
% |
|||||
Cost to sell |
8% |
n/a |
||||||
Instruments backed by commercial real estate assets |
$ |
102 |
Discounted cash flow |
Yield |
5% to 11% |
9 |
% |
|
Loans held-for-sale |
102 |
Loss severity |
31% to 93% |
81 |
% |
|||
Quantitative Information about Nonrecurring Level 3 Fair Value Measurements at December 31, 2012 |
||||||||
Instruments backed by residential real estate assets |
$ |
9,932 |
Discounted cash flow, Market comparables |
Yield |
3% to 5% |
3 |
% |
|
Loans held-for-sale |
748 |
Prepayment speed |
3% to 30% |
15 |
% |
|||
Loans and leases |
9,184 |
Default rate |
0% to 55% |
7 |
% |
|||
Loss severity |
6% to 66% |
48 |
% |
|||||
OREO discount |
0% to 28% |
15 |
% |
|||||
Cost to sell |
8% |
n/a |
||||||
Instruments backed by commercial real estate assets |
$ |
388 |
Discounted cash flow |
Yield |
4% to 13% |
6 |
% |
|
Loans held-for-sale |
388 |
Loss severity |
24% to 88% |
53 |
% |
|||
n/a = not applicable
Instruments backed by residential real estate assets represent residential mortgages where the loan has been written down to the fair value of the underlying collateral or, in the case of LHFS, are carried at the lower of cost or fair value.
In addition to the instruments disclosed in the table above, the Corporation holds foreclosed residential properties where the fair value is based on unadjusted third-party appraisals or broker price opinions. Appraisals are conducted every 90 days. Factors considered in determining the fair value include geographic sales trends, the value of comparable surrounding properties as well as the condition of the property.
222
NOTE 17 – Fair Value Option |
The Corporation elects to account for certain financial instruments under the fair value option. For additional information on the primary financial instruments for which the fair value option elections have been made, see Note 22 – Fair Value Option to the Consolidated Financial Statements of the Corporation's 2012 Annual Report on Form 10-K.
The table below provides information about the fair value carrying amount and the contractual principal outstanding of assets and liabilities accounted for under the fair value option at March 31, 2013 and December 31, 2012.
Fair Value Option Elections | |||||||||||||||||||||||
March 31, 2013 |
December 31, 2012 |
||||||||||||||||||||||
(Dollars in millions) |
Fair Value
Carrying
Amount
|
Contractual
Principal
Outstanding
|
Fair Value
Carrying
Amount
Less Unpaid
Principal
|
Fair Value
Carrying
Amount
|
Contractual
Principal
Outstanding
|
Fair Value
Carrying
Amount
Less Unpaid
Principal
|
|||||||||||||||||
Loans reported as trading account assets (1)
|
$ |
2,182 |
$ |
3,490 |
$ |
(1,308 |
) |
$ |
1,663 |
$ |
2,879 |
$ |
(1,216 |
) |
|||||||||
Trading inventory – other |
2,451 |
n/a |
n/a |
2,170 |
n/a |
n/a |
|||||||||||||||||
Consumer and commercial loans |
8,820 |
9,184 |
(364 |
) |
9,002 |
9,576 |
(574 |
) |
|||||||||||||||
Loans held-for-sale |
13,887 |
14,575 |
(688 |
) |
11,659 |
12,676 |
(1,017 |
) |
|||||||||||||||
Securities financing agreements |
142,515 |
142,059 |
456 |
141,309 |
140,791 |
518 |
|||||||||||||||||
Other assets |
449 |
270 |
179 |
453 |
270 |
183 |
|||||||||||||||||
Long-term deposits |
2,130 |
1,931 |
199 |
2,262 |
2,046 |
216 |
|||||||||||||||||
Asset-backed secured financings |
767 |
1,152 |
(385 |
) |
741 |
1,176 |
(435 |
) |
|||||||||||||||
Unfunded loan commitments |
468 |
n/a |
n/a |
528 |
n/a |
n/a |
|||||||||||||||||
Short-term borrowings |
2,401 |
2,401 |
— |
3,333 |
3,333 |
— |
|||||||||||||||||
Accrued expenses and other liabilities |
443 |
443 |
— |
— |
— |
— |
|||||||||||||||||
Long-term debt (2)
|
52,361 |
52,535 |
(174 |
) |
49,161 |
50,792 |
(1,631 |
) |
|||||||||||||||
(1) |
A significant portion of the loans reported as trading account assets are distressed loans which trade and were purchased at a deep discount to par, and the remainder are loans with a fair value near contractual principal outstanding. |
(2) |
The majority of the difference between the fair value carrying amount and contractual principal outstanding at March 31, 2013 and December 31, 2012 relates to the impact of the Corporation's credit spreads as well as the fair value of the embedded derivative, where applicable.
|
n/a = not applicable
223
The table below provides information about where changes in the fair value of assets and liabilities accounted for under the fair value option are included in the Consolidated Statement of Income for the three months ended March 31, 2013 and 2012. Of the changes in fair value for LHFS and loans and loan commitments, $106 million and $128 million were attributable to changes in borrower-specific credit risk for the three months ended March 31, 2013 compared to $130 million and $603 million for the same period in 2012. Changes to borrower-specific credit risk for loans reported as trading account assets were not material for the three months ended March 31, 2013 and 2012.
Gains (Losses) Relating to Assets and Liabilities Accounted for Under the Fair Value Option | |||||||||||||||
Three Months Ended March 31, 2013 |
|||||||||||||||
(Dollars in millions) |
Trading
Account
Profits
(Losses)
|
Mortgage
Banking
Income
(Loss)
|
Other
Income
(Loss)
|
Total |
|||||||||||
Loans reported as trading account assets |
$ |
29 |
$ |
— |
$ |
— |
$ |
29 |
|||||||
Consumer and commercial loans |
(1 |
) |
— |
102 |
101 |
||||||||||
Loans held-for-sale (1)
|
8 |
278 |
(10 |
) |
276 |
||||||||||
Securities financing agreements |
23 |
— |
— |
23 |
|||||||||||
Other assets |
— |
— |
5 |
5 |
|||||||||||
Long-term deposits |
— |
— |
19 |
19 |
|||||||||||
Asset-backed secured financings |
— |
(44 |
) |
— |
(44 |
) |
|||||||||
Unfunded loan commitments |
— |
— |
65 |
65 |
|||||||||||
Short-term borrowings |
(39 |
) |
— |
— |
(39 |
) |
|||||||||
Accrued expenses and other liabilities |
— |
29 |
— |
29 |
|||||||||||
Long-term debt (2)
|
(1,269 |
) |
— |
(90 |
) |
(1,359 |
) |
||||||||
Total |
$ |
(1,249 |
) |
$ |
263 |
$ |
91 |
$ |
(895 |
) |
|||||
Three Months Ended March 31, 2012 |
|||||||||||||||
Loans reported as trading account assets |
$ |
78 |
$ |
— |
$ |
— |
$ |
78 |
|||||||
Consumer and commercial loans |
(1 |
) |
— |
302 |
301 |
||||||||||
Loans held-for-sale (1)
|
56 |
431 |
104 |
591 |
|||||||||||
Securities financing agreements |
(104 |
) |
— |
— |
(104 |
) |
|||||||||
Other assets |
— |
— |
18 |
18 |
|||||||||||
Long-term deposits |
— |
— |
21 |
21 |
|||||||||||
Asset-backed secured financings |
— |
(38 |
) |
— |
(38 |
) |
|||||||||
Unfunded loan commitments |
— |
— |
404 |
404 |
|||||||||||
Short-term borrowings |
7 |
— |
— |
7 |
|||||||||||
Long-term debt (2)
|
(791 |
) |
— |
(3,314 |
) |
(4,105 |
) |
||||||||
Total |
$ |
(755 |
) |
$ |
393 |
$ |
(2,465 |
) |
$ |
(2,827 |
) |
||||
(1) |
Includes the value of IRLCs on loans funded, including those already sold. |
(2) |
The majority of the net gains (losses) in trading account profits (losses) relate to the embedded derivative in structured liabilities and are offset by gains (losses) on derivatives and securities that hedge these liabilities. The net gains (losses) in other income (loss) relate to the impact on structured liabilities of changes in the Corporation's credit spread. |
224
NOTE 18 – Fair Value of Financial Instruments |
The fair values of financial instruments and their classifications within the fair value hierarchy have been derived using methodologies described in Note 16 – Fair Value Measurements. The following disclosures include financial instruments where only a portion of the ending balance at March 31, 2013 and December 31, 2012 was carried at fair value on the Consolidated Balance Sheet.
Short-term Financial Instruments
The carrying value of short-term financial instruments, including cash and cash equivalents, time deposits placed and other short-term investments, federal funds sold and purchased, resale and certain repurchase agreements, customer and other receivables, customer payables (within accrued expenses and other liabilities on the Consolidated Balance Sheet), and short-term borrowings approximates the fair value of these instruments. These financial instruments generally expose the Corporation to limited credit risk and have no stated maturities or have short-term maturities and carry interest rates that approximate market. The Corporation elected to account for certain repurchase agreements under the fair value option.
Under the fair value hierarchy, cash and cash equivalents are classified as Level 1. Time deposits placed and other short-term investments, such as U.S. government securities and short-term commercial paper, are classified as Level 1 and Level 2. Federal funds sold and purchased are classified as Level 2. Resale and repurchase agreements are classified as Level 2 because they are generally short-dated and/or variable-rate instruments collateralized by U.S. government or agency securities. Customer and other receivables primarily consist of margin loans, servicing advances and other accounts receivable and are classified as Level 2 and Level 3. Customer payables (within accrued expenses and other liabilities) and short-term borrowings are classified as Level 2.
Held-to-maturity Debt Securities
HTM debt securities, which consist of U.S. agency debt securities, are classified as Level 2 using the same methodologies as AFS U.S. agency debt securities. For additional information on HTM debt securities, see Note 4 – Securities.
Loans
The fair values for commercial and consumer loans are generally determined by discounting both principal and interest cash flows expected to be collected using a discount rate for similar instruments with adjustments that the Corporation believes a market participant would consider in determining fair value. The Corporation estimates the cash flows expected to be collected using internal credit risk, interest rate and prepayment risk models that incorporate the Corporation's best estimate of current key assumptions, such as default rates, loss severity and prepayment speeds for the life of the loan. The carrying value of loans is presented net of the applicable allowance for loan losses and excludes leases. The Corporation elected to account for certain large commercial loans that exceeded the Corporation's single name credit risk concentration guidelines by an amount that would require hedging under the fair value option.
Mortgage Servicing Rights
Commercial and residential reverse MSRs, which are carried at the lower of cost or market value and accounted for using the amortization method, are classified as Level 3. For additional information on MSRs, see Note 19 – Mortgage Servicing Rights.
Deposits
The fair value for certain deposits with stated maturities was determined by discounting contractual cash flows using current market rates for instruments with similar maturities. The carrying value of non-U.S. time deposits approximates fair value. For deposits with no stated maturities, the carrying value was considered to approximate fair value and does not take into account the significant value of the cost advantage and stability of the Corporation's long-term relationships with depositors. The Corporation accounts for certain long-term fixed-rate deposits that are hedged with derivatives on a risk management basis under the fair value option.
Long-term Debt
The Corporation uses quoted market prices, when available, to estimate fair value for its long-term debt. When quoted market prices are not available, fair value is estimated based on current market interest rates and credit spreads for debt with similar terms and maturities. The Corporation accounts for certain structured liabilities under the fair value option.
225
Fair Value of Financial Instruments
The carrying values and fair values by fair value hierarchy of certain financial instruments where only a portion of the ending balance was carried at fair value at March 31, 2013 and December 31, 2012 are presented in the table below.
Fair Value of Financial Instruments | |||||||||||||||||||||||||||||||
March 31, 2013 |
December 31, 2012 |
||||||||||||||||||||||||||||||
Fair Value |
Fair Value |
||||||||||||||||||||||||||||||
(Dollars in millions) |
Carrying
Value
|
Level 2 |
Level 3 |
Total |
Carrying
Value
|
Level 2 |
Level 3 |
Total |
|||||||||||||||||||||||
Financial assets |
|||||||||||||||||||||||||||||||
Loans |
$ |
865,769 |
$ |
103,505 |
$ |
782,266 |
$ |
885,771 |
$ |
859,875 |
$ |
105,119 |
$ |
772,761 |
$ |
877,880 |
|||||||||||||||
Loans held-for-sale |
19,278 |
15,655 |
3,620 |
19,275 |
19,413 |
15,087 |
4,321 |
19,408 |
|||||||||||||||||||||||
Financial liabilities |
|||||||||||||||||||||||||||||||
Deposits |
1,095,183 |
1,095,688 |
— |
1,095,688 |
1,105,261 |
1,105,669 |
— |
1,105,669 |
|||||||||||||||||||||||
Long-term debt |
279,641 |
287,367 |
2,355 |
289,722 |
275,585 |
281,173 |
2,301 |
283,474 |
|||||||||||||||||||||||
Commercial Unfunded Lending Commitments
Fair values were generally determined using a discounted cash flow valuation approach which is applied using market-based CDS or internally developed benchmark credit curves. The Corporation accounts for certain loan commitments under the fair value option.
The carrying values and fair values of the Corporation's commercial unfunded lending commitments were $949 million and $4.1 billion at March 31, 2013, and $1.0 billion and $4.5 billion at December 31, 2012. Commercial unfunded lending commitments are primarily classified as Level 3. The carrying value of these commitments is classified in accrued expenses and other liabilities.
The Corporation does not estimate the fair values of consumer unfunded lending commitments because, in many instances, the Corporation can reduce or cancel these commitments by providing notice to the borrower. For additional information on commitments, see Note 11 – Commitments and Contingencies.
226
NOTE 19 – Mortgage Servicing Rights |
The Corporation accounts for consumer MSRs at fair value with changes in fair value recorded in mortgage banking income in the Consolidated Statement of Income. The Corporation manages the risk in these MSRs with securities including MBS and U.S. Treasuries, as well as certain derivatives such as options and interest rate swaps, which are not designated as accounting hedges. The securities used to manage the risk in the MSRs are classified in other assets with changes in the fair value of the securities and the related interest income recorded in mortgage banking income.
The table below presents activity for residential first-lien MSRs for the three months ended March 31, 2013 and 2012. Commercial and residential reverse MSRs, which are carried at the lower of cost or market value and accounted for using the amortization method, totaled $120 million and $135 million at March 31, 2013 and December 31, 2012, and are not included in the tables in this Note.
Rollforward of Mortgage Servicing Rights |
|||||||
Three Months Ended March 31 |
|||||||
(Dollars in millions) |
2013 |
2012 |
|||||
Balance, January 1 |
$ |
5,716 |
$ |
7,378 |
|||
Additions |
123 |
77 |
|||||
Sales |
(183 |
) |
— |
||||
Impact of customer payments (1)
|
(314 |
) |
(521 |
) |
|||
Impact of changes in interest rates and other market factors (2)
|
332 |
925 |
|||||
Model and other cash flow assumption changes: (3)
|
|||||||
Projected cash flows, primarily due to increases in costs to service loans |
(134 |
) |
(273 |
) |
|||
Impact of changes in the Home Price Index |
(79 |
) |
15 |
||||
Impact of changes to the prepayment model |
175 |
— |
|||||
Other model changes |
140 |
(12 |
) |
||||
Balance, March 31 |
$ |
5,776 |
$ |
7,589 |
|||
Mortgage loans serviced for investors (in billions) |
$ |
949 |
$ |
1,313 |
|||
(1) |
Represents the change in the market value of the MSR asset due to the impact of customer payments received during the period. |
(2) |
These amounts reflect the changes in modeled MSR fair value primarily due to observed changes in interest rates, volatility, spreads and the shape of the forward swap curve, as well as changes in OAS and prepayment rates. |
(3) |
These amounts reflect periodic adjustments to the valuation model as well as changes in certain cash flow assumptions such as cost to service and ancillary income per loan. For the three months ended March 31, 2013 and 2012, included in other model changes is the effect to the MSR cash flow assumptions caused by changes in spreads between primary and secondary markets.
|
The Corporation primarily uses an OAS valuation approach which factors in prepayment risk to determine the fair value of MSRs. This approach consists of projecting servicing cash flows under multiple interest rate scenarios and discounting these cash flows using risk-adjusted discount rates. In addition to updating the valuation model for interest, discount and prepayment rates, periodic adjustments are made to recalibrate the valuation model for factors used to project cash flows. The changes to the factors capture the effect of variances related to actual versus estimated servicing proceeds. In late 2012, the Corporation solicited and received multiple proposals from independent third parties for the sale of a portion of the MSRs. In 2013, the Corporation entered into definitive agreements for the sales. The Corporation used the prices in the proposals and definitive agreements, as adjusted to exclude the portion of the pricing that was not specific to the MSRs, as a third-party pricing source in the valuation of the MSRs.
The significant economic assumptions used in determining the fair value of MSRs at March 31, 2013 and December 31, 2012 are presented below.
Significant Economic Assumptions | |||||||||||
March 31, 2013 |
December 31, 2012 |
||||||||||
Fixed |
Adjustable |
Fixed |
Adjustable |
||||||||
Weighted-average OAS |
3.98 |
% |
6.65 |
% |
4.00 |
% |
6.63 |
% |
|||
Weighted-average life, in years |
4.05 |
2.10 |
3.65 |
2.10 |
|||||||
227
The table below presents the sensitivity of the weighted-average lives and fair value of MSRs to changes in modeled assumptions. These sensitivities are hypothetical and should be used with caution. As the amounts indicate, changes in fair value based on variations in assumptions generally cannot be extrapolated because the relationship of the change in assumption to the change in fair value may not be linear. Also, the effect of a variation in a particular assumption on the fair value of MSRs that continue to be held by the Corporation is calculated without changing any other assumption. In reality, changes in one factor may result in changes in another, which might magnify or counteract the sensitivities. The below sensitivities do not reflect any hedge strategies that may be undertaken to mitigate such risk.
Sensitivity Impacts | |||||||||||||
March 31, 2013 |
|||||||||||||
Change in Weighted-average Lives |
|||||||||||||
(Dollars in millions) |
Fixed |
Adjustable |
Change in
Fair Value
|
||||||||||
Prepayment rates |
|||||||||||||
Impact of 10% decrease |
0.31 |
years |
0.21 |
years |
$ |
462 |
|||||||
Impact of 20% decrease |
0.67 |
0.45 |
984 |
||||||||||
Impact of 10% increase |
(0.28 |
) |
(0.18 |
) |
(412 |
) |
|||||||
Impact of 20% increase |
(0.52 |
) |
(0.34 |
) |
(781 |
) |
|||||||
OAS level |
|||||||||||||
Impact of 100 bps decrease |
$ |
277 |
|||||||||||
Impact of 200 bps decrease |
578 |
||||||||||||
Impact of 100 bps increase |
(255 |
) |
|||||||||||
Impact of 200 bps increase |
(490 |
) |
|||||||||||
228
NOTE 20 – Business Segment Information |
The Corporation reports the results of its operations through five business segments: Consumer & Business Banking (CBB), Consumer Real Estate Services (CRES), Global Banking, Global Markets and Global Wealth & Investment Management (GWIM), with the remaining operations recorded in All Other.
Consumer & Business Banking
CBB offers a diversified range of credit, banking and investment products and services to consumers and businesses. CBB product offerings include traditional savings accounts, money market savings accounts, CDs and IRAs, noninterest- and interest-bearing checking accounts, investment accounts and products as well as credit and debit cards in the U.S. to consumers and small businesses. Customers and clients have access to a franchise network that stretches coast to coast through 32 states and the District of Columbia. The franchise network includes approximately 5,400 banking centers, 16,300 ATMs, nationwide call centers, and online and mobile platforms. CBB also offers a wide range of lending-related products and services, integrated working capital management and treasury solutions through a network of offices and client relationship teams along with various product partners to U.S.-based companies generally with annual sales of $1 million to $50 million. CBB results are impacted by the migration of clients and their deposit and loan balances between CBB and other client-managed businesses. Subsequent to the date of migration, the associated net interest income, noninterest income and noninterest expense are recorded in the business to which the clients migrated.
Consumer Real Estate Services
CRES provides an extensive line of consumer real estate products and services to customers nationwide. CRES products include fixed- and adjustable-rate first-lien mortgage loans for home purchase and refinancing needs, home equity lines of credit (HELOC) and home equity loans. First mortgage products are either sold into the secondary mortgage market to investors, while generally retaining MSRs and the Bank of America customer relationships, or are held on the Consolidated Balance Sheet in All Other for ALM purposes. HELOC and home equity loans are retained on the CRES balance sheet. CRES services mortgage loans, including those loans it owns, loans owned by other business segments and All Other, and loans owned by outside investors.
The financial results of the on-balance sheet loans are reported in the business segment that owns the loans or All Other. CRES is not impacted by the Corporation's first mortgage production retention decisions as CRES is compensated for loans held for ALM purposes on a management accounting basis, with a corresponding offset recorded in All Other, and for servicing loans owned by other business segments and All Other. CRES also includes the impact of transferring customers and their related loan balances between GWIM and CRES based on client segmentation thresholds. Subsequent to the date of transfer, the associated net interest income and noninterest expense are recorded in the business segment to which loans were transferred.
Global Banking
Global Banking provides a wide range of lending-related products and services, integrated working capital management and treasury solutions to clients, and underwriting and advisory services through the Corporation's network of offices and client relationship teams. Global Banking's lending products and services include commercial loans, leases, commitment facilities, trade finance, real estate lending, asset-based lending and direct/indirect consumer loans. Global Banking's treasury solutions business includes treasury management, foreign exchange and short-term investing options. Global Banking also works with clients to provide investment banking products such as debt and equity underwriting and distribution, and merger-related and other advisory services. The economics of certain investment banking and underwriting activities are shared primarily between Global Banking and Global Markets based on the activities performed by each segment. Global Banking clients include middle-market companies, commercial real estate firms, auto dealerships, not-for-profit companies, large global corporations, financial institutions and leasing clients.
Global Markets
Global Markets offers sales and trading services, including research, to institutional clients across fixed-income, credit, currency, commodity and equity businesses. Global Markets product coverage includes securities and derivative products in both the primary and secondary markets. Global Markets provides market-making, financing, securities clearing, settlement and custody services globally to institutional investor clients in support of their investing and trading activities. Global Markets also works with commercial and corporate clients to provide risk management products using interest rate, equity, credit, currency and commodity derivatives, foreign exchange, fixed-income and mortgage-related products. As a result of market-making activities in these products, Global Markets may be required to manage risk in government securities, equity and equity-linked securities, high-grade and high-yield corporate debt securities, MBS, commodities and ABS. The economics of certain investment banking and underwriting activities are shared primarily between Global Markets and Global Banking based on the activities performed by each segment.
229
Global Wealth & Investment Management
GWIM provides comprehensive wealth management solutions to a broad base of clients from emerging affluent to the ultra-wealthy. These services include investment and brokerage services, estate and financial planning, fiduciary portfolio management, cash and liability management, and specialty asset management. GWIM also provides retirement and benefit plan services, philanthropic management and asset management to individual and institutional clients. GWIM results are impacted by the migration of clients and their deposit and loan balances between GWIM and primarily other client-managed businesses. Subsequent to the date of migration, the associated net interest income, noninterest income and noninterest expense are recorded in the business to which the clients migrated.
All Other
All Other consists of ALM activities, equity investments, liquidating businesses, residual expense allocations and other. ALM activities encompass the whole-loan residential mortgage portfolio and investment securities, interest rate and foreign currency risk management activities including the residual net interest income allocation, gains/losses on structured liabilities, the impact of certain allocation methodologies and accounting hedge ineffectiveness. Additionally, All Other includes certain residential mortgage loans that are managed by CRES.
Basis of Presentation |
The management accounting and reporting process derives segment and business results by utilizing allocation methodologies for revenue and expense. The net income derived for the businesses is dependent upon revenue and cost allocations using an activity-based costing model, funds transfer pricing, and other methodologies and assumptions management believes are appropriate to reflect the results of the business.
Total revenue, net of interest expense, includes net interest income on a FTE basis and noninterest income. The adjustment of net interest income to a FTE basis results in a corresponding increase in income tax expense. The segment results also reflect certain revenue and expense methodologies that are utilized to determine net income. The net interest income of the businesses includes the results of a funds transfer pricing process that matches assets and liabilities with similar interest rate sensitivity and maturity characteristics. For presentation purposes, in segments where the total of liabilities and equity exceeds assets, which are generally deposit-taking segments, the Corporation allocates assets to match liabilities. Net interest income of the business segments also includes an allocation of net interest income generated by certain of the Corporation's ALM activities.
The Corporation's ALM activities include an overall interest rate risk management strategy that incorporates the use of various derivatives and cash instruments to manage fluctuations in earnings and capital that are caused by interest rate volatility. The Corporation's goal is to manage interest rate sensitivity so that movements in interest rates do not significantly adversely affect earnings and capital. The results of a majority of the Corporation's ALM activities are allocated to the business segments and fluctuate based on the performance of the ALM activities. ALM activities include external product pricing decisions including deposit pricing strategies, the effects of the Corporation's internal funds transfer pricing process and the net effects of other ALM activities.
Certain expenses not directly attributable to a specific business segment are allocated to the segments. The most significant of these expenses include data and item processing costs and certain centralized or shared functions. Data processing costs are allocated to the segments based on equipment usage. Item processing costs are allocated to the segments based on the volume of items processed for each segment. The costs of certain other centralized or shared functions are allocated based on methodologies that reflect utilization.
230
The following tables present total revenue, net of interest expense, on a FTE basis, and net income (loss) for the three months ended March 31, 2013 and 2012, and total assets at March 31, 2013 and 2012 for each business segment, as well as All Other.
Business Segments |
|||||||||||||||||||||||
At and for the Three Months Ended March 31 |
|||||||||||||||||||||||
Total Corporation (1)
|
Consumer & Business Banking |
Consumer Real Estate Services |
|||||||||||||||||||||
(Dollars in millions) |
2013 |
2012 |
2013 |
2012 |
2013 |
2012 |
|||||||||||||||||
Net interest income (FTE basis) |
$ |
10,875 |
$ |
11,053 |
$ |
4,820 |
$ |
5,070 |
$ |
743 |
$ |
768 |
|||||||||||
Noninterest income |
12,533 |
11,432 |
2,394 |
2,352 |
1,569 |
1,896 |
|||||||||||||||||
Total revenue, net of interest expense (FTE basis) |
23,408 |
22,485 |
7,214 |
7,422 |
2,312 |
2,664 |
|||||||||||||||||
Provision for credit losses |
1,713 |
2,418 |
906 |
877 |
335 |
507 |
|||||||||||||||||
Amortization of intangibles |
276 |
319 |
127 |
158 |
— |
— |
|||||||||||||||||
Other noninterest expense |
19,224 |
18,822 |
3,981 |
4,105 |
5,407 |
3,884 |
|||||||||||||||||
Income (loss) before income taxes |
2,195 |
926 |
2,200 |
2,282 |
(3,430 |
) |
(1,727 |
) |
|||||||||||||||
Income tax expense (benefit) (FTE basis) |
712 |
273 |
818 |
837 |
(1,273 |
) |
(589 |
) |
|||||||||||||||
Net income (loss) |
$ |
1,483 |
$ |
653 |
$ |
1,382 |
$ |
1,445 |
$ |
(2,157 |
) |
$ |
(1,138 |
) |
|||||||||
Period-end total assets |
$ |
2,174,819 |
$ |
2,181,449 |
$ |
589,410 |
$ |
541,578 |
$ |
129,116 |
$ |
157,027 |
|||||||||||
Global Banking |
Global Markets |
||||||||||||||||||||||
2013 |
2012 |
2013 |
2012 |
||||||||||||||||||||
Net interest income (FTE basis) |
$ |
2,351 |
$ |
2,296 |
$ |
1,111 |
$ |
910 |
|||||||||||||||
Noninterest income |
1,874 |
1,940 |
3,761 |
3,501 |
|||||||||||||||||||
Total revenue, net of interest expense (FTE basis) |
4,225 |
4,236 |
4,872 |
4,411 |
|||||||||||||||||||
Provision for credit losses |
195 |
(245 |
) |
5 |
(13 |
) |
|||||||||||||||||
Amortization of intangibles |
16 |
20 |
16 |
15 |
|||||||||||||||||||
Other noninterest expense |
1,884 |
1,977 |
3,060 |
3,224 |
|||||||||||||||||||
Income before income taxes |
2,130 |
2,484 |
1,791 |
1,185 |
|||||||||||||||||||
Income tax expense (FTE basis) |
792 |
911 |
622 |
357 |
|||||||||||||||||||
Net income |
$ |
1,338 |
$ |
1,573 |
$ |
1,169 |
$ |
828 |
|||||||||||||||
Period-end total assets |
$ |
340,281 |
$ |
314,681 |
$ |
625,434 |
$ |
563,130 |
|||||||||||||||
Global Wealth & Investment Management |
All Other |
||||||||||||||||||||||
2013 |
2012 |
2013 |
2012 |
||||||||||||||||||||
Net interest income (FTE basis) |
$ |
1,596 |
$ |
1,531 |
$ |
254 |
$ |
478 |
|||||||||||||||
Noninterest income (loss) |
2,825 |
2,616 |
110 |
(873 |
) |
||||||||||||||||||
Total revenue, net of interest expense (FTE basis) |
4,421 |
4,147 |
364 |
(395 |
) |
||||||||||||||||||
Provision for credit losses |
22 |
46 |
250 |
1,246 |
|||||||||||||||||||
Amortization of intangibles |
99 |
105 |
18 |
21 |
|||||||||||||||||||
Other noninterest expense |
3,154 |
3,127 |
1,738 |
2,505 |
|||||||||||||||||||
Income (loss) before income taxes |
1,146 |
869 |
(1,642 |
) |
(4,167 |
) |
|||||||||||||||||
Income tax expense (benefit) (FTE basis) |
426 |
319 |
(673 |
) |
(1,562 |
) |
|||||||||||||||||
Net income (loss) |
$ |
720 |
$ |
550 |
$ |
(969 |
) |
$ |
(2,605 |
) |
|||||||||||||
Period-end total assets |
$ |
268,263 |
$ |
263,500 |
$ |
222,315 |
$ |
341,533 |
|||||||||||||||
(1) |
There were no material intersegment revenues. |
231
The following tables present a reconciliation of the five business segments' total revenue, net of interest expense, on a FTE basis, and net income to the Consolidated Statement of Income, and total assets to the Consolidated Balance Sheet. The adjustments presented in the following tables include consolidated income, expense and asset amounts not specifically allocated to individual business segments.
Business Segment Reconciliations |
||||||||
Three Months Ended March 31 |
||||||||
(Dollars in millions) |
2013 |
2012 |
||||||
Segments' total revenue, net of interest expense (FTE basis) |
$ |
23,044 |
$ |
22,880 |
||||
Adjustments: |
||||||||
ALM activities (1)
|
(316 |
) |
(1,170 |
) |
||||
Equity investment income |
520 |
429 |
||||||
Liquidating businesses |
529 |
569 |
||||||
FTE basis adjustment |
(211 |
) |
(207 |
) |
||||
Other |
(369 |
) |
(223 |
) |
||||
Consolidated revenue, net of interest expense |
$ |
23,197 |
$ |
22,278 |
||||
Segments' net income |
$ |
2,452 |
$ |
3,258 |
||||
Adjustments, net-of-taxes: |
||||||||
ALM activities |
(512 |
) |
(1,823 |
) |
||||
Equity investment income |
328 |
270 |
||||||
Liquidating businesses |
2 |
44 |
||||||
Other |
(787 |
) |
(1,096 |
) |
||||
Consolidated net income |
$ |
1,483 |
$ |
653 |
||||
March 31 |
||||||||
2013 |
2012 |
|||||||
Segments' total assets |
$ |
1,952,504 |
$ |
1,839,916 |
||||
Adjustments: |
||||||||
ALM activities, including securities portfolio |
693,498 |
641,385 |
||||||
Equity investments |
4,858 |
6,182 |
||||||
Liquidating businesses |
29,496 |
35,954 |
||||||
Elimination of segment asset allocations to match liabilities |
(552,838 |
) |
(496,391 |
) |
||||
Other |
47,301 |
154,403 |
||||||
Consolidated total assets |
$ |
2,174,819 |
$ |
2,181,449 |
||||
(1) |
Includes negative fair value adjustments on structured liabilities of $90 million and $3.3 billion for the three months ended March 31, 2013 and 2012.
|
232
Part II. OTHER INFORMATION |
Item 1. Legal Proceedings |
See Litigation and Regulatory Matters in Note 11 – Commitments and Contingencies to the Consolidated Financial Statements, which is incorporated by reference in this Item 1, for litigation and regulatory disclosure that supplements the disclosure in Note 13 – Commitments and Contingencies to the Consolidated Financial Statements of the Corporation's 2012 Annual Report on Form 10-K.
Item 1A. Risk Factors |
There are no material changes from the risk factors set forth under Part 1, Item 1A. Risk Factors in the Corporation's 2012 Annual Report on Form 10-K.
Item 2. Unregistered Sales of Equity Securities and Use of Proceeds |
The table below presents share repurchase activity for the three months ended March 31, 2013. The common shares repurchased were acquired by the Corporation in connection with satisfaction of tax withholding obligations on vested restricted stock or restricted stock units and certain forfeitures and terminations of employment-related awards under equity incentive plans. The primary source of funds for cash distributions by the Corporation to its shareholders is dividends received from its banking subsidiaries. Each of the banking subsidiaries is subject to various regulatory policies and requirements relating to the payment of dividends, including requirements to maintain capital above regulatory minimums. All of the Corporation's preferred stock outstanding has preference over the Corporation's common stock with respect to the payment of dividends.
Remaining Buyback Authority |
||||||||||||||||
|
(Dollars in millions, except per
share information; shares in thousands)
|
Common Shares
Repurchased
|
Weighted-Average
Per Share Price
|
Shares Purchased as
Part of Publicly
Announced Programs
|
Amounts |
Shares |
|||||||||||
January 1 - 31, 2013 |
924 |
$ |
11.57 |
— |
$ |
— |
— |
|||||||||
February 1 - 28, 2013 |
26,561 |
12.13 |
— |
— |
— |
|||||||||||
March 1 - 31, 2013 |
1,725 |
11.99 |
— |
— |
— |
|||||||||||
Three Months Ended March 31, 2013 |
29,210 |
12.11 |
||||||||||||||
On March 14, 2013, the Corporation announced that its Board of Directors authorized the repurchase of up to $5.0 billion of common stock. The timing and exact amount of common share repurchases will be consistent with the Corporation's capital plan. None of the share repurchases referenced in the table above were pursuant to the $5.0 billion repurchase program announced in March 2013. The Corporation did not have any unregistered sales of its equity securities during the three months ended March 31, 2013.
233
Item 6. Exhibits | ||
Exhibit 3(a) |
Amended and Restated Certificate of Incorporation of registrant, as in effect on the date hereof, incorporated by reference to Exhibit 3(a) of registrant's Quarterly Report on Form10-Q (File No. 1-6523) for the quarterly period ended September 30, 2011 filed on November 3, 2011 |
|
Exhibit 3(b) |
Amended and Restated Bylaws of registrant, as in effect on the date hereof, incorporated by reference to Exhibit 3(b) of registrant's 2010 Annual Report on Form 10-K (File No. 1-6523) filed on February 25, 2011 |
|
Exhibit 10(a) |
Form of Restricted Stock Units Award Agreement (February 2013 and subsequent grants), including grants to named executive officers (1)*, awarded under the Bank of America Corporation Key Associate Stock Plan, as amended and restated effective April 28, 2010
|
|
Exhibit 10(b) |
Form of Performance Restricted Stock Units Award Agreement (February 2013 and subsequent grants), including grants to named executive officers (1)*, awarded under the Bank of America Corporation Key Associate Stock Plan, as amended and restated effective April 28, 2010
|
|
Exhibit 11 |
Earnings Per Share Computation – included in Note 14 – Earnings Per Common Share to the Consolidated Financial Statements (1)
|
|
Exhibit 12 |
Ratio of Earnings to Fixed Charges (1)
Ratio of Earnings to Fixed Charges and Preferred Dividends (1)
|
|
Exhibit 31(a) |
Certification of the Chief Executive Officer pursuant to Section 302 of the Sarbanes-Oxley Act of 2002 (1)
|
|
Exhibit 31(b) |
Certification of the Chief Financial Officer pursuant to Section 302 of the Sarbanes-Oxley Act of 2002 (1)
|
|
Exhibit 32(a) |
Certification of the Chief Executive Officer pursuant to 18 U.S.C. Section 1350, as adopted pursuant to Section 906 of the Sarbanes-Oxley Act of 2002 (1)
|
|
Exhibit 32(b) |
Certification of the Chief Financial Officer pursuant to 18 U.S.C. Section 1350, as adopted pursuant to Section 906 of the Sarbanes-Oxley Act of 2002 (1)
|
|
Exhibit 101.INS |
XBRL Instance Document (1)
|
|
Exhibit 101.SCH |
XBRL Taxonomy Extension Schema Document (1)
|
|
Exhibit 101.CAL |
XBRL Taxonomy Extension Calculation Linkbase Document (1)
|
|
Exhibit 101.LAB |
XBRL Taxonomy Extension Label Linkbase Document (1)
|
|
Exhibit 101.PRE |
XBRL Taxonomy Extension Presentation Linkbase Document (1)
|
|
Exhibit 101.DEF |
XBRL Taxonomy Extension Definitions Linkbase Document (1)
|
|
(1) |
Filed herewith |
* |
Exhibit is a management contract or a compensatory plan or arrangement |
234
SIGNATURE
Pursuant to the requirements of the Securities Exchange Act of 1934, the registrant has duly caused this report to be signed on its behalf by the undersigned, thereunto duly authorized.
|
Bank of America Corporation
Registrant
|
|||||
Date: |
May 7, 2013 |
/s/ Neil A. Cotty |
|||
|
Neil A. Cotty
Chief Accounting Officer
|
|||||
235
Bank of America Corporation
Form 10-Q
Index to Exhibits
Exhibit |
Description |
|
Exhibit 3(a) |
Amended and Restated Certificate of Incorporation of registrant, as in effect on the date hereof, incorporated by reference to Exhibit 3(a) of registrant's Quarterly Report on Form10-Q (File No. 1-6523) for the quarterly period ended September 30, 2011 filed on November 3, 2011 |
|
Exhibit 3(b) |
Amended and Restated Bylaws of registrant, as in effect on the date hereof, incorporated by reference to Exhibit 3(b) of registrant's 2010 Annual Report on Form 10-K (File No. 1-6523) filed on February 25, 2011 |
|
Exhibit 10(a) |
Form of Restricted Stock Units Award Agreement (February 2013 and subsequent grants), including grants to named executive officers (1)*, awarded under the Bank of America Corporation Key Associate Stock Plan, as amended and restated effective April 28, 2010
|
|
Exhibit 10(b) |
Form of Performance Restricted Stock Units Award Agreement (February 2013 and subsequent grants), including grants to named executive officers (1)*, awarded under the Bank of America Corporation Key Associate Stock Plan, as amended and restated effective April 28, 2010
|
|
Exhibit 11 |
Earnings Per Share Computation – included in Note 14 – Earnings Per Common Share to the Consolidated Financial Statements (1)
|
|
Exhibit 12 |
Ratio of Earnings to Fixed Charges (1)
Ratio of Earnings to Fixed Charges and Preferred Dividends (1)
|
|
Exhibit 31(a) |
Certification of the Chief Executive Officer pursuant to Section 302 of the Sarbanes-Oxley Act of 2002 (1)
|
|
Exhibit 31(b) |
Certification of the Chief Financial Officer pursuant to Section 302 of the Sarbanes-Oxley Act of 2002 (1)
|
|
Exhibit 32(a) |
Certification of the Chief Executive Officer pursuant to 18 U.S.C. Section 1350, as adopted pursuant to Section 906 of the Sarbanes-Oxley Act of 2002 (1)
|
|
Exhibit 32(b) |
Certification of the Chief Financial Officer pursuant to 18 U.S.C. Section 1350, as adopted pursuant to Section 906 of the Sarbanes-Oxley Act of 2002 (1)
|
|
Exhibit 101.INS |
XBRL Instance Document (1)
|
|
Exhibit 101.SCH |
XBRL Taxonomy Extension Schema Document (1)
|
|
Exhibit 101.CAL |
XBRL Taxonomy Extension Calculation Linkbase Document (1)
|
|
Exhibit 101.LAB |
XBRL Taxonomy Extension Label Linkbase Document (1)
|
|
Exhibit 101.PRE |
XBRL Taxonomy Extension Presentation Linkbase Document (1)
|
|
Exhibit 101.DEF |
XBRL Taxonomy Extension Definitions Linkbase Document (1)
|
|
(1) |
Filed herewith |
* |
Exhibit is a management contract or a compensatory plan or arrangement |
236