THE PRESS RELEASE
Published on October 14, 2026
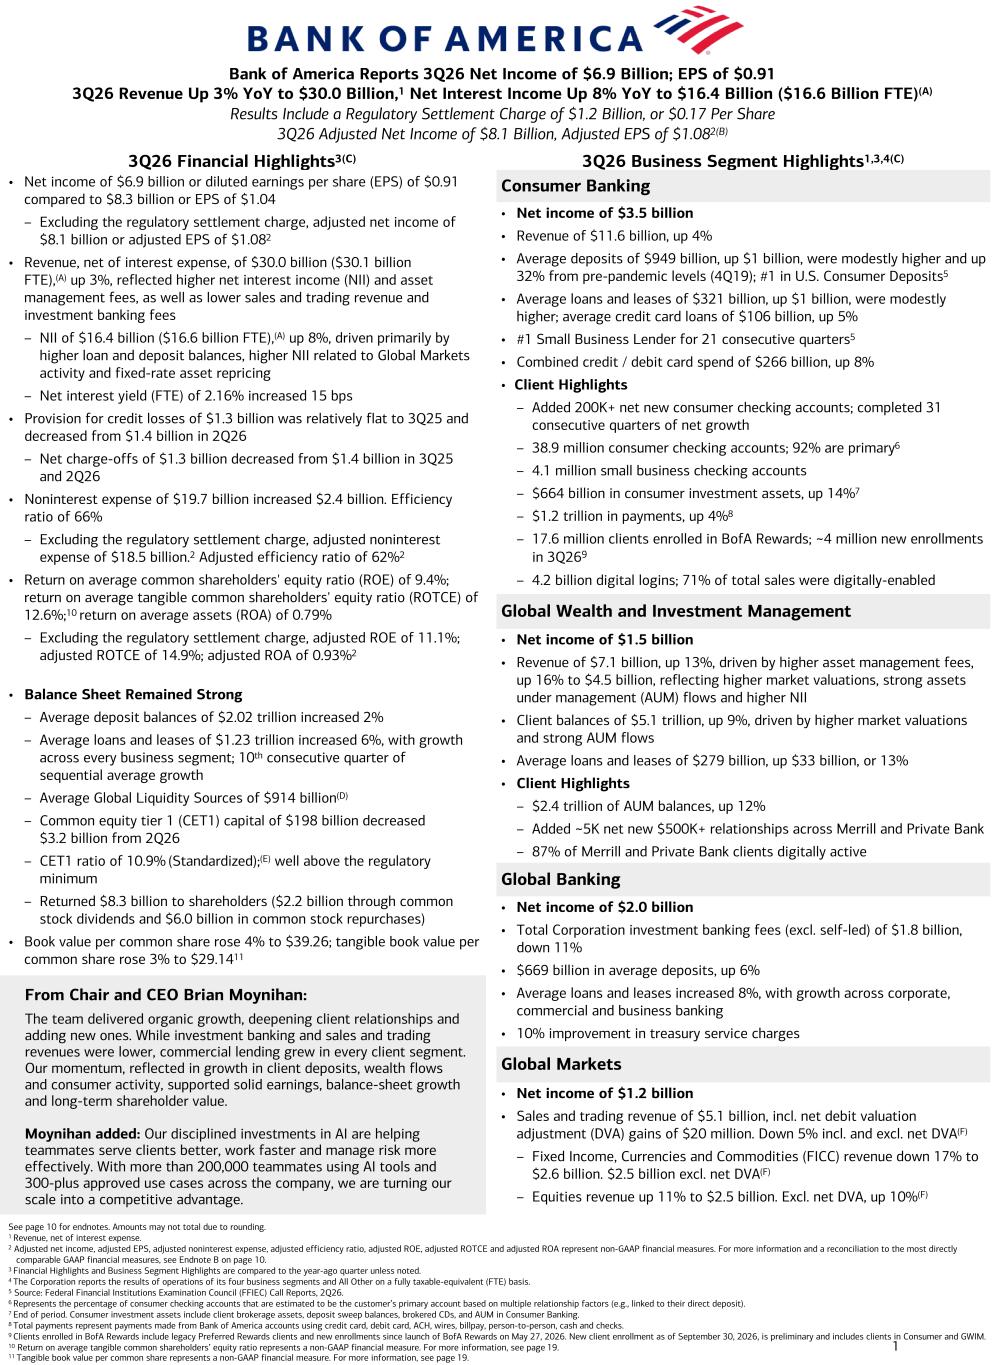
1 3Q26 Financial Highlights3(C) 3Q26 Business Segment Highlights1,3,4(C) Consumer Banking • Net income of $3.5 billion • Revenue of $11.6 billion, up 4% • Average deposits of $949 billion, up $1 billion, were modestly higher and up 32% from pre-pandemic levels (4Q19); #1 in U.S. Consumer Deposits5 • Average loans and leases of $321 billion, up $1 billion, were modestly higher; average credit card loans of $106 billion, up 5% • #1 Small Business Lender for 21 consecutive quarters5 • Combined credit / debit card spend of $266 billion, up 8% • Client Highlights – Added 200K+ net new consumer checking accounts; completed 31 consecutive quarters of net growth – 38.9 million consumer checking accounts; 92% are primary6 – 4.1 million small business checking accounts – $664 billion in consumer investment assets, up 14%7 – $1.2 trillion in payments, up 4%8 – 17.6 million clients enrolled in BofA Rewards; ~4 million new enrollments in 3Q269 – 4.2 billion digital logins; 71% of total sales were digitally-enabled Global Wealth and Investment Management • Net income of $1.5 billion • Revenue of $7.1 billion, up 13%, driven by higher asset management fees, up 16% to $4.5 billion, reflecting higher market valuations, strong assets under management (AUM) flows and higher NII • Client balances of $5.1 trillion, up 9%, driven by higher market valuations and strong AUM flows • Average loans and leases of $279 billion, up $33 billion, or 13% • Client Highlights – $2.4 trillion of AUM balances, up 12% – Added ~5K net new $500K+ relationships across Merrill and Private Bank – 87% of Merrill and Private Bank clients digitally active Global Banking • Net income of $2.0 billion • Total Corporation investment banking fees (excl. self-led) of $1.8 billion, down 11% • $669 billion in average deposits, up 6% • Average loans and leases increased 8%, with growth across corporate, commercial and business banking • 10% improvement in treasury service charges Global Markets • Net income of $1.2 billion • Sales and trading revenue of $5.1 billion, incl. net debit valuation adjustment (DVA) gains of $20 million. Down 5% incl. and excl. net DVA(F) – Fixed Income, Currencies and Commodities (FICC) revenue down 17% to $2.6 billion. $2.5 billion excl. net DVA(F) – Equities revenue up 11% to $2.5 billion. Excl. net DVA, up 10%(F) From Chair and CEO Brian Moynihan: The team delivered organic growth, deepening client relationships and adding new ones. While investment banking and sales and trading revenues were lower, commercial lending grew in every client segment. Our momentum, reflected in growth in client deposits, wealth flows and consumer activity, supported solid earnings, balance-sheet growth and long-term shareholder value. Moynihan added: Our disciplined investments in AI are helping teammates serve clients better, work faster and manage risk more effectively. With more than 200,000 teammates using AI tools and 300-plus approved use cases across the company, we are turning our scale into a competitive advantage. Bank of America Reports 3Q26 Net Income of $6.9 Billion; EPS of $0.91 3Q26 Revenue Up 3% YoY to $30.0 Billion,1 Net Interest Income Up 8% YoY to $16.4 Billion ($16.6 Billion FTE)(A) Results Include a Regulatory Settlement Charge of $1.2 Billion, or $0.17 Per Share 3Q26 Adjusted Net Income of $8.1 Billion, Adjusted EPS of $1.082(B) See page 10 for endnotes. Amounts may not total due to rounding. 1 Revenue, net of interest expense. 2 Adjusted net income, adjusted EPS, adjusted noninterest expense, adjusted efficiency ratio, adjusted ROE, adjusted ROTCE and adjusted ROA represent non-GAAP financial measures. For more information and a reconciliation to the most directly comparable GAAP financial measures, see Endnote B on page 10. 3 Financial Highlights and Business Segment Highlights are compared to the year-ago quarter unless noted. 4 The Corporation reports the results of operations of its four business segments and All Other on a fully taxable-equivalent (FTE) basis. 5 Source: Federal Financial Institutions Examination Council (FFIEC) Call Reports, 2Q26. 6 Represents the percentage of consumer checking accounts that are estimated to be the customer’s primary account based on multiple relationship factors (e.g., linked to their direct deposit). 7 End of period. Consumer investment assets include client brokerage assets, deposit sweep balances, brokered CDs, and AUM in Consumer Banking. 8 Total payments represent payments made from Bank of America accounts using credit card, debit card, ACH, wires, billpay, person-to-person, cash and checks. 9 Clients enrolled in BofA Rewards include legacy Preferred Rewards clients and new enrollments since launch of BofA Rewards on May 27, 2026. New client enrollment as of September 30, 2026, is preliminary and includes clients in Consumer and GWIM. 10 Return on average tangible common shareholders’ equity ratio represents a non-GAAP financial measure. For more information, see page 19. 11 Tangible book value per common share represents a non-GAAP financial measure. For more information, see page 19. • Net income of $6.9 billion or diluted earnings per share (EPS) of $0.91 compared to $8.3 billion or EPS of $1.04 – Excluding the regulatory settlement charge, adjusted net income of $8.1 billion or adjusted EPS of $1.082 • Revenue, net of interest expense, of $30.0 billion ($30.1 billion FTE),(A) up 3%, reflected higher net interest income (NII) and asset management fees, as well as lower sales and trading revenue and investment banking fees – NII of $16.4 billion ($16.6 billion FTE),(A) up 8%, driven primarily by higher loan and deposit balances, higher NII related to Global Markets activity and fixed-rate asset repricing – Net interest yield (FTE) of 2.16% increased 15 bps • Provision for credit losses of $1.3 billion was relatively flat to 3Q25 and decreased from $1.4 billion in 2Q26 – Net charge-offs of $1.3 billion decreased from $1.4 billion in 3Q25 and 2Q26 • Noninterest expense of $19.7 billion increased $2.4 billion. Efficiency ratio of 66% – Excluding the regulatory settlement charge, adjusted noninterest expense of $18.5 billion.2 Adjusted efficiency ratio of 62%2 • Return on average common shareholders' equity ratio (ROE) of 9.4%; return on average tangible common shareholders' equity ratio (ROTCE) of 12.6%;10 return on average assets (ROA) of 0.79% – Excluding the regulatory settlement charge, adjusted ROE of 11.1%; adjusted ROTCE of 14.9%; adjusted ROA of 0.93%2 • Balance Sheet Remained Strong – Average deposit balances of $2.02 trillion increased 2% – Average loans and leases of $1.23 trillion increased 6%, with growth across every business segment; 10th consecutive quarter of sequential average growth – Average Global Liquidity Sources of $914 billion(D) – Common equity tier 1 (CET1) capital of $198 billion decreased $3.2 billion from 2Q26 – CET1 ratio of 10.9% (Standardized);(E) well above the regulatory minimum – Returned $8.3 billion to shareholders ($2.2 billion through common stock dividends and $6.0 billion in common stock repurchases) • Book value per common share rose 4% to $39.26; tangible book value per common share rose 3% to $29.1411
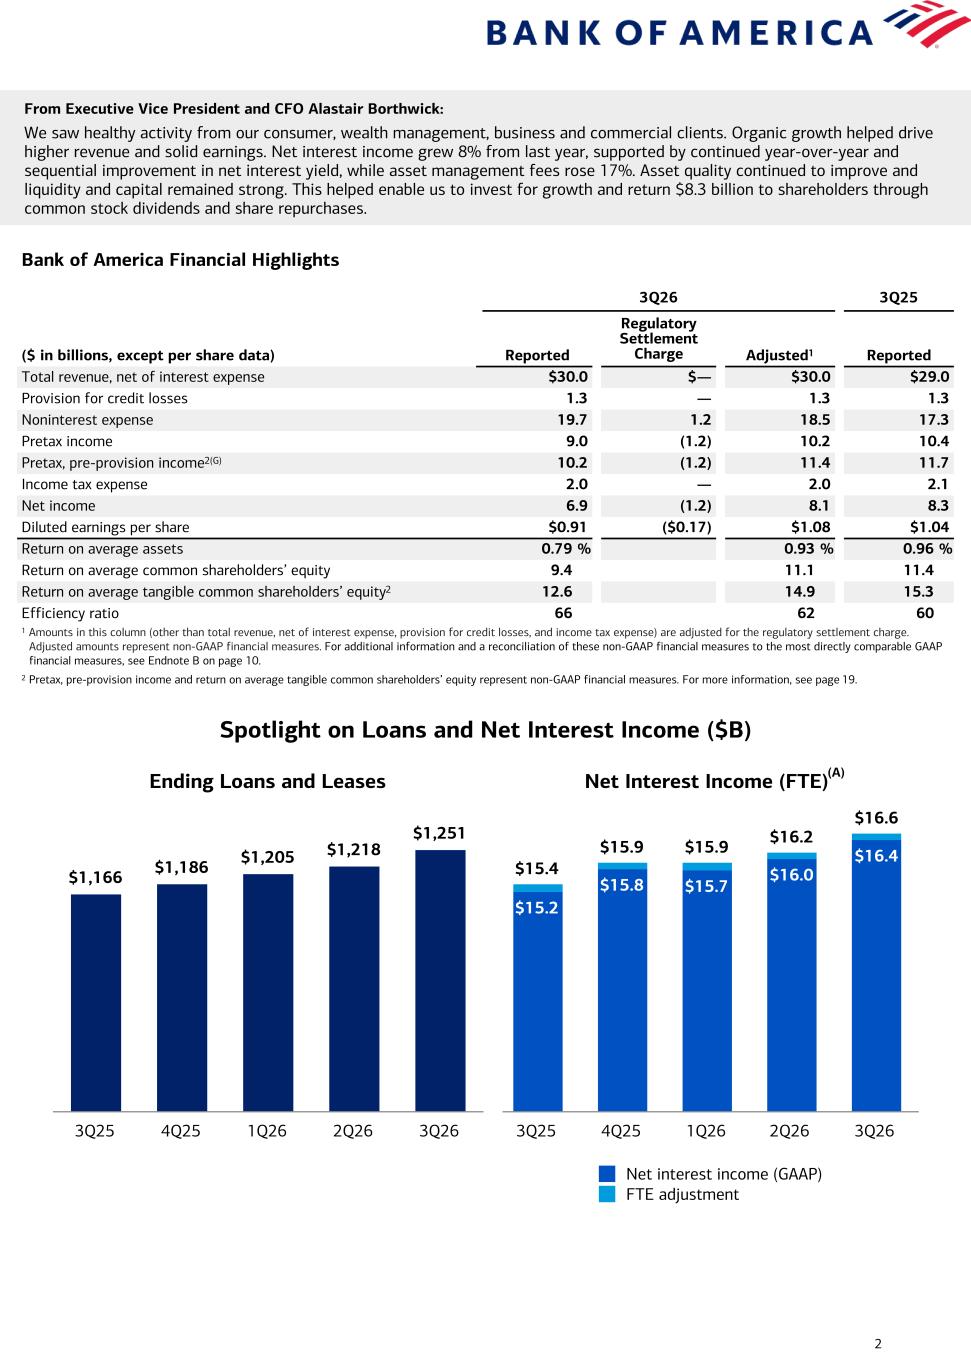
2 Net Interest Income (FTE) $15.4 $15.9 $15.9 $16.2 $16.6 $15.2 $15.8 $15.7 $16.0 $16.4 Net interest income (GAAP) FTE adjustment 3Q25 4Q25 1Q26 2Q26 3Q26 Ending Loans and Leases $1,166 $1,186 $1,205 $1,218 $1,251 3Q25 4Q25 1Q26 2Q26 3Q26 Spotlight on Loans and Net Interest Income ($B) (A) From Executive Vice President and CFO Alastair Borthwick: We saw healthy activity from our consumer, wealth management, business and commercial clients. Organic growth helped drive higher revenue and solid earnings. Net interest income grew 8% from last year, supported by continued year-over-year and sequential improvement in net interest yield, while asset management fees rose 17%. Asset quality continued to improve and liquidity and capital remained strong. This helped enable us to invest for growth and return $8.3 billion to shareholders through common stock dividends and share repurchases. Bank of America Financial Highlights 3Q26 3Q25 ($ in billions, except per share data) Reported Regulatory Settlement Charge Adjusted1 Reported Total revenue, net of interest expense $30.0 $— $30.0 $29.0 Provision for credit losses 1.3 — 1.3 1.3 Noninterest expense 19.7 1.2 18.5 17.3 Pretax income 9.0 (1.2) 10.2 10.4 Pretax, pre-provision income2(G) 10.2 (1.2) 11.4 11.7 Income tax expense 2.0 — 2.0 2.1 Net income 6.9 (1.2) 8.1 8.3 Diluted earnings per share $0.91 ($0.17) $1.08 $1.04 Return on average assets 0.79 % 0.93 % 0.96 % Return on average common shareholders’ equity 9.4 11.1 11.4 Return on average tangible common shareholders’ equity2 12.6 14.9 15.3 Efficiency ratio 66 62 60 1 Amounts in this column (other than total revenue, net of interest expense, provision for credit losses, and income tax expense) are adjusted for the regulatory settlement charge. Adjusted amounts represent non-GAAP financial measures. For additional information and a reconciliation of these non-GAAP financial measures to the most directly comparable GAAP financial measures, see Endnote B on page 10. 2 Pretax, pre-provision income and return on average tangible common shareholders’ equity represent non-GAAP financial measures. For more information, see page 19.
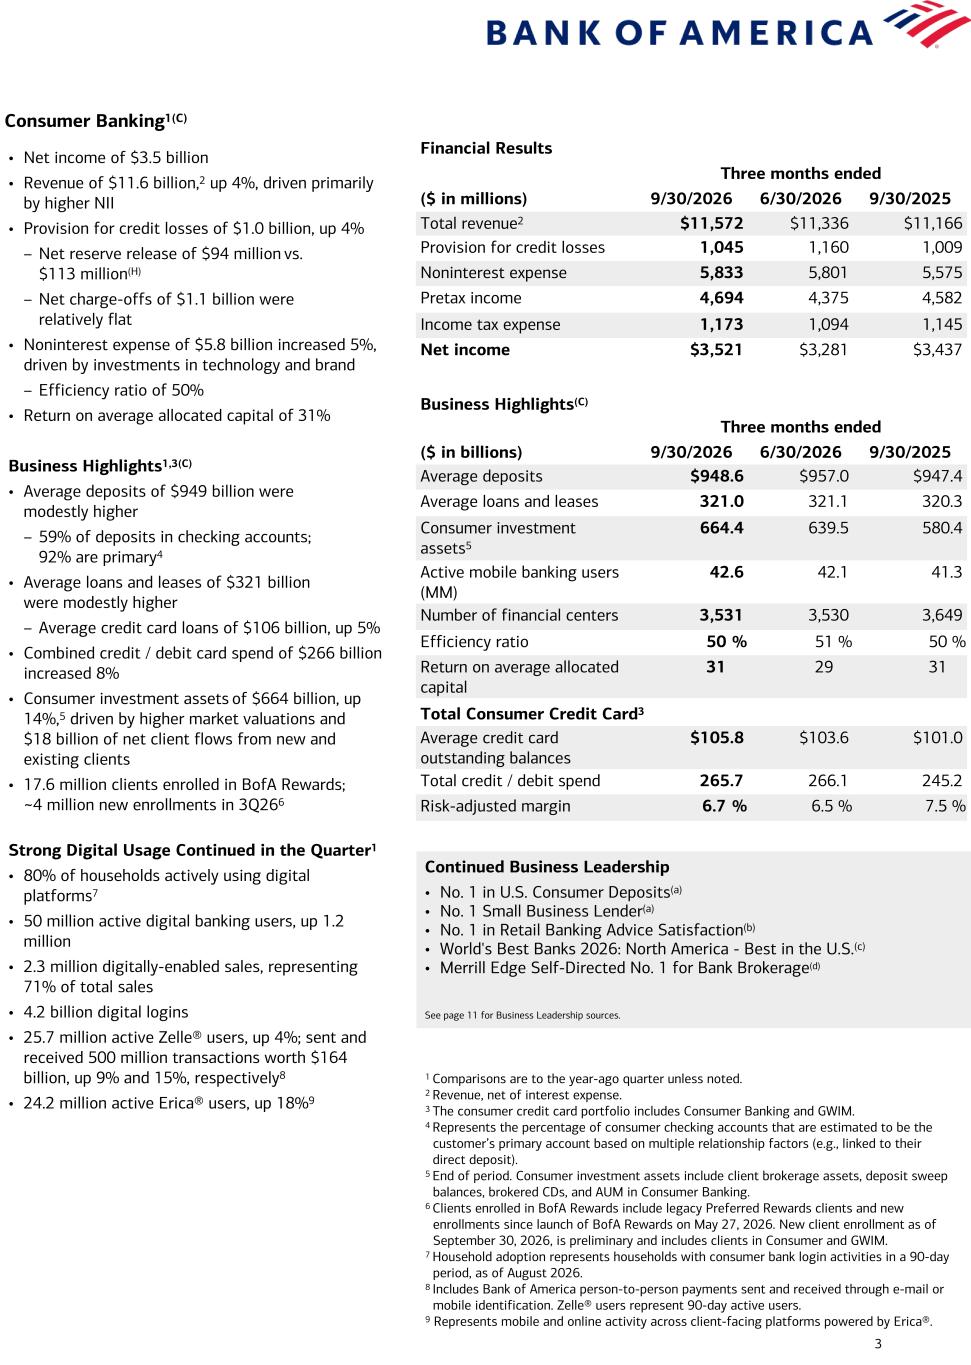
3 Consumer Banking1(C) Financial Results Three months ended ($ in millions) 9/30/2026 6/30/2026 9/30/2025 Total revenue2 $11,572 $11,336 $11,166 Provision for credit losses 1,045 1,160 1,009 Noninterest expense 5,833 5,801 5,575 Pretax income 4,694 4,375 4,582 Income tax expense 1,173 1,094 1,145 Net income $3,521 $3,281 $3,437 Business Highlights(C) Three months ended ($ in billions) 9/30/2026 6/30/2026 9/30/2025 Average deposits $948.6 $957.0 $947.4 Average loans and leases 321.0 321.1 320.3 Consumer investment assets5 664.4 639.5 580.4 Active mobile banking users (MM) 42.6 42.1 41.3 Number of financial centers 3,531 3,530 3,649 Efficiency ratio 50 % 51 % 50 % Return on average allocated capital 31 29 31 Total Consumer Credit Card3 Average credit card outstanding balances $105.8 $103.6 $101.0 Total credit / debit spend 265.7 266.1 245.2 Risk-adjusted margin 6.7 % 6.5 % 7.5 % • Net income of $3.5 billion • Revenue of $11.6 billion,2 up 4%, driven primarily by higher NII • Provision for credit losses of $1.0 billion, up 4% – Net reserve release of $94 million vs. $113 million(H) – Net charge-offs of $1.1 billion were relatively flat • Noninterest expense of $5.8 billion increased 5%, driven by investments in technology and brand – Efficiency ratio of 50% • Return on average allocated capital of 31% Business Highlights1,3(C) • Average deposits of $949 billion were modestly higher – 59% of deposits in checking accounts; 92% are primary4 • Average loans and leases of $321 billion were modestly higher – Average credit card loans of $106 billion, up 5% • Combined credit / debit card spend of $266 billion increased 8% • Consumer investment assets of $664 billion, up 14%,5 driven by higher market valuations and $18 billion of net client flows from new and existing clients • 17.6 million clients enrolled in BofA Rewards; ~4 million new enrollments in 3Q266 Strong Digital Usage Continued in the Quarter1 • 80% of households actively using digital platforms7 • 50 million active digital banking users, up 1.2 million • 2.3 million digitally-enabled sales, representing 71% of total sales • 4.2 billion digital logins • 25.7 million active Zelle® users, up 4%; sent and received 500 million transactions worth $164 billion, up 9% and 15%, respectively8 • 24.2 million active Erica® users, up 18%9 Continued Business Leadership • No. 1 in U.S. Consumer Deposits(a) • No. 1 Small Business Lender(a) • No. 1 in Retail Banking Advice Satisfaction(b) • World's Best Banks 2026: North America - Best in the U.S.(c) • Merrill Edge Self-Directed No. 1 for Bank Brokerage(d) See page 11 for Business Leadership sources. 1 Comparisons are to the year-ago quarter unless noted. 2 Revenue, net of interest expense. 3 The consumer credit card portfolio includes Consumer Banking and GWIM. 4 Represents the percentage of consumer checking accounts that are estimated to be the customer’s primary account based on multiple relationship factors (e.g., linked to their direct deposit). 5 End of period. Consumer investment assets include client brokerage assets, deposit sweep balances, brokered CDs, and AUM in Consumer Banking. 6 Clients enrolled in BofA Rewards include legacy Preferred Rewards clients and new enrollments since launch of BofA Rewards on May 27, 2026. New client enrollment as of September 30, 2026, is preliminary and includes clients in Consumer and GWIM. 7 Household adoption represents households with consumer bank login activities in a 90-day period, as of August 2026. 8 Includes Bank of America person-to-person payments sent and received through e-mail or mobile identification. Zelle® users represent 90-day active users. 9 Represents mobile and online activity across client-facing platforms powered by Erica®.
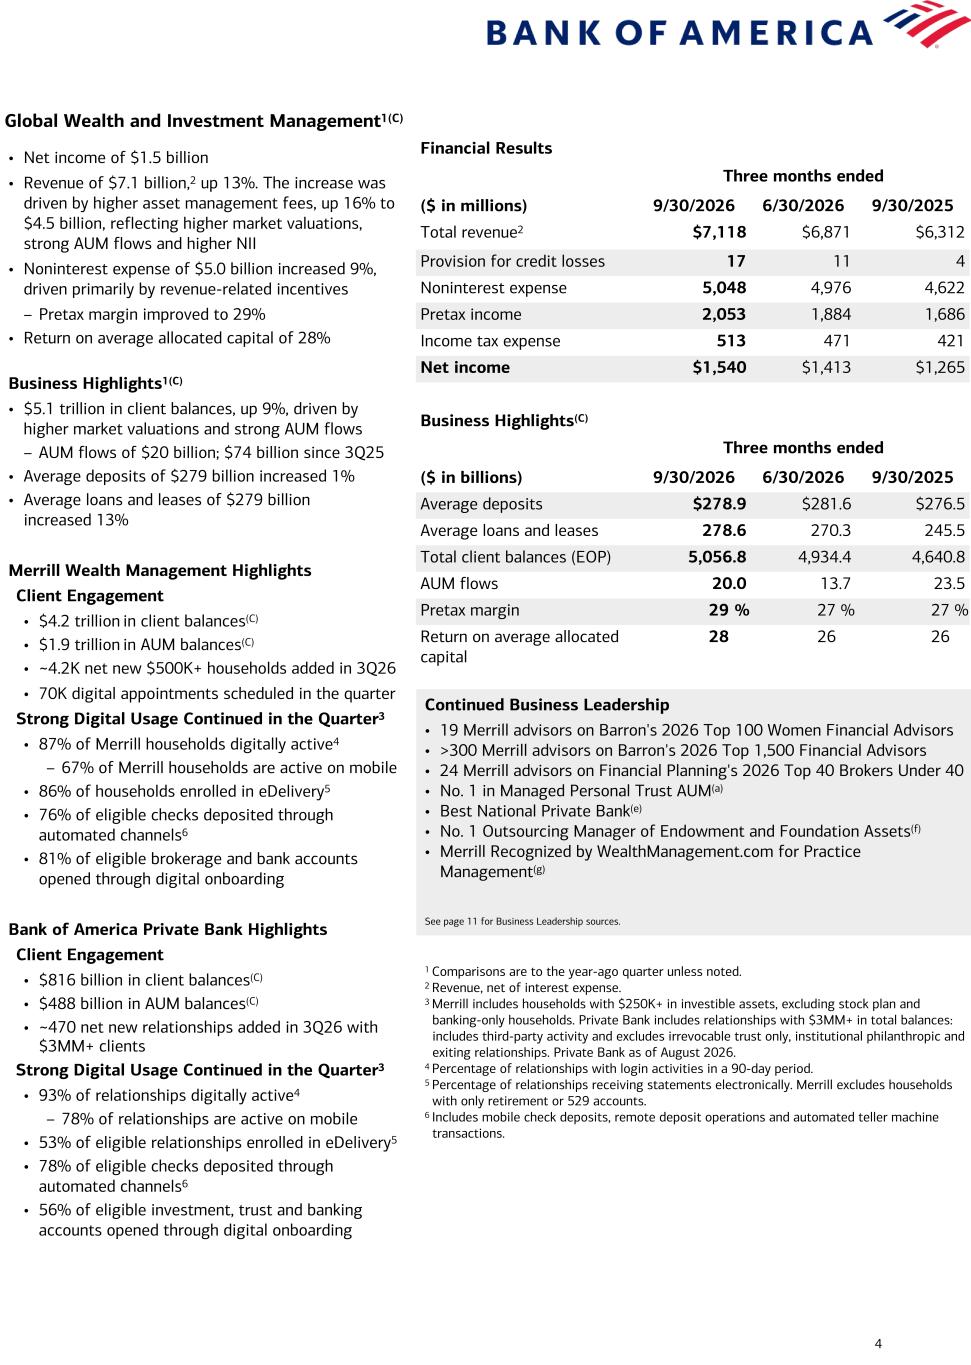
4 Global Wealth and Investment Management1(C) Financial Results Three months ended ($ in millions) 9/30/2026 6/30/2026 9/30/2025 Total revenue2 $7,118 $6,871 $6,312 Provision for credit losses 17 11 4 Noninterest expense 5,048 4,976 4,622 Pretax income 2,053 1,884 1,686 Income tax expense 513 471 421 Net income $1,540 $1,413 $1,265 Business Highlights(C) Three months ended ($ in billions) 9/30/2026 6/30/2026 9/30/2025 Average deposits $278.9 $281.6 $276.5 Average loans and leases 278.6 270.3 245.5 Total client balances (EOP) 5,056.8 4,934.4 4,640.8 AUM flows 20.0 13.7 23.5 Pretax margin 29 % 27 % 27 % Return on average allocated capital 28 26 26 Continued Business Leadership • 19 Merrill advisors on Barron's 2026 Top 100 Women Financial Advisors • >300 Merrill advisors on Barron's 2026 Top 1,500 Financial Advisors • 24 Merrill advisors on Financial Planning's 2026 Top 40 Brokers Under 40 • No. 1 in Managed Personal Trust AUM(a) • Best National Private Bank(e) • No. 1 Outsourcing Manager of Endowment and Foundation Assets(f) • Merrill Recognized by WealthManagement.com for Practice Management(g) See page 11 for Business Leadership sources. • Net income of $1.5 billion • Revenue of $7.1 billion,2 up 13%. The increase was driven by higher asset management fees, up 16% to $4.5 billion, reflecting higher market valuations, strong AUM flows and higher NII • Noninterest expense of $5.0 billion increased 9%, driven primarily by revenue-related incentives – Pretax margin improved to 29% • Return on average allocated capital of 28% Business Highlights1(C) • $5.1 trillion in client balances, up 9%, driven by higher market valuations and strong AUM flows – AUM flows of $20 billion; $74 billion since 3Q25 • Average deposits of $279 billion increased 1% • Average loans and leases of $279 billion increased 13% Merrill Wealth Management Highlights Client Engagement • $4.2 trillion in client balances(C) • $1.9 trillion in AUM balances(C) • ~4.2K net new $500K+ households added in 3Q26 • 70K digital appointments scheduled in the quarter Strong Digital Usage Continued in the Quarter3 • 87% of Merrill households digitally active4 – 67% of Merrill households are active on mobile • 86% of households enrolled in eDelivery5 • 76% of eligible checks deposited through automated channels6 • 81% of eligible brokerage and bank accounts opened through digital onboarding Bank of America Private Bank Highlights Client Engagement • $816 billion in client balances(C) • $488 billion in AUM balances(C) • ~470 net new relationships added in 3Q26 with $3MM+ clients Strong Digital Usage Continued in the Quarter3 • 93% of relationships digitally active4 – 78% of relationships are active on mobile • 53% of eligible relationships enrolled in eDelivery5 • 78% of eligible checks deposited through automated channels6 • 56% of eligible investment, trust and banking accounts opened through digital onboarding 1 Comparisons are to the year-ago quarter unless noted. 2 Revenue, net of interest expense. 3 Merrill includes households with $250K+ in investible assets, excluding stock plan and banking-only households. Private Bank includes relationships with $3MM+ in total balances: includes third-party activity and excludes irrevocable trust only, institutional philanthropic and exiting relationships. Private Bank as of August 2026. 4 Percentage of relationships with login activities in a 90-day period. 5 Percentage of relationships receiving statements electronically. Merrill excludes households with only retirement or 529 accounts. 6 Includes mobile check deposits, remote deposit operations and automated teller machine transactions.
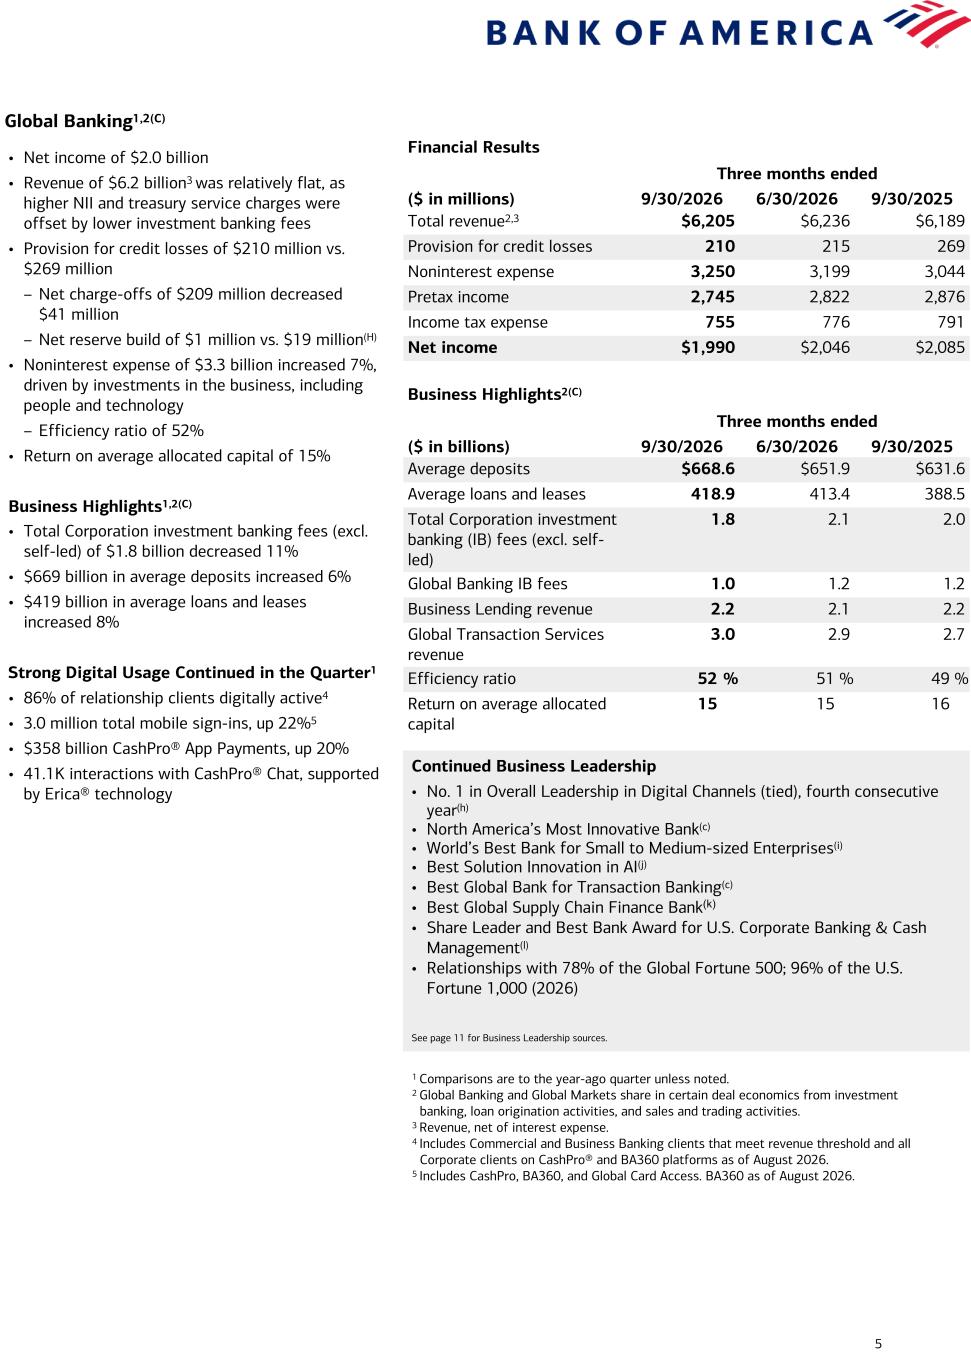
5 Global Banking1,2(C) Financial Results Three months ended ($ in millions) 9/30/2026 6/30/2026 9/30/2025 Total revenue2,3 $6,205 $6,236 $6,189 Provision for credit losses 210 215 269 Noninterest expense 3,250 3,199 3,044 Pretax income 2,745 2,822 2,876 Income tax expense 755 776 791 Net income $1,990 $2,046 $2,085 Business Highlights2(C) Three months ended ($ in billions) 9/30/2026 6/30/2026 9/30/2025 Average deposits $668.6 $651.9 $631.6 Average loans and leases 418.9 413.4 388.5 Total Corporation investment banking (IB) fees (excl. self- led) 1.8 2.1 2.0 Global Banking IB fees 1.0 1.2 1.2 Business Lending revenue 2.2 2.1 2.2 Global Transaction Services revenue 3.0 2.9 2.7 Efficiency ratio 52 % 51 % 49 % Return on average allocated capital 15 15 16 • Net income of $2.0 billion • Revenue of $6.2 billion3 was relatively flat, as higher NII and treasury service charges were offset by lower investment banking fees • Provision for credit losses of $210 million vs. $269 million – Net charge-offs of $209 million decreased $41 million – Net reserve build of $1 million vs. $19 million(H) • Noninterest expense of $3.3 billion increased 7%, driven by investments in the business, including people and technology – Efficiency ratio of 52% • Return on average allocated capital of 15% Business Highlights1,2(C) • Total Corporation investment banking fees (excl. self-led) of $1.8 billion decreased 11% • $669 billion in average deposits increased 6% • $419 billion in average loans and leases increased 8% Strong Digital Usage Continued in the Quarter1 • 86% of relationship clients digitally active4 • 3.0 million total mobile sign-ins, up 22%5 • $358 billion CashPro® App Payments, up 20% • 41.1K interactions with CashPro® Chat, supported by Erica® technology Continued Business Leadership • No. 1 in Overall Leadership in Digital Channels (tied), fourth consecutive year(h) • North America’s Most Innovative Bank(c) • World’s Best Bank for Small to Medium-sized Enterprises(i) • Best Solution Innovation in AI(j) • Best Global Bank for Transaction Banking(c) • Best Global Supply Chain Finance Bank(k) • Share Leader and Best Bank Award for U.S. Corporate Banking & Cash Management(l) • Relationships with 78% of the Global Fortune 500; 96% of the U.S. Fortune 1,000 (2026) See page 11 for Business Leadership sources. 1 Comparisons are to the year-ago quarter unless noted. 2 Global Banking and Global Markets share in certain deal economics from investment banking, loan origination activities, and sales and trading activities. 3 Revenue, net of interest expense. 4 Includes Commercial and Business Banking clients that meet revenue threshold and all Corporate clients on CashPro® and BA360 platforms as of August 2026. 5 Includes CashPro, BA360, and Global Card Access. BA360 as of August 2026.
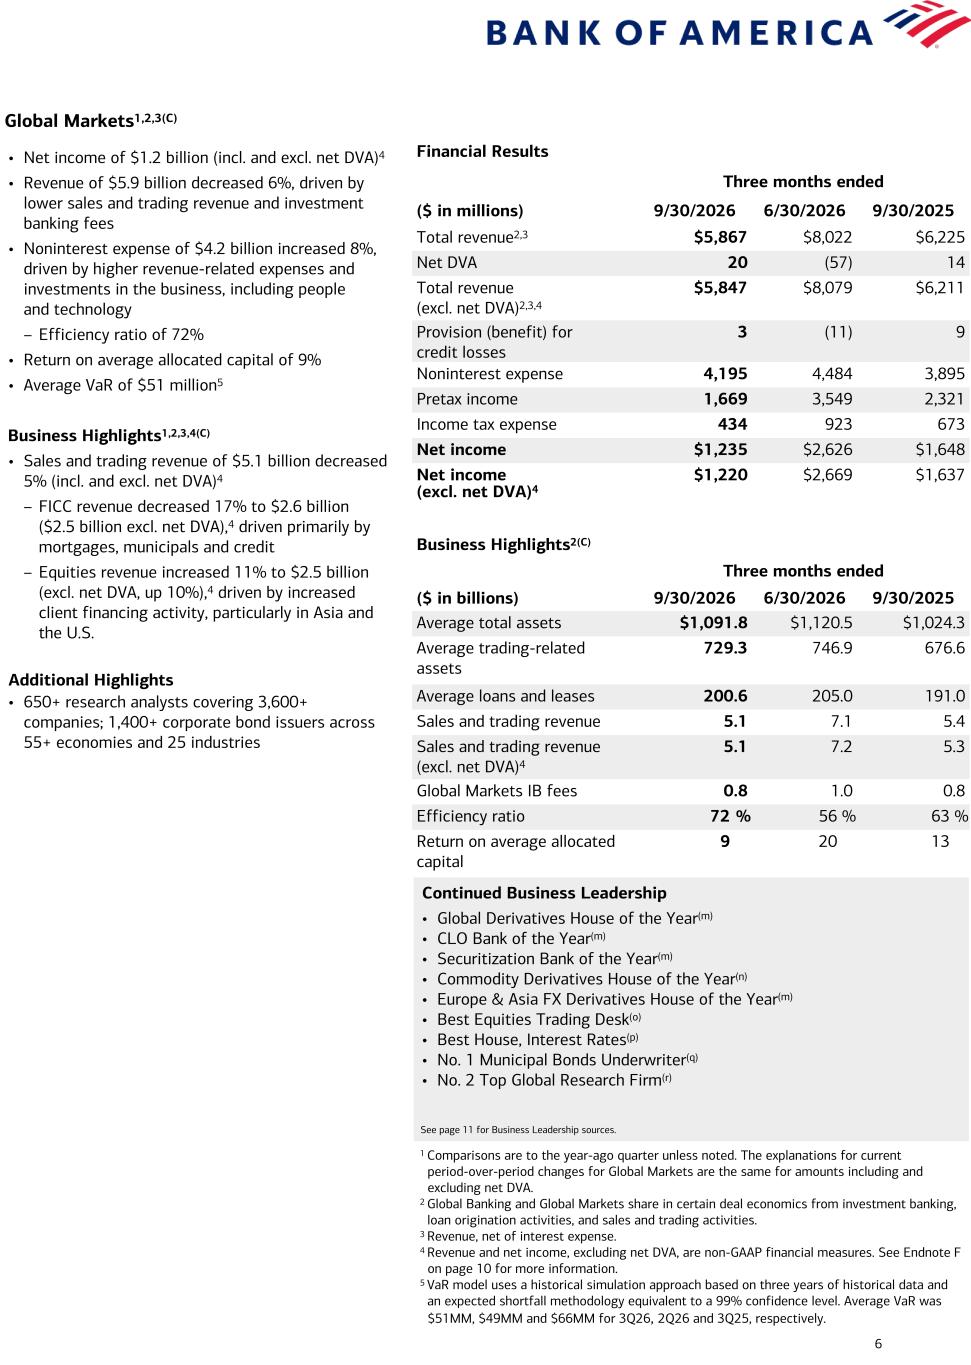
6 Global Markets1,2,3(C) Financial Results Three months ended ($ in millions) 9/30/2026 6/30/2026 9/30/2025 Total revenue2,3 $5,867 $8,022 $6,225 Net DVA 20 (57) 14 Total revenue (excl. net DVA)2,3,4 $5,847 $8,079 $6,211 Provision (benefit) for credit losses 3 (11) 9 Noninterest expense 4,195 4,484 3,895 Pretax income 1,669 3,549 2,321 Income tax expense 434 923 673 Net income $1,235 $2,626 $1,648 Net income (excl. net DVA)4 $1,220 $2,669 $1,637 Business Highlights2(C) Three months ended ($ in billions) 9/30/2026 6/30/2026 9/30/2025 Average total assets $1,091.8 $1,120.5 $1,024.3 Average trading-related assets 729.3 746.9 676.6 Average loans and leases 200.6 205.0 191.0 Sales and trading revenue 5.1 7.1 5.4 Sales and trading revenue (excl. net DVA)4 5.1 7.2 5.3 Global Markets IB fees 0.8 1.0 0.8 Efficiency ratio 72 % 56 % 63 % Return on average allocated capital 9 20 13 • Net income of $1.2 billion (incl. and excl. net DVA)4 • Revenue of $5.9 billion decreased 6%, driven by lower sales and trading revenue and investment banking fees • Noninterest expense of $4.2 billion increased 8%, driven by higher revenue-related expenses and investments in the business, including people and technology – Efficiency ratio of 72% • Return on average allocated capital of 9% • Average VaR of $51 million5 Business Highlights1,2,3,4(C) • Sales and trading revenue of $5.1 billion decreased 5% (incl. and excl. net DVA)4 – FICC revenue decreased 17% to $2.6 billion ($2.5 billion excl. net DVA),4 driven primarily by mortgages, municipals and credit – Equities revenue increased 11% to $2.5 billion (excl. net DVA, up 10%),4 driven by increased client financing activity, particularly in Asia and the U.S. Additional Highlights • 650+ research analysts covering 3,600+ companies; 1,400+ corporate bond issuers across 55+ economies and 25 industries Continued Business Leadership • Global Derivatives House of the Year(m) • CLO Bank of the Year(m) • Securitization Bank of the Year(m) • Commodity Derivatives House of the Year(n) • Europe & Asia FX Derivatives House of the Year(m) • Best Equities Trading Desk(o) • Best House, Interest Rates(p) • No. 1 Municipal Bonds Underwriter(q) • No. 2 Top Global Research Firm(r) See page 11 for Business Leadership sources. 1 Comparisons are to the year-ago quarter unless noted. The explanations for current period-over-period changes for Global Markets are the same for amounts including and excluding net DVA. 2 Global Banking and Global Markets share in certain deal economics from investment banking, loan origination activities, and sales and trading activities. 3 Revenue, net of interest expense. 4 Revenue and net income, excluding net DVA, are non-GAAP financial measures. See Endnote F on page 10 for more information. 5 VaR model uses a historical simulation approach based on three years of historical data and an expected shortfall methodology equivalent to a 99% confidence level. Average VaR was $51MM, $49MM and $66MM for 3Q26, 2Q26 and 3Q25, respectively.
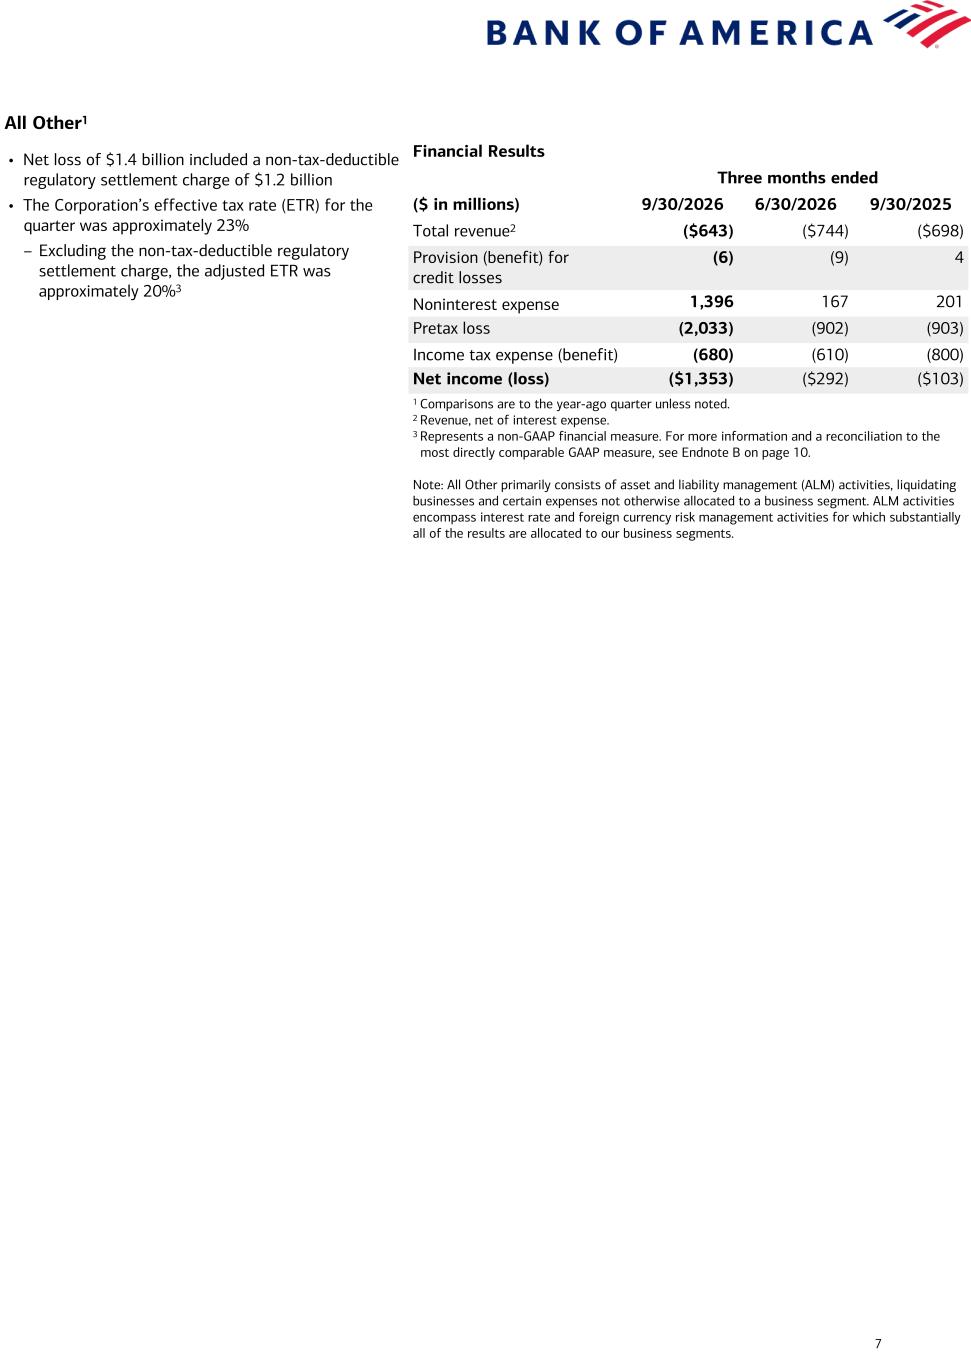
7 All Other1 Financial Results Three months ended ($ in millions) 9/30/2026 6/30/2026 9/30/2025 Total revenue2 ($643) ($744) ($698) Provision (benefit) for credit losses (6) (9) 4 Noninterest expense 1,396 167 201 Pretax loss (2,033) (902) (903) Income tax expense (benefit) (680) (610) (800) Net income (loss) ($1,353) ($292) ($103) 1 Comparisons are to the year-ago quarter unless noted. 2 Revenue, net of interest expense. 3 Represents a non-GAAP financial measure. For more information and a reconciliation to the most directly comparable GAAP measure, see Endnote B on page 10. Note: All Other primarily consists of asset and liability management (ALM) activities, liquidating businesses and certain expenses not otherwise allocated to a business segment. ALM activities encompass interest rate and foreign currency risk management activities for which substantially all of the results are allocated to our business segments. • Net loss of $1.4 billion included a non-tax-deductible regulatory settlement charge of $1.2 billion • The Corporation’s effective tax rate (ETR) for the quarter was approximately 23% – Excluding the non-tax-deductible regulatory settlement charge, the adjusted ETR was approximately 20%3
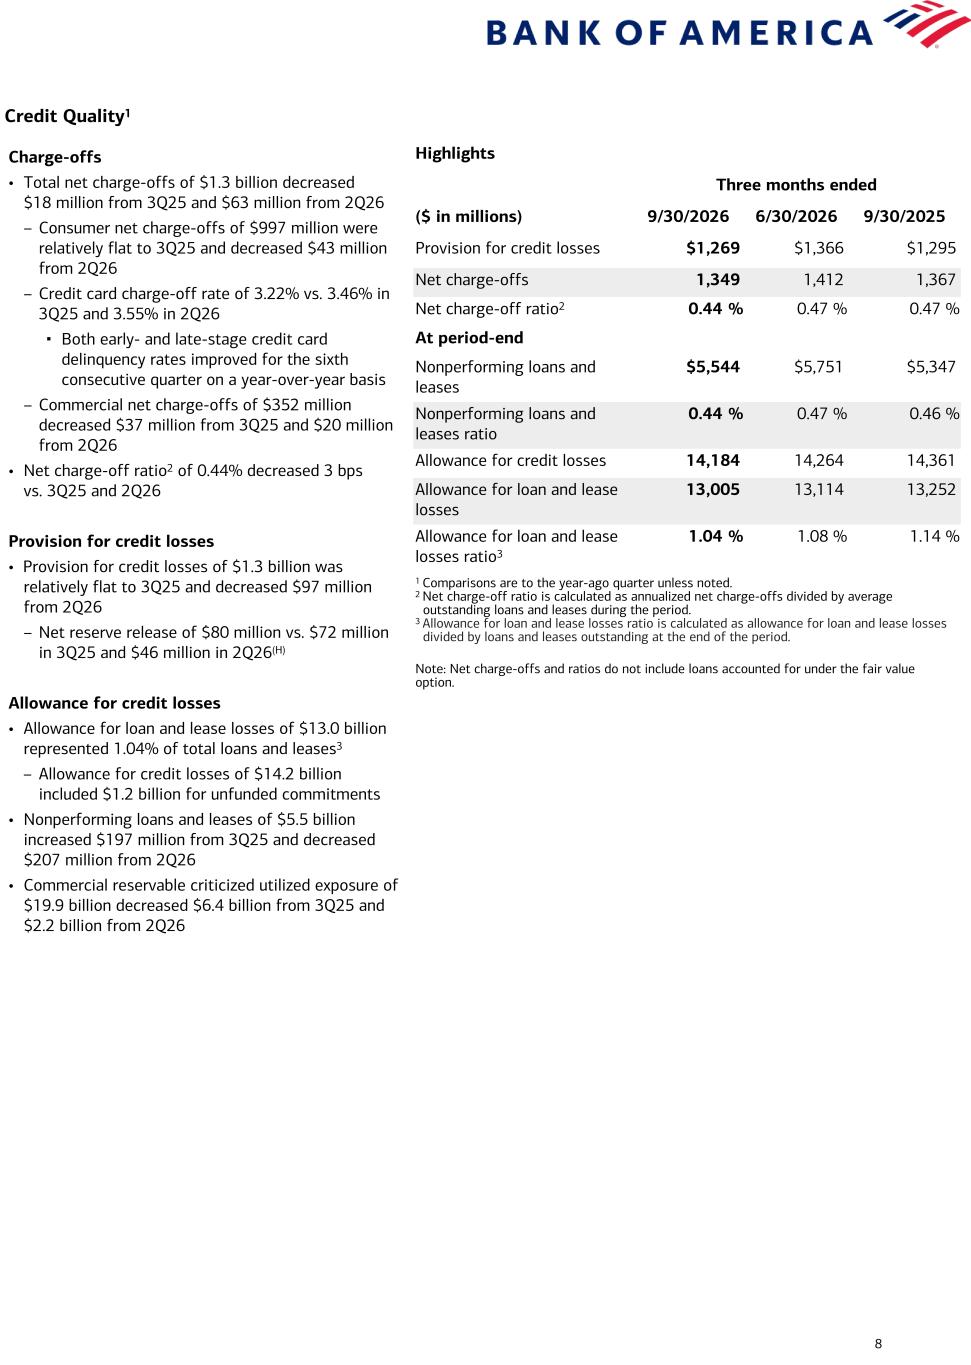
8 Credit Quality1 Highlights Three months ended ($ in millions) 9/30/2026 6/30/2026 9/30/2025 Provision for credit losses $1,269 $1,366 $1,295 Net charge-offs 1,349 1,412 1,367 Net charge-off ratio2 0.44 % 0.47 % 0.47 % At period-end Nonperforming loans and leases $5,544 $5,751 $5,347 Nonperforming loans and leases ratio 0.44 % 0.47 % 0.46 % Allowance for credit losses 14,184 14,264 14,361 Allowance for loan and lease losses 13,005 13,114 13,252 Allowance for loan and lease losses ratio3 1.04 % 1.08 % 1.14 % 1 Comparisons are to the year-ago quarter unless noted. 2 Net charge-off ratio is calculated as annualized net charge-offs divided by average outstanding loans and leases during the period. 3 Allowance for loan and lease losses ratio is calculated as allowance for loan and lease losses divided by loans and leases outstanding at the end of the period. Note: Net charge-offs and ratios do not include loans accounted for under the fair value option. Charge-offs • Total net charge-offs of $1.3 billion decreased $18 million from 3Q25 and $63 million from 2Q26 – Consumer net charge-offs of $997 million were relatively flat to 3Q25 and decreased $43 million from 2Q26 – Credit card charge-off rate of 3.22% vs. 3.46% in 3Q25 and 3.55% in 2Q26 ▪ Both early- and late-stage credit card delinquency rates improved for the sixth consecutive quarter on a year-over-year basis – Commercial net charge-offs of $352 million decreased $37 million from 3Q25 and $20 million from 2Q26 • Net charge-off ratio2 of 0.44% decreased 3 bps vs. 3Q25 and 2Q26 Provision for credit losses • Provision for credit losses of $1.3 billion was relatively flat to 3Q25 and decreased $97 million from 2Q26 – Net reserve release of $80 million vs. $72 million in 3Q25 and $46 million in 2Q26(H) Allowance for credit losses • Allowance for loan and lease losses of $13.0 billion represented 1.04% of total loans and leases3 – Allowance for credit losses of $14.2 billion included $1.2 billion for unfunded commitments • Nonperforming loans and leases of $5.5 billion increased $197 million from 3Q25 and decreased $207 million from 2Q26 • Commercial reservable criticized utilized exposure of $19.9 billion decreased $6.4 billion from 3Q25 and $2.2 billion from 2Q26
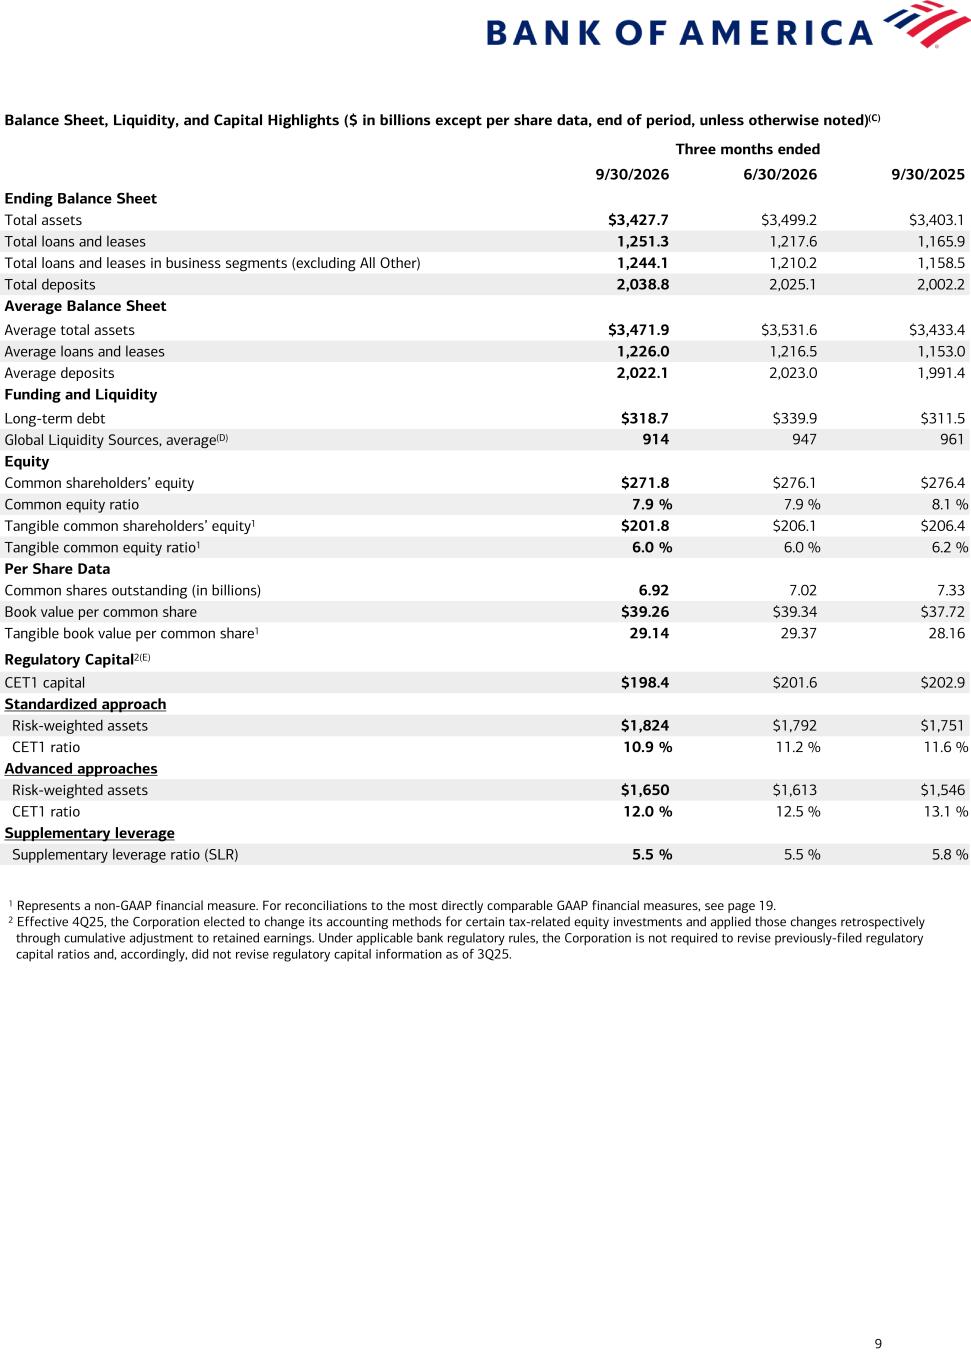
9 Balance Sheet, Liquidity, and Capital Highlights ($ in billions except per share data, end of period, unless otherwise noted)(C) Three months ended 9/30/2026 6/30/2026 9/30/2025 Ending Balance Sheet Total assets $3,427.7 $3,499.2 $3,403.1 Total loans and leases 1,251.3 1,217.6 1,165.9 Total loans and leases in business segments (excluding All Other) 1,244.1 1,210.2 1,158.5 Total deposits 2,038.8 2,025.1 2,002.2 Average Balance Sheet Average total assets $3,471.9 $3,531.6 $3,433.4 Average loans and leases 1,226.0 1,216.5 1,153.0 Average deposits 2,022.1 2,023.0 1,991.4 Funding and Liquidity Long-term debt $318.7 $339.9 $311.5 Global Liquidity Sources, average(D) 914 947 961 Equity Common shareholders’ equity $271.8 $276.1 $276.4 Common equity ratio 7.9 % 7.9 % 8.1 % Tangible common shareholders’ equity1 $201.8 $206.1 $206.4 Tangible common equity ratio1 6.0 % 6.0 % 6.2 % Per Share Data Common shares outstanding (in billions) 6.92 7.02 7.33 Book value per common share $39.26 $39.34 $37.72 Tangible book value per common share1 29.14 29.37 28.16 Regulatory Capital2(E) CET1 capital $198.4 $201.6 $202.9 Standardized approach Risk-weighted assets $1,824 $1,792 $1,751 CET1 ratio 10.9 % 11.2 % 11.6 % Advanced approaches Risk-weighted assets $1,650 $1,613 $1,546 CET1 ratio 12.0 % 12.5 % 13.1 % Supplementary leverage Supplementary leverage ratio (SLR) 5.5 % 5.5 % 5.8 % 1 Represents a non-GAAP financial measure. For reconciliations to the most directly comparable GAAP financial measures, see page 19. 2 Effective 4Q25, the Corporation elected to change its accounting methods for certain tax-related equity investments and applied those changes retrospectively through cumulative adjustment to retained earnings. Under applicable bank regulatory rules, the Corporation is not required to revise previously-filed regulatory capital ratios and, accordingly, did not revise regulatory capital information as of 3Q25.
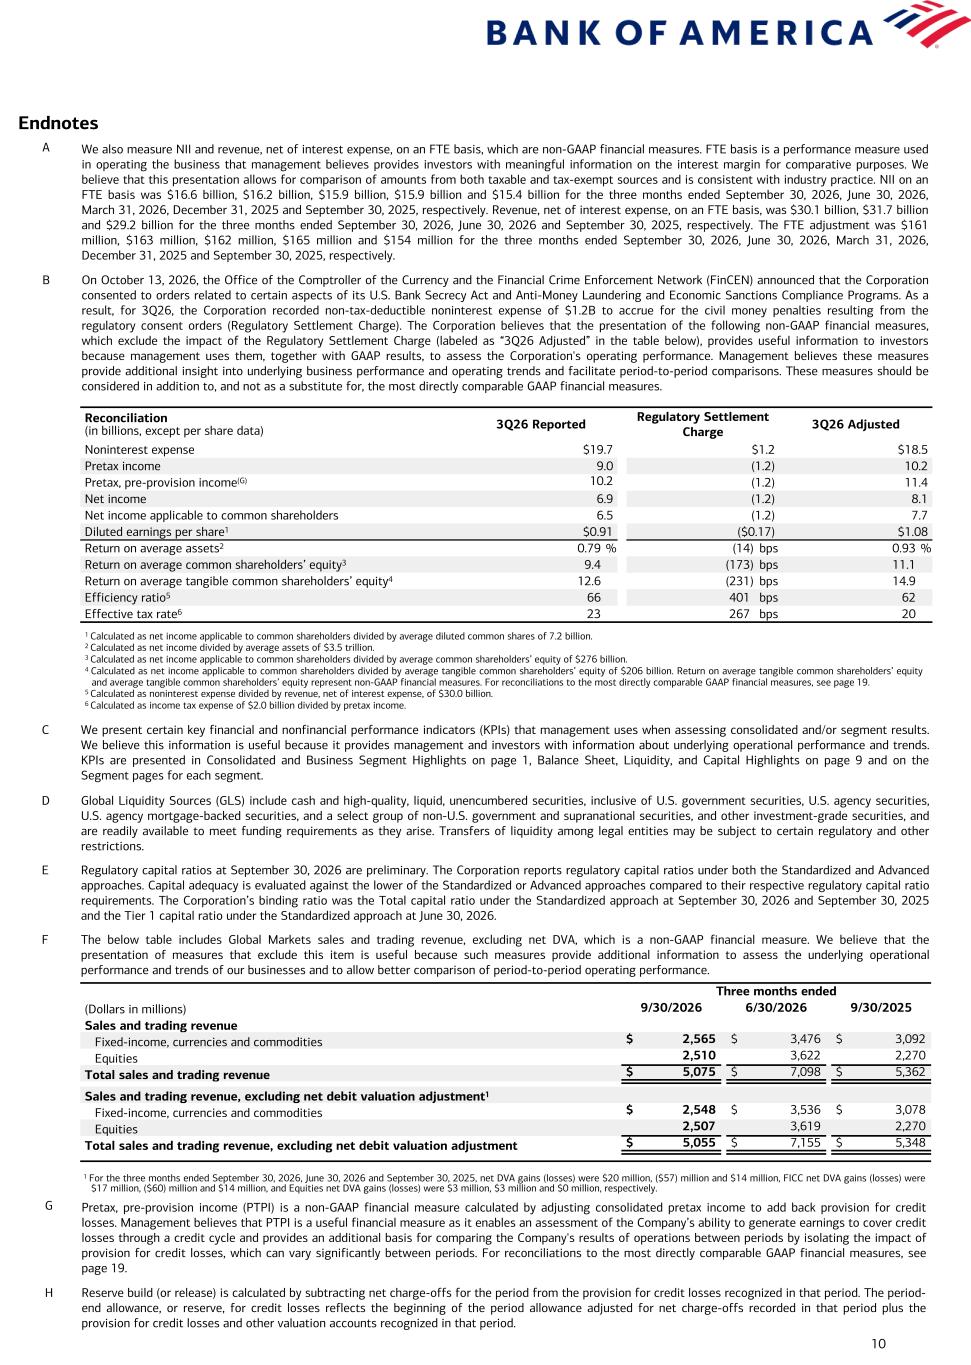
10 Endnotes A We also measure NII and revenue, net of interest expense, on an FTE basis, which are non-GAAP financial measures. FTE basis is a performance measure used in operating the business that management believes provides investors with meaningful information on the interest margin for comparative purposes. We believe that this presentation allows for comparison of amounts from both taxable and tax-exempt sources and is consistent with industry practice. NII on an FTE basis was $16.6 billion, $16.2 billion, $15.9 billion, $15.9 billion and $15.4 billion for the three months ended September 30, 2026, June 30, 2026, March 31, 2026, December 31, 2025 and September 30, 2025, respectively. Revenue, net of interest expense, on an FTE basis, was $30.1 billion, $31.7 billion and $29.2 billion for the three months ended September 30, 2026, June 30, 2026 and September 30, 2025, respectively. The FTE adjustment was $161 million, $163 million, $162 million, $165 million and $154 million for the three months ended September 30, 2026, June 30, 2026, March 31, 2026, December 31, 2025 and September 30, 2025, respectively. B On October 13, 2026, the Office of the Comptroller of the Currency and the Financial Crime Enforcement Network (FinCEN) announced that the Corporation consented to orders related to certain aspects of its U.S. Bank Secrecy Act and Anti-Money Laundering and Economic Sanctions Compliance Programs. As a result, for 3Q26, the Corporation recorded non-tax-deductible noninterest expense of $1.2B to accrue for the civil money penalties resulting from the regulatory consent orders (Regulatory Settlement Charge). The Corporation believes that the presentation of the following non-GAAP financial measures, which exclude the impact of the Regulatory Settlement Charge (labeled as “3Q26 Adjusted” in the table below), provides useful information to investors because management uses them, together with GAAP results, to assess the Corporation's operating performance. Management believes these measures provide additional insight into underlying business performance and operating trends and facilitate period-to-period comparisons. These measures should be considered in addition to, and not as a substitute for, the most directly comparable GAAP financial measures. C We present certain key financial and nonfinancial performance indicators (KPIs) that management uses when assessing consolidated and/or segment results. We believe this information is useful because it provides management and investors with information about underlying operational performance and trends. KPIs are presented in Consolidated and Business Segment Highlights on page 1, Balance Sheet, Liquidity, and Capital Highlights on page 9 and on the Segment pages for each segment. D Global Liquidity Sources (GLS) include cash and high-quality, liquid, unencumbered securities, inclusive of U.S. government securities, U.S. agency securities, U.S. agency mortgage-backed securities, and a select group of non-U.S. government and supranational securities, and other investment-grade securities, and are readily available to meet funding requirements as they arise. Transfers of liquidity among legal entities may be subject to certain regulatory and other restrictions. E Regulatory capital ratios at September 30, 2026 are preliminary. The Corporation reports regulatory capital ratios under both the Standardized and Advanced approaches. Capital adequacy is evaluated against the lower of the Standardized or Advanced approaches compared to their respective regulatory capital ratio requirements. The Corporation’s binding ratio was the Total capital ratio under the Standardized approach at September 30, 2026 and September 30, 2025 and the Tier 1 capital ratio under the Standardized approach at June 30, 2026. F The below table includes Global Markets sales and trading revenue, excluding net DVA, which is a non-GAAP financial measure. We believe that the presentation of measures that exclude this item is useful because such measures provide additional information to assess the underlying operational performance and trends of our businesses and to allow better comparison of period-to-period operating performance. Three months ended (Dollars in millions) 9/30/2026 6/30/2026 9/30/2025 Sales and trading revenue Fixed-income, currencies and commodities $ 2,565 $ 3,476 $ 3,092 Equities 2,510 3,622 2,270 Total sales and trading revenue $ 5,075 $ 7,098 $ 5,362 Sales and trading revenue, excluding net debit valuation adjustment1 Fixed-income, currencies and commodities $ 2,548 $ 3,536 $ 3,078 Equities 2,507 3,619 2,270 Total sales and trading revenue, excluding net debit valuation adjustment $ 5,055 $ 7,155 $ 5,348 G Pretax, pre-provision income (PTPI) is a non-GAAP financial measure calculated by adjusting consolidated pretax income to add back provision for credit losses. Management believes that PTPI is a useful financial measure as it enables an assessment of the Company’s ability to generate earnings to cover credit losses through a credit cycle and provides an additional basis for comparing the Company's results of operations between periods by isolating the impact of provision for credit losses, which can vary significantly between periods. For reconciliations to the most directly comparable GAAP financial measures, see page 19. H Reserve build (or release) is calculated by subtracting net charge-offs for the period from the provision for credit losses recognized in that period. The period- end allowance, or reserve, for credit losses reflects the beginning of the period allowance adjusted for net charge-offs recorded in that period plus the provision for credit losses and other valuation accounts recognized in that period. 1 For the three months ended September 30, 2026, June 30, 2026 and September 30, 2025, net DVA gains (losses) were $20 million, ($57) million and $14 million, FICC net DVA gains (losses) were $17 million, ($60) million and $14 million, and Equities net DVA gains (losses) were $3 million, $3 million and $0 million, respectively. 1 Calculated as net income applicable to common shareholders divided by average diluted common shares of 7.2 billion. 2 Calculated as net income divided by average assets of $3.5 trillion. 3 Calculated as net income applicable to common shareholders divided by average common shareholders’ equity of $276 billion. 4 Calculated as net income applicable to common shareholders divided by average tangible common shareholders’ equity of $206 billion. Return on average tangible common shareholders’ equity and average tangible common shareholders’ equity represent non-GAAP financial measures. For reconciliations to the most directly comparable GAAP financial measures, see page 19. 5 Calculated as noninterest expense divided by revenue, net of interest expense, of $30.0 billion. 6 Calculated as income tax expense of $2.0 billion divided by pretax income. Reconciliation (in billions, except per share data) 3Q26 Reported Regulatory Settlement Charge 3Q26 Adjusted Noninterest expense $19.7 $1.2 $18.5 Pretax income 9.0 (1.2) 10.2 Pretax, pre-provision income(G) 10.2 (1.2) 11.4 Net income 6.9 (1.2) 8.1 Net income applicable to common shareholders 6.5 (1.2) 7.7 Diluted earnings per share1 $0.91 ($0.17) $1.08 Return on average assets2 0.79 % (14) bps 0.93 % Return on average common shareholders’ equity3 9.4 (173) bps 11.1 Return on average tangible common shareholders’ equity4 12.6 (231) bps 14.9 Efficiency ratio5 66 401 bps 62 Effective tax rate6 23 267 bps 20
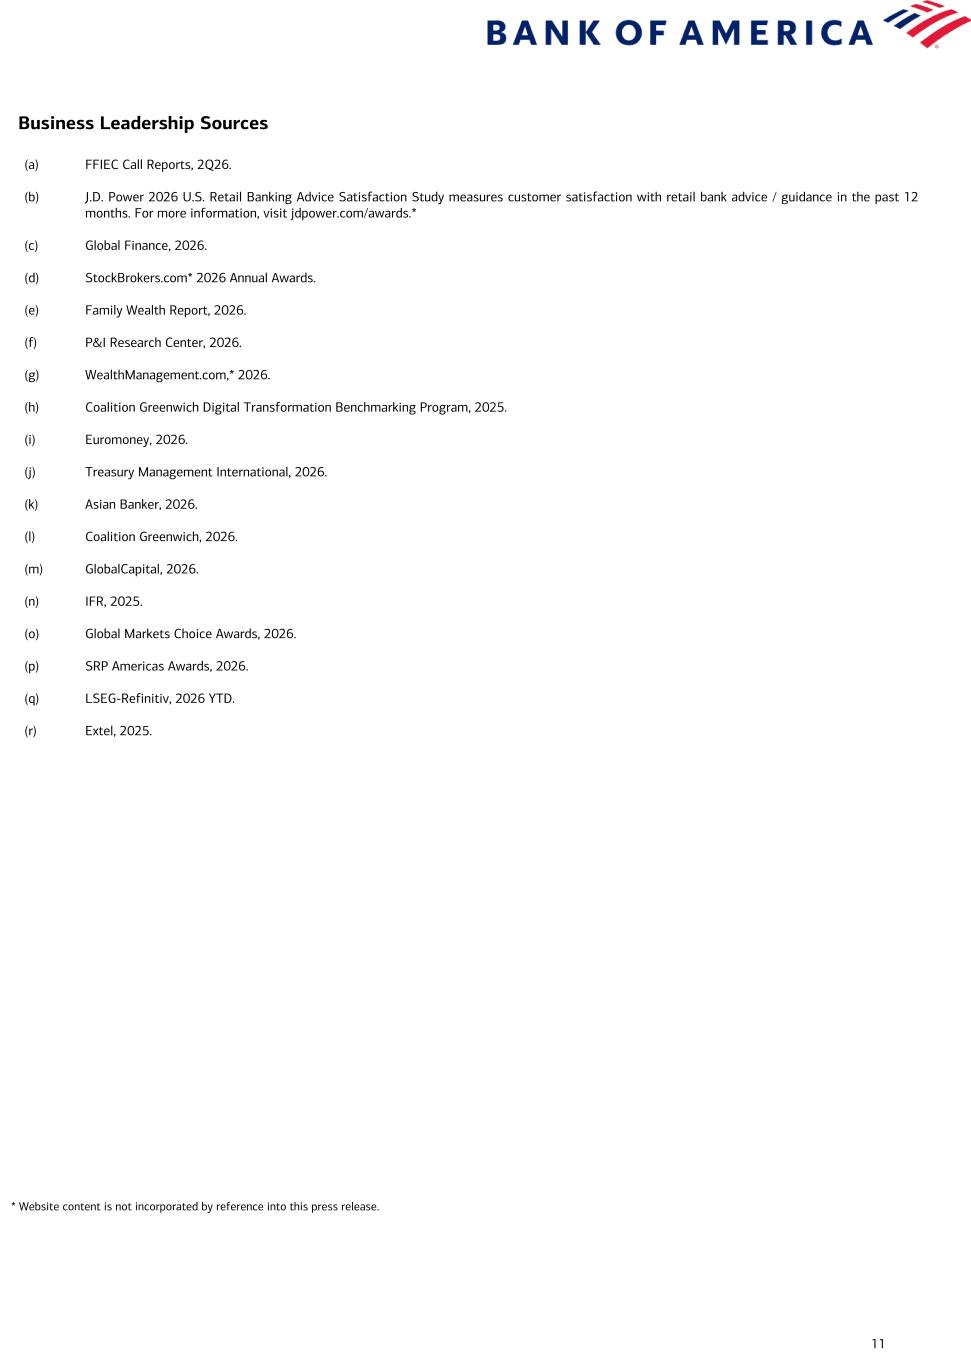
11 (a) FFIEC Call Reports, 2Q26. (b) J.D. Power 2026 U.S. Retail Banking Advice Satisfaction Study measures customer satisfaction with retail bank advice / guidance in the past 12 months. For more information, visit jdpower.com/awards.* (c) Global Finance, 2026. (d) StockBrokers.com* 2026 Annual Awards. (e) Family Wealth Report, 2026. (f) P&I Research Center, 2026. (g) WealthManagement.com,* 2026. (h) Coalition Greenwich Digital Transformation Benchmarking Program, 2025. (i) Euromoney, 2026. (j) Treasury Management International, 2026. (k) Asian Banker, 2026. (l) Coalition Greenwich, 2026. (m) GlobalCapital, 2026. (n) IFR, 2025. (o) Global Markets Choice Awards, 2026. (p) SRP Americas Awards, 2026. (q) LSEG-Refinitiv, 2026 YTD. (r) Extel, 2025. Business Leadership Sources * Website content is not incorporated by reference into this press release.
12 Contact Information and Investor Conference Call Invitation Investor Call Information Chair and CEO Brian Moynihan and Executive Vice President and CFO Alastair Borthwick will discuss third- quarter 2026 financial results in an investor conference call at 8:30 a.m. ET today. The conference call and presentation materials can be accessed on the Bank of America Investor Relations website at https:// investor.bankofamerica.com.* For a listen-only connection to the conference call, dial 1.877.200.4456 (U.S.) or 1.785.424.1732 (international). The conference ID is 79795. Please dial in 10 minutes prior to the start of the call. Investors can access replays of the conference call by visiting the Investor Relations website or by calling 1.800.934.4850 (U.S.) or 1.402.220.1178 (international) from noon October 14 through 11:59 p.m. ET on October 23. Investors May Contact: Lee McEntire, Bank of America Phone: 1.980.388.6780 lee.mcentire@bofa.com Jonathan G. Blum, Bank of America (Fixed Income) Phone: 1.212.449.3112 jonathan.blum@bofa.com Bank of America Bank of America is one of the world’s leading financial institutions, serving individual consumers, small and middle-market businesses and large corporations with a full range of banking, investing, asset management and other financial and risk management products and services. The company provides unmatched convenience in the United States, serving more than 69 million clients with approximately 3,500 retail financial centers, approximately 15,000 ATMs (automated teller machines) and award-winning digital banking with approximately 60 million verified digital users. Bank of America is a global leader in wealth management, corporate and investment banking and trading across a broad range of asset classes, serving corporations, governments, institutions and individuals around the world. As the #1 small business lender in the United States (FDIC), Bank of America offers industry-leading support to approximately 4 million small business households through a suite of innovative, easy- to-use online products and services. The company serves clients through operations across the United States, its territories and more than 35 countries and/or jurisdictions. Bank of America Corporation stock (NYSE: BAC) is listed on the New York Stock Exchange. Forward-Looking Statements Bank of America Corporation (the Corporation) and its management may make certain statements that constitute “forward-looking statements” within the meaning of the Private Securities Litigation Reform Act of 1995. These statements can be identified by the fact that they do not relate strictly to historical or current facts. Forward-looking statements often use words such as “anticipates,” “targets,” “expects,” “hopes,” “estimates,” “intends,” “plans,” “goals,” “outlook,” “believes,” “continue” and other similar expressions or future or conditional verbs such as “will,” “may,” “might,” “should,” “would” and “could.” Forward-looking statements represent the Corporation’s current expectations, plans or forecasts of its or its business segments' future results, which may include, among other measures, revenue, liquidity, net interest income, net interest yield, other income, provision for credit losses, expenses, operating leverage, effective tax rate, efficiency ratio, capital measures, deposits and assets, as well as strategy, future business and economic conditions more generally, and other future matters. These statements are not guarantees of future results or performance and involve certain known and unknown risks, uncertainties and assumptions that are difficult to predict and are often beyond the Corporation’s control. Actual outcomes and results may differ materially from those expressed in, or implied by, any of these forward-looking statements. * Website content is not incorporated by reference into this press release. Reporters May Contact: Jocelyn Seidenfeld, Bank of America Phone: 1.646.743.3356 jocelyn.seidenfeld@bofa.com Tim Hurkmans, Bank of America Phone: 1.929.656.1718 tim.hurkmans@bofa.com
13 You should not place undue reliance on any forward-looking statement and should consider the following uncertainties and risks, as well as the risks and uncertainties more fully discussed under Item 1A. Risk Factors of the Corporation’s 2025 Annual Report on Form 10-K and in any of the Corporation’s subsequent U.S. Securities and Exchange Commission (SEC) filings: the Corporation’s potential judgments, orders, settlements, penalties, fines and reputational damage, which are inherently difficult to predict, including related to the adequacy of the Corporation's anti- money laundering and economic sanctions programs (including the consent orders associated therewith) and pending, threatened or future litigation and regulatory inquiries, demands, requests, investigations, proceedings and enforcement actions, which the Corporation is subject to in the ordinary course of business, including matters related to our processing of unemployment benefits for California and certain other states, the features of our automatic credit card payment service, and the processing of electronic payments, including through the Zelle network, and related fraud, which are in various stages; in connection with ongoing litigation, the impact of certain changes to Visa’s and Mastercard’s respective card payment network rules and reductions in interchange fees for U.S.-based merchants; the possibility that the Corporation's future liabilities may be in excess of its recorded liability and estimated range of possible loss for litigation, and regulatory and government actions; the impact of U.S. and global interest rates (including the potential for fluctuations in interest rates), inflation, currency exchange rates, economic conditions, trade policies and tensions, including changes in, or the imposition of, tariffs and / or trade barriers and the economic impacts, volatility and uncertainty resulting therefrom, which may have varying effects across industries and geographies, and geopolitical instability; uncertainties about the financial stability and growth rates of non-U.S. jurisdictions, the risk that those jurisdictions may face difficulties servicing their sovereign debt, and related stresses on financial markets, currencies and trade, and the Corporation’s exposures to such risks, including direct, indirect and operational; the impact of the interest rate, inflationary, macroeconomic, banking and regulatory environment on the Corporation’s assets, business, financial condition and results of operations; the impact of adverse developments affecting the U.S. or global banking industry, including a deterioration in private credit markets, bank failures and liquidity concerns, resulting in worsening economic and market volatility, and regulatory responses thereto; the possibility that future credit losses may be higher than currently expected, including due to changes in economic assumptions, which may include unemployment rates, real estate prices, gross domestic product levels and corporate bond spreads, customer behavior, adverse developments with respect to U.S. or global economic conditions and other uncertainties, such as the impact of trade policies, supply chain disruptions, commodity prices, inflationary pressures and labor shortages on economic conditions and our business; potential losses related to the Corporation’s concentration of credit risk; the Corporation's ability to achieve its expense targets (including noninterest expense) and expectations regarding revenue, net interest income, operating leverage, other income, provision for credit losses, net charge-offs, effective tax rate, loan or deposit growth or other projections and targets; variances to the underlying assumptions and judgments used in estimating banking book net interest income sensitivity; adverse changes to the Corporation’s credit ratings from the major credit rating agencies; an inability to access capital markets or maintain deposits or borrowing costs; estimates of the fair value and other accounting values, subject to impairment assessments, of certain of the Corporation’s assets and liabilities; the estimated or actual impact of changes in accounting standards or assumptions in applying those standards; uncertainty regarding the content, timing and impact of regulatory capital and liquidity requirements; the impact of adverse changes to total loss-absorbing capacity requirements, stress capital buffer requirements and / or global systemically important bank surcharges; the potential impact of actions of the Board of Governors of the Federal Reserve System on the Corporation’s capital plans; the effect of changes in or interpretations of income tax laws and regulations, including impacts from the 2025 Budget Reconciliation Act; the impact of implementation and compliance with U.S. and international laws, regulations and regulatory interpretations, including recovery and resolution planning requirements, Federal Deposit Insurance Corporation assessments, fiduciary standards, derivatives regulations and potential changes to loss allocations between financial institutions and customers, including for losses incurred from the use of our products and services, including electronic payments and payment of checks, that were authorized by the customer but induced by fraud; the impact of failures or disruptions in or breaches of the Corporation’s operations or information systems, or those of various third parties, including regulators and federal and state governments, such as from cybersecurity incidents; the risks related to the development, implementation, use and management of emerging technologies, including artificial intelligence and the ability to achieve expected or potential benefits, such as increased productivity, profitability and cost savings; the risks related to the transition and physical impacts of climate change; our ability to achieve environmental goals or the impact of any changes in the Corporation's sustainability or human capital management strategy or goals; the impact of uncertain or changing political conditions, federal government shutdowns, including partial shutdowns, and uncertainty regarding the federal government’s debt limit or changes in fiscal, monetary, trade or regulatory policy; the emergence of widespread health emergencies or pandemics; the impact of natural disasters, extreme weather events, military conflicts (including the Russia / Ukraine conflict, the conflicts in the Middle East, the possible expansion of such conflicts and potential geopolitical and economic consequences), civil unrest, terrorism or other geopolitical events; and other matters. Forward-looking statements speak only as of the date they are made, and the Corporation undertakes no obligation to update any forward-looking statement to reflect the impact of circumstances or events that arise after the date the forward-looking statement was made. “Bank of America” and “BofA Securities” are the marketing names used by the Global Banking and Global Markets divisions of Bank of America Corporation. Lending, other commercial banking activities, and trading in certain financial instruments are performed globally by banking affiliates of Bank of America Corporation, including Bank of America, N.A., Member FDIC. Trading in securities and financial instruments, and strategic advisory, and other investment banking activities, are performed globally by investment banking affiliates of Bank of America Corporation (“Investment Banking Affiliates”) or other affiliates, including, in the United States, BofA Securities, Inc. and Merrill Lynch, Pierce, Fenner & Smith Incorporated, each of which are registered broker-dealers and Members of SIPC, and, in other jurisdictions, by locally registered entities. BofA Securities, Inc. is registered as a futures commission merchant with the CFTC and is a member of the NFA. Investment products offered by Investment Banking Affiliates: Are Not FDIC Insured · May Lose Value · Are Not Bank Guaranteed. Bank of America Corporation’s broker-dealers are not banks and are separate legal entities from their bank affiliates. The obligations of the broker-dealers are not obligations of their bank affiliates (unless explicitly stated otherwise), and these bank affiliates are not responsible for securities sold, offered, or recommended by the broker-dealers. The foregoing also applies to other non-bank affiliates. For more Bank of America news, including dividend announcements and other important information, visit the Bank of America newsroom at https://newsroom.bankofamerica.com.* www.bankofamerica.com* * Website content is not incorporated by reference into this press release.
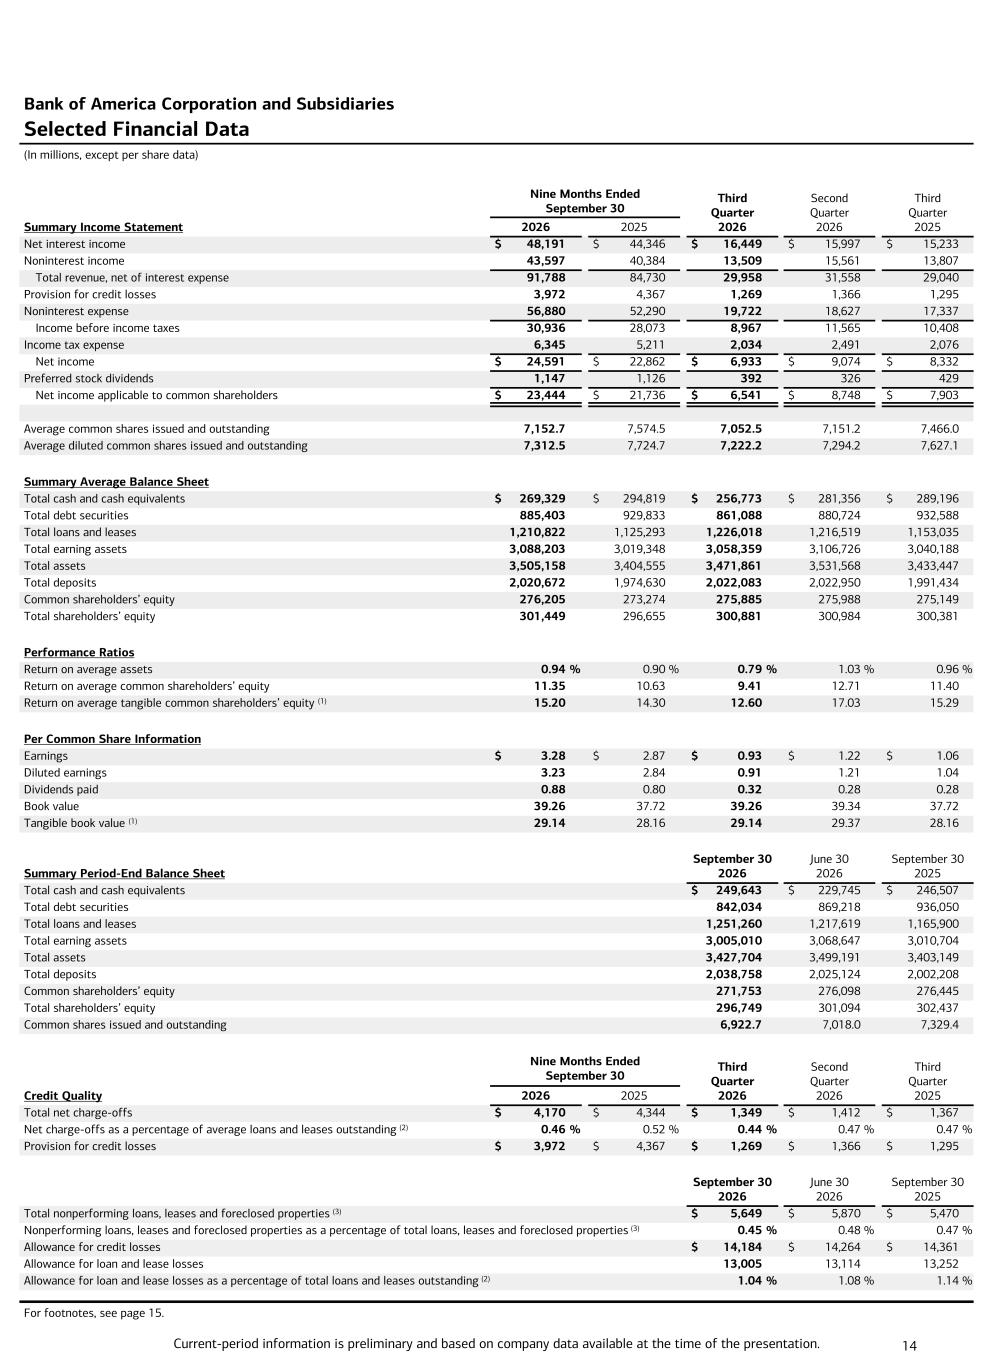
Current-period information is preliminary and based on company data available at the time of the presentation. 14 Bank of America Corporation and Subsidiaries Selected Financial Data (In millions, except per share data) Nine Months Ended September 30 Third Quarter 2026 Second Quarter 2026 Third Quarter 2025Summary Income Statement 2026 2025 Net interest income $ 48,191 $ 44,346 $ 16,449 $ 15,997 $ 15,233 Noninterest income 43,597 40,384 13,509 15,561 13,807 Total revenue, net of interest expense 91,788 84,730 29,958 31,558 29,040 Provision for credit losses 3,972 4,367 1,269 1,366 1,295 Noninterest expense 56,880 52,290 19,722 18,627 17,337 Income before income taxes 30,936 28,073 8,967 11,565 10,408 Income tax expense 6,345 5,211 2,034 2,491 2,076 Net income $ 24,591 $ 22,862 $ 6,933 $ 9,074 $ 8,332 Preferred stock dividends 1,147 1,126 392 326 429 Net income applicable to common shareholders $ 23,444 $ 21,736 $ 6,541 $ 8,748 $ 7,903 Average common shares issued and outstanding 7,152.7 7,574.5 7,052.5 7,151.2 7,466.0 Average diluted common shares issued and outstanding 7,312.5 7,724.7 7,222.2 7,294.2 7,627.1 Summary Average Balance Sheet Total cash and cash equivalents $ 269,329 $ 294,819 $ 256,773 $ 281,356 $ 289,196 Total debt securities 885,403 929,833 861,088 880,724 932,588 Total loans and leases 1,210,822 1,125,293 1,226,018 1,216,519 1,153,035 Total earning assets 3,088,203 3,019,348 3,058,359 3,106,726 3,040,188 Total assets 3,505,158 3,404,555 3,471,861 3,531,568 3,433,447 Total deposits 2,020,672 1,974,630 2,022,083 2,022,950 1,991,434 Common shareholders’ equity 276,205 273,274 275,885 275,988 275,149 Total shareholders’ equity 301,449 296,655 300,881 300,984 300,381 Performance Ratios Return on average assets 0.94 % 0.90 % 0.79 % 1.03 % 0.96 % Return on average common shareholders’ equity 11.35 10.63 9.41 12.71 11.40 Return on average tangible common shareholders’ equity (1) 15.20 14.30 12.60 17.03 15.29 Per Common Share Information Earnings $ 3.28 $ 2.87 $ 0.93 $ 1.22 $ 1.06 Diluted earnings 3.23 2.84 0.91 1.21 1.04 Dividends paid 0.88 0.80 0.32 0.28 0.28 Book value 39.26 37.72 39.26 39.34 37.72 Tangible book value (1) 29.14 28.16 29.14 29.37 28.16 Summary Period-End Balance Sheet September 30 2026 June 30 2026 September 30 2025 Total cash and cash equivalents $ 249,643 $ 229,745 $ 246,507 Total debt securities 842,034 869,218 936,050 Total loans and leases 1,251,260 1,217,619 1,165,900 Total earning assets 3,005,010 3,068,647 3,010,704 Total assets 3,427,704 3,499,191 3,403,149 Total deposits 2,038,758 2,025,124 2,002,208 Common shareholders’ equity 271,753 276,098 276,445 Total shareholders’ equity 296,749 301,094 302,437 Common shares issued and outstanding 6,922.7 7,018.0 7,329.4 Nine Months Ended September 30 Third Quarter 2026 Second Quarter 2026 Third Quarter 2025Credit Quality 2026 2025 Total net charge-offs $ 4,170 $ 4,344 $ 1,349 $ 1,412 $ 1,367 Net charge-offs as a percentage of average loans and leases outstanding (2) 0.46 % 0.52 % 0.44 % 0.47 % 0.47 % Provision for credit losses $ 3,972 $ 4,367 $ 1,269 $ 1,366 $ 1,295 September 30 2026 June 30 2026 September 30 2025 Total nonperforming loans, leases and foreclosed properties (3) $ 5,649 $ 5,870 $ 5,470 Nonperforming loans, leases and foreclosed properties as a percentage of total loans, leases and foreclosed properties (3) 0.45 % 0.48 % 0.47 % Allowance for credit losses $ 14,184 $ 14,264 $ 14,361 Allowance for loan and lease losses 13,005 13,114 13,252 Allowance for loan and lease losses as a percentage of total loans and leases outstanding (2) 1.04 % 1.08 % 1.14 % For footnotes, see page 15.
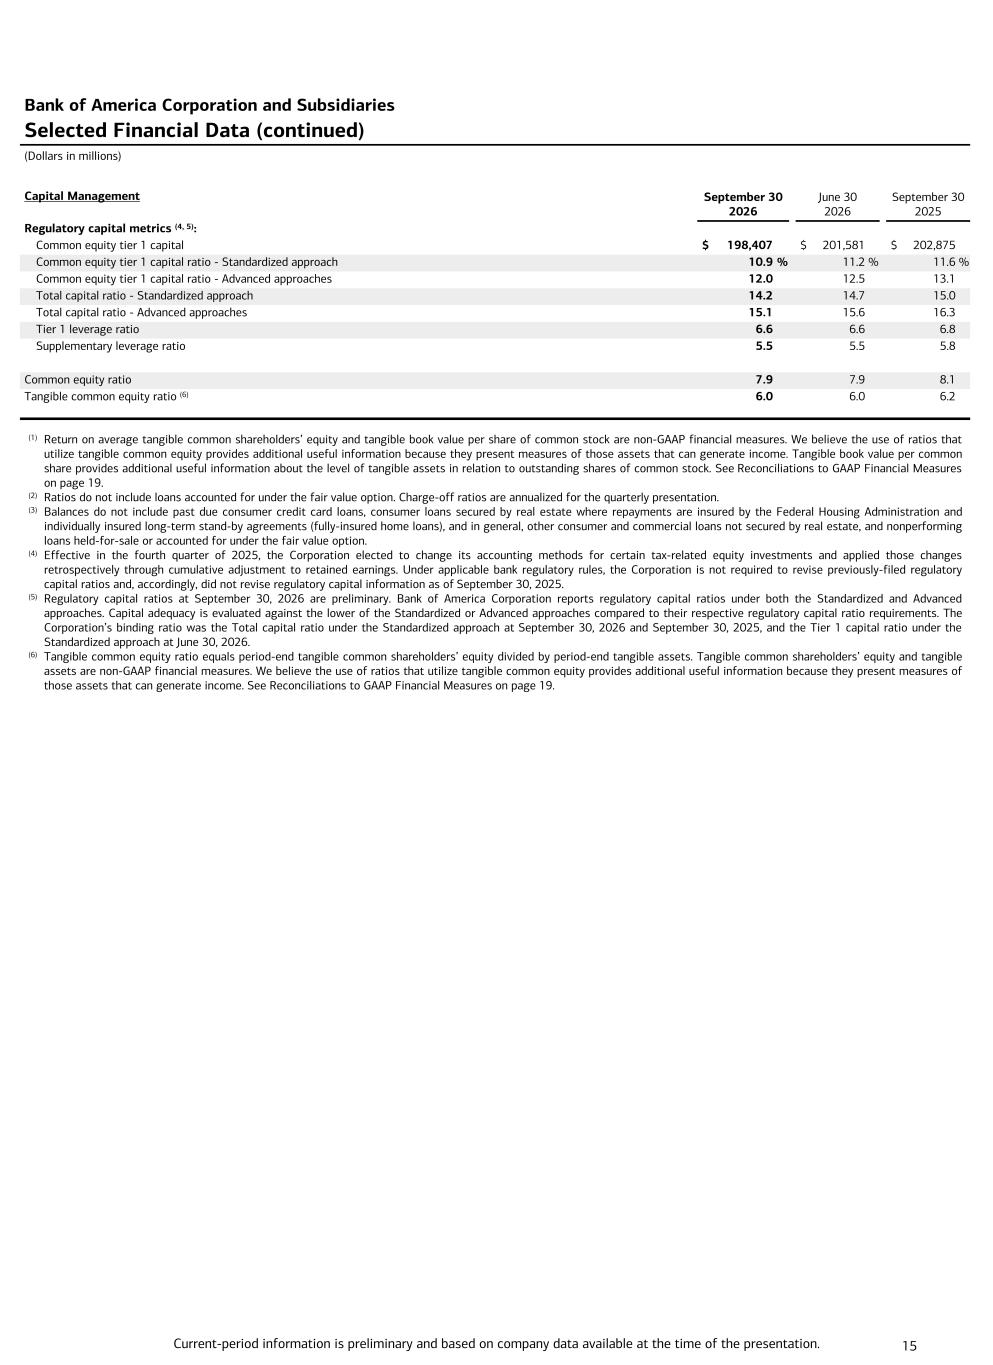
Current-period information is preliminary and based on company data available at the time of the presentation. 15 Bank of America Corporation and Subsidiaries Selected Financial Data (continued) (Dollars in millions) Capital Management September 30 2026 June 30 2026 September 30 2025 Regulatory capital metrics (4, 5): Common equity tier 1 capital $ 198,407 $ 201,581 $ 202,875 Common equity tier 1 capital ratio - Standardized approach 10.9 % 11.2 % 11.6 % Common equity tier 1 capital ratio - Advanced approaches 12.0 12.5 13.1 Total capital ratio - Standardized approach 14.2 14.7 15.0 Total capital ratio - Advanced approaches 15.1 15.6 16.3 Tier 1 leverage ratio 6.6 6.6 6.8 Supplementary leverage ratio 5.5 5.5 5.8 Common equity ratio 7.9 7.9 8.1 Tangible common equity ratio (6) 6.0 6.0 6.2 (1) Return on average tangible common shareholders’ equity and tangible book value per share of common stock are non-GAAP financial measures. We believe the use of ratios that utilize tangible common equity provides additional useful information because they present measures of those assets that can generate income. Tangible book value per common share provides additional useful information about the level of tangible assets in relation to outstanding shares of common stock. See Reconciliations to GAAP Financial Measures on page 19. (2) Ratios do not include loans accounted for under the fair value option. Charge-off ratios are annualized for the quarterly presentation. (3) Balances do not include past due consumer credit card loans, consumer loans secured by real estate where repayments are insured by the Federal Housing Administration and individually insured long-term stand-by agreements (fully-insured home loans), and in general, other consumer and commercial loans not secured by real estate, and nonperforming loans held-for-sale or accounted for under the fair value option. (4) Effective in the fourth quarter of 2025, the Corporation elected to change its accounting methods for certain tax-related equity investments and applied those changes retrospectively through cumulative adjustment to retained earnings. Under applicable bank regulatory rules, the Corporation is not required to revise previously-filed regulatory capital ratios and, accordingly, did not revise regulatory capital information as of September 30, 2025. (5) Regulatory capital ratios at September 30, 2026 are preliminary. Bank of America Corporation reports regulatory capital ratios under both the Standardized and Advanced approaches. Capital adequacy is evaluated against the lower of the Standardized or Advanced approaches compared to their respective regulatory capital ratio requirements. The Corporation’s binding ratio was the Total capital ratio under the Standardized approach at September 30, 2026 and September 30, 2025, and the Tier 1 capital ratio under the Standardized approach at June 30, 2026. (6) Tangible common equity ratio equals period-end tangible common shareholders’ equity divided by period-end tangible assets. Tangible common shareholders’ equity and tangible assets are non-GAAP financial measures. We believe the use of ratios that utilize tangible common equity provides additional useful information because they present measures of those assets that can generate income. See Reconciliations to GAAP Financial Measures on page 19.
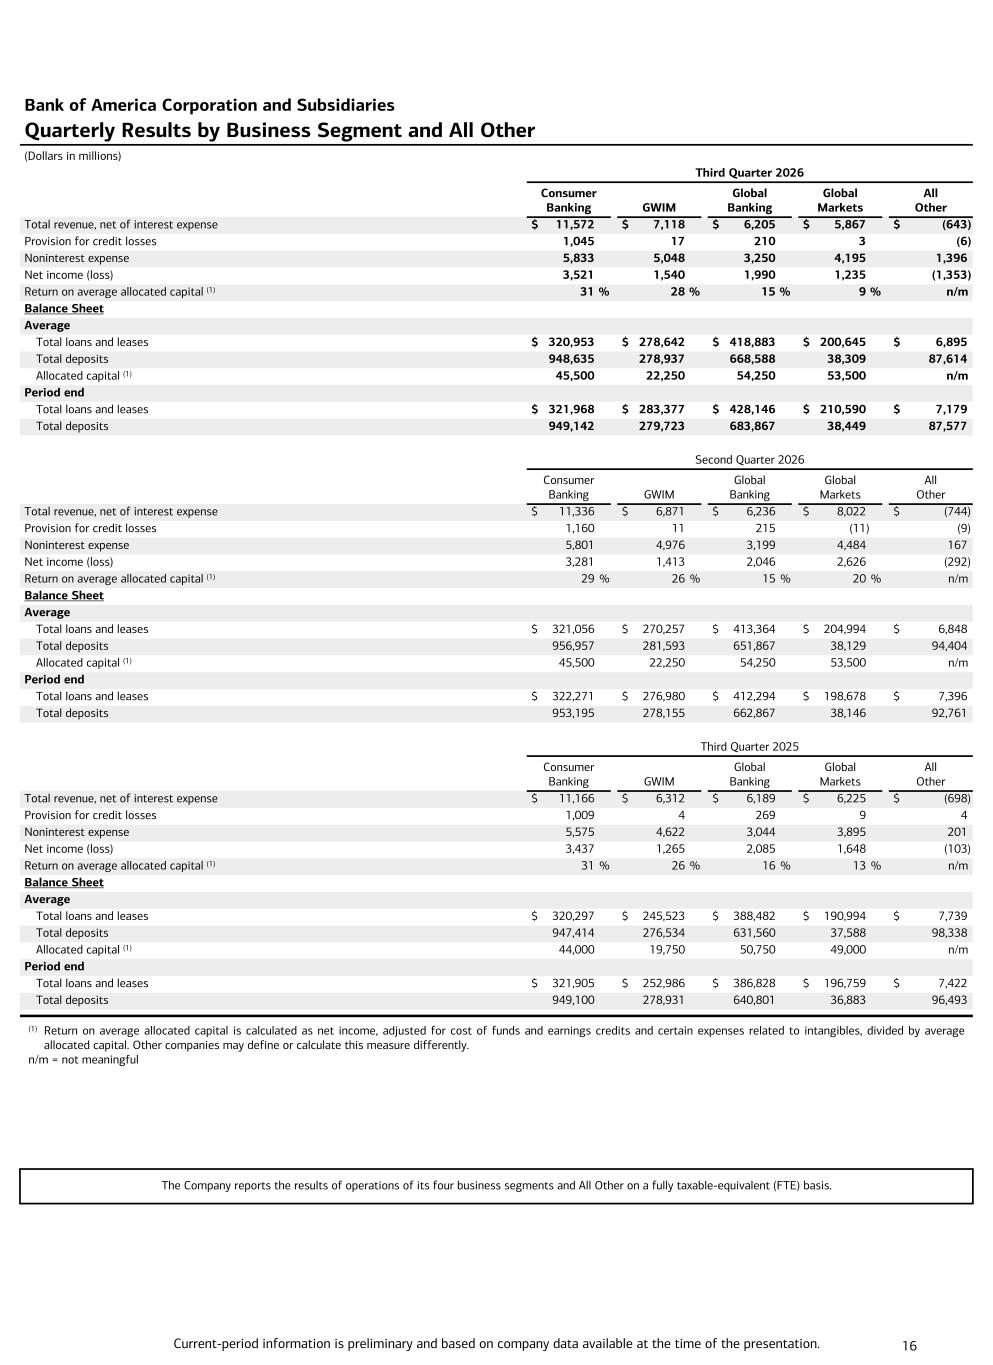
Current-period information is preliminary and based on company data available at the time of the presentation. 16 Bank of America Corporation and Subsidiaries Quarterly Results by Business Segment and All Other (Dollars in millions) Third Quarter 2026 Consumer Banking GWIM Global Banking Global Markets All Other Total revenue, net of interest expense $ 11,572 $ 7,118 $ 6,205 $ 5,867 $ (643) Provision for credit losses 1,045 17 210 3 (6) Noninterest expense 5,833 5,048 3,250 4,195 1,396 Net income (loss) 3,521 1,540 1,990 1,235 (1,353) Return on average allocated capital (1) 31 % 28 % 15 % 9 % n/m Balance Sheet Average Total loans and leases $ 320,953 $ 278,642 $ 418,883 $ 200,645 $ 6,895 Total deposits 948,635 278,937 668,588 38,309 87,614 Allocated capital (1) 45,500 22,250 54,250 53,500 n/m Period end Total loans and leases $ 321,968 $ 283,377 $ 428,146 $ 210,590 $ 7,179 Total deposits 949,142 279,723 683,867 38,449 87,577 Second Quarter 2026 Consumer Banking GWIM Global Banking Global Markets All Other Total revenue, net of interest expense $ 11,336 $ 6,871 $ 6,236 $ 8,022 $ (744) Provision for credit losses 1,160 11 215 (11) (9) Noninterest expense 5,801 4,976 3,199 4,484 167 Net income (loss) 3,281 1,413 2,046 2,626 (292) Return on average allocated capital (1) 29 % 26 % 15 % 20 % n/m Balance Sheet Average Total loans and leases $ 321,056 $ 270,257 $ 413,364 $ 204,994 $ 6,848 Total deposits 956,957 281,593 651,867 38,129 94,404 Allocated capital (1) 45,500 22,250 54,250 53,500 n/m Period end Total loans and leases $ 322,271 $ 276,980 $ 412,294 $ 198,678 $ 7,396 Total deposits 953,195 278,155 662,867 38,146 92,761 Third Quarter 2025 Consumer Banking GWIM Global Banking Global Markets All Other Total revenue, net of interest expense $ 11,166 $ 6,312 $ 6,189 $ 6,225 $ (698) Provision for credit losses 1,009 4 269 9 4 Noninterest expense 5,575 4,622 3,044 3,895 201 Net income (loss) 3,437 1,265 2,085 1,648 (103) Return on average allocated capital (1) 31 % 26 % 16 % 13 % n/m Balance Sheet Average Total loans and leases $ 320,297 $ 245,523 $ 388,482 $ 190,994 $ 7,739 Total deposits 947,414 276,534 631,560 37,588 98,338 Allocated capital (1) 44,000 19,750 50,750 49,000 n/m Period end Total loans and leases $ 321,905 $ 252,986 $ 386,828 $ 196,759 $ 7,422 Total deposits 949,100 278,931 640,801 36,883 96,493 (1) Return on average allocated capital is calculated as net income, adjusted for cost of funds and earnings credits and certain expenses related to intangibles, divided by average allocated capital. Other companies may define or calculate this measure differently. n/m = not meaningful The Company reports the results of operations of its four business segments and All Other on a fully taxable-equivalent (FTE) basis.
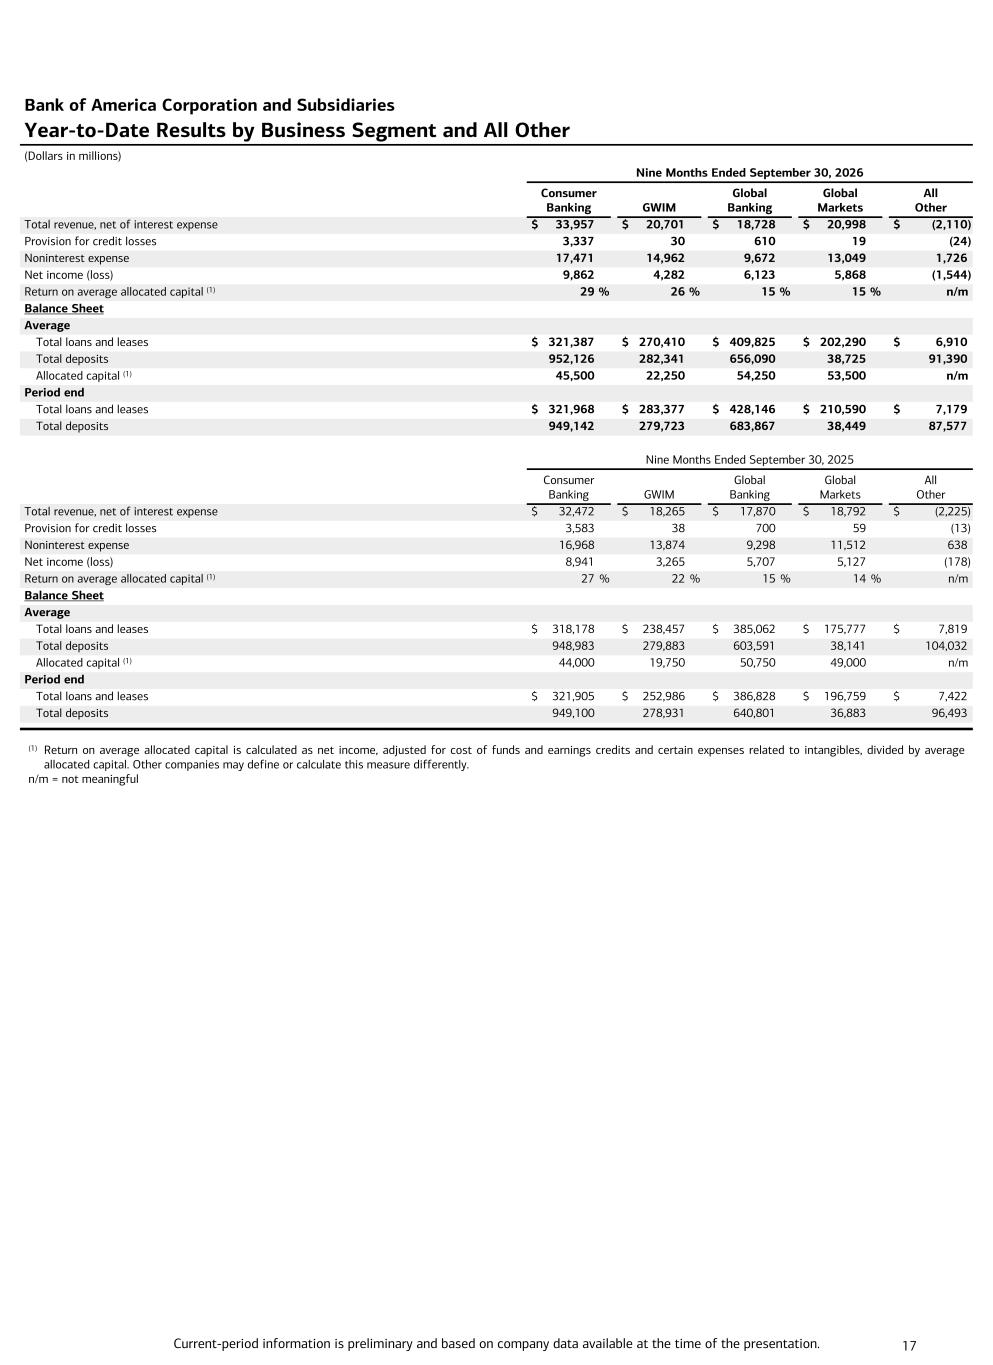
Current-period information is preliminary and based on company data available at the time of the presentation. 17 Bank of America Corporation and Subsidiaries Year-to-Date Results by Business Segment and All Other (Dollars in millions) Nine Months Ended September 30, 2026 Consumer Banking GWIM Global Banking Global Markets All Other Total revenue, net of interest expense $ 33,957 $ 20,701 $ 18,728 $ 20,998 $ (2,110) Provision for credit losses 3,337 30 610 19 (24) Noninterest expense 17,471 14,962 9,672 13,049 1,726 Net income (loss) 9,862 4,282 6,123 5,868 (1,544) Return on average allocated capital (1) 29 % 26 % 15 % 15 % n/m Balance Sheet Average Total loans and leases $ 321,387 $ 270,410 $ 409,825 $ 202,290 $ 6,910 Total deposits 952,126 282,341 656,090 38,725 91,390 Allocated capital (1) 45,500 22,250 54,250 53,500 n/m Period end Total loans and leases $ 321,968 $ 283,377 $ 428,146 $ 210,590 $ 7,179 Total deposits 949,142 279,723 683,867 38,449 87,577 Nine Months Ended September 30, 2025 Consumer Banking GWIM Global Banking Global Markets All Other Total revenue, net of interest expense $ 32,472 $ 18,265 $ 17,870 $ 18,792 $ (2,225) Provision for credit losses 3,583 38 700 59 (13) Noninterest expense 16,968 13,874 9,298 11,512 638 Net income (loss) 8,941 3,265 5,707 5,127 (178) Return on average allocated capital (1) 27 % 22 % 15 % 14 % n/m Balance Sheet Average Total loans and leases $ 318,178 $ 238,457 $ 385,062 $ 175,777 $ 7,819 Total deposits 948,983 279,883 603,591 38,141 104,032 Allocated capital (1) 44,000 19,750 50,750 49,000 n/m Period end Total loans and leases $ 321,905 $ 252,986 $ 386,828 $ 196,759 $ 7,422 Total deposits 949,100 278,931 640,801 36,883 96,493 (1) Return on average allocated capital is calculated as net income, adjusted for cost of funds and earnings credits and certain expenses related to intangibles, divided by average allocated capital. Other companies may define or calculate this measure differently. n/m = not meaningful
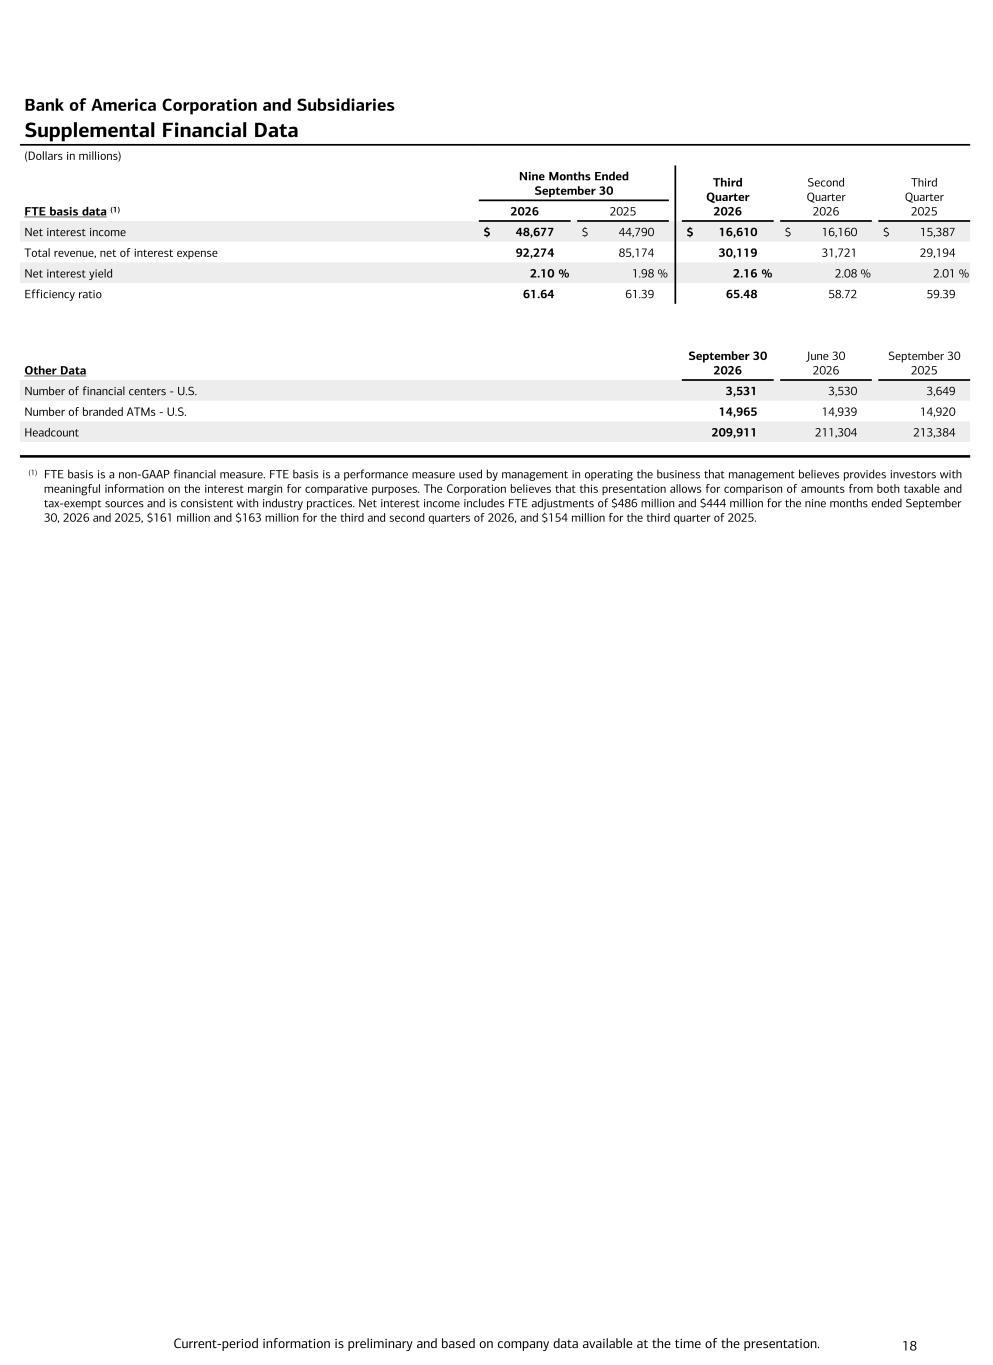
Current-period information is preliminary and based on company data available at the time of the presentation. 18 Bank of America Corporation and Subsidiaries Supplemental Financial Data (Dollars in millions) Nine Months Ended September 30 Third Quarter 2026 Second Quarter 2026 Third Quarter 2025FTE basis data (1) 2026 2025 Net interest income $ 48,677 $ 44,790 $ 16,610 $ 16,160 $ 15,387 Total revenue, net of interest expense 92,274 85,174 30,119 31,721 29,194 Net interest yield 2.10 % 1.98 % 2.16 % 2.08 % 2.01 % Efficiency ratio 61.64 61.39 65.48 58.72 59.39 Other Data September 30 2026 June 30 2026 September 30 2025 Number of financial centers - U.S. 3,531 3,530 3,649 Number of branded ATMs - U.S. 14,965 14,939 14,920 Headcount 209,911 211,304 213,384 (1) FTE basis is a non-GAAP financial measure. FTE basis is a performance measure used by management in operating the business that management believes provides investors with meaningful information on the interest margin for comparative purposes. The Corporation believes that this presentation allows for comparison of amounts from both taxable and tax-exempt sources and is consistent with industry practices. Net interest income includes FTE adjustments of $486 million and $444 million for the nine months ended September 30, 2026 and 2025, $161 million and $163 million for the third and second quarters of 2026, and $154 million for the third quarter of 2025.
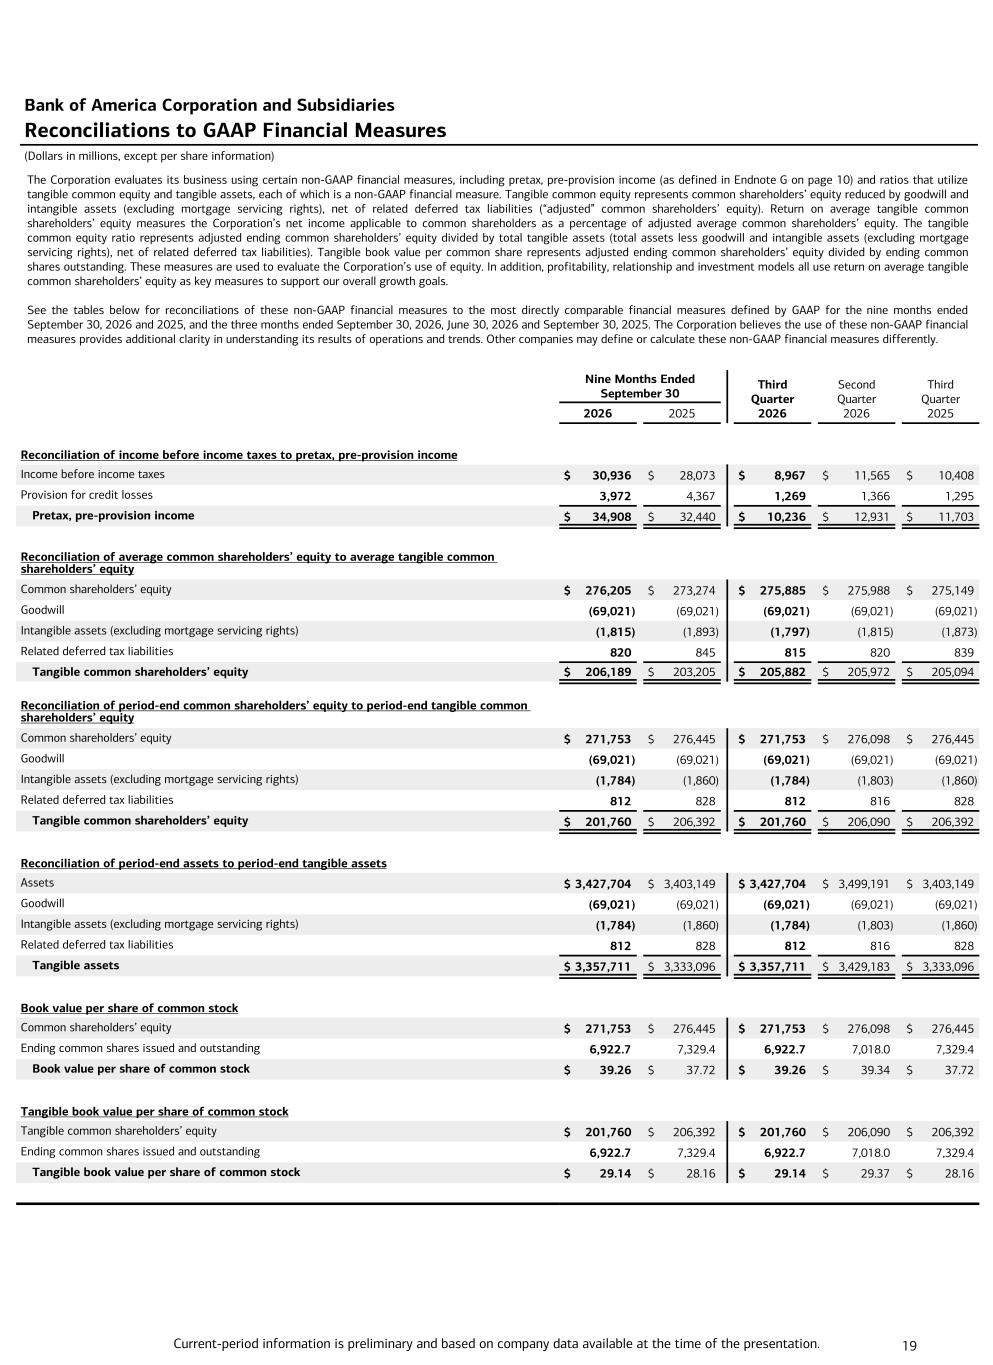
Current-period information is preliminary and based on company data available at the time of the presentation. 19 The Corporation evaluates its business using certain non-GAAP financial measures, including pretax, pre-provision income (as defined in Endnote G on page 10) and ratios that utilize tangible common equity and tangible assets, each of which is a non-GAAP financial measure. Tangible common equity represents common shareholders’ equity reduced by goodwill and intangible assets (excluding mortgage servicing rights), net of related deferred tax liabilities (“adjusted” common shareholders’ equity). Return on average tangible common shareholders’ equity measures the Corporation’s net income applicable to common shareholders as a percentage of adjusted average common shareholders’ equity. The tangible common equity ratio represents adjusted ending common shareholders’ equity divided by total tangible assets (total assets less goodwill and intangible assets (excluding mortgage servicing rights), net of related deferred tax liabilities). Tangible book value per common share represents adjusted ending common shareholders’ equity divided by ending common shares outstanding. These measures are used to evaluate the Corporation’s use of equity. In addition, profitability, relationship and investment models all use return on average tangible common shareholders’ equity as key measures to support our overall growth goals. See the tables below for reconciliations of these non-GAAP financial measures to the most directly comparable financial measures defined by GAAP for the nine months ended September 30, 2026 and 2025, and the three months ended September 30, 2026, June 30, 2026 and September 30, 2025. The Corporation believes the use of these non-GAAP financial measures provides additional clarity in understanding its results of operations and trends. Other companies may define or calculate these non-GAAP financial measures differently. Bank of America Corporation and Subsidiaries Reconciliations to GAAP Financial Measures (Dollars in millions, except per share information) Nine Months Ended September 30 Third Quarter 2026 Second Quarter 2026 Third Quarter 2025 2026 2025 Reconciliation of income before income taxes to pretax, pre-provision income Income before income taxes $ 30,936 $ 28,073 $ 8,967 $ 11,565 $ 10,408 Provision for credit losses 3,972 4,367 1,269 1,366 1,295 Pretax, pre-provision income $ 34,908 $ 32,440 $ 10,236 $ 12,931 $ 11,703 Reconciliation of average common shareholders’ equity to average tangible common shareholders’ equity Common shareholders’ equity $ 276,205 $ 273,274 $ 275,885 $ 275,988 $ 275,149 Goodwill (69,021) (69,021) (69,021) (69,021) (69,021) Intangible assets (excluding mortgage servicing rights) (1,815) (1,893) (1,797) (1,815) (1,873) Related deferred tax liabilities 820 845 815 820 839 Tangible common shareholders’ equity $ 206,189 $ 203,205 $ 205,882 $ 205,972 $ 205,094 Reconciliation of period-end common shareholders’ equity to period-end tangible common shareholders’ equity Common shareholders’ equity $ 271,753 $ 276,445 $ 271,753 $ 276,098 $ 276,445 Goodwill (69,021) (69,021) (69,021) (69,021) (69,021) Intangible assets (excluding mortgage servicing rights) (1,784) (1,860) (1,784) (1,803) (1,860) Related deferred tax liabilities 812 828 812 816 828 Tangible common shareholders’ equity $ 201,760 $ 206,392 $ 201,760 $ 206,090 $ 206,392 Reconciliation of period-end assets to period-end tangible assets Assets $ 3,427,704 $ 3,403,149 $ 3,427,704 $ 3,499,191 $ 3,403,149 Goodwill (69,021) (69,021) (69,021) (69,021) (69,021) Intangible assets (excluding mortgage servicing rights) (1,784) (1,860) (1,784) (1,803) (1,860) Related deferred tax liabilities 812 828 812 816 828 Tangible assets $ 3,357,711 $ 3,333,096 $ 3,357,711 $ 3,429,183 $ 3,333,096 Book value per share of common stock Common shareholders’ equity $ 271,753 $ 276,445 $ 271,753 $ 276,098 $ 276,445 Ending common shares issued and outstanding 6,922.7 7,329.4 6,922.7 7,018.0 7,329.4 Book value per share of common stock $ 39.26 $ 37.72 $ 39.26 $ 39.34 $ 37.72 Tangible book value per share of common stock Tangible common shareholders’ equity $ 201,760 $ 206,392 $ 201,760 $ 206,090 $ 206,392 Ending common shares issued and outstanding 6,922.7 7,329.4 6,922.7 7,018.0 7,329.4 Tangible book value per share of common stock $ 29.14 $ 28.16 $ 29.14 $ 29.37 $ 28.16